Article

Succinic Production from Source-Separated Kitchen Biowaste in a Biorefinery Concept: Focusing on Alternative Carbon Dioxide Source for Fermentation Processes

by
Mariusz Kuglarz
1,* and
Irini Angelidaki
2
1
Faculty of Materials, Civil and Environmental Engineering, University of Bielsko-Biala, Willowa 2, 43-309 Bielsko-Biala, Poland
2
Department of Chemical and Biochemical Engineering, Technical University of Denmark, Soltofts Plads, 228 A, DK-2800 Kgs. Lyngby, Denmark
*
Author to whom correspondence should be addressed.
Fermentation 2023, 9(3), 259; https://doi.org/10.3390/fermentation9030259
Submission received: 6 December 2022 / Revised: 28 February 2023 / Accepted: 3 March 2023 / Published: 6 March 2023
(This article belongs to the Section Industrial Fermentation)

Abstract

:
This study presents sustainable succinic acid production from the organic fraction of household kitchen wastes, i.e., the organic fraction of household kitchen waste (OFHKW), pretreated with enzymatic hydrolysis (100% cocktail dosage: 62.5% Cellic® CTec2, 31%% β-Glucanase and 6.5% Cellic ® HTec2, cellulase activity of 12.5 FPU/g-glucan). For fermentation, A. succinogenes was used, which consumes CO2 during the process. OFHKW at biomass loading > 20% (dry matter) resulted in a final concentration of fermentable sugars 81–85 g/L and can be treated as a promising feedstock for succinic production. Obtained results state that simultaneous addition of gaseous CO2 and MgCO3 (>20 g/dm3) resulted in the highest sugar conversion (79–81%) and succinic yields (74–75%). Additionally, CH4 content in biogas, used as a CO2 source, increased by 21–22% and reached 91–92% vol. Liquid fraction of source-separated kitchen biowaste and the residue after succinic fermentation were successfully converted into biogas. Results obtained in this study clearly document the possibility of integrated valuable compounds (succinic acid) and energy (biogas) production from the organic fraction of household kitchen wastes (OFHKW).

1. Introduction

Bio-based production of succinic acid through microbial fermentation is currently considered as very attractive due to the fact that it can contribute to the abatement of CO2 emissions, as this gas is consumed during succinic fermentation [1,2]. Among a number of bacterial strains able to generate succinic acid through anaerobic fermentation, Actinobacillus succinogenes is considered as one of the most promising for industrial applications, mainly due to its ability to ferment a wide range of carbon sources, i.e., glucose, xylose, arabinose, galactose, etc. [3,4]. Taking into account the fact that carbon dioxide is consumed during sugar conversion into succinic acid via Actinobacillus succinogenes, CO2 supply is a crucial factor determining succinic yield, the ratio of succinic acid to other by-products and to the degree of sugar utilization [5,6,7].
Different types of biomasses have been tested as feedstock for microbial succinic production, which mostly include hydrolysed lignocellulosic biomass, e.g., hemp biomass, agricultural residues, wheat and rapeseed straw, as well as wastes (e.g., from food processing industry, e.g., rapeseed meal, citrus peel waste) and algae biomass [2]. Municipal biowastes (organic fraction of household kitchen waste, i.e., OFHKW) have not been widely used as feedstock for succinic production, especially with Actinobacillus succinogenes, which can be used with biogas as a carbon dioxide source. OFHKW, composed mainly of disposed food residues, is a rich source of degradable carbohydrates (from 30 to even 60–70% w/w) and essential nutrients, including proteins (4–15% w/w), lipids (up to 10–15% w/w) and microelements (e.g., essential metals supporting bioconversion processes) [8,9]. It has been estimated that one-thirds to two-thirds of the annual food produced worldwide is not consumed and is disposed of as organic waste, with 88 million tons of food waste generated annually [10,11,12]. Source-separated municipal biowastes in the form of an organic fraction of household kitchen waste (OFHKW) can be a potential resource for the production of high-value compounds and biofuels. This includes the production of biogas, bioethanol, fatty acids, biopolymers, lactic acid and succinic acid [2,13,14,15,16]. Although the possibility of producing succinic acid (SA) from ruminal bacteria and food waste-related sources has been previously reported [2], integrating the SA production process with other value-added procedures such as biogas upgrading is appealing in terms of process effectiveness and economics. The proof of concept was previously studied by producing 14.4 g/L SA with a yield of 0.635 g/g of pure glucose together with a 35.4% (v/v) increase in methane content after 24 h of fermentation using A. succinogenes 130Z [4]. Later, through fermentation of hydrolysate after kitchen biowaste hydrolysis with Basfia succiniciproducens, succinic acid was produced in 0.46 and 0.25 g SA/g-glucose, using magnesium carbonate and raw biogas (including 40% of CO2), respectively. Batch fermentation in the bioreactor with biogas resulted in 8.0% (v/v) of CO2 decrease compared to raw biogas [8]. However, obtained effectiveness parameters [8] are significantly below the most optimal values obtained for feedstocks, such as mixed food waste, fruit and vegetables wastes, waste bread and bakery wastes (succinic yield: 0.67–1.18) [2].
This study presents sustainable succinic acid production from hydrolysed municipal biowastes (OFHKW), which are integrated with biogas production and purification. Succinic fermentation was carried out using A. succinogenes 130Z (ATCC 55618). The aim of this study was to analyse the influence of carbon dioxide (gaseous and solid MgCO3) on the effectiveness of succinic fermentation. To the best of our knowledge, this is the first study evaluating the usage of a simultaneous CO2 source (biogas after co-digestion processes and MgCO3) for the production of succinic acid from municipal biowastes (OFHKW), with integrated biogas production from by-products after succinic fermentation.

2. Materials and Methods

2.1. Feedstock

The OFHKW sample used in this study originated directly from biowaste bins locally provided in the municipality of Bielsko-Biala (south of Poland). The OFHKW mainly consisted of food waste. The OFHKW sample used in this study originated from biowaste bins locally provided in the municipality of Bielsko-Biala (south of Poland, about 170,000 inhabitants). The OFHKW mainly consisted of food waste and was collected at a municipality level once per week from 20 households. Samples were collected between June and October (about 10 kg each, 20 OFHKW collections) from locations evenly distributed throughout the city of Bielsko-Biala. Once collected, the biowaste was mixed manually, and a representative sample (about 1 kg from each collection) was stored in a refrigerator at −4 °C. The sample used for enzymatic hydrolysis contained an even quantitative share of OFKKW from each collection (April–October, 20 individual OFHKW samples, based on weekly collections). The obtained sample was homogenized and autoclaved at 121 °C for 1 h, before chemical characterization (Table 1) and enzymatic hydrolysis (Table 2). OFHKW was separated into solid (85% of total sample weight) and liquid fractions (15% of total sample weight) (Table 1) using a low speed centrifuge (Benchtop, CFG-5BL, 2000 rpm). The solid fraction was enzymatically hydrolysed and used as feedstock for biosuccinic production, using A. succinogenes 130Z whilst the liquid fraction was used as feedstock for biogas production. Characteristics of the municipal biowastes were analysed using the methods described below, and they are presented in Table 1.

2.2. Enzymatic Hydrolysis

In order to break down the OFHKW complex into monomeric fermentable sugars for succinogenic bacteria, the solid fraction of OFHKW was hydrolysed with an application of β-Glucanase (from Trichoderma longibrachiatum—a mixture of enzymes with mainly β-1-3 and β-1-4-glucanase, xylanase, and cellulase activities, 40 FPU/g, G4423, Sigma-Aldrich) as well as Cellic® CTec2 (120 FPU/g) and Cellic® HTec2 (25 FPU/g) enzymatic cocktails. Enzymatic cocktails were purchased from Sigma-Aldrich® (Poznań, Poland). Cellulase activity, expressed as filter paper unit (FPU) per gram of enzyme solution, was determined by the Ghose method, established by the International Union of Pure and Applied Chemistry (IUPAC) [17].
Enzymatic dosage amounted to 5% w/w, calculated in relation to the substrate dry matter content, i.e., 5 g of the enzyme cocktails/100 g of substrate (OFHKW) dry matter. Percentage of individual enzymatic components (Cellic® CTec2, β-Glucanase and Cellic ® Htec2) was calculated in relation to the total weight of the enzyme cocktail (100% enzymatic dosage represents, e.g., 5 g of the enzyme cocktails/100 g of OFHKW dry matter). The mixture of enzymatic cocktails used in this study (Table 2) contained: 62.5% Cellic® 103 Ctec2, 31%% β-Glucanase and 6.5% Cellic ® Htec2, expressed as total weight of enzymatic cocktails. For reactions carried out with enzyme concentrations of up to about 4% (w/w) (preliminary results, data not shown), the amount of catalysts in the glucan and xylan hydrolysis is the only limiting factor, i.e., reaction rates are dependent only upon the level of enzymes. For higher doses of Cellic CTec2/β-glucosidase, rates of both glucose as well as xylose release were not directly proportional to the amount of enzyme present in reaction mixture (the rates versus enzyme concentration response become nonlinear), most probably due to the saturation of substrate by enzymes [18]. Usage of enzyme concentrations above 5% (w/w) (>12.5 FPU/g-glucan) had no positive influence on the effectiveness of enzymatic hydrolysis. These enzymatic dosages correlated to between 0.3 and 1.25% of total sample volume (based results presented in Table 2) and cellulase activity of 12.5 FPU/g-glucan (10.5 FPU/g-carbohydrates or 4.5 FPU/g total biomass solids).
Hydrolysis was conducted at a solid loading of 6–25% in a 50 mM sodium citrate buffer, pH 5.4–5.5. Firstly, Erlenmeyer flasks (working volume of 100 cm3) at 50 °C for 24 h were used. This part of the experiment was conducted in order to determine the most optimal biomass loading during enzymatic hydrolysis (Table 2). Secondly, kitchen biowaste hydrolysis was performed in 3 identical flasks of 10 dm3 working volume at optimized conditions (wet substrate loading: 70% w/v, dry matter loading: 22%, Table 2). The aim of this part of the experiment was to prepare the required amount of hydrolysate for tests of succinic fermentation in bioreactors. Hydrolysates were filtered by sterile membrane filters (0.22 μm) and kept at 4 °C before further usage (fermentation tests).

2.3. Succinic Acid Fermentation in Bioreactors

Samples obtained after OFHKW hydrolysis, with biomass loading considered as the most optimal (Table 3), were used as feedstock for succinic acid production. Fermentation of hydrolysate was carried out in three identical 12 dm3 bioreactors (Germany) with working volume of 10 dm3. During start-up of the process, N2 gas was used to create anaerobic conditions in fermenters.
Prior to start of batch fermentation, pH was adjusted to 6.8, with 50% H3PO4 and 0.05 mL of sterile Antifoam 204 added. Before addition of feedstock via sterile membrane filters, serum flasks with medium solution were autoclaved at 120 °C for 20 min. The fermentation was conducted for samples without synthetic medium (nutrients) as well as for hydrolysate mixed with nutrients. In each case, about 5% (v/v) of exponentially growing inoculum (OD660 = 4.6–4.8) was added. The strain of A. succinogenes 130Z (DSM 22257) was obtained from DSMZ (German Collection of Microorganisms and Cell Cultures). Fermentation was conducted without minerals as well as with the following amounts of minerals: KH2PO4 (3 g/dm3), MgCl2 · 6H2O (0.2 g/dm3), CaCl2 (0.2 g/dm3), NaCl (1.0 g/dm3). In all fermentation assays, yeast extract (10 g/dm3) was used as nitrogen source for fermentation processes [19].
In case of pH decrease below 6.8 due to acid production and insufficient carbonate–bicarbonate buffering capacity, NaOH solution (8 M) was added. Solid MgCO3 (1.1 g MgCO3/g-sugar), biogas (containing 75% of CH4 and 25% of CO2) as well as mixtures of magnesium carbonate and biogas were used as carbon sources (Table 3). The biogas originated from our previous sewage sludge and kitchen biowaste co-digestion experiments, conducted at lab scale in thermophilic conditions (52 °C). The biogas sample was collected during fermentation of kitchen biowaste (60% dry matter of the feedstock) and sewage sludge (40% dry matter of the feedstock), at optimized conditions (HRT = 25 days). The biogas originated from our previous sewage sludge and kitchen biowaste co-digestion experiments. This part of the experiment was conducted using 6:1 gas–liquid ratio and atmospheric pressure (101.3 kPa). The biogas was recirculated during fermentation, and changes in CH4 and CO2 concentrations were recorded. In addition, 1 mL samples were taken periodically (after 0, 3, 6, 12, 15, 18, 24, 36 and 48 h) and used for analysis of sugars (glucose, xylose) and acids (succinic-, acetic- and formic). Succinic acid yield (YSA) was calculated as the amount of succinic acid (g/dm3) obtained per 1 g/dm3 of sugars consumed. Sugar utilization was calculated as the difference between initial sugar content (g/dm3) and sugar content after succinic acid production (g/dm3).

2.4. Anaerobic Digestion (AD)

Liquid fractions, originating from “OFHKW” as well as solid residues after enzymatic hydrolysis (post-hydrolysis residues), were tested as feedstock for methane production. Biochemical methane potential (BMP) tests were determined in batch experiments, in triplicates. The experiments were performed in 540 cm3 serum glass bottles with working volume of 250 mL, at 2 g VS/dm3.
Digestate from a full-scale plant (52 °C) treating manure and kitchen waste was used as inoculum. Methane produced from inoculum was subtracted from the assays. Bottles were flushed with pure N2 for 3–5 min, sealed with rubber stoppers and aluminium crimps and finally incubated at 52 °C until no significant amounts of CH4 were produced (approx. 30 days). Methane yields are expressed as m3 CH4/kg VSadded at standard temperature and pressure (0 °C, 100 kPa).

2.5. Calculations

2.5.1. Enzymatic Hydrolysis

Glucan and xylan yields during enzymatic hydrolysis were calculated according to Formulas (1) and (2):
Glucan Yield   ( % ) = Glucose Released Glucan Feedstock   ·   ( 180 162 ) · 100
Xylan Yield   ( % ) = Xylose Released Hemicellulose Feedstock   ·   ( 150 132 ) · 100
where:
GlucoseReleased and XyloseReleased—the amount of glucose and xylose released during enzymatic hydrolysis, g;
GlucanFeedstock—total amount of starch and cellulose-derived glucan in organic fraction of household kitchen waste, g;
HemicelluloseFeedstock—total amount of hemicellulose compounds in organic fraction of household kitchen waste, respectively, g;
180/162 and 150/132—stoichiometric conversion factors of glucan to glucose and hemicellulose to xylose, respectively.

2.5.2. Succinic Fermentation

Succinic acid yield (YSA) was calculated as the amount of succinic acid (g) obtained per 1 g of sugars (glucose + xylose) consumed (Equation (3)).
Y SA ( % ) = SA Prod . Sugar Consumed   · 100
where:
SAProd.—concentration of succinic acid produced (g/dm3);
SugarConsumed—amount of glucose and xylose consumed during succinic acid fermentation (g/dm3).

2.6. Analytical Methods

Total solids (TS), volatile solids (VS), and ash and nitrogen content were determined according to standards methods [20]. pH was measured using a standard pH meter (Aldrich® glass pH electrode, Z113077-1EA). The content of cellulose, hemicellulose and lignin in raw material as well as solid residues after enzymatic hydrolysis were determined according to the National Renewable Energy Laboratory (NREL) analytical methods for biomass characterization [21]. Concentrations of sugars and organic acids (succinic, acetic, formic) were measured by using high performance liquid chromatography HPLC (Agilent 1260 Infinity, Germany) equipped with a BioRad Aminex HPX-87H column at 63 °C and ultraviolet (UV) and refractive index (RI) detector (67162A, Germany), using 4 mM H2SO4 as eluent at 0.6 mL∙min−1 flow rate. To protect the HPX-87H column from contamination and foreign particles, a guard column was fitted to the system. Concentrations of (Ca, Mg, Na, S) as well as metals were analysed in a Vista-MPX inductively coupled plasma spectrometer with optical emission spectrometry, ICP-OES (Agilent, Santa Clara, CA, USA). Concentration of phosphates and ammonia–nitrogen was analysed by spectrophotometric method, using standard cuvette tests (HACH-LANGE). Lipid content was analysed after extraction using the Soxhlet method. VFAs were measured by gas chromatography (GC) with flame ionization detection (FID). Total organic carbon (TOC) was determined by titration method with potassium dichromate, after sample mineralization with sulfuric acid. Content of CH4 and CO2 in biogas before and after upgrading was analysed with application of gas chromatography (GC), Thermo Scientific with a TCD-detector and an HP-plot column.

3. Results and Discussion

3.1. Characterization of the Organic Fraction of Household Kitchen Waste (OFHKW)

The characterization of OFHKW used in this study is presented in Table 1. High organic content (VS/TS ratio of 93%, C5 and C6 sugars: 40–46% of TS) proves that OFHKW (organic fraction of household kitchen waste) can be treated as a promising substrate for succinogenic bacteria. Glucan content, which represents cellulose and starch, accounted for about 85% of all carbohydrates, whilst hemicellulose fraction was on average 15% of total carbohydrates (based on results in Table 1). This is in agreement with results obtained by [22]. This substrate also contains a high content of proteins, i.e., up to 10–12% of total solids, and is in the range found in food and bakery wastes [8].
It was also found that kitchen biowaste (OFHKW) contains an insignificant amount of heavy metals, whilst containing essential elements for microbial growth, including: magnesium, calcium, cobalt, and nickel (Table 1).

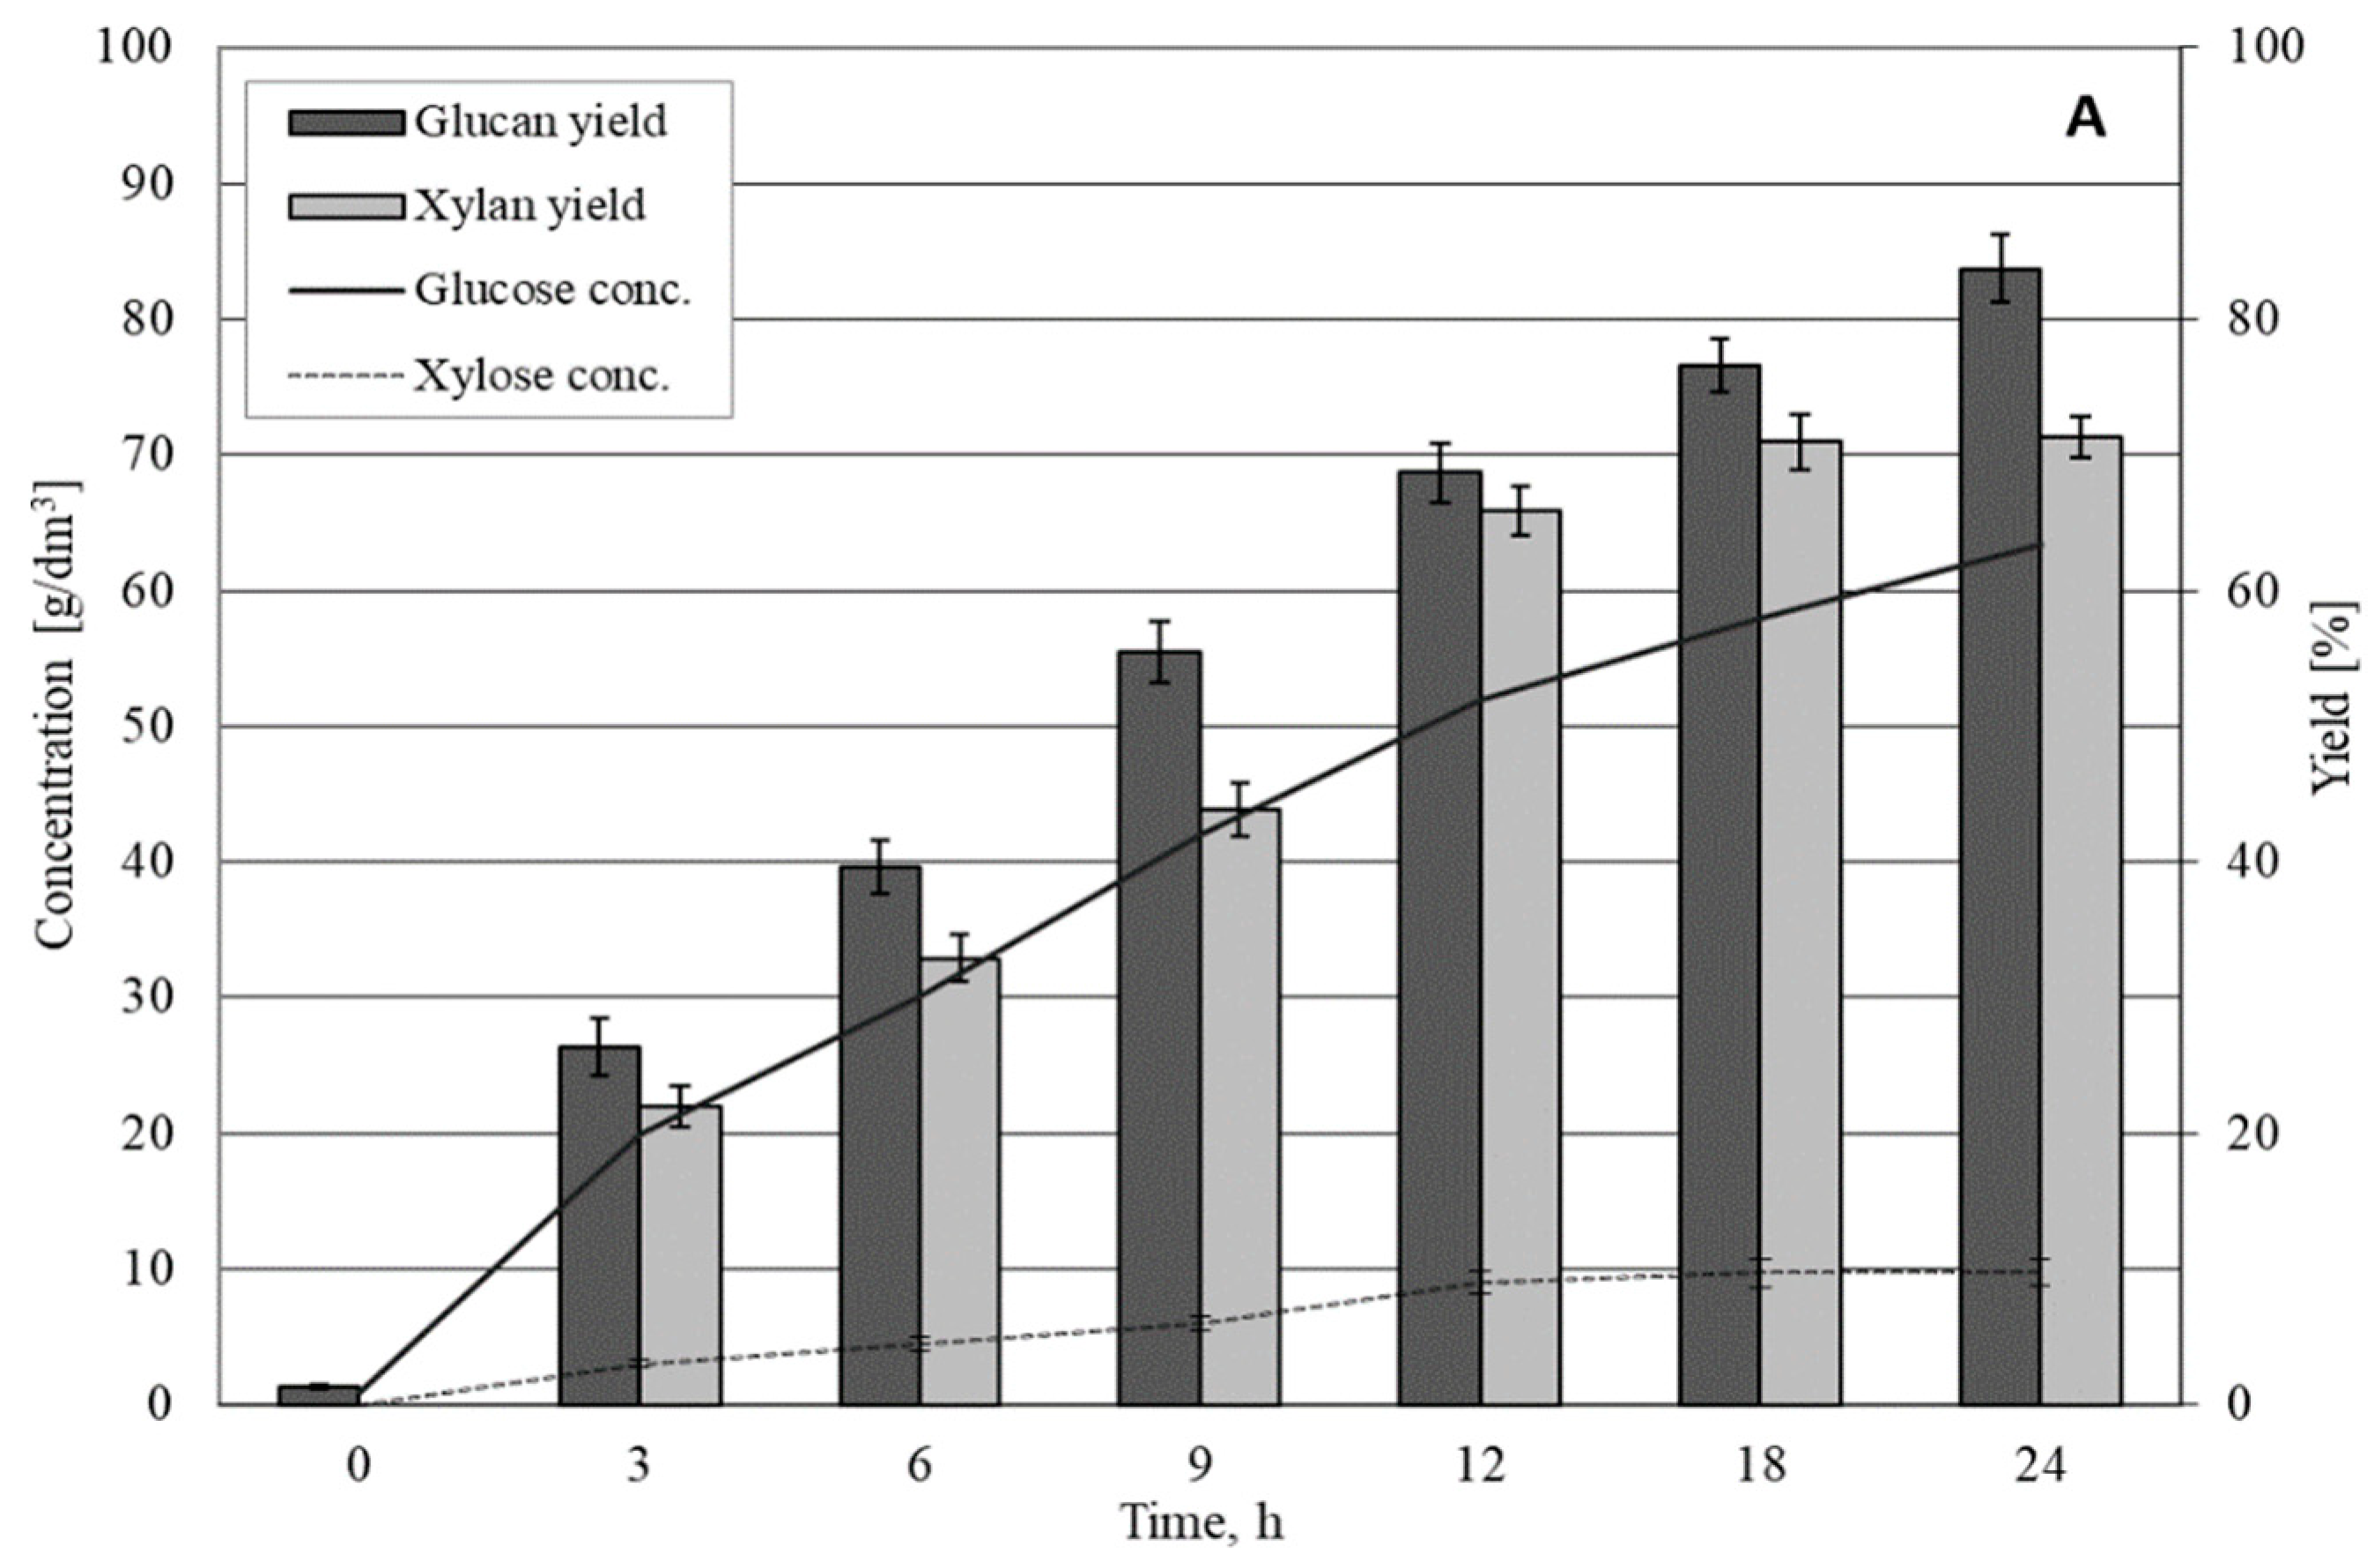
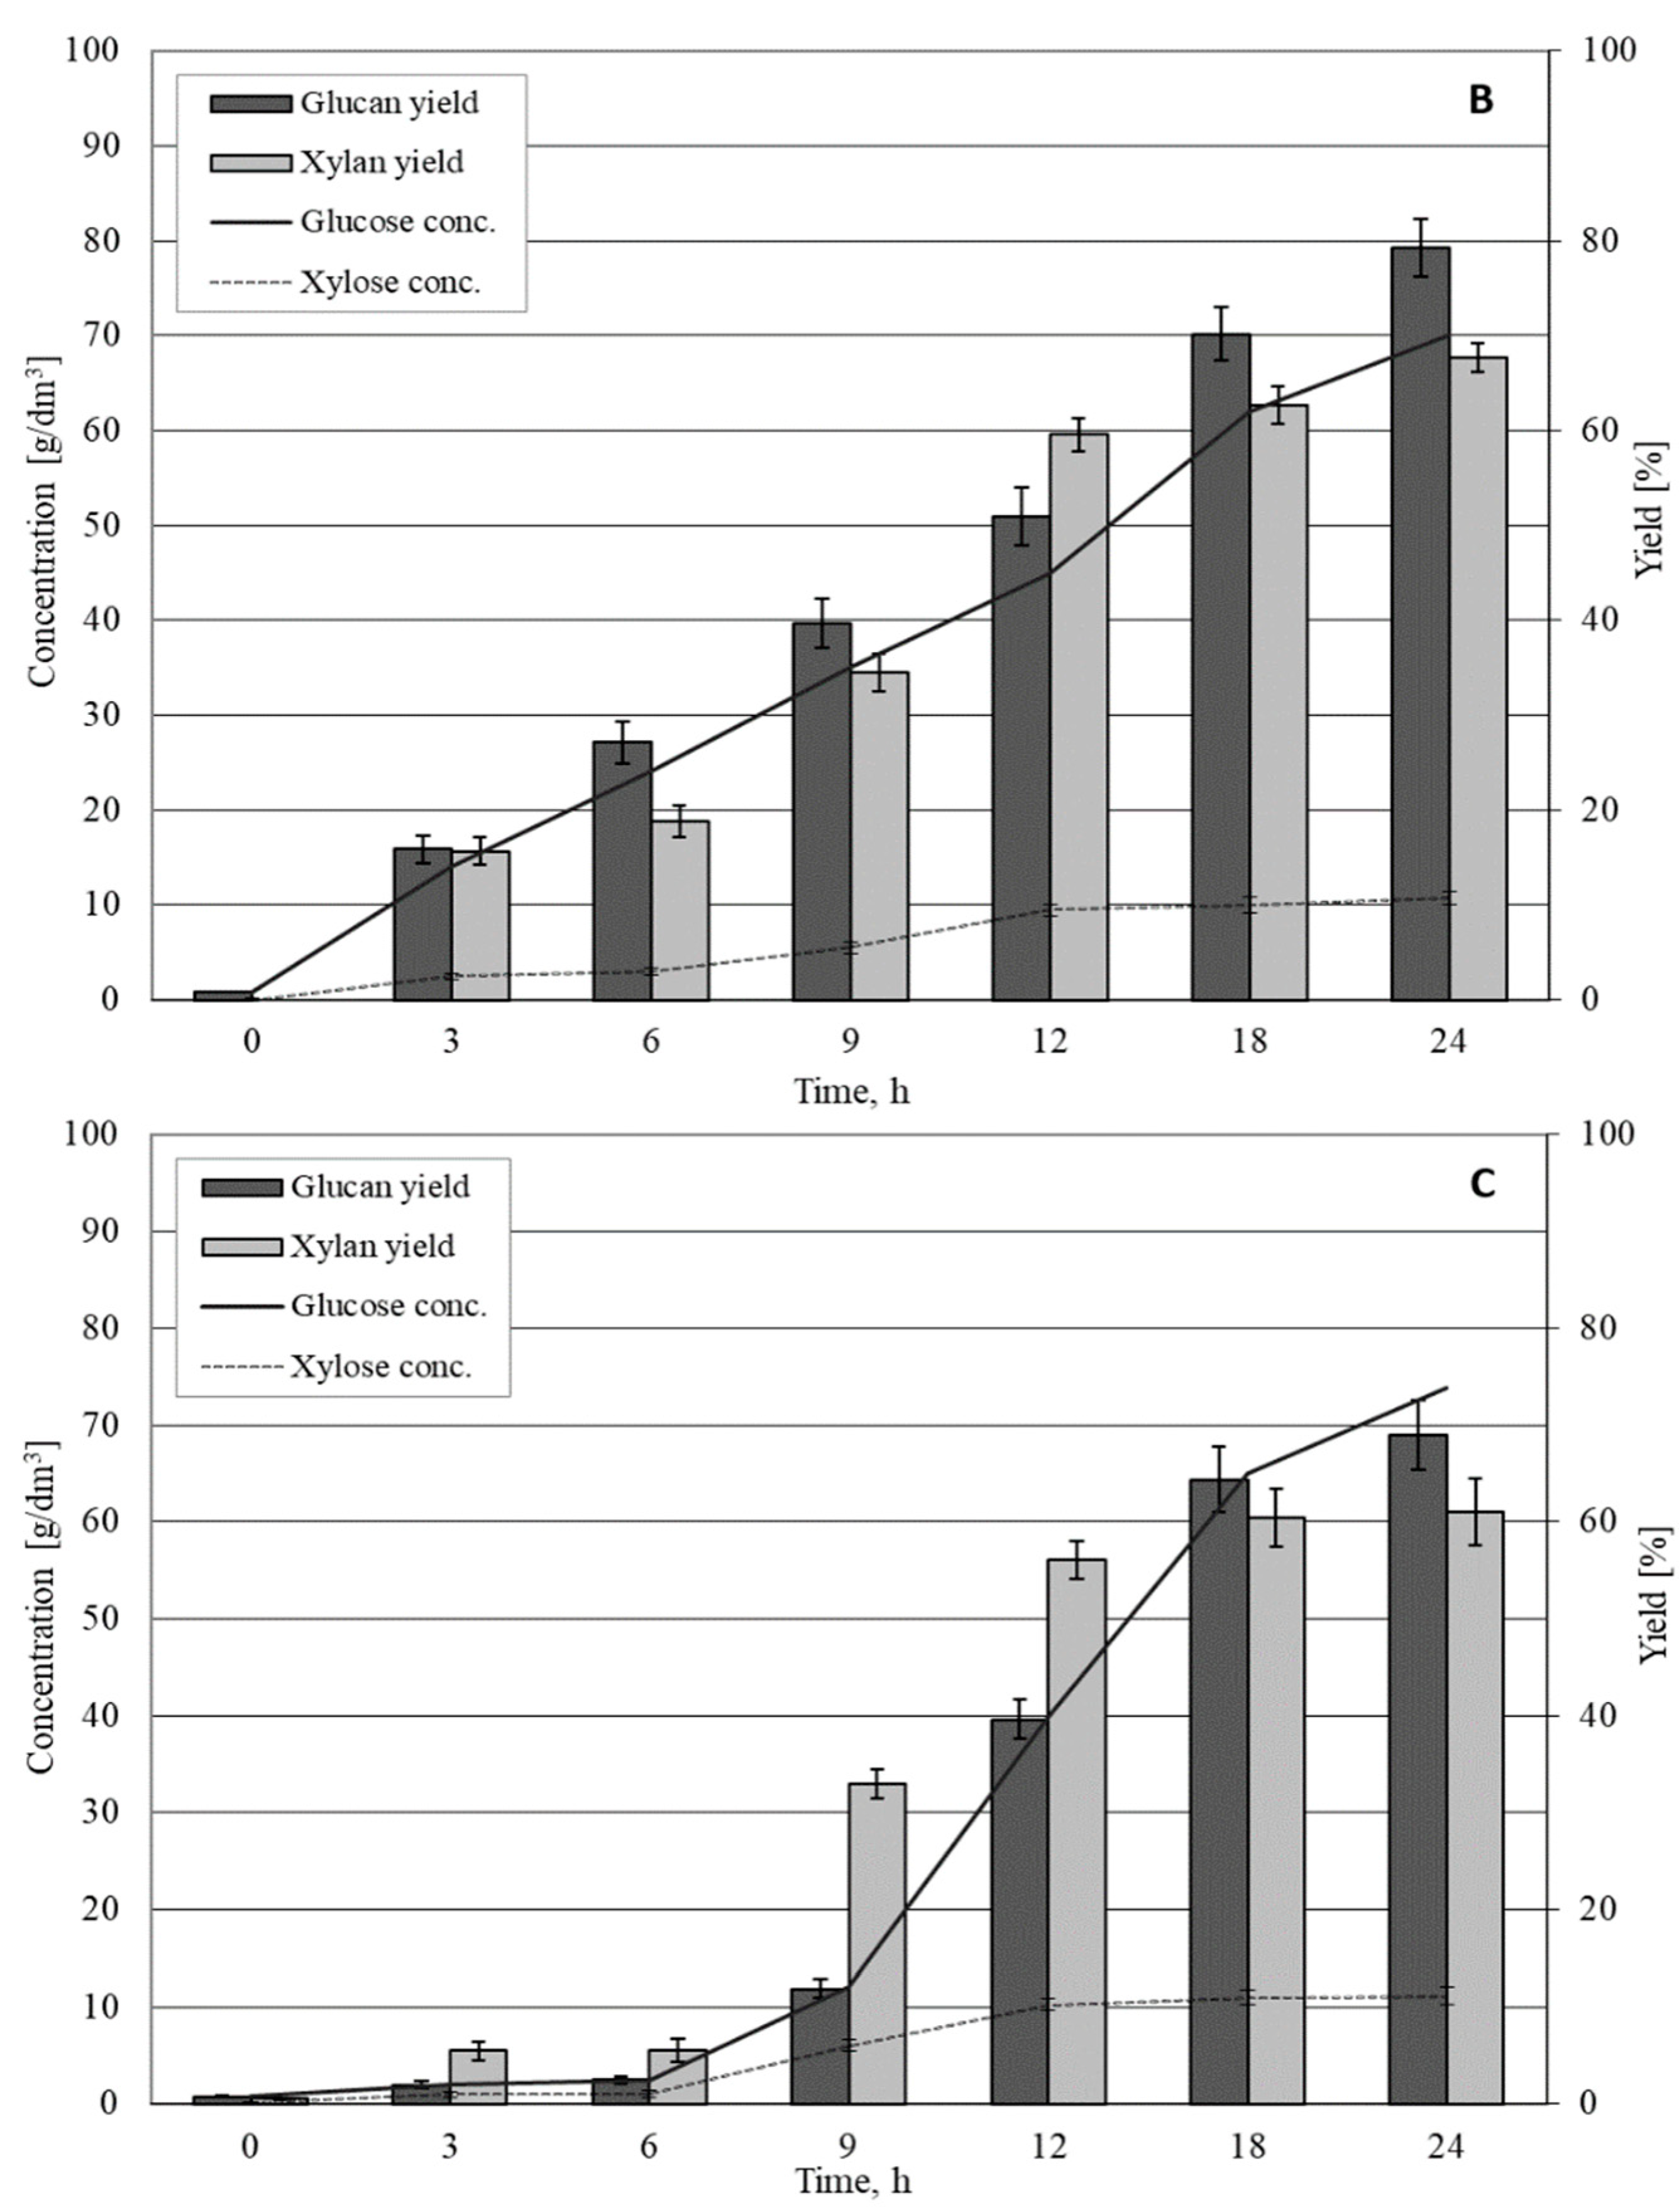
3.2. Enzymatic Hydrolysis of Solid Fraction from OFHKW

In all enzymatic tests, enzyme contents did not exceed 1.5% of total weight sample, which corresponds to 12.5 FPU/g-glucan (10.5 FPU/g-carbohydrates or 4.5 FPU/g dried substrate, based on results in Table 2). Therefore, applied enzyme dosages can be considered as relatively low, compared to other biomass types, hydrolysed at high biomass loadings. For example, pretreated sugarcane bagasse by the Organosolv method was hydrolysed at 10 FPU/g dried substrate. In general, due to the recent scientific progress in the field of enzymatic hydrolysis, the acceptable cellulase dosage used for biomass hydrolysis is around or even below 10 FPU/g dry matter [23].
The effectiveness of the glucan conversion reached 93% for the wet substrate loading between 20 and 40% (dry matter loading 6–13%) (Table 2, Figure 1). This can be explained by relatively high activity of carbohydrate-degrading enzymes present in this enzyme blend used. Slightly lower glucan conversion yields (79–84%) were obtained for biomass wet loading in the range of 60–70% (18–22% dry matter loading). However, lower conversion yields were compensated for by higher glucose concentrations. i.e., 63–70 g/dm3. For assays with biomass loading not exceeding 22% (w/v, dry matter), glucan and xylan were hydrolysed without a log phase (Figure 1A,B). In the case of the sample with the highest tested biomass loading (dry matter loading: 25.0%, Figure 1C), release of glucose and xylose started after about 6 h of lag phase, which shows that process conditions were not sufficiently optimal. Moreover, enzymatic processes conducted for the biomass wet loading of 80% (dry matter loading: 25%) was connected with significantly lower conversion yields (69%) compared to assays with lower biomass loadings (Table 2). In this case, an average obtained glucose concentration (74 g/dm3) is not beneficial, taking into account a higher required dosage of enzymatic cocktails used for processing an assay with 80% biomass wet loading. A significant decrease in glucan hydrolysis was observed after increasing dry matter loading from 22% to 25% (Table 2). Taking into account the fact that the difference between analysed assays is relatively low, this phenomenon might have been caused by reduced viscosity or reduction in free water availability.
Table 2. Results of enzymatic hydrolysis carried out with selected cocktails mixture (average values n = 3, ± standard deviation) a.
AssayInitial Glucose and Xylose b, g/dm3After 24 h of Enzymatic Hydrolysis
Glucose, g/dm3Glucan Yield, %Xylose, g/dm3Xylan Yield, %Total Sugar, g/dm3Total Yield, %
Wet substrate loading: 20% (% w/v)
Dry matter loading: 6.3% ± 0.6
29.7 ± 0.923.6 ± 1.193.3 ± 1.53.75 ± 0.282.3 ± 2.527.3 ± 1.291.7 ± 1.1
Wet substrate loading: 40% (% w/v)
Dry matter loading: 12.5% ± 1.2
59.6 ± 1.947.0 ± 3.093.0 ± 3.67.40 ± 0.581.0 ± 2.654.4 ± 3.491.2 ± 3.3
Wet substrate loading: 60% (% w/v)
Dry matter loading: 18.9% ± 1.9
89.4 ± 2.963.4 ± 3.883.6 ± 2.59.75 ± 0.571.3 ± 1.573.2 ± 4.281.8 ± 2.3
Wet substrate loading: 70% (% w/v)
Dry matter loading: 22.0% ± 2.2
104 ± 3.470.0 ± 3.179.3 ± 3.010.8 ± 0.767.6 ± 2.580.8 ± 3.677.5 ± 2.7
Wet substrate loading: 80% (% w/v)
Dry matter loading: 25.0% ± 2.5
119 ± 3.873.9 ± 6.169.0 ± 3.611.1 ± 0.961.0 ± 3.685.0 ± 6.871.3 ± 3.4
a—enzymatic cocktail weight expressed as substrate dry matter used during experiment (5% w/w), 100% dosage: 62.5% Cellic® CTec2, 31%% β-Glucanase and 6.5% Cellic ® HTec2, b—theoretical (maximum) glucose and xylose concentration, after enzymatic hydrolysis and mixing with exponentially growing inoculum (5% v/v).
In the case of xylan hydrolysis, obtained yields varied between 61% and 81% (Table 2). Obtained xylan yields can be considered as very high, due to the enrichment of enzymatic dosage with the Cellic ® HTec2 cocktail and β-Glucanase. This was also observed in previous studies [18]. Similarly to cellulose hydrolysis, conducting the process at the highest biomass loading (dry matter loading: 25.0%, Figure 1C) had no positive effect on the final xylose concentrations and xylose yields (Table 2). Final xylose concentrations were several times lower compared to glucose titres, as carbohydrates contained only 15% of hemicellulosic fraction. In all cases, there was no significant influence of process duration (above 24 h) on the final glucose/xylose concentrations or glucan/xylan yields. In this study, final sugar content amounted to 80.8 g/dm3 (Table 2, enzymatic assay considered as optimal, substrate loading: 70% w/v, dry matter loading: 22.0%), which can be considered as a promising feedstock for biosuccinic acid production. This is within an upper range of values reported after enzymatic hydrolysis of kitchen biowastes and other organic wastes, originating from the food industry. For example, treatment of bakery wastes and food wastes (both after fungal autolysis and hydrolysis) resulted in total sugar titres of 54.2 and 31.9 g/dm3, respectively [24,25], whilst treatment of herbal extraction residues (after dilute-acid pretreatment before enzymatic hydrolysis) obtain 71.6 g/dm3 released sugars [26]. Higher concentrations of sugars (119–135 g/dm3) were obtained by Babaei et al. [8]. However, in this case, feedstock (organic fraction of kitchen waste, OFHKW) which was directed to enzymatic hydrolysis contained three times higher content of total solids (TS) and volatile solids (VS) (TS: 976 g/kg, VS: 921 g/kg, Celluclast 1.5 L®, Cellobiase, substrate loading: 15–20%), compared to the current study. Taking into account the above, hydrolysed feedstock in our studies (>80 g/dm3, Table 2) can be considered as promising for biosuccinic acid production. Our results also indicate that the strategy of mixing commercially available cellulolytic enzyme preparations may in the future contribute to the development of improved enzymatic mixtures for municipal biowaste hydrolysis.

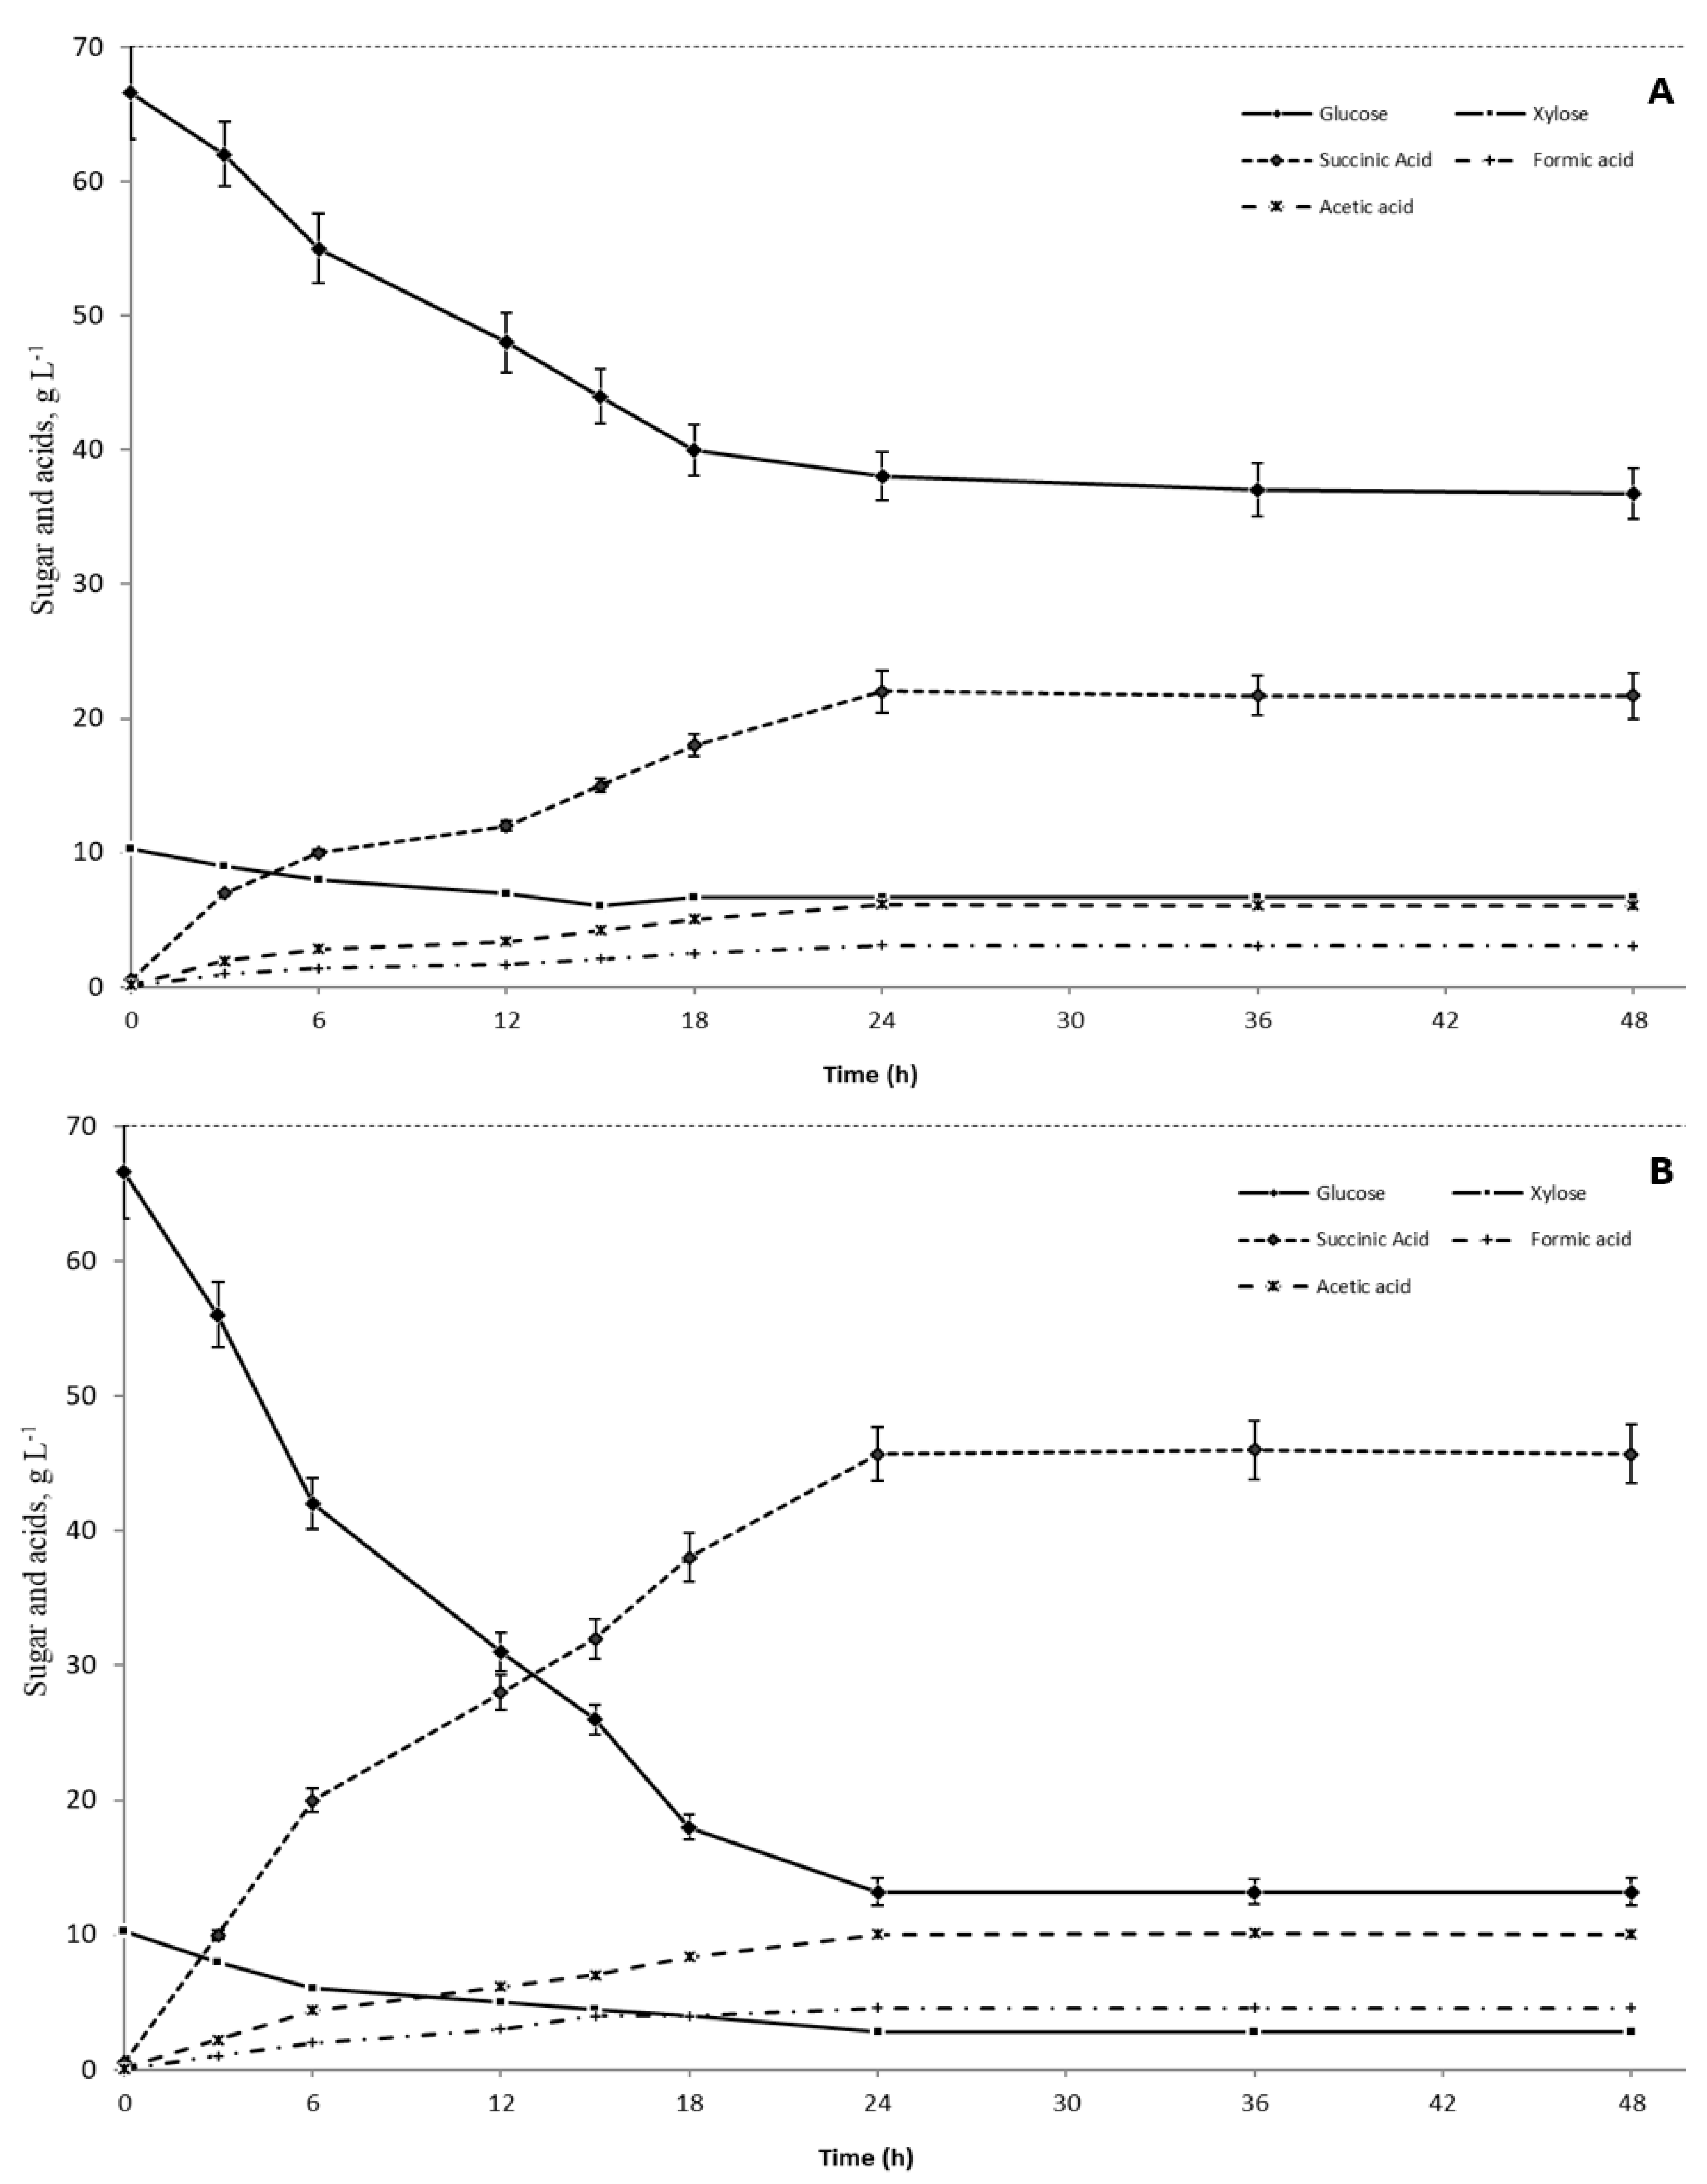
3.3. Succinic Fermentation Using Different Carbon Sources

Carbon dioxide constitutes one of the major substrates used for biosynthesis of succinic acid, while CO2 source and dosage influence the metabolic flux as well as the effectiveness of succinic acid production [27,28]. Firstly, succinic acid fermentation was conducted using gaseous CO2 (biogas containing 75% CH4 and 25% CH4). The process conducted at atmospheric pressure (101.3 kPa, CO2 partial pressure 40 kPa) helped to utilize about 42% of available sugars (glucose and xylose) and resulted in succinic yield of 63% (0.63 g succinic acid/g sugar consumed). Succinic yields obtained were slightly lower than yields previously reported, using model biogas mixture (60% CH4 and 40% CO2) as the carbon source for succinic acid biosynthesis [4]. However, the present study is based on biogas containing significantly lower CO2 content (25% vol.) compared to previous studies (Table 3). Taking into account the conditions applied in the current study, it was assumed that providing biogas after co-digestion processes (including 25% of CO2) as the only carbon dioxide source is not sufficient for obtaining a high succinic titre (above 30–40 g/dm3) and succinic yields > 65–70% (Table 3). Obtaining a high succinic titre (at least 30–40 g/dm3) during fermentation is crucial, as downstream processing of succinic broths can utilize more than 50–60% of total production costs and is attributed to recovery and refining [2]. Conditions of biogas supplied as the only carbon dioxide source can be further optimized (e.g., via changing gas–liquid ratio); however, this is outside the scope of the current study.
Table 3. Succinic acid production from hydrolysates after application of the most effective enzyme dosage (initial sugar concentration: 76.8 ± 3.5, average values n =3, ± represent standard deviations).
CO2 SourceNutrients for Ferm. aAfter Succinic Fermentation (48 h)Biogas after Succinic Production g
Glucose,
g/dm3
Xylose,
g/dm3
Sugar Utiliz., %Succinic Acid, g/dm3Succinic Yield (Equation (3)), % fCH4
% vol.
CO2
% vol.
MgCO3 (85–86 g/dm3) b+13.8 ± 1.92.79 ± 0.378.5 ± 3.243.7 ± 3.072.4 ± 2.8--
MgCO3 (85–86 g/dm3) b-14.1 ± 1.32.62 ± 0.478.1 ± 1.842.3 ± 2.570.5 ± 2.4--
Biogas as CO2 source+36.9 ± 3.56.67 ± 0.842.4 ± 3.421.7 ± 1.763.0 ± 4.483.5 ± 1.617.2 ± 1.0
MgCO3 (30–31 g/dm3) c + Biogas-11.9 ± 2.22.40 ± 0.581.1 ± 3.646.3 ± 2.074.9 ± 3.387.5 ± 1.411.1 ± 1.0
MgCO3 (20–21 g/dm3) d + Biogas -13.2 ± 1.02.84 ± 0.379.0 ± 1.545.7 ± 2.575.4 ± 4.891.2 ± 1.58.65 ± 0.9
MgCO3 (14–15 g/dm3) e + Biogas-24.5 ± 2.12.92 ± 0.564.4 ± 2.734.3 ± 1.269.5 ± 2.190.2 ± 1.49.25 ± 0.8
a—“+”—nutrients (KH2PO4: 3 g/dm3, MgCl 6H2O: 0.2 g/dm3, CaCl2: 0.2 g/dm3: NaCl (1.0 g/dm3) and yeast extract were added, “-“—fermentation with yeast extract/without nutrients; b—1.1 g MgCO3/g-sugar considered as theoretical dosage; c—35% of theoretical MgCO3 dosage; d—25% of theoretical MgCO3 dosage; e—15% of theoretical MgCO3 dosage; f—calculated as g succinic acid produced/g sugar consumed according to Equation (3), g—initial composition of biogas (CH4: 75% vol, CO2: 24% vol.).
In many previous studies on biosuccinic acid production, salts (MgCO3, NaHCO3 or CaCO3) are used as the carbon source. In particular, MgCO3 as a carbon source was identified as the most effective CO2 supplier and pH control agent [2]. During the second part of the experiment, MgCO3 was used as a carbon dioxide source for succinic production. In these cases, succinic titre and yield amounted to 42–44 g/dm3 and 70–72%, respectively (Table 3). This proves that the availability of CO2 plays a crucial role during succinic acid biosynthesis and promotes the carbon flow towards the SA production branch of TCA (tricarboxylic acid) cycle [1,2]. Obtained succinic yields and titres were similar in both analysed cases, i.e., with the addition of nutrients for fermentation and for the process without nutrient addition (Table 3). This proves that the organic fraction of household kitchen waste contains essential elements for microbial growth, including: magnesium, calcium, cobalt, nickel (Table 1).
As our main aim was to utilize CO2 from biogas for effective succinic production, the simultaneous effect of gaseous CO2 and MgCO3 on the performance of succinic fermentation was taken into account (Table 3). When MgCO3 was added with the supply of gaseous CO2, the following compounds, CO2, HCO3 and CO32−, would become equilibrised in the fermentation broth [5]. The highest succinic titre and yield amounted to 45–46 g/dm3 and 74–75%, respectively, and these values were obtained for a MgCO3 dosage of 20–30 g/dm3 MgCO3+ biogas/(>400 mM CO2) (Table 3). Succinic acid production started immediately after inoculation, without any lag phase (Figure 2). In these conditions, the dosage of carbon sources significantly exceeded the maximum CO2 solubility (139 mM). This proves that high succinic yields are obtained in conditions of CO2 excess. This is in accordance with previous reports stating that the highest succinic yields (69–71%, 0.69–0.71 g/g) were recorded for carbonate dosages of 300–500 mM [7]. This also proves that biogas can substitute the majority of MgCO3, which is commonly used as a carbon source in biotechnological processes.
An additional purpose of using gaseous CO2 for the biosynthesis of succinic acid was to purify the biogas. CH4 content in biogas used as the only CO2 source increased by 8–9% and reached the level of 83–84% at the end of succinic fermentation (Table 3). An increase in CH4 content from 85% to 95% was reported in previous studies [4]. However, as previously mentioned, the authors used biogas containing significantly higher CO2 content (40% vol.) compared to the present study (25% vol.).
As regards the simultaneous usage of biogas and MgCO3 as carbon dioxide sources (dosage of 15–20 g/dm3, 15–25% of theoretical MgCO3 dosage, Table 3), CH4 content after succinic fermentation reached final values of 90–91% (Table 3). In these cases, the final CH4 content is consistent with values that are possible to obtain via commercially available purification methods, e.g., water scrubbing or using chemical scrubbers with amine solutions [29]. In the case of simultaneous addition of biogas and 30–31 g/dm3 MgCO3 (35% of theoretical MgCO3 dosage, Table 3), the CH4 content in biogas fluctuated between 87 and 88%. However, such process conditions reflected a high CO2 content, originating from carbonate, compared to previous assays. Depending on succinic fermentation conditions, including type of CO2 source and its dosage, other metabolites, such as acetic, formic, lactic acid or ethanol, can be produced in different amounts [1]. In the present study, acetic and formic acids were produced as the main fermentation by-products. As shown in Figure 2, during fermentation with the simultaneous addition of biogas and MgCO3, succinic, acetic and formic acids were simultaneously produced, and by-product content (acetic and formic acid) did not exceed 24–25% of total fermentation (Figure 3). This shows that applied CO2 dosage was sufficient to increase C4 flux towards higher succinic acid production [1]. Only in the case of fermentation with biogas as the only CO2 source did by-product content slightly exceed 30% of total fermentation products (succinic, acetic and formic acid) (Figure 3).

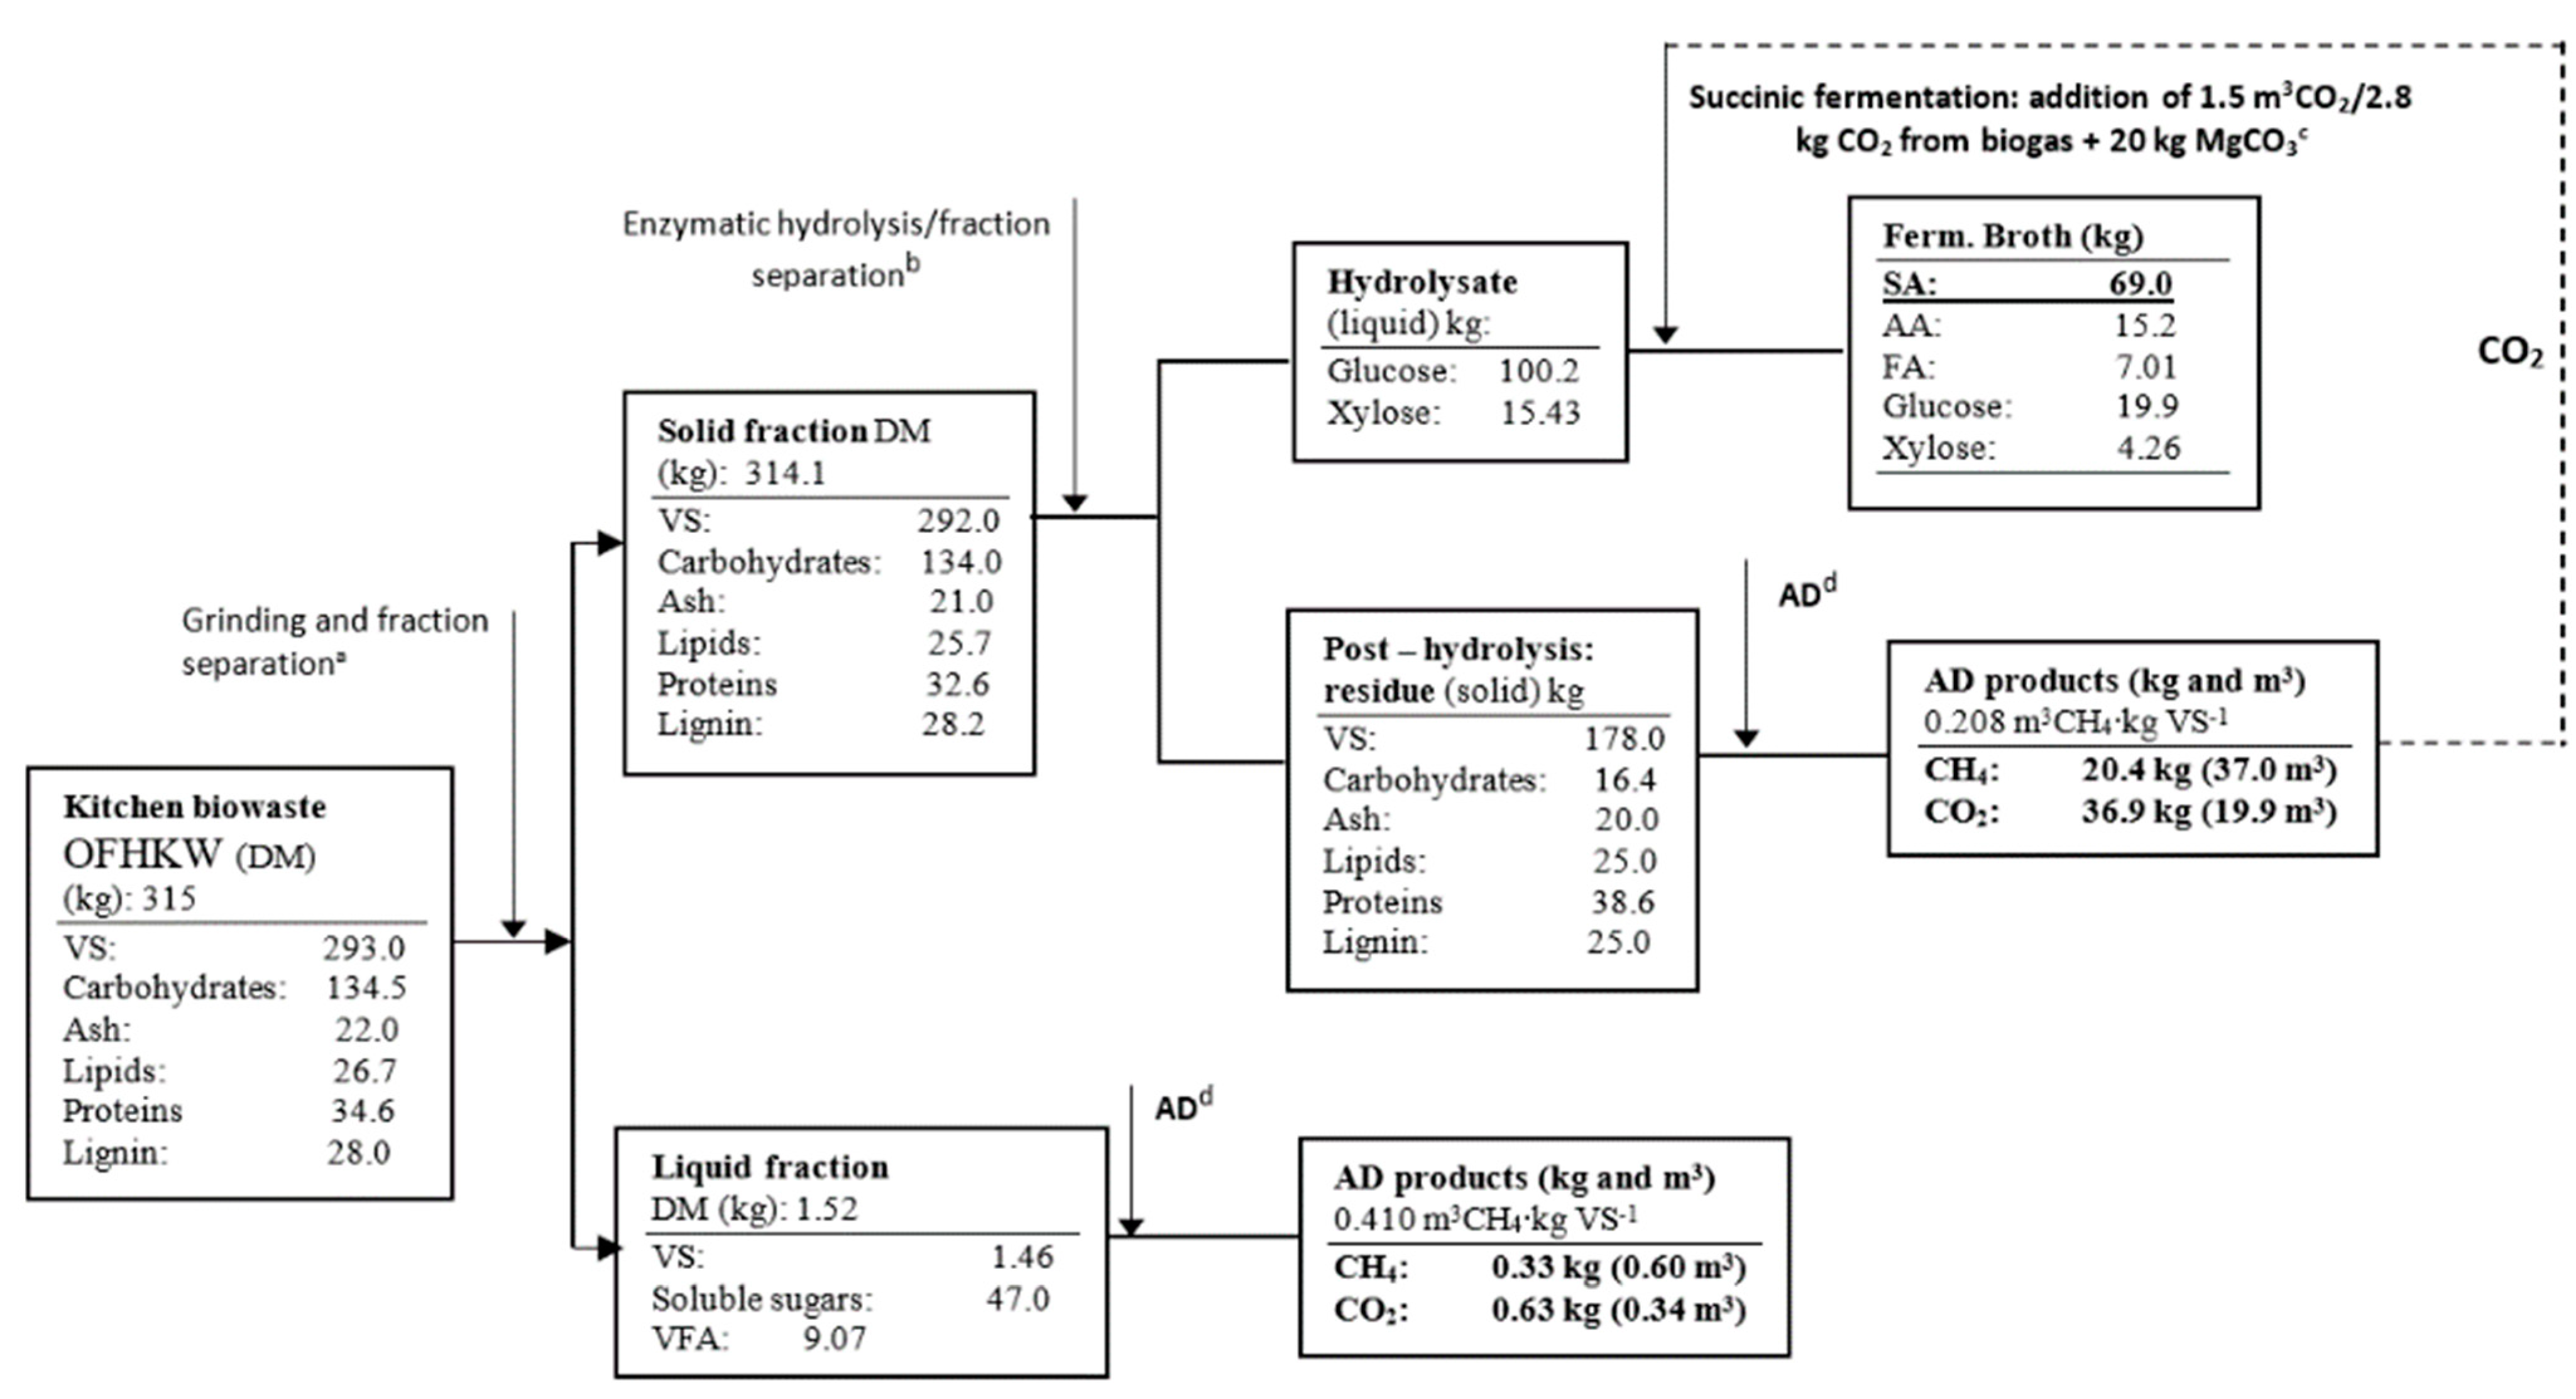
3.4. Anaerobic Digestion (AD) of Succinic By-Products

In the case of liquid fraction of the OFHKW complex, obtained methane yields amounted to 0.410 ± 25 Nm3 CH4/kg VSadded (Figure 3). Significantly lower methane yields were obtained after treatment of post-hydrolysis residues. In this case, methane yields fluctuated between 0.200 and 0.220 Nm3 CH4/kg VSadded (208 ± 11Nm3 CH4/kg VSadded) (Figure 3). This is within the range of methane yields reported for AD of kitchen waste, i.e., 0.175 and 0.240 Nm3 CH4/kg VSadded [30]. Higher methane yields obtained in the case of liquid OFHKW fraction were accounted for in the presence of easily biodegradable compounds (i.e., acetic acid, dissolved sugars, lipids). This in consistent with the fact that rapid bioconversion of dissolved components is usually observed. This can also be accounted for in high biodegradability of the liquid fraction (“OFHKW”), which was above 0.92 (based on COD and BOD5 results, data not shown). In all analysed cases, the CH4 and CO2 content in biogas produced amounted to 64–66% and 32–34%, respectively (Figure 3).

3.5. Biorefinery Concept

In the case of succinic acid production from the solid fraction of OFHKW, 69 kg of succinic acid/Mg of treated feedstock was obtained (Figure 3). Produced succinic acid has been recognized as one of the twelve most promising building-block chemicals, and it is a precursor for the production of a wide spectrum of commodities used in the food, chemical, and pharmaceutical industries. In our previous studies, succinic acid from biomass was successfully purified via the integrated concept of cation exchange (Amberlite IR 120H, cation exchange resin, vacuum distillation and crystallization). The developed concept of broth purification helped to obtain succinic acid with high quality (>98%), which can be used for further chemical transformations [18]. In the present biorefinery approach, post-hydrolysis residues (solid fraction after enzymatic treatment) and liquid fraction of “OFHKW” were used as feedstock for biogas production, i.e., a process which generates valuable methane and carbon dioxide (Figure 3). In the lab conditions presented in this study, carbon dioxide production in the form of biogas exceeds the dosage of CO2 used for effective succinic production (Table 3, Figure 3). Therefore, it is evident that the biorefinery concept presented has a real chance of contributing to the latest trends connected with the abatement of CO2 emissions from biofuel/biochemical production. Moreover, excessive amounts of CO2 can be used in numerous industrial applications, e.g., for soft drink and soda water production. It is estimated that 1 tonne of biosuccinic acid produced can save 4.5–5 tonnes of CO2 compared to succinic production via petrochemical sources. Furthermore, the effectiveness of biosuccinic acid production from analysed biowaste can be improved via the optimization of the fermentative process, including Actinobacillus succinogenes adaptation into process conditions [31].

4. Conclusions

The results obtained in this study clearly confirmed that OFHKW after enzymatic hydrolysis (mixing different enzymatic cocktails: Cellic® CTec2, β-Glucanase and Cellic® HTec2) can be considered as a promising feedstock for succinic acid production. Enzymatic hydrolysis of kitchen waste at high biomass loading (>20%) resulted in a total sugar yield of 78%. Succinic fermentation with the simultaneous addition of gaseous CO2 (biogas) and MgCO3 (>20 g/dm3) resulted in the highest sugar conversion rates (79–81%) and succinic yield (74–75%). The concept of kitchen waste treatment presented in the study turned out to be effective in biogas production from residues after succinic production, especially for post-hydrolysis biomass. Optimal conditions of succinic fermentation (CO2 dosage and source) identified in this study can pave the way towards the sustainable production of succinic acid from the organic fraction of municipal wastes (OFHKW), using a biorefinery concept.

Author Contributions

M.K. performed experimental research during his scientific stay at DTU and via cooperation with their home University of Bielsko-Biala. M.K. also prepared a draft version of the manuscript. I.A. supervised the research performed and final preparation of the manuscript. All authors have read and agreed to the published version of the manuscript.

Funding

This research was supported and financed by NAWA (National Agency for Academic Exchange), via project “Production of succinic acid from municipal bio-fraction based on waste carbon dioxide and alternative nitrogen sources” (PPN/BEK/2019/1/00411) and ACT ERA-NET Cofund under the European Union’s Horizon 2020 Research and Innovation program (Project No. 327331 CooCE, Grant Agreement 862087), co-funded by EUDP (No 64021.2006).

Institutional Review Board Statement

Not applicable.

Informed Consent Statement

Not applicable.

Data Availability Statement

Not applicable.

Acknowledgments

The research conducted was supported and financed by NAWA (National Agency for Academic Exchange), via project “Production of succinic acid from municipal bio-fraction based on waste carbon dioxide and alternative nitrogen sources” (PPN/BEK/2019/1/00411). Experimental results were obtained during a scientific stay at DTU (Technical University of Denmark, 2020–2021). Moreover, it was supported by the ACT ERA-NET Cofund under the European Union’s Horizon 2020 Research and Innovation program (Project No. 327331 CooCE, Grant Agreement 862087), co-funded by EUDP (No 64021.2006).

Conflicts of Interest

The authors declare no conflict of interest.

References

  1. Pateraki, C.; Patsalou, M.; Vlysidis, A.; Kopsahelis, N.; Webb, C.; Koutinas, A.A.; Koutinas, M. Actinobacillus succinogenes: Advances on succinic acid production and prospects for development of integrated biorefineries. Biochem. Eng. J. 2016, 112, 285–303. [Google Scholar] [CrossRef]
  2. Dessie, W.; Xin, F.; Zhang, W.; Jiang, Y.; Wu, H.; Ma, J.; Jiang, M. Opportunities, challenges, and future perspectives of succinic acid production by Actinobacillus succinogenes. Appl. Microbiol. Biotechnol. 2018, 102, 9893–9910. [Google Scholar] [CrossRef] [PubMed]
  3. Cheng, K.K.; Zhao, X.B.; Zeng, J.; Zhang, J.A. Biotechnological production of succinic acid: Current state and perspectives. Biofuels Bioprod. Biorefin. 2012, 6, 302–318. [Google Scholar] [CrossRef]
  4. Gunnarsson, I.B.; Alvarado-Morales, M.; Angelidaki, I. Utilization of CO2 fixating bacterium Actinobacillus succinogenes 130Z for simultaneous biogas upgrading and biosuccinic acid production. Environ. Sci. Technol. 2014, 48, 12464–12468. [Google Scholar] [CrossRef] [Green Version]
  5. Zou, W.; Zhu, L.W.; Li, H.M.; Tang, Y.J. Significance of CO2 donor on the production of succinic acid by Actinobacillus succinogenes ATCC 55618. Microb. Cell Fact. 2011, 10, 87. [Google Scholar] [CrossRef] [Green Version]
  6. Herselman, J.; Bradfield, M.F.A.; Vijayan, U.; Nicol, W. The effect of carbon dioxide availability on succinic acid production with biofilms of Actinobacillus succinogenes. Biochem. Eng. J. 2017, 117A, 218–225. [Google Scholar] [CrossRef] [Green Version]
  7. Tan, J.P.; Luthfi, A.A.I.; Manaf, S.F.A.; Wu, T.Y.; Jahim, J.M. Incorporation of CO2 during the production of succinic acid from sustainable oil palm frond juice. J. CO2 Util. 2018, 26, 595–601. [Google Scholar] [CrossRef]
  8. Babaei, M.; Tsapekos, P.; Alvarado-Morales, M.; Hosseini, M.; Ebrahimi, S.; Niaei, A.; Angelidaki, I. Valorization of organic waste with simultaneous biogas upgrading for the production of succinic acid. Biochem. Eng. J. 2019, 147, 136–145. [Google Scholar] [CrossRef]
  9. Lyager, J.K.; Anthonisen, S. Valorisation of Sugar-Containing Wastes to Produce 2G Succinic Acid in Biorefinery Concept; Graduation Project; Technical University of Denmark: Lyngby, Denmark, 2018. [Google Scholar]
  10. Stenmark, Å.; Jensen, C.; Quested, T.; Moates, G. Estimates of European Food Waste Levels; Report; IVL Swedish Environmental Research Institute: Stockholm, Sweden, 2016. [Google Scholar] [CrossRef]
  11. Mohanty, A.; Mankoti, M.; Rout, P.R.; Meena, S.S.; Dewan, S.; Kalia, B.; Varjani, S.; Won, J.W.C.; Banu, J.R. Sustainable utilization of food waste for bioenergy production: A step towards circular bioeconomy. Int. J. Food Microbiol. 2022, 365, 109538. [Google Scholar] [CrossRef]
  12. González-Torre, P.L.; Coque, J. From Food Waste to Donations: The Case of Marketplaces in Northern Spain. Sustainability 2016, 8, 575. [Google Scholar] [CrossRef] [Green Version]
  13. Pleissner, D.; Lam, W.C.; Sun, Z.; Lin, C.S.K. Food waste as nutrient source in heterotrophic microalgae cultivation. Bioresour. Technol. 2013, 137, 139–146. [Google Scholar] [CrossRef]
  14. Kim, M.S.; Na, J.G.; Lee, M.K.; Ryu, H.; Chang, Y.K.; Triolo, J.M.; Yun, Y.M.; Kim, D.H. More value from food waste: Lactic acid and biogas recovery. Water Res. 2016, 96, 208–216. [Google Scholar] [CrossRef] [PubMed]
  15. Nagarajan, S.; Jones, R.J.; Oram, L.; Massanet-Nicolau, J.; Guwy, A. Intensification of Acidogenic Fermentation for the Production of Biohydrogen and Volatile Fatty Acids—A Perspective. Fermentation 2022, 8, 325. [Google Scholar] [CrossRef]
  16. Ntaikou, I.; Menis, N.; Alexandropoulou, M.; Antonopoulou, G.; Lyberatos, G. Valorization of kitchen biowaste for ethanol production via simultaneous saccharification and fermentation using co-cultures of the yeasts Saccharomyces cerevisiae and Pichia stipitis. Bioresour Technol. 2018, 263, 75–83. [Google Scholar] [CrossRef]
  17. Siqueira, J.G.W.; Teixeira, N.A.; Vandenberghe, L.P.S.; Oliveira, P.Z.; Soccol, C.R.; Rodrigues, C. Update and Revalidation of Ghose’s Cellulase Assay Methodology. Appl. Biochem. Biotechnol. 2020, 191, 1271–1279. [Google Scholar] [CrossRef]
  18. Dąbkowska, K.; Alvarado-Morales, M.; Kuglarz, M.; Angelidaki, I. Miscanthus straw as substrate for biosuccinic acid production: Focusing on pretreatment and downstream processing. Bioresour. Technol. 2019, 278, 82–91. [Google Scholar] [CrossRef] [PubMed]
  19. Gunnarsson, I.B.; Kuglarz, M.; Karakashev, D.; Angelidaki, I. Thermochemical pretreatments for enhancing succinic acid production from industrial hemp (Cannabis sativa L.). Bioresour. Technol. 2015, 182, 58–66. [Google Scholar] [CrossRef] [PubMed]
  20. Baird, R.B.; Eaton, A.D.; Rice, E.W. (Eds.) Standard Methods for the Examination of Water and Wastewater, 23rd ed.; American Public Health Association, American Water Works Association, Water Environment Federation: Washington, DC, USA, 2017. [Google Scholar]
  21. Sluiter, A.; Hames, B.; Ruiz, R.; Scarlata, C.; Sluiter, J.; Templeton, D.; Crocker, D. Determination of Structural Carbohydrates and Lignin in Biomass. Lab. Anal. Procedure 2008, 1617, 1–16. [Google Scholar]
  22. Stylianou, E.; Pateraki, C.; Ladakis, D.; Cruz-Fernández, M.; Latorre-Sánchez, M.; Coll, C.; Koutinas, A. Evaluation of organic fractions of municipal solid waste as renewable feedstock for succinic acid production. Biotechnol. Biofuels 2020, 13, 72. [Google Scholar] [CrossRef] [Green Version]
  23. da Silva, A.S.; Espinheira, R.P.; Teixeira, R.S.S.; de Souza, M.F.; Ferreira-Leitão, V.; Bon, E.P.S. Constraints and advances in high-solids enzymatic hydrolysis of lignocellulosic biomass: A critical review. Biotechnol. Biofuels 2020, 13, 58. [Google Scholar] [CrossRef] [Green Version]
  24. Zhang, A.; Sun, Z.; Leung, C.C.J.; Han, W.; Lau, K.Y.; Li, M.; Lin, C.S. Valorisation of bakery waste for succinic acid production. Green Chem. 2013, 15, 690–695. [Google Scholar] [CrossRef]
  25. Sun, Z.; Li, M.; Gao, Q.Q.C.; Lin, C.S.K. Mixed Food Waste as Renewable Feedstock in Succinic Acid Fermentation. Appl. Biochem. Biotechnol. 2014, 174, 1822–1833. [Google Scholar] [CrossRef]
  26. Wang, C.; Su, X.; Sun, W.; Zhou, S.; Zheng, J.; Zhang, M.; Sun, M.; Xue, J.; Liu, X.; Xing, J.; et al. Efficient production of succinic acid from herbal extraction residue hydrolysate. Bioresour. Technol. 2018, 265, 443–449. [Google Scholar] [CrossRef]
  27. Kuglarz, M.; Rom, M. Influence of carbon dioxide and nitrogen source on sustainable production of succinic acid from miscanthus hydrolysates. Int. J. Environ. Sci. Dev. 2019, 10, 362–367. [Google Scholar] [CrossRef] [Green Version]
  28. Rigaki, A.; Webb, C.; Theodoropoulos, C. Double substrate limitation model for the bio-based production of succinic acid from glycerol. Biochem. Eng. J. 2020, 153, 107391. [Google Scholar] [CrossRef]
  29. Awe, O.W.; Zhao, Y.; Nzihou, A.; Minh, D.P.; Lyczko, N. A Review of Biogas Utilisation, Purification and Upgrading Technologies. Waste Biomass Valor. 2017, 8, 267–283. [Google Scholar] [CrossRef] [Green Version]
  30. Breitenmoser, L.; Dhar, H.; Gross, T.; Bakre, M.; Huesch, R.; Hugi, C.; Wintgens, T.; Kumar, R.; Kumar, S. Methane potential from municipal biowaste: Insights from six communities in Maharashtra, India. Bioresour. Technol. 2018, 254, 224–230. [Google Scholar] [CrossRef]
  31. Moussa, H.I.; Elkamel, A.; Young, S.B. Assessing energy performance of bio-based succinic acid production using LCA. J. Clean. Prod. 2016, 139, 761–769. [Google Scholar] [CrossRef]
Figure 1. Selected course of enzymatic hydrolysis and obtained glucose and xylose yields ((A)—18.9% dry matter loading/wet substrate loading: 60% w/v; (B)—22% dry matter loading/wet substrate loading: 70% w/v/; (C)—25% dry matter loading/wet substrate loading: 80% w/v; error bars represent standard deviation).
Fermentation 09 00259 g001aFermentation 09 00259 g001b
Figure 2. Course of succinic acid fermentation ((A)—process carried out with biogas as CO2 source, (B)—process carried out with simultaneous addition of biogas and 20–21 g/dm3 MgCO3/25% of initial dosage; error bars represent standard deviation).
Fermentation 09 00259 g002
Figure 3. Simplified mass balance of OFHKW complex (1 mg of waste treated), maximizing the products in a biorefinery approach (a—mechanical grinding and fraction separation via centrifugation, b—enzymatic hydrolysis conducted at wet substrate loading: 70% dry matter loading: 22.0, enzymatic cocktail weight expressed as substrate dry matter used during experiment: 5% w/w), c—succinic fermentation with 25% of theoretical MgCO3 dosage, simultaneous addition of biogas and MgCO3: 20–21 g/L, d—anaerobic digestion of post.
Fermentation 09 00259 g003
Table 1. Characterization of OFHKW (organic fraction of household kitchen waste) used in the current study (average values n = 3, ±standard deviation).
ParameterUnitValue
Solid fraction of organic fraction of household kitchen waste
(“OFHKW”, 85% of total sample weight)a
Total solids (TS)g/kg315 ÷ 31
Volatile solids (VS)g/kg293 ÷ 29
Total organic carbon (TOC)%TS57.3 ÷ 2.5
Carbohydrates%TS42.7 ÷ 3.1
Cellulose %TS29.2 ÷ 2.4
Starch%TS7.10 ÷ 0.4
Hemicellulose%TS6.40 ÷ 0.3
Nitrogen (TKN)%TS11.0 ÷ 0.55
Lipid content% TS8.46 ÷ 0.65
Lignin% TS8.90 ÷ 0.80
Ash% TS2.20 ÷ 0.15
Cag/kg TS9.15 ± 0.80
Mgg/kg TS1.25 ± 0.10
Pg/kg TS3.05 ± 0.12
Sg/kg TS2.10 ± 0.11
Nag/kg TS3.55 ± 0.21
Kg/kg TS4.52 ± 0.20
Feg/kg TS0.52 ± 0.03
Mnmg/kg TS<1.0
Nimg/kg TS1.20 ± 0.10
Cumg/kg TS0.82 ± 0.2
Cdmg/kg TS<1.0
Crmg/kg TS<1.0
Hgmg/kg TS<0.1
Nimg/kg TS<1.0
Pbmg/kg TS<2.0
Znmg/kg TS3.2 ± 0.4
Liquid fraction of organic fraction of household kitchen waste
(“OFHKW”, 15% of total sample weight) a
pH-4.8–5.2
Total solids (TS)g/dm315.0 ± 1.2
Volatile solids (VS)g/dm314.2 ± 1.2
NH4+g/dm30.62 ± 0.10
PO43−g/dm30.11 ± 0.01
VFA (acetic acid)g/dm30.55 ± 0.03
Soluble sugarsg/dm35.2 ± 0.6
a—average proportion of solid or liquid fraction in total sample weight, before grinding and enzymatic hydrolysis.
Disclaimer/Publisher’s Note: The statements, opinions and data contained in all publications are solely those of the individual author(s) and contributor(s) and not of MDPI and/or the editor(s). MDPI and/or the editor(s) disclaim responsibility for any injury to people or property resulting from any ideas, methods, instructions or products referred to in the content.

