Article

Pilot Scale Evaluation of Wild Saccharomyces cerevisiae Strains in Aglianico

by
Davide Gottardi
1,†,
Gabriella Siesto
2,3,*,†,
Antonio Bevilacqua
4,
Francesca Patrignani
1,
Daniela Campaniello
4,
Barbara Speranza
4,
Rosalba Lanciotti
1,
Angela Capece
2,3 and
Patrizia Romano
3,5
1
Department of Agricultural and Food Sciences, Campus of Food Science, Piazza Goidanich 60, 47521 Cesena, Italy
2
School of Agricultural, Forestry, Food and Environmental Sciences, University of Basilicata, Via dell’Ateneo Lucano 10, 85100 Potenza, Italy
3
Spin-Off StarFInn s.r.l.s., University of Basilicata, Via dell’Ateneo Lucano 10, 85100 Potenza, Italy
4
Department of Agriculture, Food, Natural Resources and Engineering, University of Foggia, Via Napoli 25, 71122 Foggia, Italy
5
Faculty of Economy, Universitas Mercatorum, Piazza Mattei 10, 00186 Rome, Italy
*
Author to whom correspondence should be addressed.
These authors contributed equally to this work.
Fermentation 2023, 9(3), 245; https://doi.org/10.3390/fermentation9030245
Submission received: 6 February 2023 / Revised: 28 February 2023 / Accepted: 1 March 2023 / Published: 3 March 2023
(This article belongs to the Special Issue Aroma Compound Evolution during Fermentation)

Abstract

:
In winemaking, the influence of Saccharomyces cerevisiae strains on the aromatic components of wine is well recognized on a laboratory scale, but few studies deal with the comparison of numerous strains on a pilot scale fermentation. In this scenario, the present work aimed to validate the fermentative behavior of seven wild S. cerevisiae strains on pilot-scale fermentations to evaluate their impact on the aromatic profiles of the resulting wines. The strains, isolated from grapes of different Italian regional varieties, were tested in pilot-scale fermentation trials performed in the cellar in 1 hL of Aglianico grape must. Then, wines were analyzed for their microbiological cell loads, main chemical parameters of enological interest (ethanol, total sugars, fructose, glucose, total and volatile acidity, malic and lactic acids) and volatile aroma profiles by GC/MS/SPME. Seventy-six volatile compounds belonging to six different classes (esters, alcohols, terpenes, aldehydes, acids, and ketones) were identified. The seven strains showed different trends and significant differences, and for each class of compounds, high-producing and low-producing strains were found. Since the present work was performed at a pilot-scale level, mimicking as much as possible real working conditions, the results obtained can be considered as a validation of the screened S. cerevisiae strains and a strategy to discriminate in real closed conditions strains able to impart desired wine sensory features.

1. Introduction

The use of indigenous strains of Saccharomyces cerevisiae as region-specific wine starters is increasingly attracting the interest of wine researchers and winemakers [1]. These yeasts are well adapted to micro-area conditions of a given region [2,3,4] and could ensure the maintenance of the typical flavor and aroma of wines obtained by grapevine cultivars of a specific geographical area [5,6,7]. Indeed, S. cerevisiae strains collected from ecologically and geographically diverse sources typically show genetic divergences associated with habitat type [8,9,10]. Furthermore, due to their better acclimatization to the environmental conditions of the wine-producing region and of the grape must composition, selected indigenous strains are mostly endowed with a higher level of dominance than commercial strains, exhibiting an elevated competition against yeast microbiota naturally present in the grape must [11].
It is widely recognized that S. cerevisiae produces different amounts of compounds affecting wine aroma profile, in the function of grape variety, fermentation conditions and must composition (availability of micronutrients, vitamins and assimilable nitrogen, etc.) [12] and that there is a high strain difference within this species due to the variation in their production of aromatic metabolites of wine [13,14,15]. Many studies demonstrated that indigenous S. cerevisiae strains with strain-specific metabolic profiles are correlated with wine chemical composition, reflecting the specificity of a terroir [16,17,18].
In general, wine aromas can be classified into varietal, fermentative, and aging aromas, but most of the compounds responsible for wine aroma are volatile molecules, and they can be classified into different chemical classes such as higher alcohols, carbonyl compounds, volatile fatty acids, esters, sulfur compounds, terpenoids and volatile phenols, that result from the yeast metabolism [19]. Overall, the aroma plays an important role in determining the organoleptic quality of the wine and, therefore, significantly affects the attractiveness of the wine [20,21,22].
A large amount of literature is available on the influence of the different S. cerevisiae strains on the aromatic components of wine, but the publications substantially describe fermentations carried out on a laboratory scale, and few studies deal with the comparison of numerous strains in pilot-scale fermentation. Indeed, laboratory-scale fermentation is an important condition to evaluate the specific metabolic traits of the different yeast strains because it allows us to compare a large number of strains under different conditions at the same time. The researchers’ choice to carry out lab-scale fermentations depends mainly on the practical requirements (such as the availability of small-sized fermenters and the cost of reagents, substrates, and instruments) [23], and there are some advantages for sampling and controlling the fermentation parameters. To evaluate the fermentative behavior of selected indigenous S. cerevisiae starters at a laboratory scale is a useful preliminary screening, although the results often differ from those obtained from a winery level in large volumes.
Some authors compared lab- and pilot-scale fermentations showing that the small fermentations cannot mimic those on a pilot or industrial scale and that there are significant differences in the kinetics and in the production of the aromatic compounds between these scales [24].
Based on these observations, the present work focused on the study of seven different wild strains of S. cerevisiae in pilot-scale fermentations with the aim of evaluating their impact on the product through the aromatic profiles of the resulting wines.

2. Materials and Methods

2.1. Yeast Strains

Seven wild Saccharomyces cerevisiae strains from the UNIBAS Yeast Collection (UBYC), University of Basilicata (Potenza, Italy), were used to conduct the alcoholic fermentation at a pilot scale. The strains were previously isolated from grapes of different varieties, directly collected in the vineyard of different Italian regions (Table 1), and characterized for their oenological performances [25], such as high dominance and fermentative vigor, ethanol tolerance of 16–17% (v/v), medium relative nitrogen demand, low foam production, killer factor. The strains were maintained at 4 °C for short-term storage on a YPD medium (bacteriological peptone, 20 g/L; yeast extract, 10 g/L; glucose, 20 g/L; agar, 15 g/L, Oxoid, Hampshire, UK).

2.2. Pilot Scale Fermentation

Fermentation trials were carried out in a winery of the Apulia region using stainless steel 1-hL capacity vessels containing 0.9 hL of Aglianico grape must with the following characteristics: total acidity 5.37 g/L; pH 3.6; TSS 22.0; density 1.097 g/L; Yeast Assimilable Nitrogen 211.9 mg N/L. Subsequently, 50 mg/L of sulfur dioxide (Sigma, St. Louis, MO 63304, USA) was added and mixed to the grape must with the aim of inhibiting the natural microbiota possibly present in the must, in particular acetic and lactic acid bacteria. In addition, pectinolytic enzymes (1 g/hL) were added to the must in order to favor clarification and facilitate settling [26].
In the laboratory, the yeast cultures were precultured by refreshing each strain on YPD plates and incubated at 26 °C for 24 h. Then, 1 loopful of each strain was inoculated into 0.5-L flasks filled with 0.2-L of YPD broth for 24 h at 25 °C under shaking conditions (180 rpm). For the fermentation trials in the cellar, the biomass was achieved by BioFlo/CelliGen 110 bioreactor (Eppendorf, Hamburg, Germany) by inoculating the precultures of each strain in a vessel containing 5 L of YPD broth. During growth, the following parameters were controlled: a temperature of 26 °C, stirring at 200 rpm, and oxygen at 4 vvm.
After overnight growth in the bioreactor, the cells of each strain were collected by centrifugation (4700 rpm for 10 min) and cell concentration was determined by microscope counting by Thoma chamber (magnification 400×). The recovered biomass was stored for limited times at 4 °C until use. Once in the winery, each strain culture was suspended and mixed in 1 L of Aglianico grape must and left for 1 h at room temperature in order to allow the cells to adapt to the must. Then, the strain-must mixture was inoculated at a density of approximately 1 × 10⁷ cells/mL in a 1 hL vessel containing 0.90 hL of the same Aglianico grape must. All fermentations were carried out at 25 °C in duplicate by breaking the cap twice a day by gently pressing the skins with a steel plunger. During the process, the fermentative course was monitored daily by measuring the temperature, pH and the reducing sugars by refractometric analysis (°Brix). Before the application, an aliquot of each sample was centrifuged at maximum speed for 5 min to avoid interference from the presence of yeast cells in the suspension. At the end of the fermentation (8 days), samples were collected from each wine and immediately stored at −20 °C until analysis.
Basic chemical parameters of wines, such as ethanol, total sugars, fructose, glucose, total and volatile acidity, and malic and lactic acids, were determined by Fourier transform infrared spectrometry (FTIR) using a Wine Scan analyzer (OenoFoss™, Hillerød, Denmark), calibrated according to OIV [27].

2.3. Microbiological Control

Samples for microbiological control were taken from the grape must (T0) before inoculum and SO2 addition and at the initial (1 day, T1), tumultuous (4 days, T4) and final fermentation (8 days, T8). Samples, taken at different stages of fermentation, were used to count yeast cells and to monitor the persistence of non-Saccharomyces during the process.
Aliquots of 10-fold dilution of the samples were spread onto Wallerstein Laboratory Nutrient Agar medium (WL, Oxoid, Hampshire, UK) [28], and colony counting was performed after 5 days of incubation at 26 °C. The samples were also spread on Lysine agar medium (Oxoid, Hampshire, UK) in order to differentiate Saccharomyces from non-Saccharomyces yeasts, as the former cannot grow on this medium.

2.4. Analysis of Volatile Compounds

The volatile compounds of the obtained wines were analyzed using solid phase micro extraction-gas chromatography-mass spectrometry (SPME-GC/MS) using Agilent 6890 GC gas chromatograph coupled with Agilent 5973 mass spectrometry (MS) detector. DB-WAXetr column, 30 m × 0.25 mm i.d., 0.25 μm film thickness (J&W Scientific, Folsom, CA, USA), was employed and helium as the carrier gas was used with a flow rate of 1.5 mL/min. The injector temperature was 250 °C, and the oven temperature was programmed from 40 °C for 6 min to 180 °C, at 5 °C/min for 3 min, then at 7 °C/min to 240 °C for 5 min.
The fiber used for the extraction of the volatile molecules, in headspace condition, was the polydimethylsiloxane (PDMS) 100 μm. About 20 mL of each sample was placed into a 50 mL amber glass vial containing 3 g of NaCl (saturation level) and 0.5 mL of isooctane as internal standard (IS). The sample vials were equilibrated for 30 min at 40 °C in a thermostated bath. Afterward, the fiber was exposed to the headspace for 20 min, inserting the stainless-steel needle through the vial’s septum and pushing the fiber into the sample headspace to collect the analytes. The fiber was then withdrawn within the needle, and the SPME device was removed from the vial and inserted into the injection port of the GC apparatus for thermal desorption. The analytes removal from the fiber was carried out in the splitless mode at 240 °C for 5 min. Detection was carried out by mass spectrometry on the total ion current obtained by electron impact at 70 eV, and the masses were scanned from m/z 29–300. The volatile compounds were identified by comparison of the mass spectra with the NIST (National Institute of Standards and Technology, Gaithersburg, MD, USA) library database and quantified in equivalent μg/L by comparison of their mass spectra and retentions time on the basis of standard compounds.

2.5. Statistic

All analyses were done in duplicate over two independent samples. Significant differences were pointed out through a 1-way Analysis of Variance (ANOVA) and LSD test as the post-hoc-test; the P-level was set to 0.05. The concentrations of the different compounds were also analyzed through Principal Component Analysis, using the method “SS/(n-1)” to compute the variance and evaluate sample distribution in the factorial space (SS is the sum of squares, and n is the number of observations).
Finally, data on sugar consumption throughout fermentation (as °Bx) were modeled through the shoulder/tail model of Geeraerd et al. [29], cast in the following form:
S = ( S 0 S res ) exp ( k max t ) exp ( k max SL ) 1 + [ exp ( k max SL ) ] exp ( k max t ) + S res
where S is sugar concentration over time (°Bx), t is the time (days), S0 and Sres are the initial and residual sugar concentration, respectively, kmax is the rate of sugar consumption (°Bx/day), and SL is the shoulder length (time before the beginning of sugar decrease, days).
Statistics were done through the software Statistica for Windows (Statsoft, Tulsa, OK, USA).

3. Results

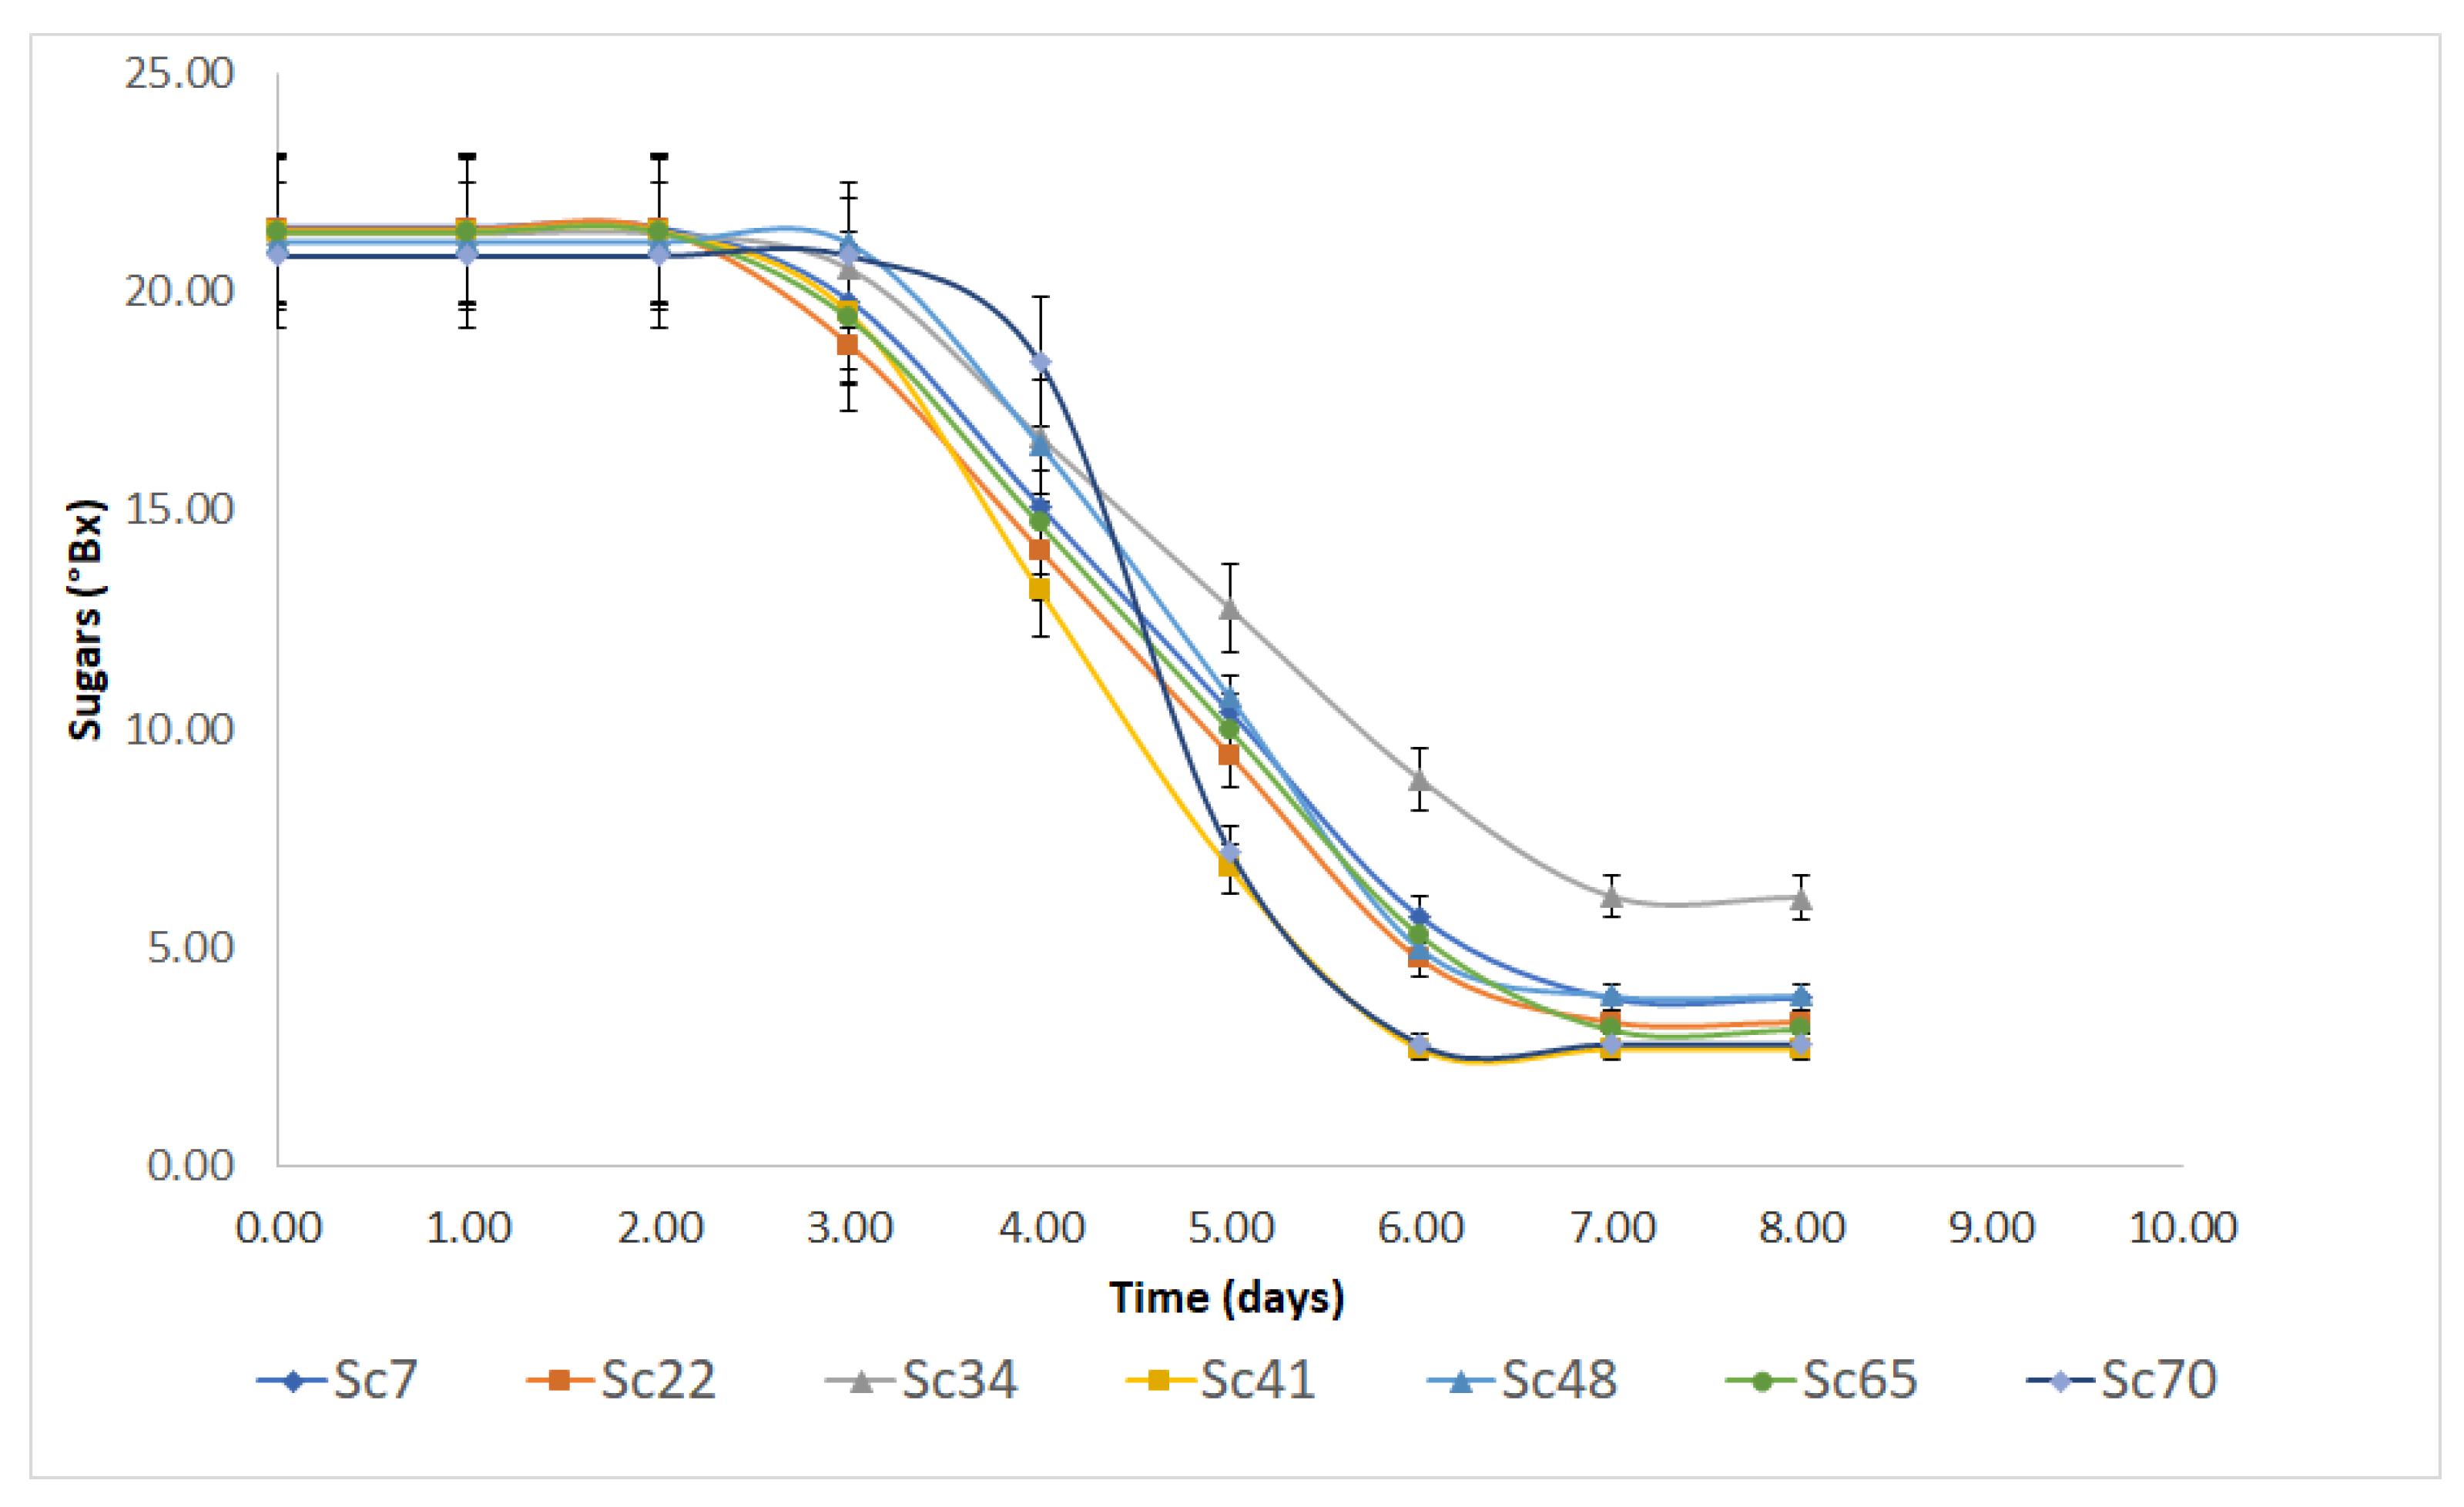
3.1. Fermentation Kinetics and Main End-Products

The fermentation kinetics of S. cerevisiae strains were monitored by assessing sugar concentration to evaluate the time before the beginning of sugar consumption by yeasts (shoulder length), the rate of sugar consumption and the residual amount at the end of the experiment. Data on sugar concentrations were modeled through the shoulder/tail model by Geerared et al. [29]. The fitting lines are in Figure 1, while the kinetic parameters are reported in Table 2.
It is worth mentioning that for the data hereby reported, the tail effect represents the residual concentration at the end of the fermentation assessment in the cellar (8 days), not the final residual concentration of sugars evaluated through chemical methods and shown in Table 3.
Regardless of origin, strains experienced a shoulder length of approximately 3 days (from 2.44 to 2.78 days) without significant differences; concerning the tail, residual sugar concentration was at 2–3 °Bx, except for strain Sc34, which showed a residual sugar concentration, after 8 days of 6.13 °Bx.
The resulting wines were also characterized for some main end-products (ethanol, total and volatile acidity, malic and lactic acids, and sugar concentration at the end of fermentation; Table 3). The amount of ethanol ranged from 11.88 to 12.33% v/v, while the concentration of residual sugars was 1.25–1.45 g/L. Both these parameters were not affected by the kind of strains, as well as total and volatile acidity (8.90–9.65 g/L and 0.25–0.41 g/L, respectively).
The amount of malic acid was 2.38–3.65 g/L, with the lowest concentration in the wine resulting from strain Sc48. The concentration of lactic acid was 0.15–0.70 g/L, with the lowest amount in the wine from strain Sc34 and the highest for strains Sc48 and Sc65 (0.67–0.70 g/L).
The yeast cell loads were evaluated to monitor the persistence of non-Saccharomyces during the process and to confirm that the S. cerevisiae strains were dominant at the end of the fermentation. For this purpose, yeast sampling was performed at different stages of the fermentative process both on WL and Lysine agar medium. At T0 (before S. cerevisiae strains inoculum and the addition of SO2), autochthonous microbiota, belonging only to non-Saccharomyces species, was at the level of about 3.0 × 10⁵ UFC/mL. After the first day (T1), the colonies showing the typical Saccharomyces morphology were about 1.0 × 10⁸ UFC/mL, and the number of non-Saccharomyces was reduced to a level of about 2.1 × 10⁴ UFC/mL. At the middle fermentation time (T4) and at the end (T8), only Saccharomyces strains (3.2 × 10⁸ UFC/mL and 1.0 × 10⁶ UFC/mL, respectively) were found. The presence of non-Saccharomyces only until the second fermentation days was also confirmed by the test on lysine agar. These results underlined that the high level of inoculum (1 × 10⁷ UFC mL) of the S. cerevisiae starter strains, endowed with competitive oenological characteristics, was ensured to completely overcome the presence of non-Saccharomyces autochthonous strains in 72–96 h, also guaranteeing the success of the guided fermentations.

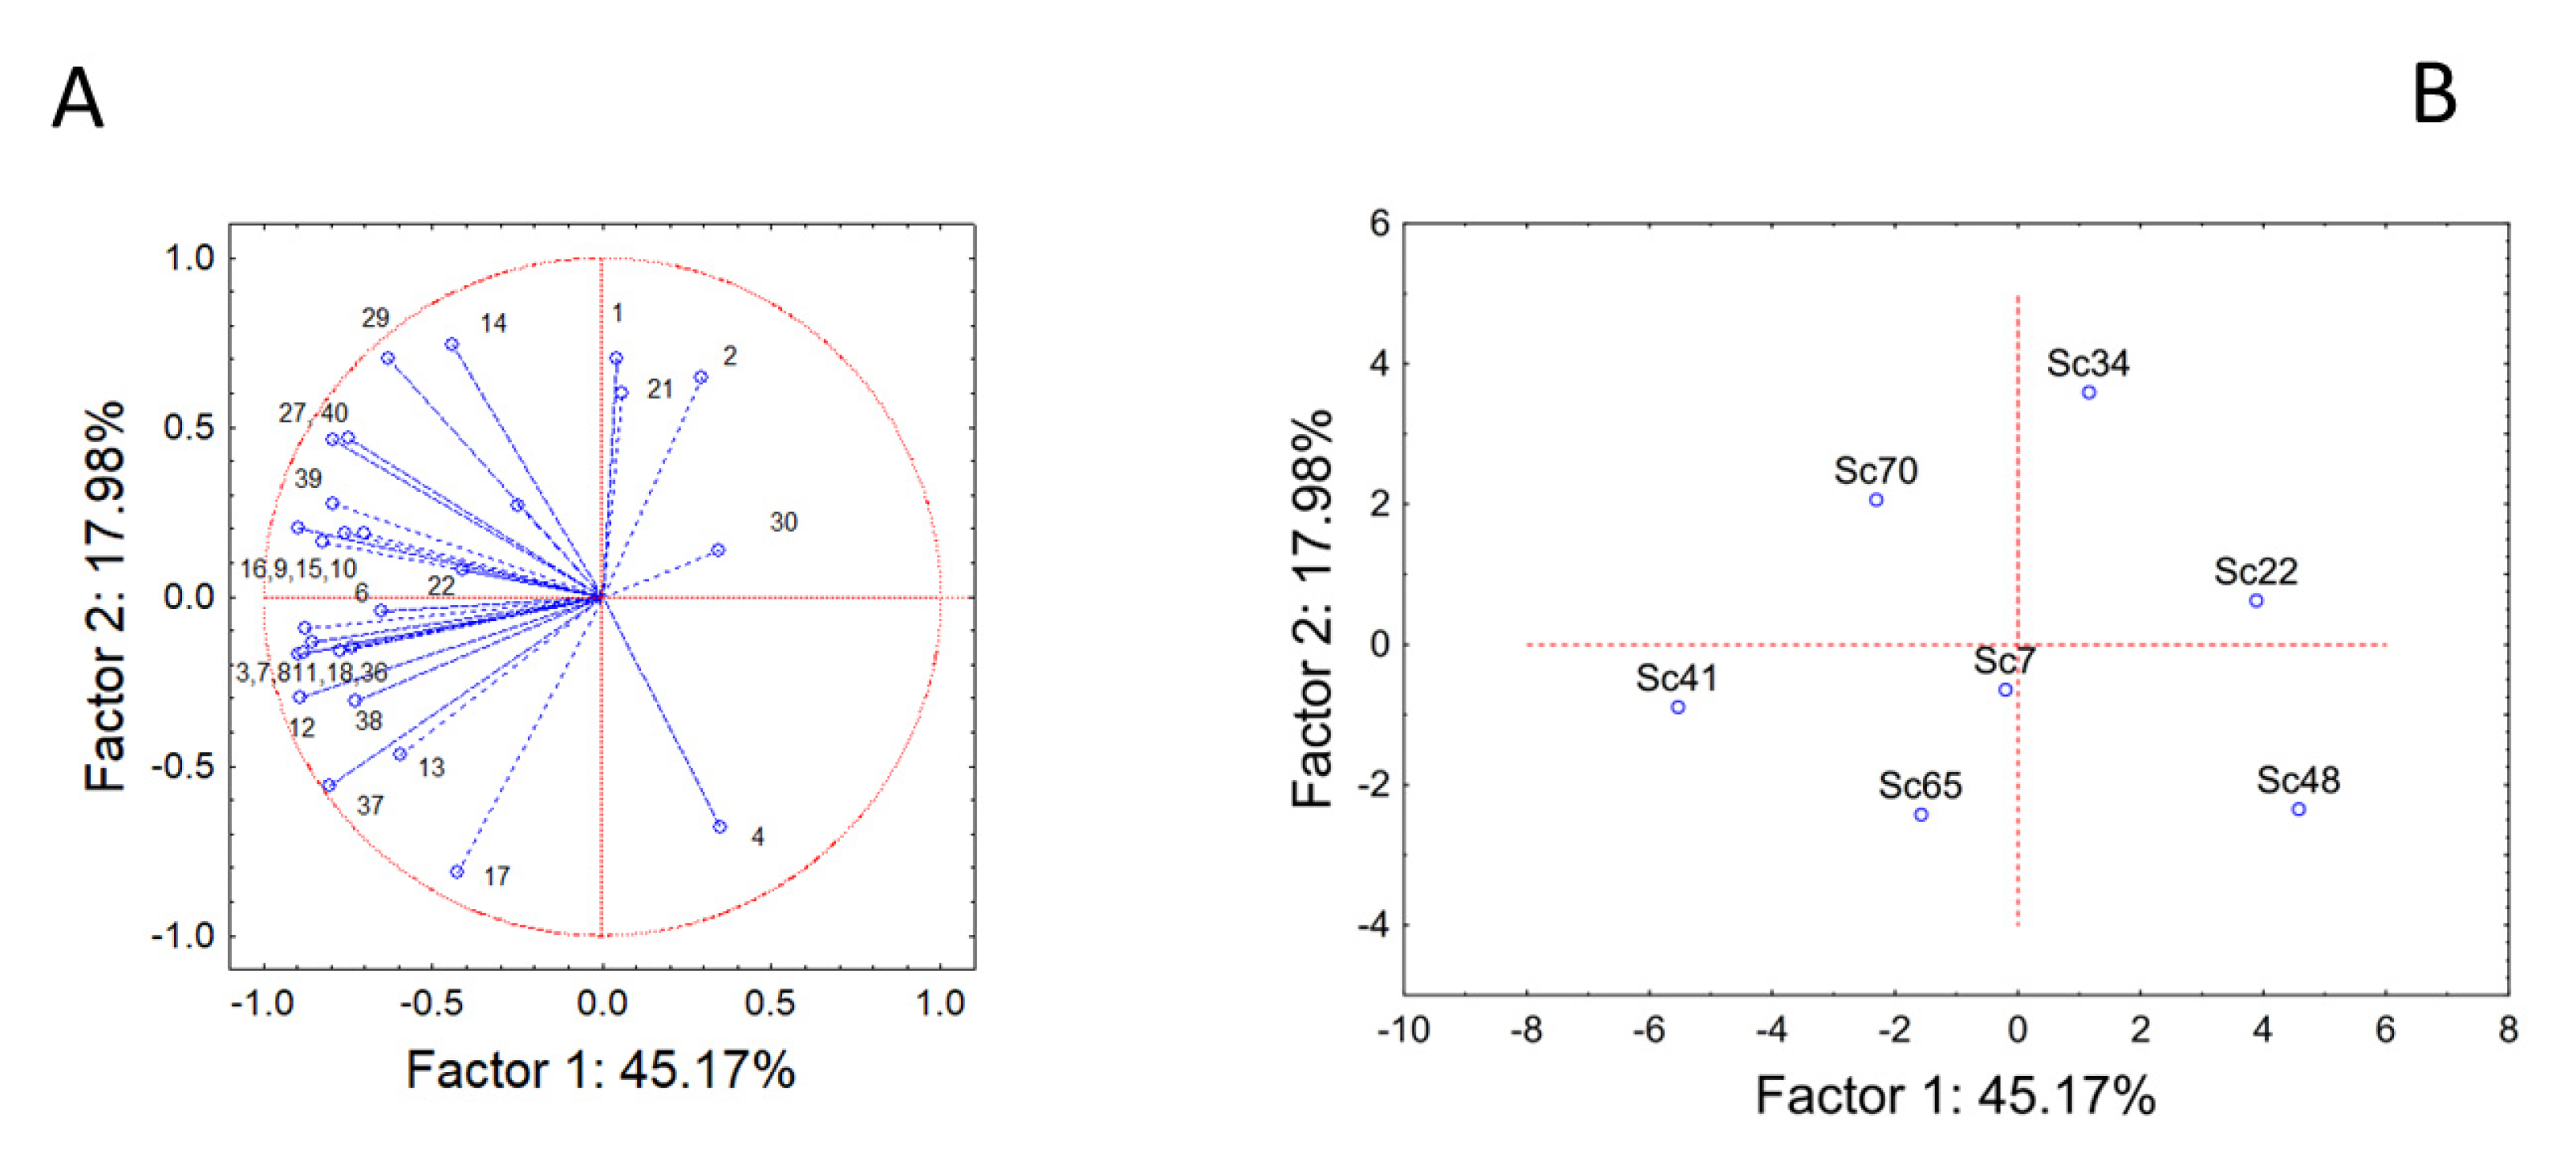
3.2. Volatile Aromatic Compounds

After the assessment of strain performance under real conditions, also the VOCs (volatile organic compounds) were investigated by using a GC/MS/SPME approach, identifying 76 different compounds belonging to six different classes (esters, 42 compounds; alcohols, 16 compounds; terpenes, six compounds; aldehydes, seven compounds; acids, three compounds; ketones, three compounds).
The total amount of esters, alcohols, aldehydes and terpenes is reported in Table 4. The strains showed different trends and significant differences, and for each class of compounds, high-producing and low-producing strains were found. In the case of esters, the lowest producer was strain Sc48 (946.10 μg/L), and the highest producer was strain Sc34 (1863.55 μg/L), followed by strains Sc41, Sc65, and Sc70 (1290–1350 μg/L), while for the other classes of VOCs, strain Sc41 was always the highest producer (2374.80 μg/L of alcohols, 52.45 μg/L of terpenes and 156.44 μg/L of aldehydes). Acids and ketones were always below the detection limit or at very low concentrations (max 0.15 μg/L) (data not shown).
The amounts of esters, alcohols, aldehydes, and terpenes were used as input variables for a Principal Component Analysis to assess the global differences of the strains, as shown in Figure 2. The analysis accounted for ca. 91% of the total variability; alcohols, terpenes, and aldehydes were mainly related to component 1 (factor correlation between −0.80 to −0.94), while esters’ amount was related to component 2 (factor correlation at 0.83) (Figure 2A). The strains were clustered in the factorial space in three different groups (labeled as 1, 2 and 3) (Figure 2B). Group 1 was composed of strains Sc65, Sc22, and Sc48, which were characterized by very similar trends and the low production of VOCs. On the other hand, group 3 comprised only strain Sc41, which was generally characterized by a high production of VOCs, mainly alcohols, aldehydes, and terpenes.
Finally, an intermediate group (medium producers) was found (strains Sc7, Sc70, and Sc34). The strains belonging to this group showed similar trends for alcohols, aldehydes, and terpenes but not for esters, as strain Sc34 was an ester/high-producer.
Then, a second series of PCA was run using the amounts of the different esters (Figure 3) and alcohols (Figure 4). The compounds with very low concentrations or below the detection limit were excluded (for example, in the case of esters, methyl butyrate, isobutyl hexanoate, methyl octanoate, ethyl dodecanoate, ethyl dihydrocinnamate, ethyl cinnamate, ethyl 2-hydroxyisovalerate, ethyl 3-hydroxybutyrate and others). In addition, the analysis was not done for aldehydes and terpenes due to the low number of compounds. The actual amount of the different compounds, the odor and threshold values are summarized in Supplementary Table S1.
PCA run on esters is reported in Figure 3. The analysis accounted for 63% of the total variability, and the input variables were either related to component 1 or component 2. The compounds 1 (ethyl propanoate, threshold level (TL) 2.1 mg/L), 2 (ethyl isobutyrate, TL 0.6 mg/L), 4 (propyl acetate, TL 0.2 mg/L), 14 (ethyl hexanoate, TL 0.05 mg/L), 17 (ethyl heptanoate, TL 0.6 mg/L), 21 (ethyl octanoate, TL 0.02 mg/L), and 29 (ethyl phenylacetate, TL 0.25 mg/L) were related to the component 2, while the others to the component 1 (Figure 3A).
Strain distribution in the factorial space is complex, and it was not possible to point out groups with homogeneous trends (Figure 3B). Strain Sc41 was characterized by the high amount of many esters, like isoamyl acetate (compound 11), ethyl hexanoate (compound 14), and ethyl butanoate (compound 3). Strain Sc34 (the highest ester producer, at least in terms of the total amount) was characterized by the highest production of ethyl propanoate (compound 1), ethyl isobutyrate (compound 2), and ethyl octanoate (compound 21).
The other strains showed the highest production for some specific compounds, but their concentration was generally lower than the molecules reported for strains Sc41 and Sc34.
PCA run on alcohols accounted for 75% of the total variability. The input variables generally were related to component 1, except for the compounds 46 (1-pentanol, TL 80 mg/L), 47 (4-methyl-1-pentanol, TL 50 mg/L), 50 (cis-3-hexen-1-ol, TL 0.4 mg/L) and 56 (benzyl alcohol), which showed a correlation with the factor 2 (factor correlations between 0.64 and 0.73) (Figure 4A). The factorial distribution of the strains reproduced the distribution in three classes, as reported for the PCA with the total amounts of the different classes. In fact, strain Sc41 showed a completely different trend from all other strains, as it generally produced a high amount of all alcohols. In the other groups, strains Sc34 and Sc7 showed a similar trend, as well as strains Sc22 and Sc48 (Figure 4B).

4. Discussion

The first aim of the present research was to select S. cerevisiae strains able to work at an up-scale level and to impart to the Aglianico wine-specific volatile molecule fingerprinting in relation to the strain used. In the present experimental work, the seven tested strains were evaluated at pilot-scale mimicking conditions closed as much as possible to the real conditions, and, according to our knowledge, this is one of the few pieces of experimental evidence performed at the pilot scale also assessing the final wine aroma profile. Although lab-scale fermentations offer numerous options for sampling and control of fermentation conditions, they are unable to mimic pilot- or industrial-scale fermenters, especially in relation to secondary metabolism, such as aroma production by yeasts [24]. Instead, pilot-scale fermentations in 100 L tanks are described as well-adapted for mimicking industrial fermentations [30].
The seven wild strains were chosen according to parameters that make them highly competitive due to a combination of properties [31], such as fast growth, efficient glucose consumption, good ability to produce ethanol, high tolerance to ethanol and medium relative demand of nitrogen, have exhibited fermentative profiles comparable to the commercial strain generally employed for Aglianico wine production such as S. cerevisiae FE (Fermol Elegance) [32]. In fact, the tested S. cerevisiae strains were able to efficiently convert the grape sugars to alcohol, fitting the primary selection criteria of yeast strain selection [5]. In particular, strains Sc41 and Sc70 showed the highest rate of sugar consumption, even if the residual sugars were at an acceptable level for all the tested strains. Also, the volatile acidity detected for all the final wines responded to the required selection criteria according to strain ability for volatile acidity, which needs to be lower than 0.45 g/L. As regards the microbial cell loads detected on WL and lysine medium, the results confirmed the dominance of S. cerevisiae strains on non-Saccharomyces ones during the evolution of the guided fermentations, confirming the data present in the literature [11,33]. Furthermore, the high inoculum level of the strains (1.0 × 10⁷ UFC/mL) ensured the predominance over non-Saccharomyces yeasts, considering that their development is strongly inhibited by the initial concentration of the starter culture and by its growth rate during vinification.
Until a few decades ago, wine yeasts were selected basically on their ability to quickly transform grape sugars into ethanol, their resistance to sulfur dioxide and their low acetic acid production. Actually, their role has been significantly enlarged by the advent of modern oenological microbiology, and thus, their selection has involved the addition of criteria that take into account the improvement of wine quality in terms of color, aroma, structure, technological, and also healthy properties [34,35]. The importance of these criteria depends on the type and style of wine to be made as well as the requirements of the winery. In particular, the selection of yeast strains according to the generated volatile aroma profiles has been largely considered by several authors since the yeast strain’s ability to impart good sensory features is one of the most important criteria. In fact, although the complexity of wine aroma can also vary depending on many variables such as the type of grape variety, terroir, microbial starter, fermentation process, aging, and bottling, the selection of new wild strains within the species S. cerevisiae, able to satisfy conventional selection criteria and impart new aroma volatile profile could be a useful tool to enlarge the gamma of sensory properties of wine products [32,36]. In fact, consumers, who are increasingly more demanding, are looking for distinctive characteristics in wines, and this encourages the producers and researchers to develop biotechnological strategies (including new strain selection) to improve the aromatic complexity of wines. The challenge is actually to find new wild strains able to work on winery conditions. In fact, the literature shows a huge amount of research works based on lab trials, but few are focused on up-scale conditions [37].
The volatile wine profiles of the present work were obtained by GC/MS/SPME, a technique widely used for this type of sample due to the high volatility of esters and alcohols, particularly. Moreover, the volatile fingerprinting obtained throughout the headspace analysis technique results in profiles closed to the perception of the panelist [35]. The results showed that the tested S. cerevisiae strains influenced and drove wine volatile molecule profiles in a strain-dependent way, imparting specific features to the obtained wines. In particular, in our experimental conditions, the inoculation with S. cerevisiae Sc41 resulted in wine characterized by large amounts of alcohols, terpenes and aldehydes able to impart specific flavor notes to the final wine.
Differently, strain Sc34 was the highest producer of esters in terms of amount, followed by strain Sc41. Since different authors have found great variability in wine volatile molecule profile in relation to the S. cerevisiae strain tested [38], emphasizing the potential role of this parameter as a trait for starter culture selection also to enlarge the potential of diversification of the wine sector, the selection of the best-performing yeasts could be done according to the traits to impart to the final product. In general, esters are formed by yeasts during the alcoholic fermentation, and they are responsible for the fruity odor, while terpenic and nor-isoprenoid compounds are the most important constituent of the varietal aroma of grapes and confer a flowery odor to the wine [39].
From a technological point of view, it could be interesting to find yeast strains able to increase linalool, a-terpineol, and citronellol, able to impart citrus and peach flavor notes, throughout their B-glucosidase activity, a trait not very common among S. cerevisiae strains [40]. Particularly, volatile esters constitute one of the most important classes of aroma compounds and are largely responsible for the fruity aromas associated with wine and other fermented beverages [19,41,42]. Their formation differs widely among yeast strains, and other external factors such as fermentation temperature, nutrient availability, pH, unsaturated fatty acid/sterol levels, and oxygen levels could contribute, all playing an important part in determining the end levels of esters in a wine.
Our research suggested that, in real conditions, S. cerevisiae Sc41 was able to produce high amounts of many esters, like isoamyl acetate (TL 0.03 mg/L), ethyl hexanoate (TL 0.05 mg/L), ethyl butanoate (TL 0.6 mg/L), which are largely described to contribute to fruity aromas (pineapple, apricot). On the other hand, strain Sc34 (the highest ester producer, at least for the total amount) was characterized by the highest production of ethyl propanoate (TL 2.1 mg/L), ethyl isobutyrate (TL 0.6 mg/L) and ethyl octanoate (TL 0.02 mg/L).
Regarding alcohols, which play a fundamental role since they usually have a strong, pungent smell, particularly when exceeding 400 mg/L, all the samples contained 2-phenyl-ethanol responsible for honey, spice, rose, and lilac nuances even if below the concentration threshold (0.75 mg/L). Strain Sc41 produced the highest amount of 2-phenyl-ethanol and benzyl alcohol recognized for their rose and fruity note, respectively.
Sc41produced also the highest amount of hexanol (TL 4 mg/L) able to impart grass note.
Nevertheless, the ratio among the volatile molecules plays an important role in defining the final wine flavor and taste and not only the individual compounds. Also, the interaction with non-volatile compounds needs to be taken into consideration.
According to the final features intended to impart to the product in terms of alcohols or esters, a proper selection can be defined. In fact, although all the strains showed the potential to ferment Aglianico must, different profiles for volatile compounds were identified, and this trait is fundamental for strain selection.

5. Conclusions

The selection of starter cultures is a complex process, and many researchers stop their experiments after a preliminary laboratory validation, while in this article, a fermentation with 100 L (with independent batches for each strain) was carried out. Although lab-scale fermentations offer numerous options for sampling and control of fermentation conditions, they are unable to mimic pilot- or industrial-scale fermenters, especially in relation to secondary metabolism, such as aroma production by yeasts. At the same time, pilot-scale fermentations in 100 L tanks are described as suitable for mimicking industrial fermentations, producing even reproducible results.
In conclusion, since the present work was performed at a pilot-scale level, mimicking as much as possible real working conditions, the results obtained can be considered as a validation of the screened S. cerevisiae strains and a strategy to discriminate a strain, among others, to impart desired wine sensory “features,” also providing to the experts of the sector exploitable information for operating in cellars.

Supplementary Materials

The following supporting information can be downloaded at: https://www.mdpi.com/article/10.3390/fermentation9030245/s1, Table S1: Amounts of esters, alcohols, terpenes (equivalent µg/L) and their odor and threshold values. The numbers in the column “code” are those used as a symbol of the molecules in the PCA (Figure 3 and Figure 4). In a row, values with different letters are significantly different (one-way ANOVA and LSD test, p < 0.05).

Author Contributions

Conceptualization, P.R., F.P. and A.B.; methodology, P.R., F.P. and A.B.; software, D.G. and G.S.; validation, F.P., A.B. and P.R.; formal analysis, all; investigation, all; resources, P.R., F.P. and A.C.; data curation, D.G. and G.S.; writing—original draft preparation, P.R., A.B. and F.P.; writing—review and editing, all; visualization, all; supervision, P.R., A.B., F.P. and G.S.; project administration, A.B., F.P. and P.R. All authors have read and agreed to the published version of the manuscript.

Funding

DC received a grant from the Apulia Region (funder) for her researcher position through the call REFIN (funding number: UNIFG283).

Institutional Review Board Statement

Not applicable.

Informed Consent Statement

Not applicable.

Data Availability Statement

The data presented in this study are available in the article.

Acknowledgments

A.C. was supported by the project PSR Regione Basilicata 2014–2020, sottomisura 16.2 IN.VINI.VE.RI.TA.S (Innovare la viti-VINIcoltura lucana: VErso la RIgenerazione varieTAle, la Selezione di vitigni locali e proprietà antiossidanti dei vini), N. 976. JRU MIRRI-IT is greatly acknowledged for scientific support.

Conflicts of Interest

The authors declare no conflict of interest or any role of the funding sponsors in the choice of the research project; design of the study; in the collection, analyses or interpretation of data; in the writing of the manuscript; or in the decision to publish the results.

References

  1. Pretorius, I.S. Tasting the terroir of wine yeast innovation. FEMS Yeast Res. 2020, 20, foz084. [Google Scholar] [CrossRef] [PubMed] [Green Version]
  2. Van der Westhuizen, T.J.; Augustyn, O.P.H.; Pretorius, I.S. Geographical distribution of indigenous Saccharomyces cerevisiae strains isolated from vineyards in the coastal regions of the Western Cape in South Africa. S. Afr. J. Enol. Vitic. 2000, 21, 3–10. [Google Scholar] [CrossRef] [Green Version]
  3. Torija, M.J.; Rozès, N.; Poblet, M.; Guillamón, J.M.; Mas, A. Yeast population dynamics in spontaneous fermentations: Comparison between two different wineproducing areas over a period of three years. Antonie Van Leeuwenhoek 2001, 79, 345–352. [Google Scholar] [CrossRef] [PubMed]
  4. Lopes, C.A.; van Broock, M.; Querol, A.; Caballero, A.C. Saccharomyces cerevisiae wine yeast populations in a cold region in Argentinean Patagonia. A study at different fermentation scales. J. Appl. Microbiol. 2002, 93, 608–615. [Google Scholar] [CrossRef] [PubMed]
  5. Pretorius, I.S. Tailoring wine yeast for the new millennium: Novel approaches to the ancient art of winemaking. Yeast 2000, 16, 675–729. [Google Scholar] [CrossRef]
  6. Nikolaou, E.; Soufleros, E.H.; Bouloumpasi, E.; Tzanetakis, N. Selection of indigenous Saccharomyces cerevisiae strains according to their oenological characteristics and vinification results. Food Microbiol. 2006, 23, 205–211. [Google Scholar] [CrossRef]
  7. Capece, A.; Romaniello, R.; Pietrafesa, R.; Romano, P. Indigenous Saccharomyces cerevisiae yeasts as a source of biodiversity for the selection of starters for specific fermentations. BIO Web Conf. 2014, 3, 02003. [Google Scholar] [CrossRef] [Green Version]
  8. Legras, J.L.; Merdinoglu, D.; Cornuet, J.M.; Karst, F. Bread, beer and wine: Saccharomyces cerevisiae diversity reflects human history. Mol. Ecol. 2007, 16, 2091–2102. [Google Scholar] [CrossRef]
  9. Borneman, A.R.; Forgan, A.H.; Pretorius, I.S.; Chambers, P.J. Comparative genome analysis of Saccharomyces cerevisiae wine strain. FEMS Yeast Res. 2008, 8, 1185–1195. [Google Scholar] [CrossRef] [Green Version]
  10. Liti, G.; Carter, D.M.; Moses, A.M.; Warringer, J.; Parts, L.; James, S.A.; Davey, R.P.; Roberts, I.N.; Burt, A.; Koufopanou, V.; et al. Population genomics of domestic and wild yeasts. Nature 2009, 458, 337–341. [Google Scholar] [CrossRef] [Green Version]
  11. Capece, A.; Pietrafesa, R.; Siesto, G.; Romaniello, R.; Condelli, N.; Romano, P. Selected Indigenous Saccharomyces cerevisiae Strains as Profitable Strategy to Preserve Typical Traits of Primitivo Wine. Fermentation 2019, 5, 87. [Google Scholar] [CrossRef] [Green Version]
  12. Carrau, F.M.; Medina, K.; Farina, L.; Boido, E.; Henschke, P.A.; Dellacassa, E. Production of fermentation aroma compounds by Saccharomyces cerevisiae wine yeasts: Effects of yeast assimilable nitrogen on two model strains. FEMS Yeast Res. 2008, 8, 1196–1207. [Google Scholar] [CrossRef] [PubMed] [Green Version]
  13. Romano, P.; Caruso, M.; Capece, A.; Lipani, G.; Paraggio, M.; Fiore, C. Metabolic diversity of Saccharomyces cerevisiae strains from spontaneously fermented grape musts. World J. Microbiol. Biotechnol. 2003, 19, 311–315. [Google Scholar] [CrossRef]
  14. Callejon, R.; Clavijo, A.; Ortigueira, P.; Troncoso, A.M.; Paneque, P.; Morales, M.L. Volatile and sensory profile of organic red wines produced by different selected autochthonous and commercial Saccharomyces cerevisiae strains. Anal. Chim. Acta 2010, 660, 68–75. [Google Scholar] [CrossRef]
  15. Orlić, S.; Vojvoda, T.; Babić, K.H.; Arroyo-López, F.N.; Jeromel, A.; Kozina, B.; Iacumin, L.; Comi, G. Diversity and oenological characterization of indigenous Saccharomyces cerevisiae associated with Žilavka grapes. World J. Microbiol. Biotechnol. 2010, 26, 1483–1489. [Google Scholar] [CrossRef]
  16. Knight, S.; Klaere, S.; Fedrizzi, B.; Goddard, M.R. Regional microbial signatures positively correlate with differential wine phenotypes: Evidence for a microbial aspect to terroir. Sci. Rep. 2015, 5, 14233. [Google Scholar] [CrossRef] [Green Version]
  17. Bokulich, N.A.; Collins, T.S.; Masarweh, C.; Allen, G.; Heymann, H.; Ebeler, S.E.; Mills, D.A. Associations among wine grape microbiome, metabolome, and fermentation behaviour suggest contribution to regional wine characteristics. mBio 2016, 7, 1–12. [Google Scholar] [CrossRef] [Green Version]
  18. Anagnostopoulos, D.A.; Kamilari, E.; Tsaltas, D. Contribution of the Microbiome as a Tool for Estimating Wine’s Fermentation Output and Authentication. In Advances in Grape and Wine Biotechnology; Morata, A., Loira, I., Eds.; IntechOpen: London, UK, 2019; pp. 1–21. [Google Scholar]
  19. Romano, P.; Braschi, G.; Siesto, G.; Patrignani, F.; Lanciotti, R. Role of Yeasts on the Sensory Component of Wines. Foods 2022, 11, 1921. [Google Scholar] [CrossRef]
  20. Bruwer, J.; Alant, K.; Li, C.; Bastian, S. Wine Consumers and Makers: Are They Speaking the Same Language? Aust. N. Z. Grapegrow. Winemak. 2005, 496, 80–84. [Google Scholar]
  21. Jackson, R.S. Wine Science. Principles and Applications, 3rd ed.; Academic Press: San Diego, CA, USA, 2008. [Google Scholar]
  22. Petropulos, V.I.; Bogeva, E.; Stafilov, T.; Stefova, M.; Siegmund, B.; Pabi, N.; Lankmayr , E. Study of the Influence of Maceration Time and Oenological Practices on the Aroma Profile of Vranec Wines. Food Chem. 2014, 165, 506–514. [Google Scholar] [CrossRef]
  23. Cadiere, A.; Aguera, E.; Caille, S.; Ortiz-Julien, A.; Dequin, S. Pilot-scale evaluation the enological traits of a novel, aromatic wine yeast strain obtained by adaptive evolution. Food Microbiol. 2012, 32, 332–337. [Google Scholar] [CrossRef] [PubMed]
  24. Casalta, E.; Aguera, E.; Picou, C.; Rodriguez Bencomo, J.J.; Salmon, J.-M.; Sablayrolles, J.-M. A comparison of laboratory and pilot-scale fermentations in winemaking conditions. Appl. Microbiol. Biotechnol. 2010, 7, 1665–1673. [Google Scholar] [CrossRef] [PubMed]
  25. Romano, P.; Fiore, C. Influenza del ceppo di lievito autoctono sulle qualità organolettiche del vino. In Proceedings of the Workshop POM A01project on Raccolta Meccanica Delle Uve da Vino in Ambienti Meridionali ed Insulari Italiani, Senorbi, Italy, 8 May 2001. [Google Scholar]
  26. Kashyap, D.R.; Vohra, P.K.; Chopra, S.; Tewari, R. Applications of pectinases in the commercial sector: A review. Bioresour. Technol. 2001, 77, 215–227. [Google Scholar] [CrossRef] [PubMed]
  27. Anonymous. Guidelines on Infrared Analysers in Oenology. OIV/OENO Resolution 390/2010; International Organization of Vine and Wine General Assembly (OIV): Tbilisi, Georgia, 2010. [Google Scholar]
  28. Pallmann, C.L.; Brown, J.A.; Olineka, T.L.; Cocolin, L.; Mills, D.A.; Bisson, L.F. Use of WL Medium to Profile Native Flora Fermentations. Am. J. Enol. Vitic. 2001, 52, 3. [Google Scholar] [CrossRef]
  29. Geeraerd, A.H.; Herremans, C.H.; Van Impe, J.F. Structural model requirements to describe microbial inactivation during mild heat treatment. Int. Food Microbiol. 2000, 56, 185–209. [Google Scholar] [CrossRef]
  30. Aguera, E.; Sablayrolles, J.M. Vinification à l’échelle pilote (100 L). II Caractérisation—Intérêt. Wine Internet Techn. J. 2005, 7, 1–9. [Google Scholar]
  31. Piskur, J.; Rozpedowska, E.; Polakova, S. How did Saccharomyces evolve to become a good brewer? Trends Genet. 2006, 22, 183–186. [Google Scholar] [CrossRef]
  32. Testa, B.; Coppola, F.; Lombardi, S.; Iorizzo, M.; Letizia, F.; Di Renzo, M.; Succi, M.; Tremonte, P. Influence of Hanseniaspora uvarum AS27 on Chemical and Sensorial Characteristics of Aglianico Wine. Processes 2021, 9, 326. [Google Scholar] [CrossRef]
  33. Salvadò, Z.; Arroyo-Lòpez, F.N.; Barrio, E.; Querol, A.; Guillamòn, J.M. Quantifying the individual effect of ethanol and temperature on the fitness advantage of Saccharomyces cerevisiae. Food Microbiol. 2011, 28, 1155–1161. [Google Scholar] [CrossRef]
  34. Fleet, G.H. Wine yeasts for the future. FEMS Yeast Res. 2008, 8, 979–995. [Google Scholar] [CrossRef] [Green Version]
  35. Patrignani, F.; Chinnici, F.; Serrazanetti, D.I.; Vernocchi, P.; Ndagijimana, M.; Riponi, C.; Lanciotti, R. Production of Volatile and Sulfur Compounds by 10 Saccharomyces cerevisiae Strains Inoculated in Trebbiano Must. Front. Microbiol. 2016, 7, 243. [Google Scholar] [CrossRef] [PubMed] [Green Version]
  36. Belda, I.; Ruiz, J.; Esteban-Fernández, A.; Navascués, E.; Marquina, D.; Santos, A.; Moreno-Arribas, M.V. Microbial Contribution to Wine Aroma and Its Intended Use for Wine Quality Improvement. Molecules 2017, 22, 189. [Google Scholar] [CrossRef] [PubMed] [Green Version]
  37. Rossouw, D.; Jacobson, D.; Bauer, F.F. Transcriptional regulation and the diversification of metabolism in wine yeast strains. Genetics 2012, 190, 251–261. [Google Scholar] [CrossRef] [PubMed] [Green Version]
  38. Capece, A.; Romano, P. Yeasts and their metabolic impact on wine flavour. In Yeasts in the Production of Wine; Romano, P., Ciani, M., Fleet, G.H., Eds.; Springer: Berlin, Germany, 2019; pp. 43–80. [Google Scholar]
  39. Vararu, F.; Moreno-García, J.; Zamfir, C.I.; Cotea, V.V.; Moreno, J. Selection of aroma compounds for the differentiation of wines obtained by fermenting musts with starter cultures of commercial yeast strains. Food Chem. 2016, 197, 373–381. [Google Scholar] [CrossRef]
  40. Vernocchi, P.; Patrignani, F.; Ndagijimana, M.; Lopez, C.C.; Suzzi, G.; Gardini, F.; Lanciotti, R. Trebbiano wine produced by using Saccharomyces cerevisiae strains endowed with β-glucosidase activity. Ann. Microbiol. 2015, 65, 1565–1571. [Google Scholar] [CrossRef]
  41. Sumby, K.M.; Grbin, P.R.; Jiranek, V. Microbial modulation of aromatic esters in wine: Current knowledge and future prospects. Food Chem. 2010, 121, 1–16. [Google Scholar] [CrossRef]
  42. Parpinello, G.P.; Ricci, A.; Folegatti, B.; Patrignani, F.; Lanciotti, R.; Versari, A. Unraveling the potential of cryotolerant Saccharomyces eubayanus in Chardonnay white wine production. LWT 2020, 134, 110183. [Google Scholar] [CrossRef]
Figure 1. Kinetic of sugar consumption by the seven S. cerevisiae strains. Bars represent standard deviation, while lines are the best fit through the model of Geeraerd et al. [29].
Fermentation 09 00245 g001
Figure 2. Principal Component Analysis run on the total amounts of esters, terpenes, alcohols, and aldehydes. (A) variables’ projection; (B) cases’ projection.
Fermentation 09 00245 g002
Figure 3. Principal Component Analysis run on esters. (A) variables’ projection; (B) cases’ projection.
Fermentation 09 00245 g003
Figure 4. Principal Component Analysis run on alcohols. (A) variables’ projection; (B) cases’ projection.
Fermentation 09 00245 g004
Table 1. Origin and grape variety of S. cerevisiae strains used in this study.
StrainOriginGrape Vine Variety
Sc7ApuliaBombino nero (red)
Sc22CampaniaFiano (white)
Sc34BasilicataAglianico Vulture (red)
Sc41SicilyNero d’Avola (red)
Sc48SardiniaVermentino (white)
Sc65ApuliaAglianico (red)
Sc70SardiniaCannonau (red)
Table 2. Kinetic of sugar consumptions for the seven strains of S. cerevisiae: fitting parameters evaluated through shoulder-tail model. SL, shoulder length (time before the beginning of sugar consumption, days). kmax, rate of sugar consumption (°Bx/day) Sres, sugar residual (°Bx). Mean values ± standard error. For each column, letters indicate significant differences (one-way ANOVA and LSD test, p < 0.05).
StrainSLkmaxSres
Sc72.65 ± 0.25 A10.82 ± 1.09 A3.85 ± 0.74 A
Sc222.44 ± 0.26 A10.81 ± 1.07 A3.28 ± 0.72 A
Sc342.82 ± 0.30 A9.03 ± 1.09 A6.13 ± 0.71 B
Sc412.71 ± 0.30 A14.65 ± 2.62 A2.65 ± 0.89 A
Sc483.20 ± 0.32 A13.34 ± 2.08 A3.89 ± 0.87 A
Sc652.58 ± 0.27 A10.85 ± 1.12 A3.13 ± 0.77 A
Sc703.78 ± 0.12 A25.79 ± 3.27 B2.77 ± 0.58 A
Table 3. End-products and residual sugars in the wines obtained by the seven S. cerevisiae strains. Mean ± standard deviation. For each column, letters indicate significant differences (one-way ANOVA and LSD test, p < 0.05).
StrainEthanol
(%, v/v)
Sugars
(g/L)
Total Acidity (g/L)Volatile Acidity (g/L)Malic Acid (g/L)Lactic Acid (g/L)
Sc711.88 ± 0.41 A1.45 ± 0.07 A9.65 ± 0.68 A0.37 ± 0.04 A3.00 ± 0.30 B0.60 ± 0.11 C, D
Sc2212.20 ± 0.14 A1.25 ± 0.07 A9.25 ± 0.59 A0.33 ± 0.05 A3.30 ± 0.25 B0.60 ± 0.06 C, D
Sc3412.04 ± 0.07 A1.23 ± 0.11 A9.35 ± 1.64 A0.25 ± 0.06 A2.90 ± 0.21 A, B0.15 ± 0.04 A
Sc4112.32 ± 0.10 A1.45 ± 0.07 A8.90 ± 0.66 A0.41 ± 0.08 A3.20 ± 0.21 B0.45 ± 0.08 B, C
Sc4811.97 ± 0.10 A1.55 ± 0.07 A9.55 ± 1.53 A0.37 ± 0.06 A2.38 ± 0.22 A0.70 ± 0.01 D
Sc6512.20 ± 0.11 A1.25 ± 0.07 A9.55 ± 0.78 A0.35 ± 0.06 A3.65 ± 0.35 B0.67 ± 0.13 D
Sc7012.33 ± 0.10 A1.40 ± 0.14 A9.45 ± 0.17 A0.26 ± 0.03 A3.00 ± 0.23 B0.40 ± 0.03 B
Table 4. Total amounts of esters, alcohols, terpenes and aldehydes produced by the seven S. cerevisiae strains (equivalent µg/L). Mean values ± standard deviation. For each column, letters indicate significant differences (one-way ANOVA and LSD test, p < 0.05).
StrainEstersAlcoholsTerpenesAldehydes
Sc71142.01 ± 55.87 B1825.21 ± 81.02 D36.61 ± 1.97 B120.15 ± 6.59 B
Sc221024.21 ± 28.37 A,B1388.67 ± 40.11 B28.33 ± 0.68 A85.57 ± 1.85 A
Sc341863.55 ± 13.33 D1562.44 ± 49.94 B,C45.99 ± 1.75 C93.17 ± 11.42 A
Sc411345.58 ± 57.59 C2374.80 ± 186.40 E52.45 ± 1.99 D156.44 ± 13.94 C
Sc48946.10 ± 94.82 A1413.19 ± 19.02 B,C26.28 ± 0.38 A83.55 ± 2.20 A
Sc651290.20 ± 63.24 C1123.17 ± 15.75 A28.69 ± 0.18 A118.63 ± 7.43 B
Sc701350.42 ± 0.53 C1592.37 ± 12.17 C46.57 ± 2.05 C109.20 ± 0.56 B
Disclaimer/Publisher’s Note: The statements, opinions and data contained in all publications are solely those of the individual author(s) and contributor(s) and not of MDPI and/or the editor(s). MDPI and/or the editor(s) disclaim responsibility for any injury to people or property resulting from any ideas, methods, instructions or products referred to in the content.

