Article

Overexpression of a Novel Vacuolar Serine Protease-Encoding Gene (spt1) to Enhance Cellulase Production in Trichoderma Reesei

State Key Laboratory of Microbial Technology, Institute of Microbial Technology, Shandong University, Qingdao 266237, China
*
Author to whom correspondence should be addressed.
These authors contributed equally to this work.
Fermentation 2023, 9(2), 191; https://doi.org/10.3390/fermentation9020191
Submission received: 31 January 2023 / Revised: 14 February 2023 / Accepted: 16 February 2023 / Published: 19 February 2023
(This article belongs to the Special Issue Biorefinery of Lignocellulosic Biomass)

Abstract

:
Trichoderma reesei is widely applied as the major industrial fungus for the production of cellulases used for the conversion of lignocellulosic biomass to biofuels and other biobased products. The protein secretion pathway is vital for cellulase secretion, but few reports are related to the role of the vacuole in cellulase production. Here, we identified a novel vacuolar serine protease gene spt1 and investigated the ability of T. reesei to secrete cellulases by disrupting, complementing and overexpressing the spt1 gene. Amino acid sequence analysis of the Spt1 protein showed that it belongs to the subtilisin S8 family and has the conserved catalytic triples (Asp, His, Ser) of the serine protease. The deletion of spt1 did not lead to a decrease in extracellular protease activity, and the observation of mycelia with the Spt1–eGFP fusion expression and the vacuolar membrane dye FM4-64 staining confirmed that Spt1 was an intracellular protease located in the vacuoles of T. reesei. However, the spt1 gene deletion significantly reduced spore production and cellulase secretion, while the spt1 complementation recovered these traits to those of the parental strain. When spt1 was overexpressed by using its native promoter and introducing multiple copies, the cellulase secretion was improved. Furthermore, a strong promoter, Pcdna1, was used to drive the spt1 overexpression, and it was found that the cellulase production was significantly enhanced. Specifically, the filter paper activity of the spt1 overexpression strain SOD-2 reached 1.36 U/mL, which was 1.72 times higher than that of the parental strain. These findings demonstrated that the spt1 gene can be a powerful target for increasing cellulase production in T. reesei, which suggests a possible important role of the vacuole in the cellulase secretion pathway and provides new clues for improving strains for efficient cellulase production.

1. Introduction

Lignocellulosic biomass, mostly derived from agricultural wastes and forest residues, is an abundant and inexpensive organic resource in nature, as well as an important feedstock for the production of biofuels and other biorefined products in biorefining [1]. Cellulase hydrolysis is an effective method for degrading lignocellulosic biomass into fermentable sugars for biofuels production [2]. However, the high cost of cellulase production is one of the important challenges faced by the development of renewable biofuels in industrial production [3,4]. Therefore, enhancing the cellulase production capacity of industrial strains is an effective way to reduce the cost of cellulase production.
Filamentous fungi can naturally secrete cellulase and effectively degrade lignocellulosic materials, among which Trichoderma reesei is extensively employed as an industrial microorganism in cellulase production due to its distinguished ability to produce large amounts of cellulase [1,5]. The extracellular cellulases secreted by T. reesei mainly consist of cellobiohydrolases (CBHs), endoglucanases (EGs) and β-glucosidases (exactly, BGL1), which work synergistically to achieve the complete deconstruction of cellulose [6]. Specifically, CBHs and EGs cooperatively hydrolyze cellulose into cellobiose, and BGL1 eventually converts the cello-oligosaccharide into glucose [7]. Since the whole genome sequencing of T. reesei was published (https://mycocosm.jgi.doe.gov/Trire2/trire2.home.html, accessed on 8 January 2023) [8], the key functional genes of T. reesei related to cellulase production have aroused intense concern. Especially, important advances have been made in revealing the regulatory mechanism of the induced cellulase expression. The different transcription factors involved in cellulase gene expression have been identified, including activators (Xyr1, Ace2, Ace3, Are1, Vib1, BglR, Crz1 and the Hap/2/3/5 complex) and repressors (Cre1, Ace1, Rce1, Ctf1, Lae1 and Pac1), which strictly regulate the expression of T. reesei cellulase genes [9,10]. Nevertheless, the mechanism of the cellulase secretion pathway is still being explored. Therefore, the identification of new key genes related to cellulase secretion can provide potential targets for the improvement of strains and help enhance the cellulase production in T. reesei.
The cellulase secretion pathway of T. reesei underwent the classical secretory pathway including the endoplasmic reticulum (ER) and Golgi apparatus [11]. In general, the newly synthesized cellulase first enters the ER for folding and post-translational modification; then, it is processed by the Golgi apparatus; finally, it is transported to the extracellular matrix via a complex vesicle trafficking system, during which part of the cellulase may be transported to the vacuole and be degraded [12]. Recently, several genes related to the ER in the secretory pathway have been identified and engineered to improve cellulase production. Shen et al. demonstrated that the overexpression of protein folding and glycosylation-related components (Bip1, Pdi1, Ero1, Gpt1 and Gls2), as well as the knockout of ER mannosidase I (Mns1), can prominently upgrade the performance of cellulase production, suggesting that it is practical to optimize cellulase production by engineering the ER secretion pathway of T. reesei [13]. In addition, the overexpression of the unfolded protein response (UPR) transcription factor Hac1 in T. reesei can markedly enhance cellulase production [14]. However, the deletion of key genes (hrd1, hrd3 and der1) in the endoplasmic reticulum-associated degradation (ERAD) pathway significantly decreased cellulase production, especially β-glucosidase [15]. On the other hand, some attempts have been made to promote protein secretion by improving vesicle transport. For example, the overexpression of the v-SNARE (soluble NSF (N-ethylmaleimide-sensitive factor) attachment receptor proteins) protein SNC1 increased the secretion of heterologous glucose oxidase in T. reesei, and the overexpression of the secretion factors SSO1 and SNC2 favored recombinant cellulase secretion in S. cerevisiae [16,17]. However, the overexpression of Sar1, a secretion-related protein involved in vesicle budding, did not lead to increased cellulase yields in T. reesei [14]. Fungal vacuoles in the late secretory pathway are acidic organelles with multiple proteases involved in protein degradation to maintain homeostasis in the cell [18]. Operating vacuole-related genes that improve protein secretion have been proven to be feasible in fungi. It was found that attenuating vacuolar transport by disrupting the μ subunit of adaptor protein 3 (AP-3) in the ALP pathway could increase cellulase production in N. crassa [19]. Additionally, the increased chymosin production as well as the growth and conidiation defects were observed in vacuolar autophagy gene disruption mutants of A. oryzae [20]. Similarly, the absence of the vacuolar subtilisin-like proteases in fungi could result in reduced vegetative growth and decreased sporulation frequency [21,22]. At present, few studies have been conducted to improve cellulase production by manipulating vacuole-related genes in T. reesei. Therefore, new functional genes in the vacuole need to be discovered to screen for the targets for increasing the cellulase yield of T. reesei, which facilitate the development of highly efficient cellulolytic enzyme systems that produce bioethanol from lignocellulosic biomass.
In the present study, a novel vacuolar serine protease gene, namely, spt1, was identified with the aim of investigating its role in the cellulase production of T. reesei. The vacuolar localization of the Spt1 protein was first elucidated. To obtain a more comprehensive understanding of the function of the spt1 gene, we successfully constructed the spt1 deletion, complementation and overexpression strains and detected the cellulase production capacity of these strains. Especially, the deletion of spt1 markedly impaired cellulase production in T. reesei, and the complementation of spt1 recovered the cellulase production ability to that of the parental strain, while its overexpression could lead to a significant increase in cellulase production. Our study indicated that spt1 plays an important role in cellulase secretion, which provided an effective target for enhancing cellulase production in T. reesei.

2. Materials and Methods

2.1. Strains, Plasmids and Culture Conditions

T. reesei QM53 is a strain that lacks the mus53 gene and is derived from T. reesei QM9414 [23]. The absence of mus53 could block nonhomologous end-joining and allow T. reesei to have a high targeted integration frequency [24], so T. reesei QM53 was used as the host strain for the spt1 gene knockout. T. reesei QP4 is a uracil auxotrophic strain that lacks the pyr4 gene and is derived from T. reesei QM9414 [25]. T. reesei QM53 cannot undergo non-homologous recombination and overexpress the spt1 gene by introducing multiple copies, so T. reesei QP4 was employed as the parental strain for the generation of the spt1 gene overexpression strains.
The plasmids pAN7-1, carrying the hygromycin B resistance gene hph as well as A. nidulans trpC terminator (TtrpC), pME2892, carrying the pyrithiamine resistance gene ptrA, and pIG1783, carrying the enhanced green fluorescent protein-encoding gene egfp, were adopted for gene fragments cloning [26,27,28]. The A. niger pyrG gene (encoding orotidine 5′-phosphate carboxylase, which imparts uracil/uridine prototrophy) amplified from the plasmid pCGTLacA was applied to the transformant screening [29].
For vegetative growth, the strains were routinely cultured on minimal medium (MM [30]), and the composition was as follows: 2% (w/v) carbon source (glucose, glycerol or lactose), 1.5% KH2PO4, 0.5% (NH4)2SO4, 0.06% CaCl2, 0.06% MgSO4.7H2O, 0.2% peptone and 0.01% (v/v) trace element solution (0.005 mg/L FeSO4·7H2O, 0.0014 mg/L ZnSO4·2H2O, 0.002 mg/L CoCl2·6H2O, 0.0017 mg/L MnSO4⋅H2O). For conidia production, the strains were maintained on potato dextrose agar (PDA) medium containing 20% peeled potato extract, 2% glucose and 2% agar at 30 °C for 5–7 days to collect fresh spores and obtain spore suspension. The fresh spores were used to generate mycelia that were lysed to harvest protoplasts for transformation or inoculated for liquid fermentation. Liquid fermentation began by inoculating conidia of equal concentrations (106 spores per mL) into 50 mL of the seed culture medium at 200 rpm and 30 °C for 30–36 h. Afterwards, 10 mL of the pre-culture was transferred into 100 mL of the cellulase production medium (CPM) [31] and cultured at 200 rpm and 30 °C. The supernatant was taken for a cellulase production test on the 3rd, 5th and 7th days of fermentation. The seed culture medium was composed of 1% glucose, 0.5% (NH4)2SO4, 1.5% KH2PO4, 0.06% CaCl2·2H2O, 0.05% MgSO4·7H2O and 2% peptone. The components of CPM were as follows: 2% microcrystalline cellulose (MCC), 1.5% KH2PO4, 0.06% CaCl2·2H2O, 0.05% MgSO4·7H2O and 0.5% (NH4)2SO4 or 2% corn steep steam (CSL). When the uracil-defective strain QP4 is used in the experiment, it is necessary to add 0.1% uracil in the medium during the culture or fermentation to ensure the normal growth of the strain.
For phenotypic analysis, the strains were grown on solid MM plates supplemented with different carbon sources including 2% glucose, 2% glycerol and 2% lactose or PDA plates at 30 °C for 3 days. For growth analysis, the strains were cultivated in liquid MM supplemented with 2% glucose or 2% lactose at 30 °C. Fungal mycelium was collected continuously by suction filtration for 5 days and weighed after drying to measure the fungal biomass and plot the growth curve. To preliminarily explore the cellulase secretion capacity of strains, the microcrystalline cellulose (MCC) agar plate used to analyze the cellobiohydrolase (CBH) activity and the sodium carboxymethyl cellulose (CMC-Na) agar plate used to analyze the endoglucanase (EG) activity were prepared by casting MM containing 0.5% MCC or 1% CMC-Na onto a 2% agar bottom layer. The CMC-Na plate should be stained with 0.1% Congo red before observation. In addition, the esculin plate was used to detect the β-glucosidase (BGL) activity, and the composition was as follows: 0.3% esculin, 0.05% ferric citrate, 1% CMC–Na and 2% agar. Furthermore, the extracellular protease secretion capacity of the strains was exhibited by the skim milk agar plate containing 1.0% skim milk as the substrate. The strains were pre-grown on MM plates for 1–2 days, and equal squares of the agar plug from fungal colonies were transferred onto the plates for enzyme activity analysis. Further analysis of the cellulase secretion capacity was conducted by the ratio of the halo to the colony diameter. Photographs of the plates were obtained with a SONY DSC-HX400 camera. All assays were repeated three times each, with three replicates to ensure the accuracy of the results.

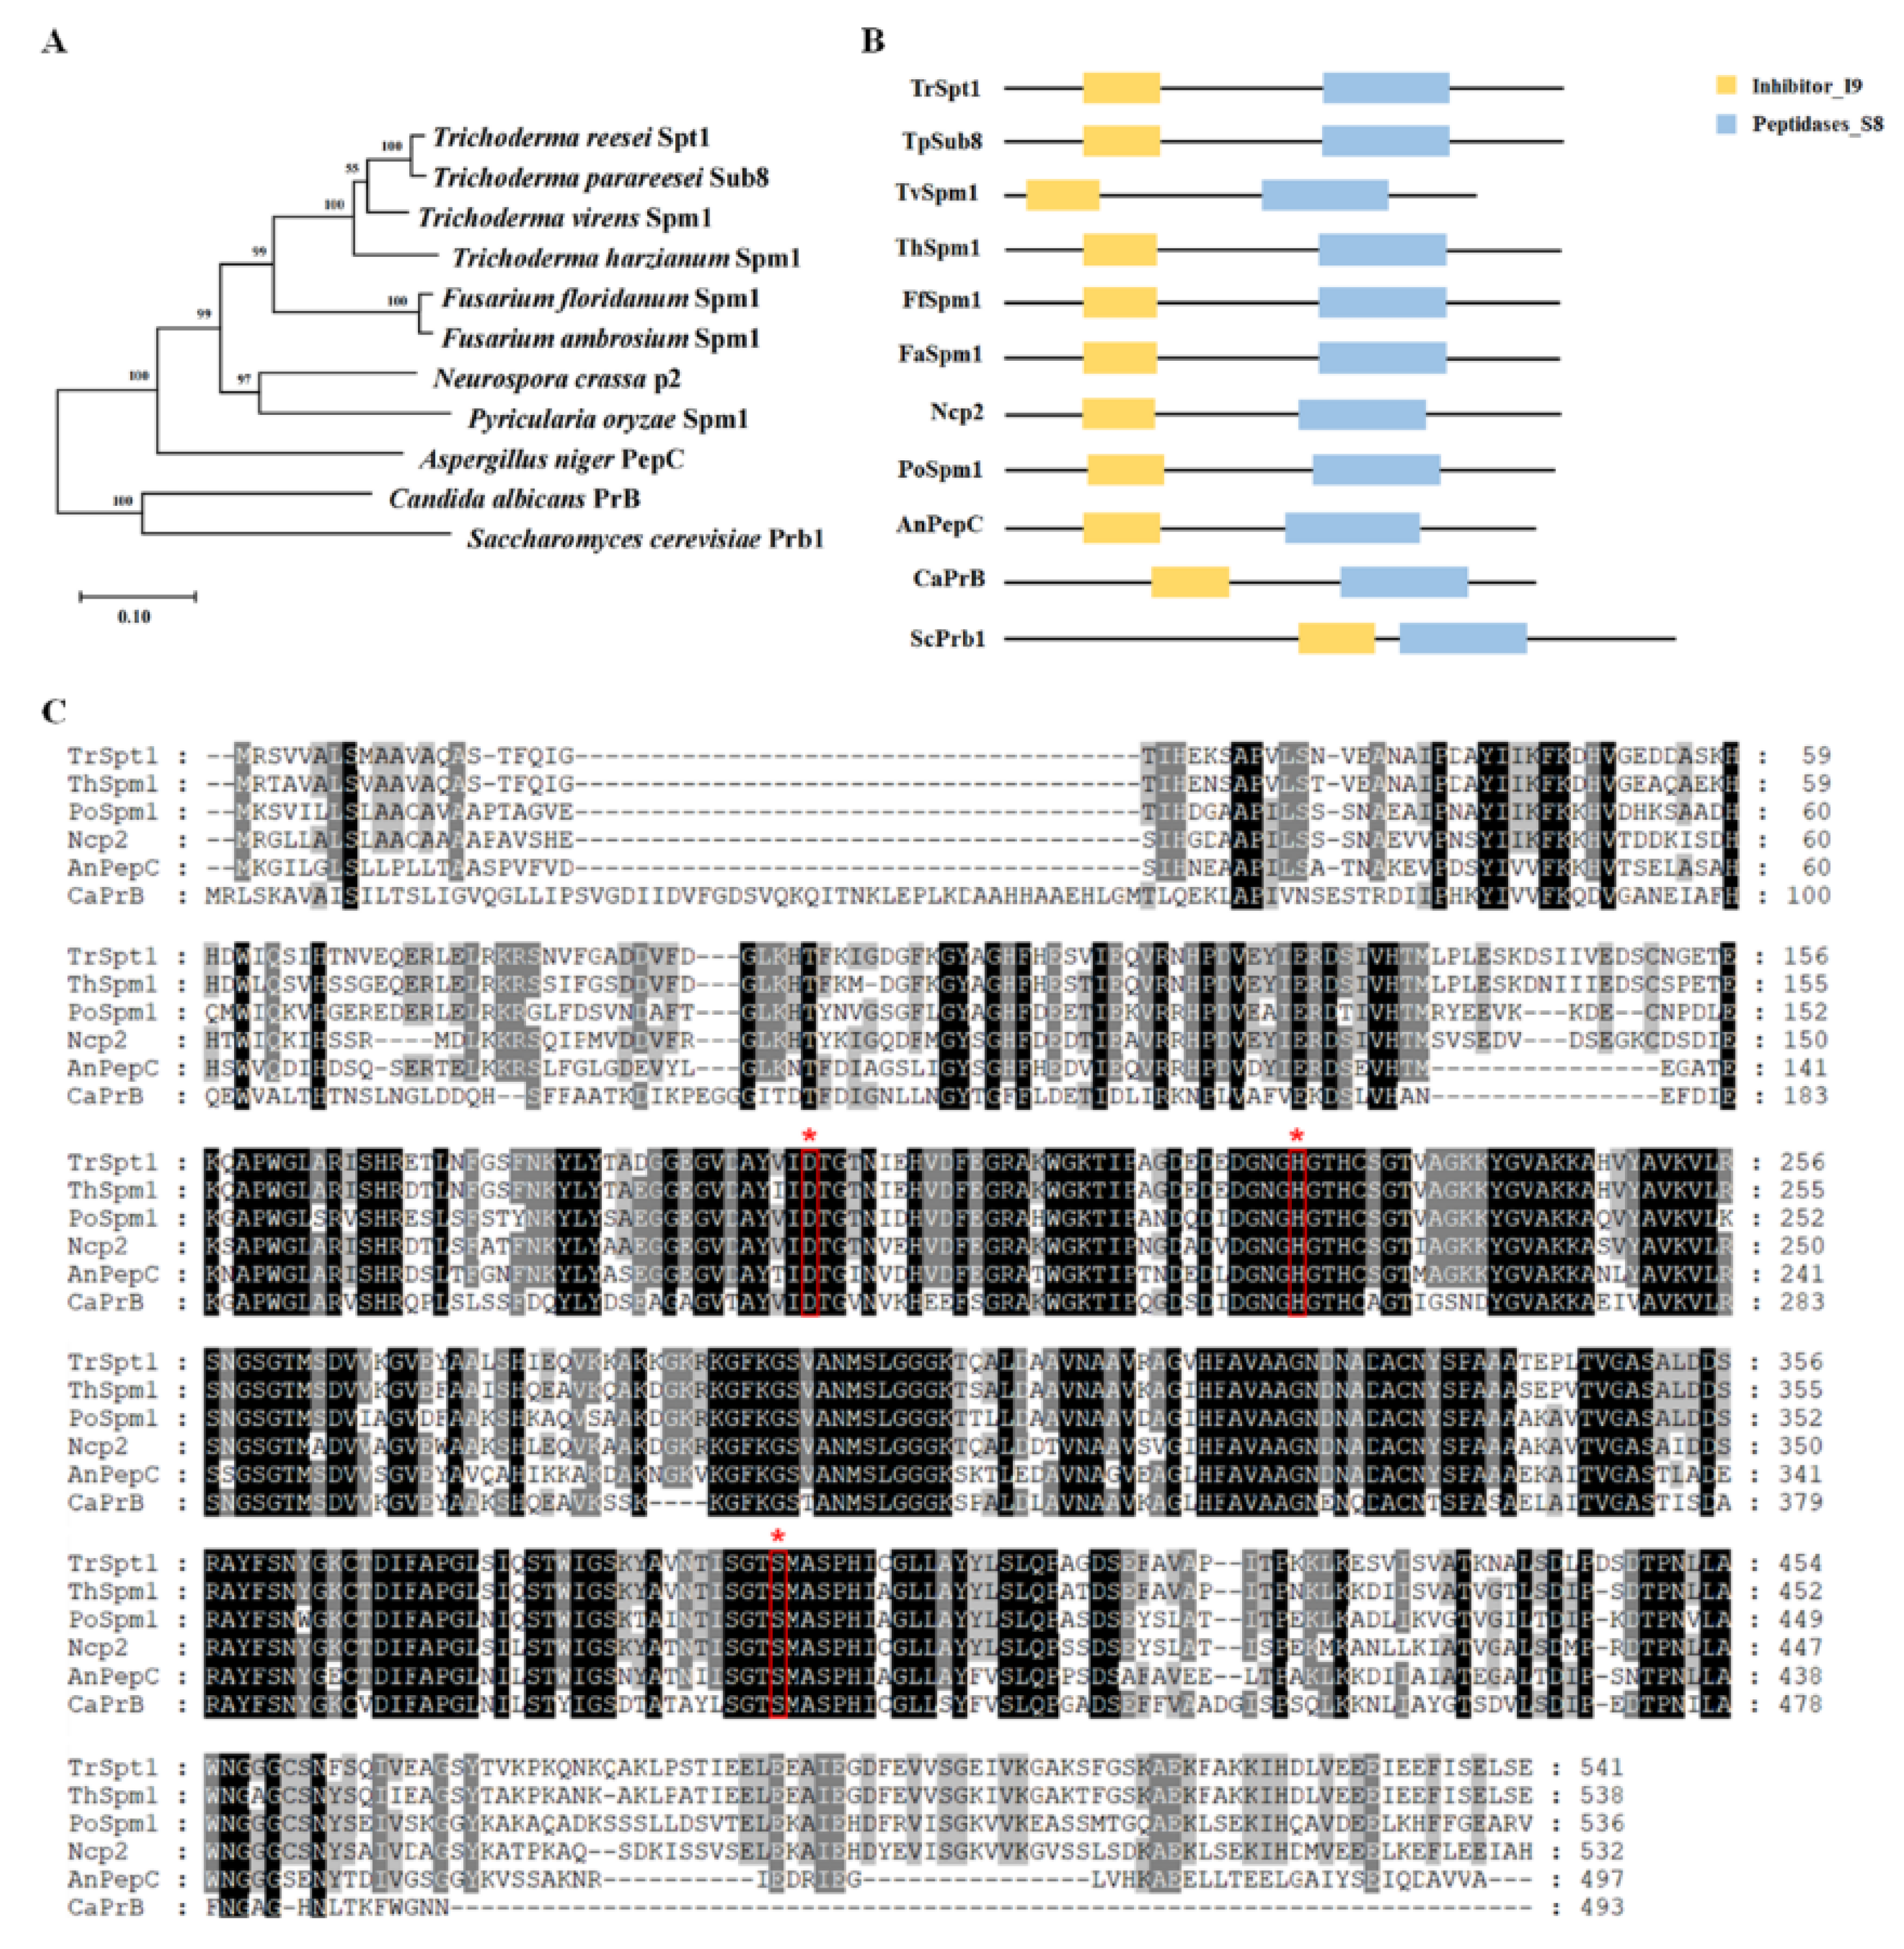
2.2. Phylogenetic Analysis and Sequence Alignments of spt1 and Its Homologs

Phylogenetic analysis was carried out with the amino-acid sequence data of the T. reesei serine protease-like protein Spt1 and its homolog from other fungi species which were retrieved from the National Center for Biotechnology Information (NCBI) (https://www.ncbi.nlm.nih.gov/, accessed on 24 February 2022). A homology search was performed upon T. reesei Spt1 using BLASTP in the NCBI database. The amino acid sequences were aligned in Clustal W, and the phylogenetic tree was constructed using the neighbor-joining method, with a 1000 bootstrap value, in the MEGA6 program. The final result of the sequence alignment was visualized with GeneDoc (Version 2.7).

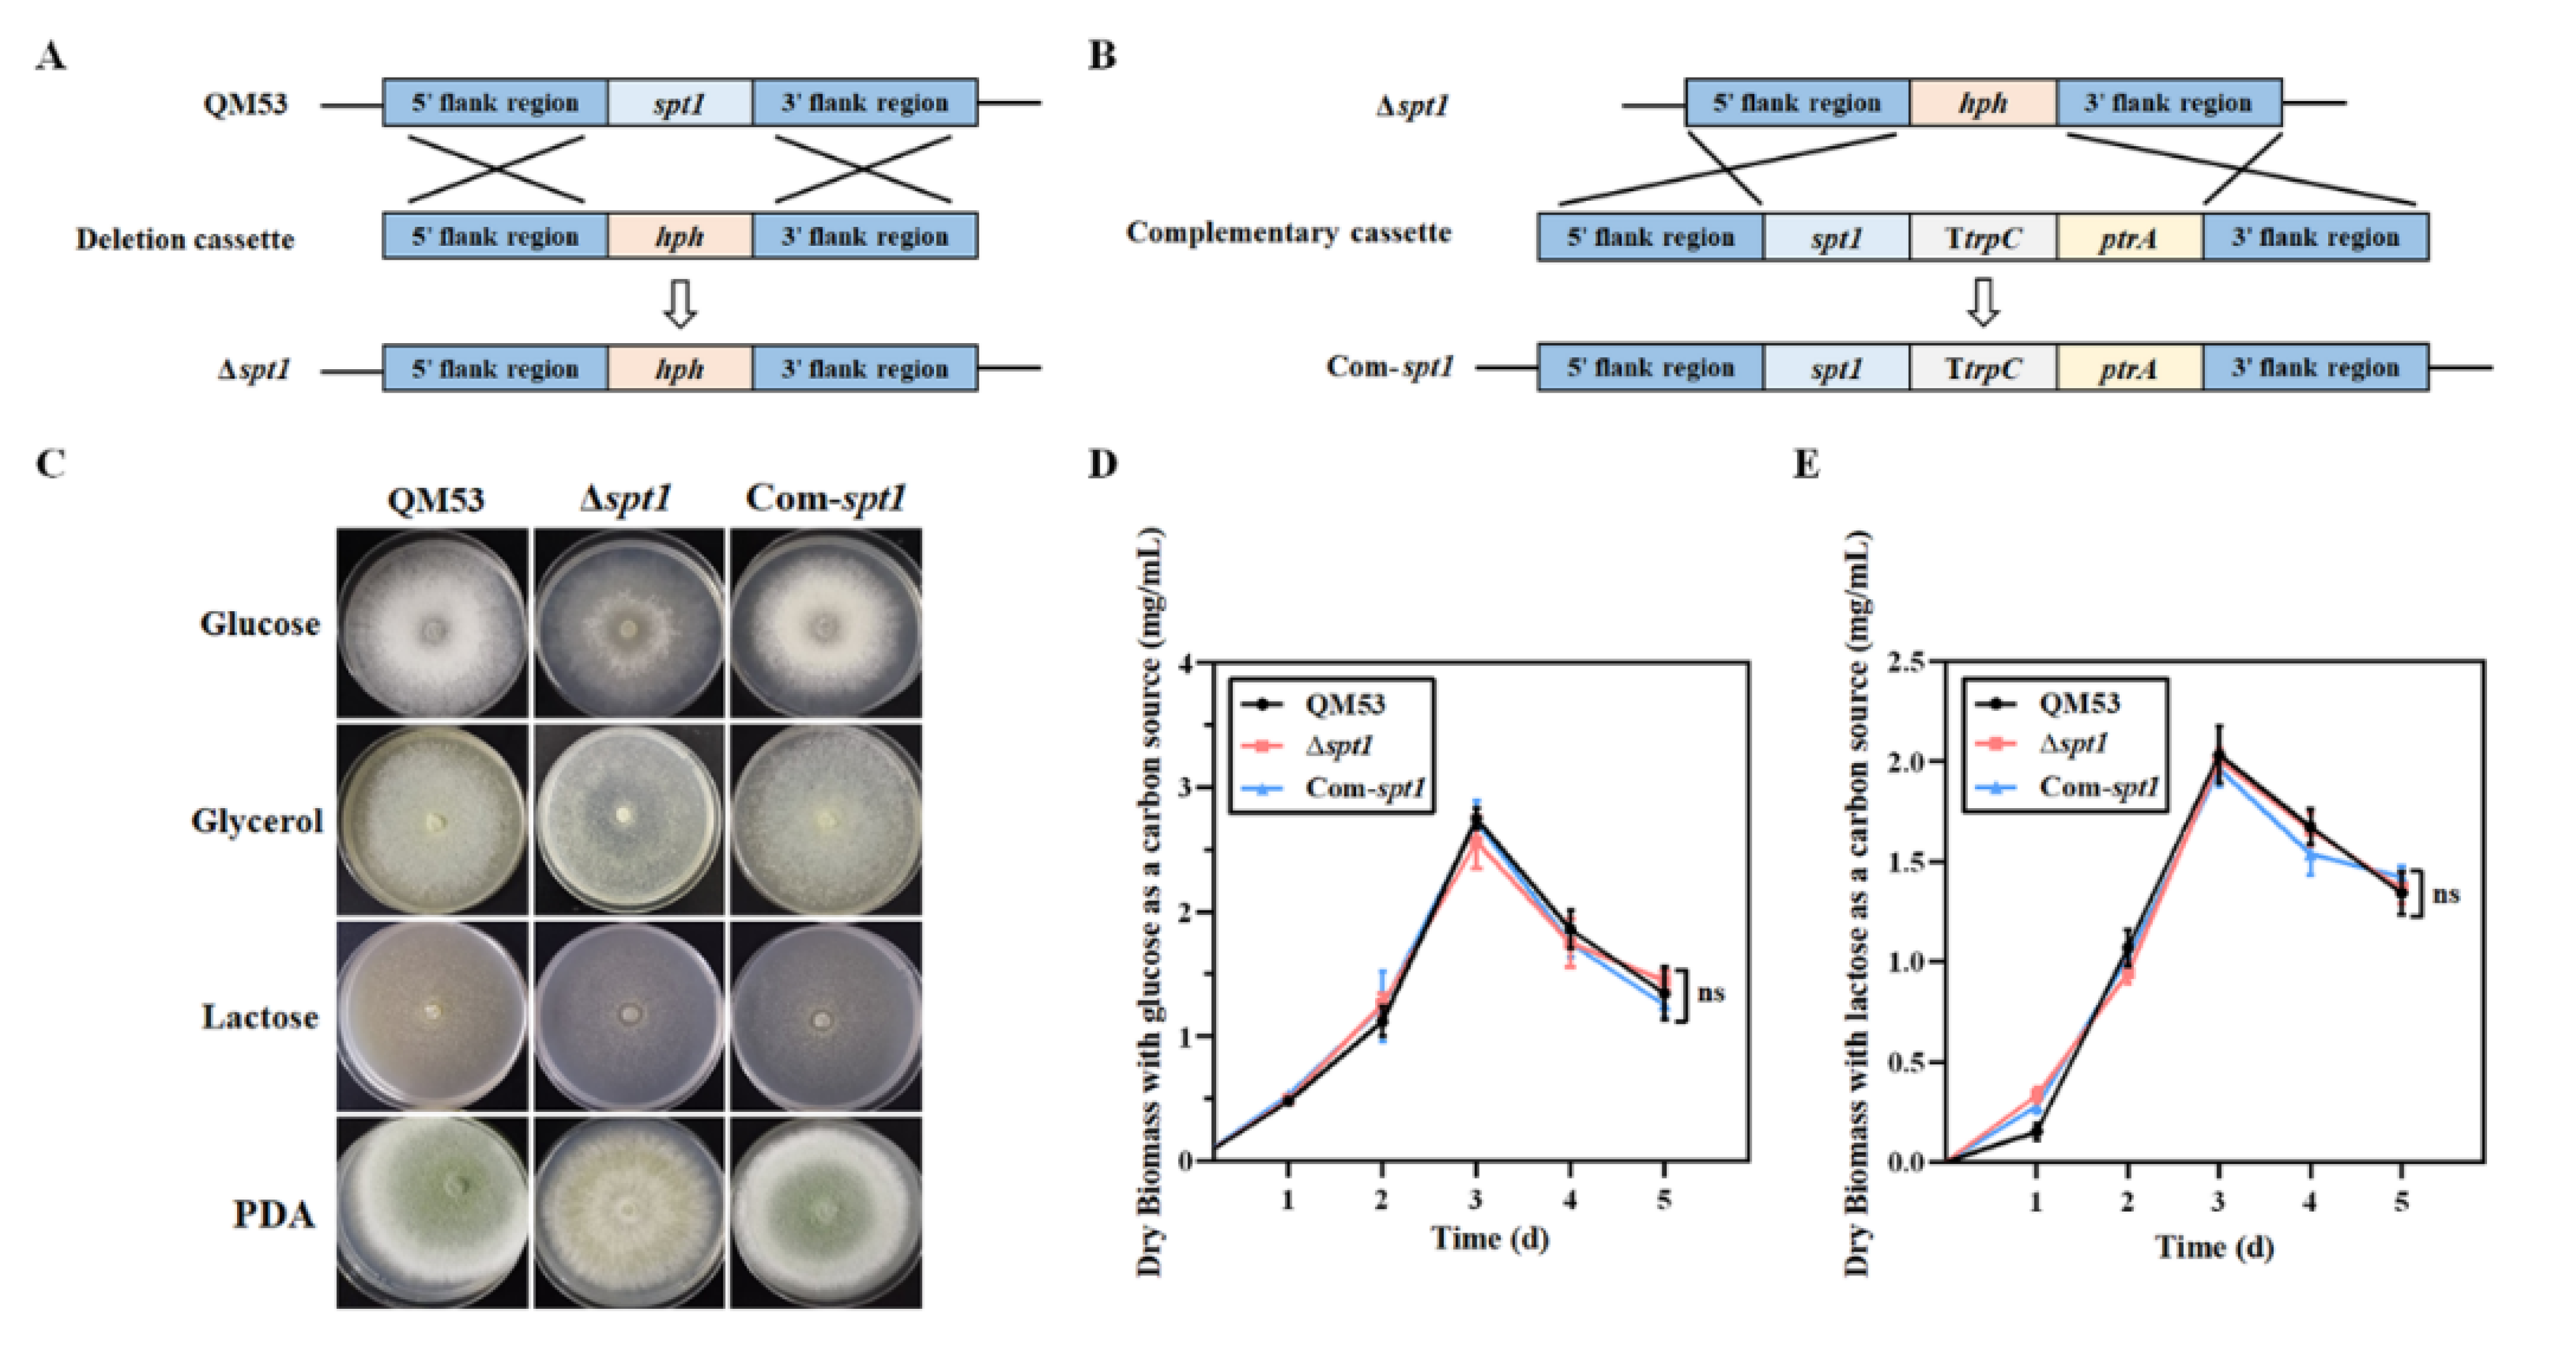
2.3. Construction of the spt1 Deletion Strain

The spt1 deletion cassette was constructed using double-joint PCR technology, as previously published [32]. The 5′ and 3′ flanking regions of spt1 were generated from the genome of T. reesei QM53 using the corresponding primer pairs spt1-1820-UF1/spt1-78-UR1 and spt1-325-DF1/spt1-1557-DR1, which could obtain a 1.7 kb and 1.2 kb PCR product, respectively. The hph selectable marker gene (1.8 kb) was generated from the plasmid pAN7-1 with hph-F/hph-R primers. The three single fragments were mixed together in a certain proportion and fused without primers, and then the fusion product was used as the template to amplify a 4.7 kb ∆spt1::hph cassette with the nested primers spt1-1458-UF2/spt1-1287-DR2. The deletion cassette was transformed into protoplasts of T. reesei QM53 to obtain the spt1 deletion strain by homologous recombination, essentially as described by Penttilä et al. [30]. The transformants were screened on MM plates with 300 µg/mL hygromycin B. The purified transformants were verified by PCR for the integration of the deletion cassette at the correct locus using the primer pairs spt1-1820-UF1/hph-R and hph-F/spt1-1557-DR1. The expected fragment was 3.5 kb and 3.0 kb in the transformants, respectively. The spt1 deletion strain was named ∆spt1. DNA fragments were amplified using Phanta® Super-Fidelity DNA Polymerase (Vazyme Biotech Co., Ltd., Nanjing, China) and purified using the Gel Extraction Kit (Omega, Norcross, GA, USA). Primer synthesis and DNA sequencing were provided by Sangon Inc. (Shanghai, China). The primer sequences used in this study are presented in Table S1.

2.4. Complementation of the spt1 Gene in the Δspt1 Strain

To construct the spt1 complementation strain (Com-spt1), the promoter and coding region of spt1 (3.5 kb) used as the 5’ homologous arm were amplified from the genome of T. reesei QM53 using the primer pair spt1-1820-UF1/spt1-1498-R1. The ptrA selectable marker gene (2.1 kb) and TtrpC (0.7 kb) were generated from the plasmid pME2892 using the ptrA-F/ptrA-R primers and from the plasmid pAN7-1 using the TtrpC-F1/TtrpC-R1 primers, respectively. Afterwards, the 3′ homologous flanking region of the spt1 gene (a 1.2 kb fragment) was amplified with the primer pair spt1-325-DF2/spt1-1557-DR1. Subsequently, the four purified fragments were fused together, and the nested primers spt1-1458-UF2/spt1-1287-DR2 were used to acquire a 7.5 kb spt1 complementation cassette. The complementation cassette was transformed into the protoplasts of T. reesei Δspt1, and the transformants were screened as previously mentioned, only replacing the resistance from hygromycin B to pyrithiamine. The purified transformants were identified through PCR using the primer pairs spt1-1820-UF1/ptrA-R and ptrA-F/spt1-1557-DR1. The expected fragment was 5.6 kb and 4.0 kb in the transformants, respectively (data not shown). The primer sequences used in this study are presented in Table S1.

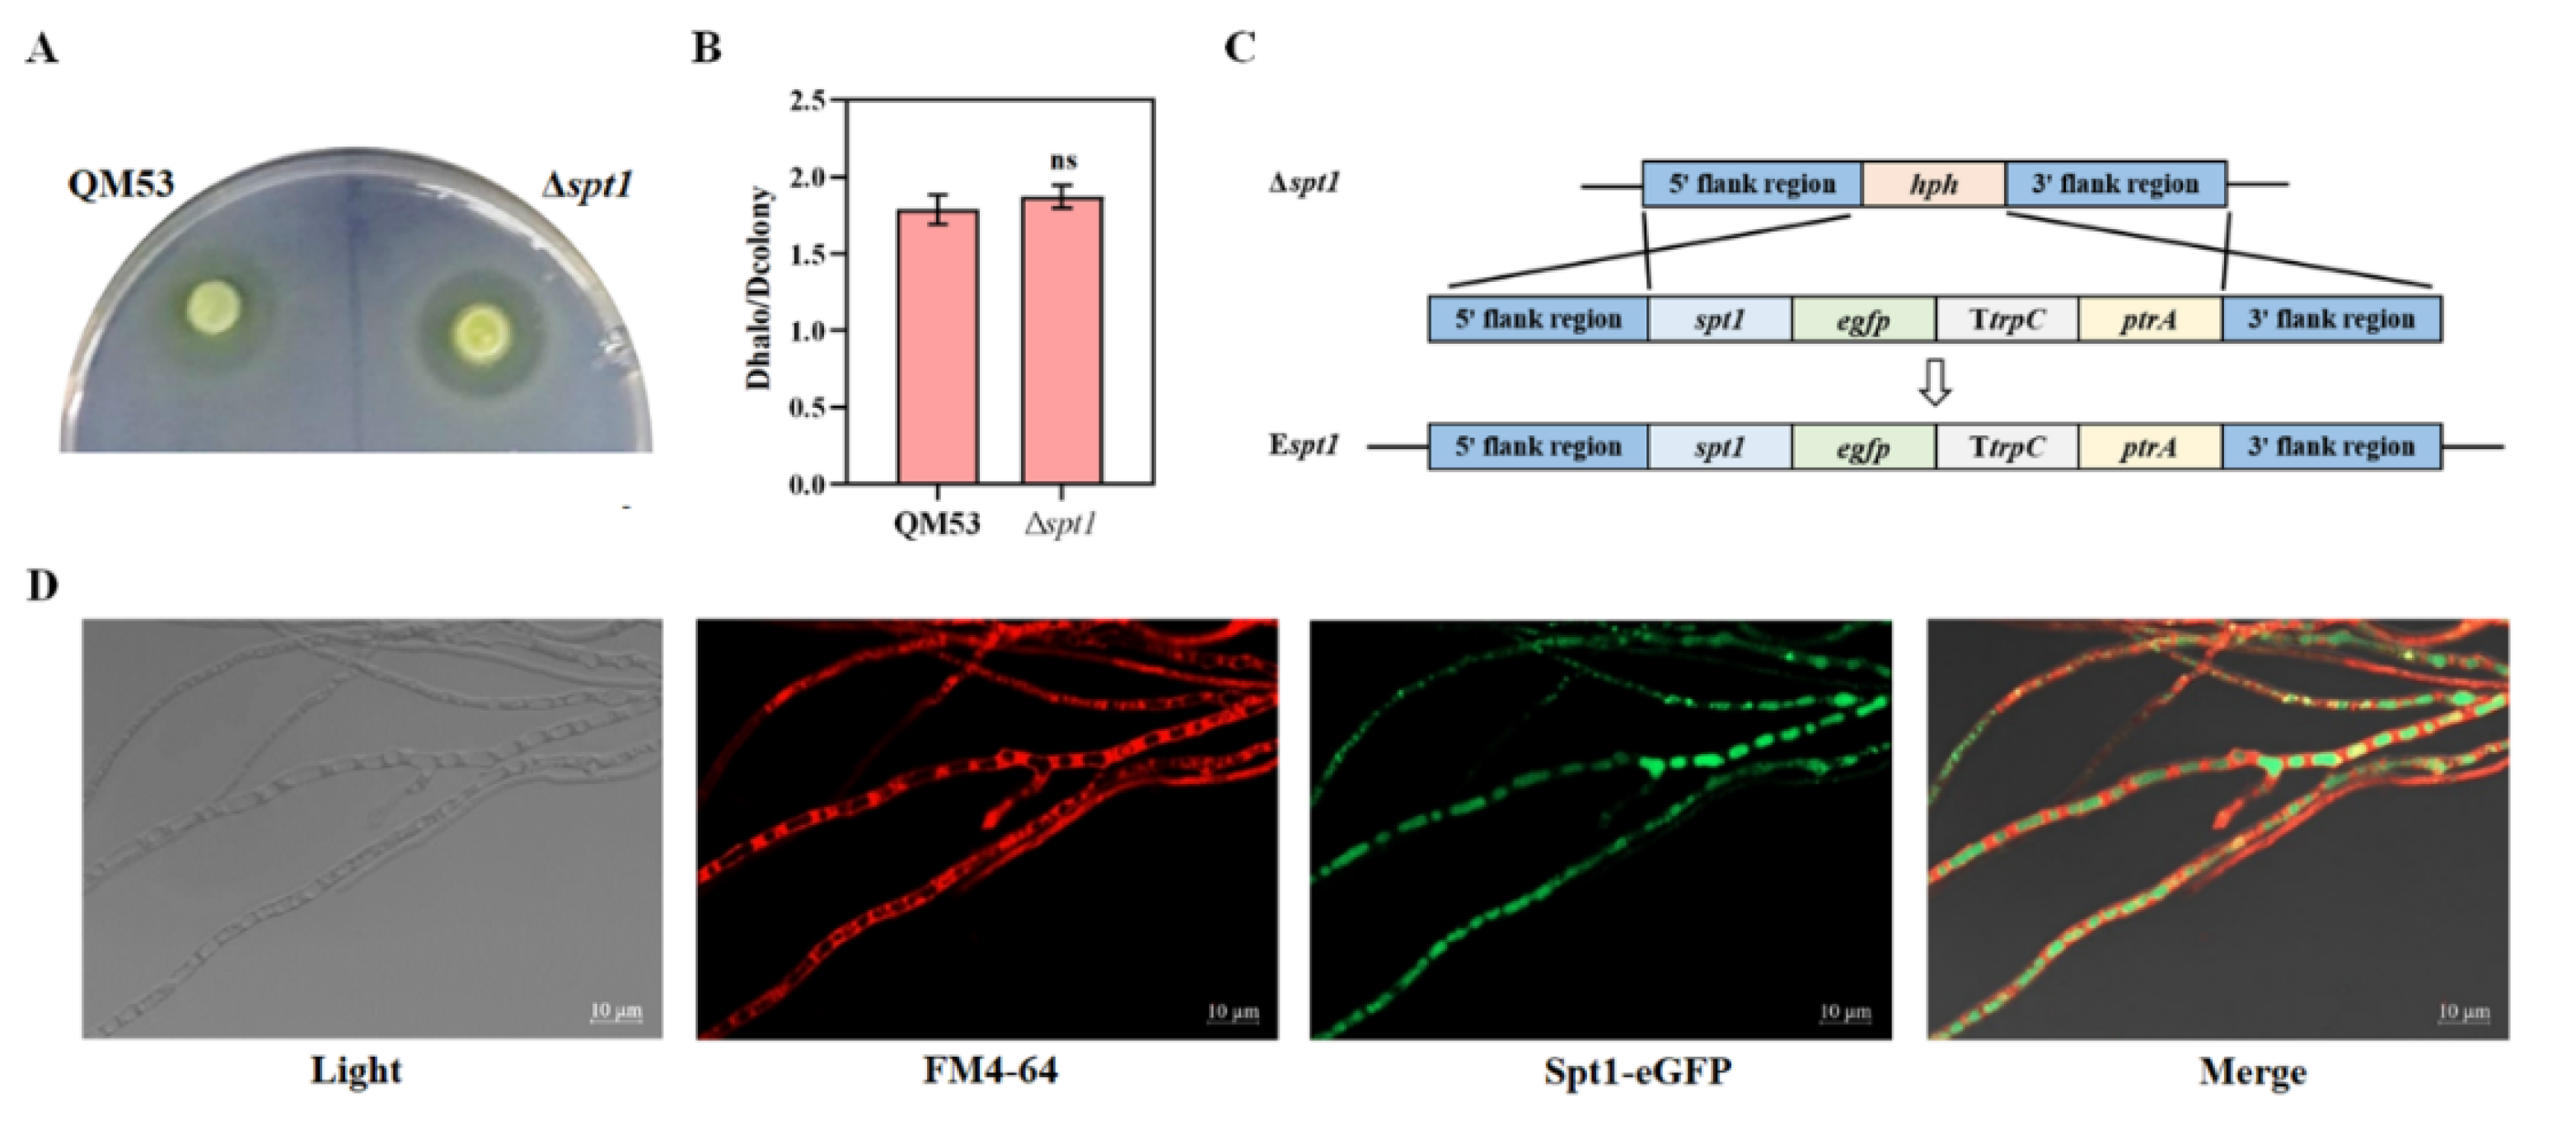
2.5. Construction of the eGFP-Labeled spt1 Strain

To construct the fluorescent localization strain of Spt1 (Espt1), an 8.2 kb cassette was constructed, containing the promoter and coding region of spt1, TtrpC, egfp and ptrA and the 3′ flanking region of spt1. The egfp gene (0.7 kb) was generated from the plasmid pIG1783 using the egfp-F/egfp-R primers, and other fragments were amplified as described above, but with changes in the joints of the primers. The construction process of the cassette was also as previously described, including fragment fusion and amplification using the nested primers spt1-1458-UF2/spt1-1287-DR2. Then, the cassette was introduced into the protoplasts of T. reesei Δspt1, and the methods of transformation and screening were as previously represented. The purified transformants were confirmed by PCR using the primer pairs spt1-1820-UF1/ptrA-R and ptrA-F/spt1-1557-DR1. The expected fragment was 6.3 kb and 4.0 kb in the transformants, respectively (data not shown). The primer sequences used in this study are presented in Table S1.

2.6. Confocal Fluorescence Microscope

In order to explore the subcellular localization of the Spt1 protein, the co-expression of Spt1-eGFP was observed in fungal mycelia using a laser confocal microscope (LSM900, Carl Zeiss, Jena, Germany). For the staining of vacuole membranes, the mycelia were incubated with 5 μg/mL of membrane-selective red fluorescent dye FM4-64 for 10 min and subjected to analysis. The mycelia for the fluorescence microscopic observation were prepared by the following method: 108 spores of the fluorescently labeled strain were inoculated on GMM plates and cultured at 30 °C for 24 h. The coverslips were inserted diagonally in the plates at an appropriate distance from the spores, and the mycelia grown on the coverslips were directly observed at the end of the culture.

2.7. Overexpression of the spt1 Gene in T. reesei QP4

To explore the effect of spt1 overexpression on the cellulase production of T. reesei, the spt1 gene overexpression cassette (6.0 kb) under the control of the native promoter Pspt1 was constructed. The amplification of the spt1 promoter and coding region as well as TtrpC has been introduced in detail. Moreover, pyrG (2.7 kb), the screening marker gene carried in the overexpression cassette, was obtained by the plasmid pCGTLacA using the pyrG-F/pyrG-R primers. The overexpression cassette acquired after the fusion of all fragments was introduced into the genome of T. reesei QP4 in the form of multiple copies through random integration. The purified transformants were checked out by PCR using the primers spt1-1820-UF1/pyrG-R. The expected fragment was 6.0 kb in the transformants, respectively (data not shown). The spt1 overexpression strain constructed with its own promoter, Pspt1, was named SOE.
To obtain a high-cellulase-producing strain by spt1 overexpression, the overexpression cassette (5.7 kb) containing the strong constitutive promoter Pcdna1 was generated. The process of constructing the spt1 overexpression strain using the cdna1 promoter was similar to the previous one, except that the spt1 promoter was replaced by the cdna1 promoter. The cdna1 promoter (0.9 kb) was amplified from the genome of T. reesei QP4 using the primer pairs Pcdna1-F/Pcdna1-R. The purified transformants were checked out by PCR using the primers Pcdna1-F/pyrG-R. The expected fragment was 5.7 kb in the transformants, respectively (data not shown). The spt1 overexpression strain constructed with the strong constitutive promoter Pcdna1 was named SOD. The primer sequences used in this study are presented in Table S1.

2.8. Enzyme Activity Assay

The cellulase production capacity of the strains was judged by cellulase activity, including the filter paper activity (FPA), endoglucanase (EG) activity, cellobiohydrolase (CBH) activity and β-glucosidase (BGL) activity. The required samples for the cellulase activity determination were the fermentation supernatants from the strains cultured in CPM medium for 3, 5 and 7 days. The activities of FPA and EG were determined using Whatman No.1 filter paper (Sigma-Aldrich, St. Louis, MA, USA) and soluble CMC-Na as the substrates, respectively, combined with the classical DNS method, which could analyze the amount of reducing sugar [33]. The CBH activity was measured by using p-nitrophenyl-β-D-cellobioside (pNPC, Sigma, St. Louis, MA, USA) as the substrate, according to an optimized method [31]. As reported by Ghose, the BGL activity was assayed with p-nitrophenyl-β-D-glucoside (pNPG, Sigma, St. Louis, MA, USA) as the substrate [33]. The experimental details of the cellulase activity determination, such as the reaction system, the reaction temperature, the reaction time and the absorbance wavelength, were described in previous research [31]. The measured absorbance values were calculated by the standard curve into enzyme activity. One enzyme activity unit was defined as the amount of enzyme liberating 1 μmol of reducing sugar (FPA, EG) or p-nitrophenol (CBH, BGL1) per minute under the measurement conditions [31]. The fermentation liquor samples of T. reesei QM53 or QP4 were used as the control. The final experimental data were obtained from at least three parallel fermentations, with the enzyme activity measured three times per fermentation.

3. Results

3.1. Sequence and Phylogenetic Analysis of T. reesei spt1 and Its Homologs in Fungi

Serine protease is reported to be important for growth, sporulation and autophagy in filamentous fungi [22]. However, the function of the serine protease Spt1 in T. reesei is still unclear. Thus, the sequences of the T. reesei Spt1 and its homologs in fungi were first compared. A BLASTP search in the NCBI database revealed that XP_006967823.1 of T. reesei shared a high amino acid sequence homology with several fungal serine protease proteins, including S. cerevisiae Prb1, and then the phylogenetic tree was made from this (Figure 1A). We named XP_006967823.1 as Spt1 (serine protease of T. reesei). The phylogenetic analysis showed that Spt1 exhibits a high similarity to Spm1 from T. harzianum (89.46%), to Spm1 from P. oryzae (67.90%), to p2 from N. crassa (71.79%), to PepC from A. niger (63.56%), to PrB from C. albicans (55.96%) and to Prb1 from S. cerevisiae (53.43%). The annotations from the NCBI database showed that Spt1 and its homologs had two quite conserved domains: inhibitor I9 domain and peptidase S8 domain (Figure 1B). The multiple-sequence alignment confirmed the catalytic triplets of the serine protease belonging to the subtilisin S8 family with the order Asp, His and Ser, which are conserved in Spt1 homologous proteins (Figure 1C).

3.2. Construction of the spt1 Deletion Strain Δspt1 and the spt1 Complementation Strain Com-spt1

To explore the effect of the serine protease Spt1 on cellulase production in T. ressei, the spt1 deletion strain Δspt1 was first obtained by homologous recombination. As shown in Figure 2A, the spt1 deletion cassette was constructed and transformed into the protoplast of T. reesei QM53, and spt1 was replaced with the marker gene hph. In addition, the spt1 complementation strain (Com-spt1) was generated from the Δspt1 strain by replacing hph with the spt1 coding region, the trpC terminator and the ptrA marker gene (Figure 2B). Moreover, to investigate whether the absence of spt1 has an impact on the normal growth and sporulation of T. reesei, the growth of Δspt1 was evaluated on the MM plates with different carbon sources, including glucose, lactose and glycerol, as well as the PDA plate. As shown in Figure 2C, no prominent discrepancy in the colony growth of Δspt1 was discovered compared to that of the parental strain QM53 on the MM plates containing glucose, lactose or glycerol. However, the Δspt1 strain showed no green spore production compared with the parental strain QM53 on the PDA plate, and the sporogenesis traits recovered after the spt1 complementation. To further investigate whether the deletion of spt1 affects the growth of the strains and thus the cellulase activities under liquid fermentation conditions, the strains were cultured in liquid MM containing glucose or lactose for 5 days. It was found that the growth rate of the Δspt1 strain was basically the same as that of the parental strain QM53, suggesting that the effect of mycelium growth on cellulase activities could be excluded (Figure 2D,E). Taken together, these results indicated that the spt1 deletion strain Δspt1 and the spt1 complementation strain Com-spt1 were successfully constructed, and the deletion of spt1 did not affect the normal growth of T. reesei but seriously hindered the spore production.

3.3. Subcellular Localization of spt1 in T. reesei

It was reported that the extracellular protease secretion capacity of strains could be measured using a skim milk agar plate and qualitatively analyzed by the size of the halo around the colony [34]. To investigate the effect of the deletion of the spt1 gene on the extracellular protease production of T. reesei, Δspt1 and its parental strain QM53 were cultured on a skim milk agar plate for 4 days. As shown in Figure 3A, the clear halo around the colony of Δspt1 was similar to that of QM53, suggesting that the deletion of spt1 did not affect the extracellular protease secretion of T. reesei, and Spt1 might not be an extracellular protease. Subsequently, the colony diameter and the size of the halo around the colony were detected, and the extracellular protease secretion capacity of the strains was directly analyzed by the ring diameter ratio (Dhalo/Dcolony). This finding was further supported by the fact that the ring diameter ratio representing the extracellular protease secretion capacity of Δspt1 was not significantly different from that of the parental strain QM53 (Figure 3B). These results preliminarily indicated that Spt1 might be an intracellular protease with a high probability. Then, the subcellular localization of Spt1 in T. reesei was investigated by constructing the fluorescent localization strain Espt1. As shown in Figure 3C, the Spt1–eGFP fusion expression cassette was constructed, including the upstream sequence and the coding region of spt1, the enhanced green fluorescent protein-encoding gene egfp, the trpC terminator and the selective marker gene ptrA. The Spt1–eGFP expression cassette was integrated into the hph site of Δspt1 by homologous recombination to obtain the fluorescent localization strain Espt1. To better observe the subcellular localization of Spt1, FM4-64 was applied to stain vacuolar membranes as the control, which is a dye that could specifically bind to the plasma membrane and endometrial organelles and emit high-intensity red fluorescence. As shown in Figure 3D, the observation of FM4-64 staining and Spt1-eGFP by confocal fluorescence microscopy showed that the Spt1 protein was located in the vacuoles of mycelia. Combined with the results of light microscopy, it could be considered that Spt1 was located in the vacuoles of T. reesei.

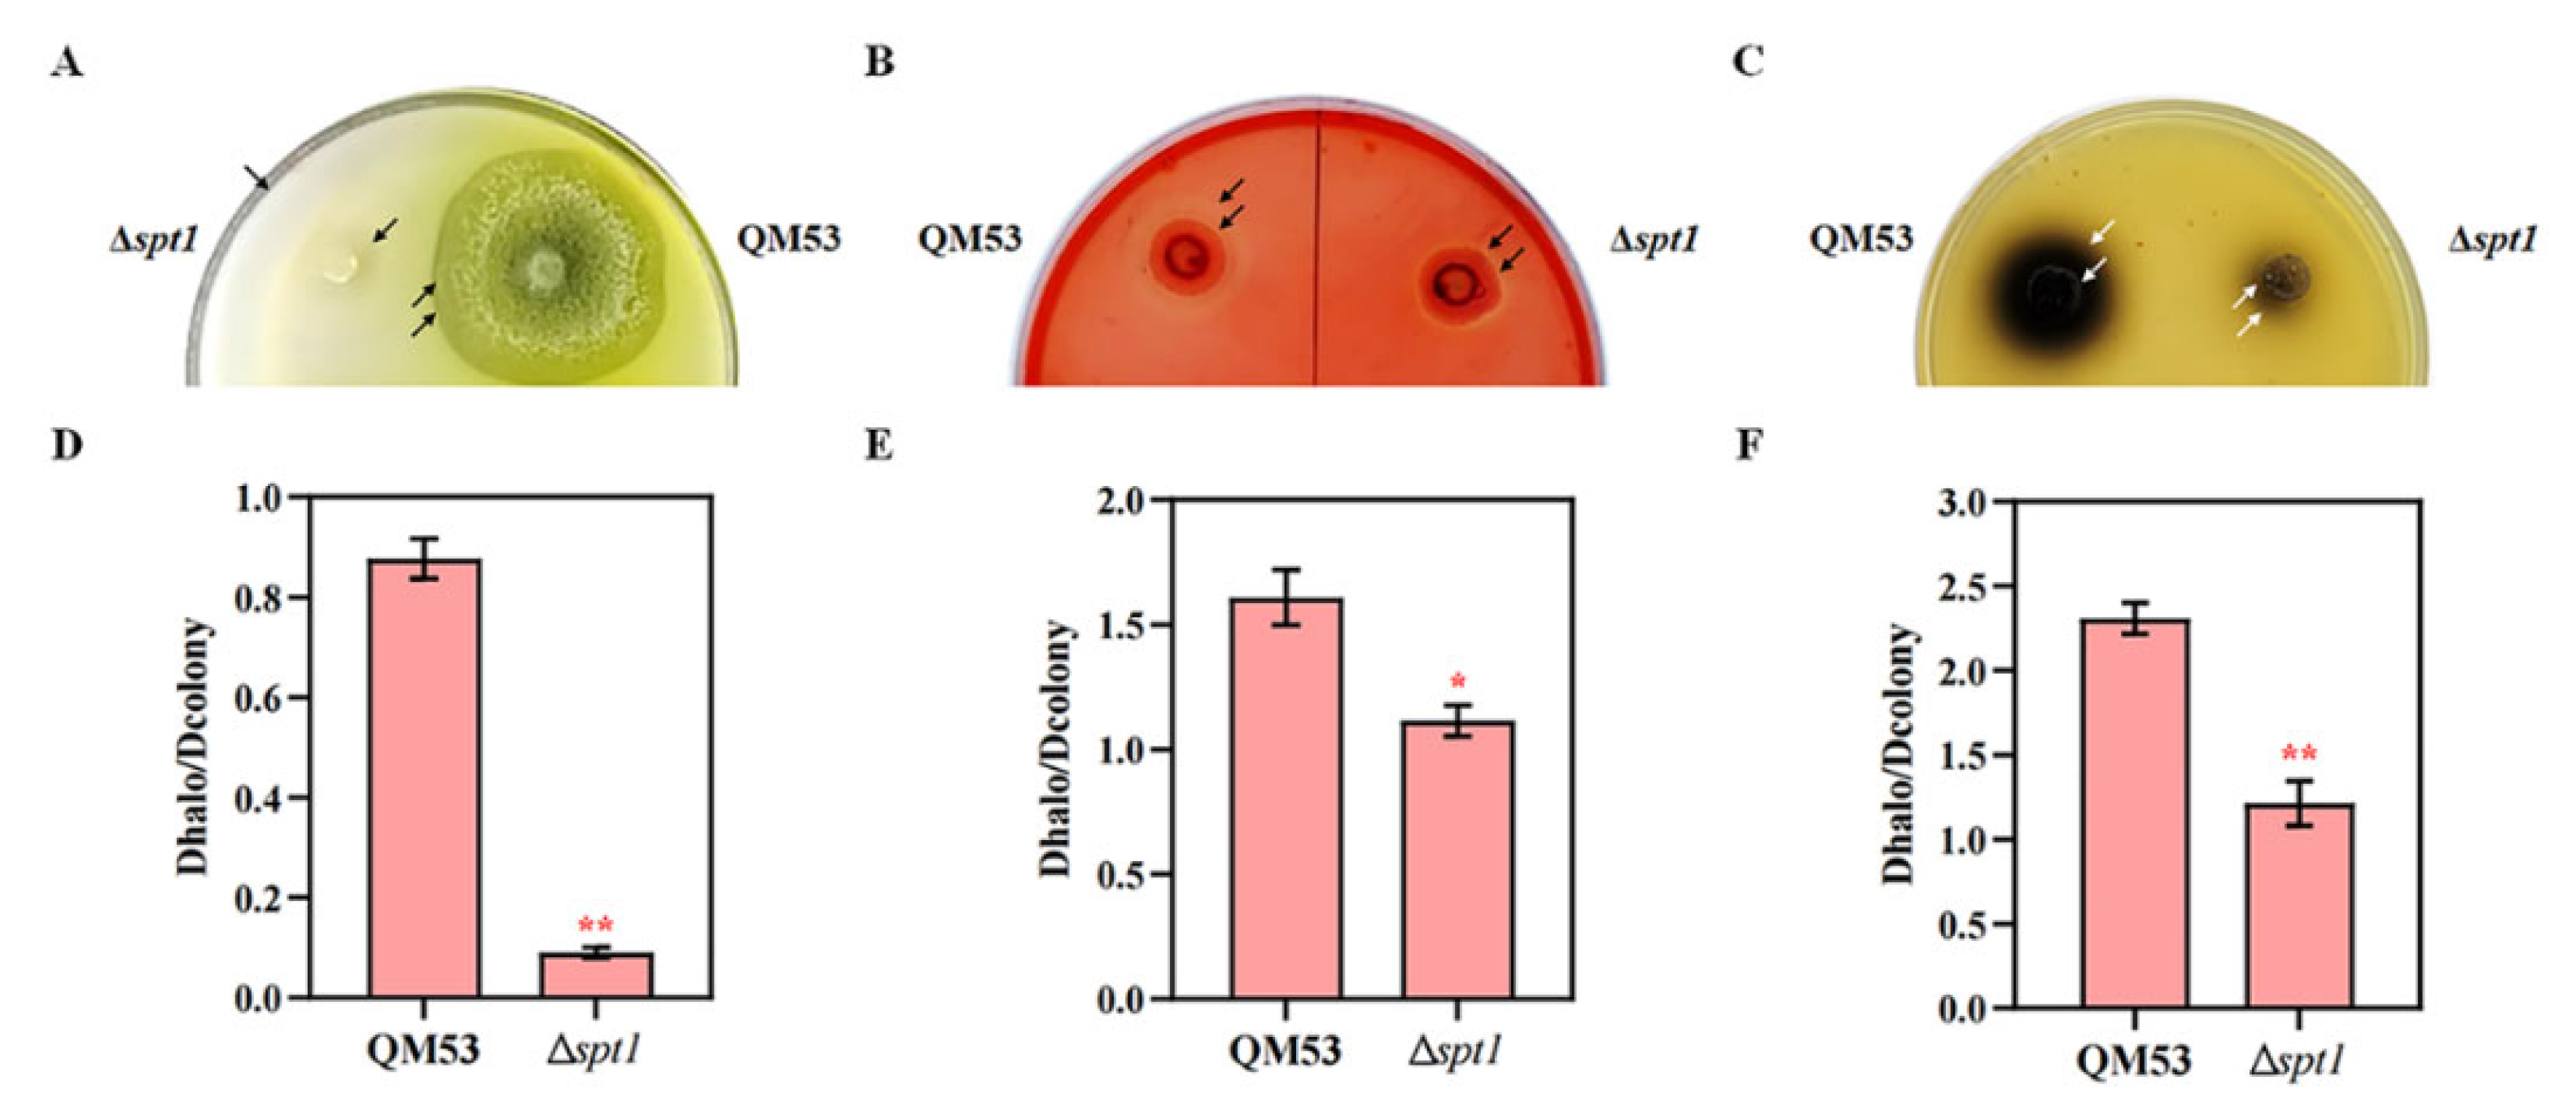
3.4. Detection of the Cellulase Secretion Capacity of Δspt1

To explore whether the loss of spt1 affects cellulase production in T. reesei, the component cellulase activities of the Δspt1 strain were measured using the plates containing different substrates, including cellulose, CMC-Na or esculin. The size of the hydrolytic circle around the colony represented the cellulase secretion capacity of the strains. In addition, the cellulase production capacity of the strains was further analyzed by the ratio of the halo to the colony diameter. As shown in Figure 4A, CBH secretion was measured after Δspt1 was grown on the plate containing MCC as the substrate for 5 days. Compared with the parental strain QM53, there was almost no clear halo around the colony of Δspt1, indicating that the absence of spt1 would reduce the ability of T. reesei to produce CBH. Dhalo/Dcolony was calculated to show this result more directly (Figure 4D). Similarly, the ability of Δspt1 to secrete EG was examined using the plate containing CMC-Na as the substrate. It was found that the halo around the colony of Δspt1 was significantly smaller than that of the parental strain QM53, suggesting a reduced EG secretion ability (Figure 4B). The Dhalo/Dcolony result also demonstrated reduced EG secretion due to the deletion of spt1 (Figure 4E). Furthermore, the esculin plate was used to detect the BGL secretion capacity of the strains, and the size of the black halo around the colony could be used as a standard to measure the amount of BGL by the strains. As shown in Figure 4C, the black halo around the colony of Δspt1 was markedly smaller than that of the parental strain QM53, indicating that its secretion ability to BGL was weakened. The decreased secretory capacity of BGL in Δspt1 could be more directly detected by Dhalo/Dcolony (Figure 4F). Together, the results of the plate analysis showed that the deletion of the spt1 gene could affect the secretion of the major cellulases CBH, EG and BGL of T. reesei.

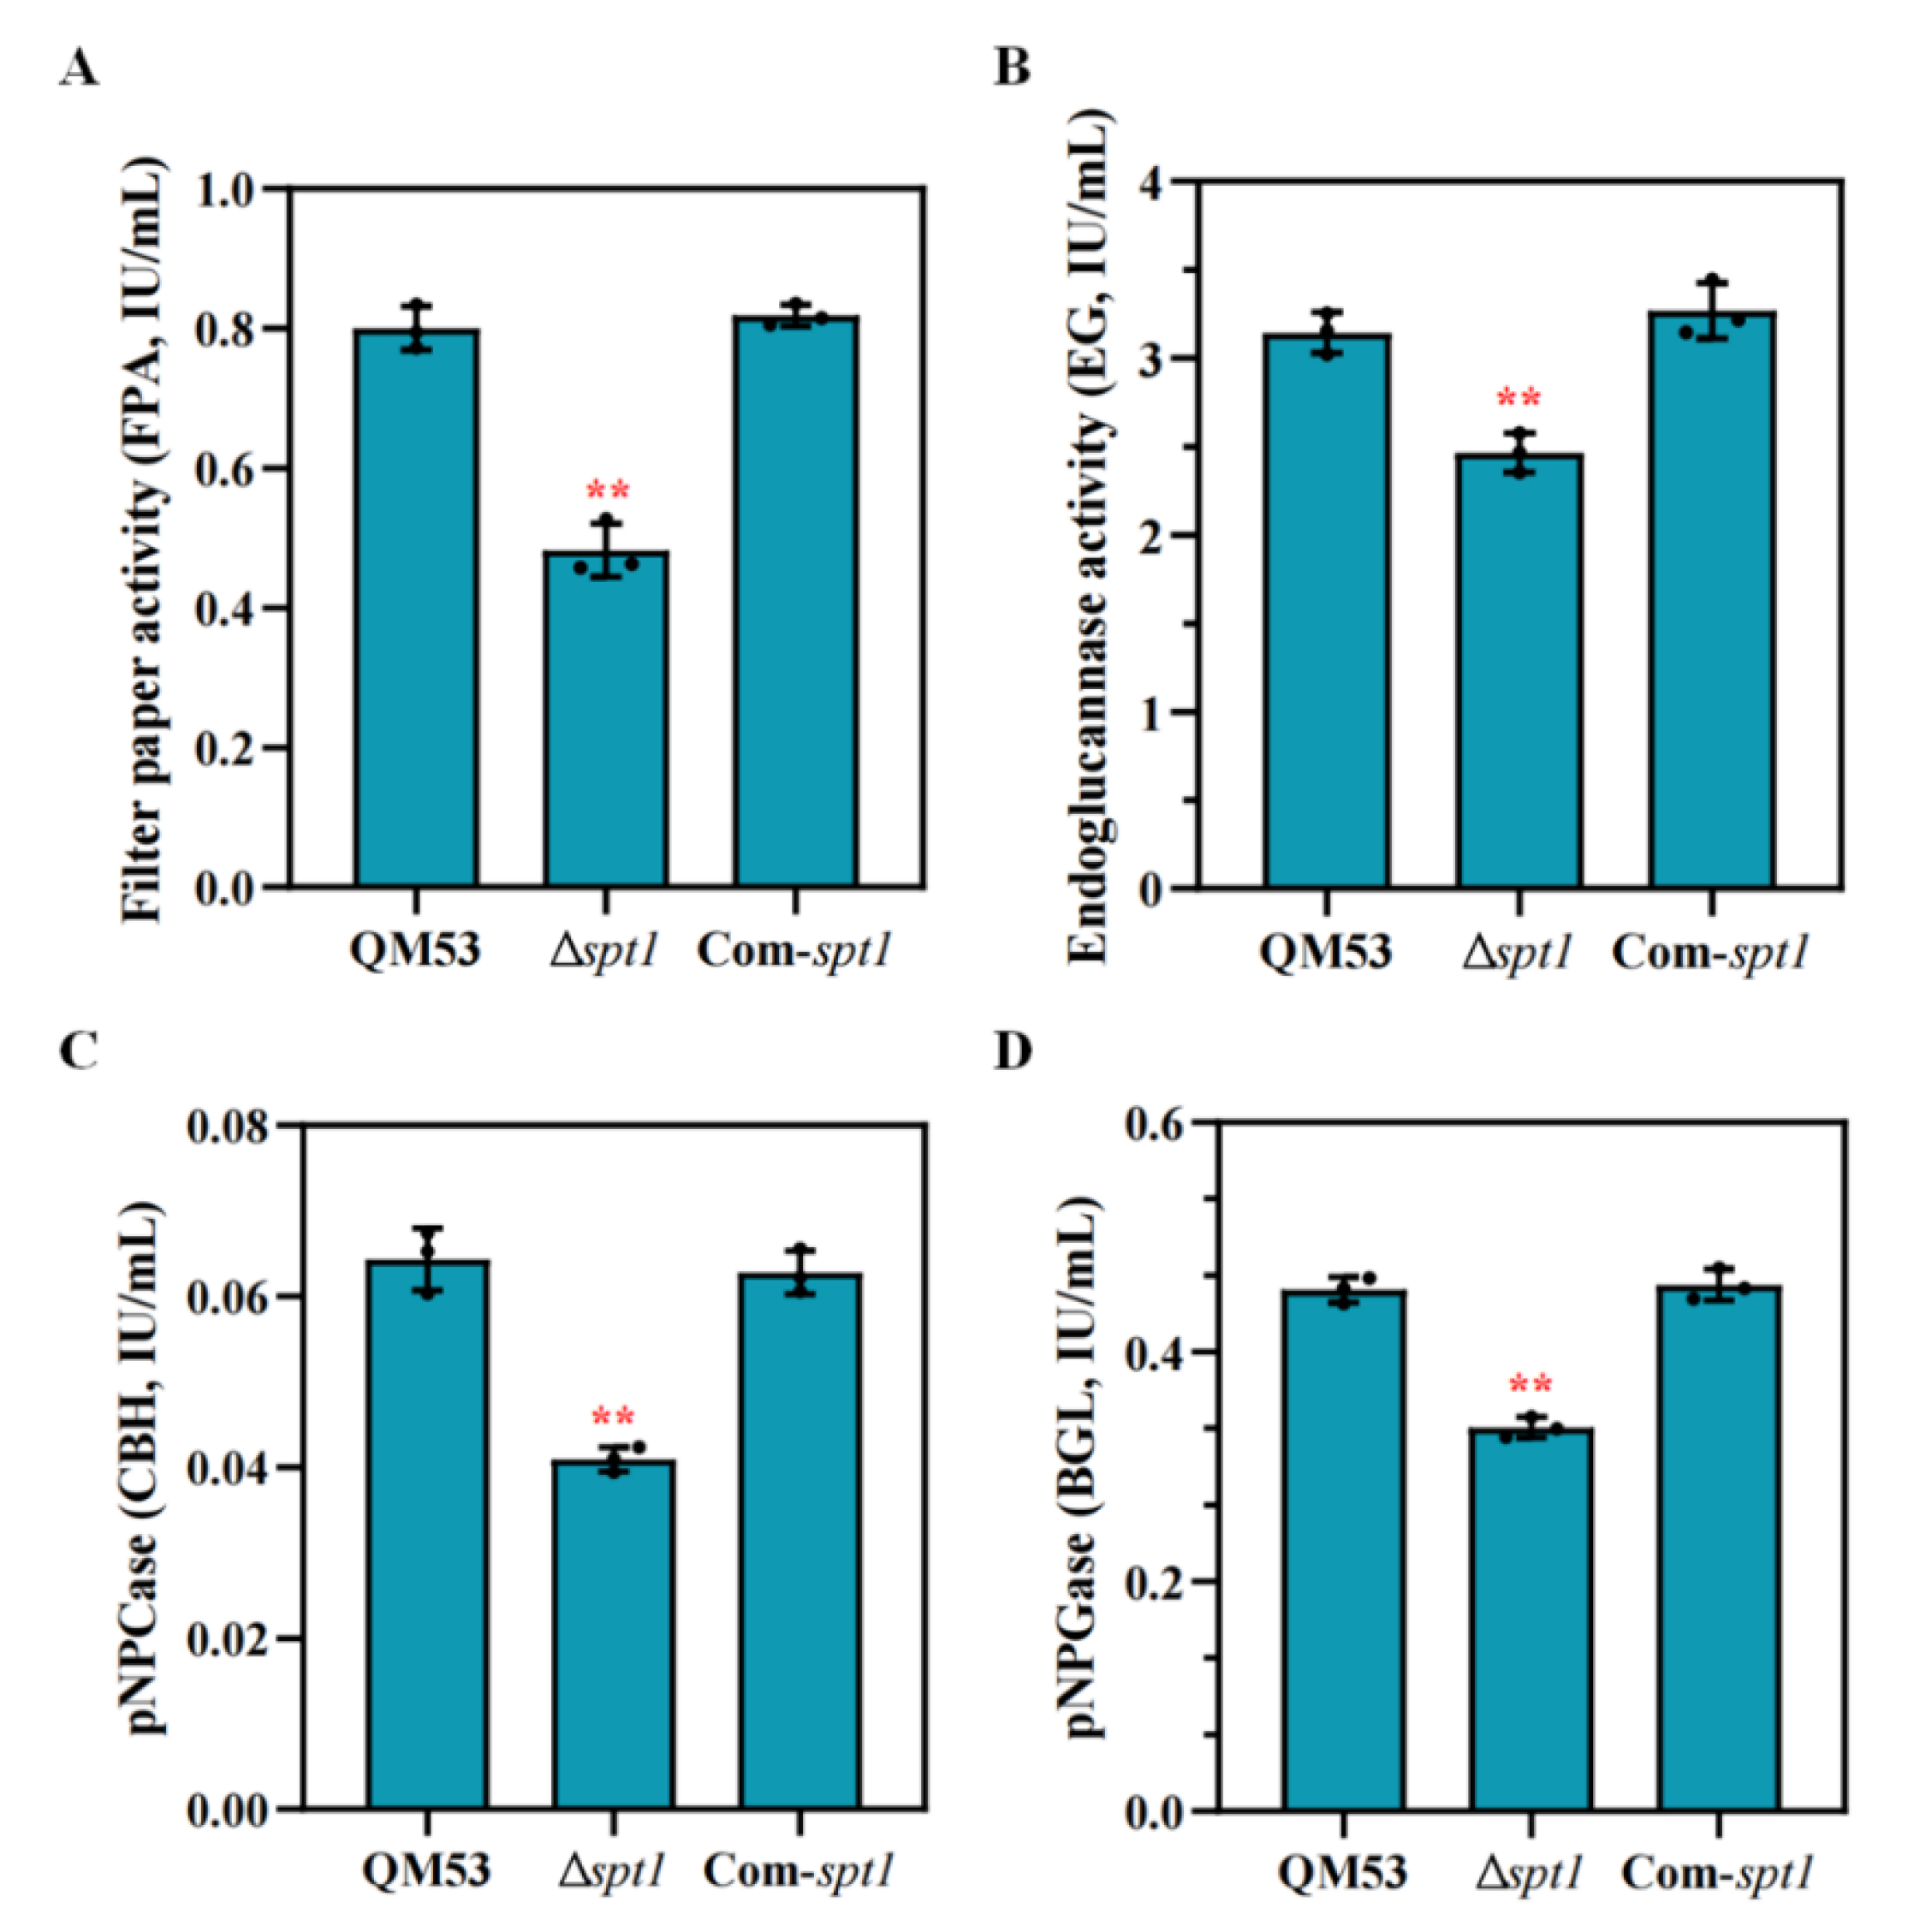
3.5. Deletion of spt1 Resulting in Decreased Cellulase Production in T. reesei

The plate analysis results showed that the absence of spt1 had a negative effect on the secretion of cellulase, but cellulase is mainly produced by liquid fermentation in industry. Therefore, the effect of the absence of spt1 on cellulase production in liquid fermentation with MCC as the carbon source was investigated. After the strains were grown in CPM medium for 7 days, their fermentation supernatants were used to determine the activities of FPA, CBH, EG and BGL. As shown in Figure 5A, the FPA activity of Δspt1 was significantly decreased compared with that of the parental strain QM53, while that of Com-spt1 was not distinctly different. In addition, the activities of major cellulase components were measured in the medium containing MCC. It was found that the deletion of the spt1 gene resulted in a significant decrease in the activities of EG, CBH and BGL, which were decreased by 33.9%, 50% and 60% compared with the parental strain QM53, respectively, and the activity of these cellulases was restored to the level of the parental strain QM53 after the spt1 gene complementation (Figure 5B–D). Taken together, these results indicated that spt1 could play an important role in the cellulase secretion pathway of T. reesei, and its absence affected the cellulase production of T. reesei.

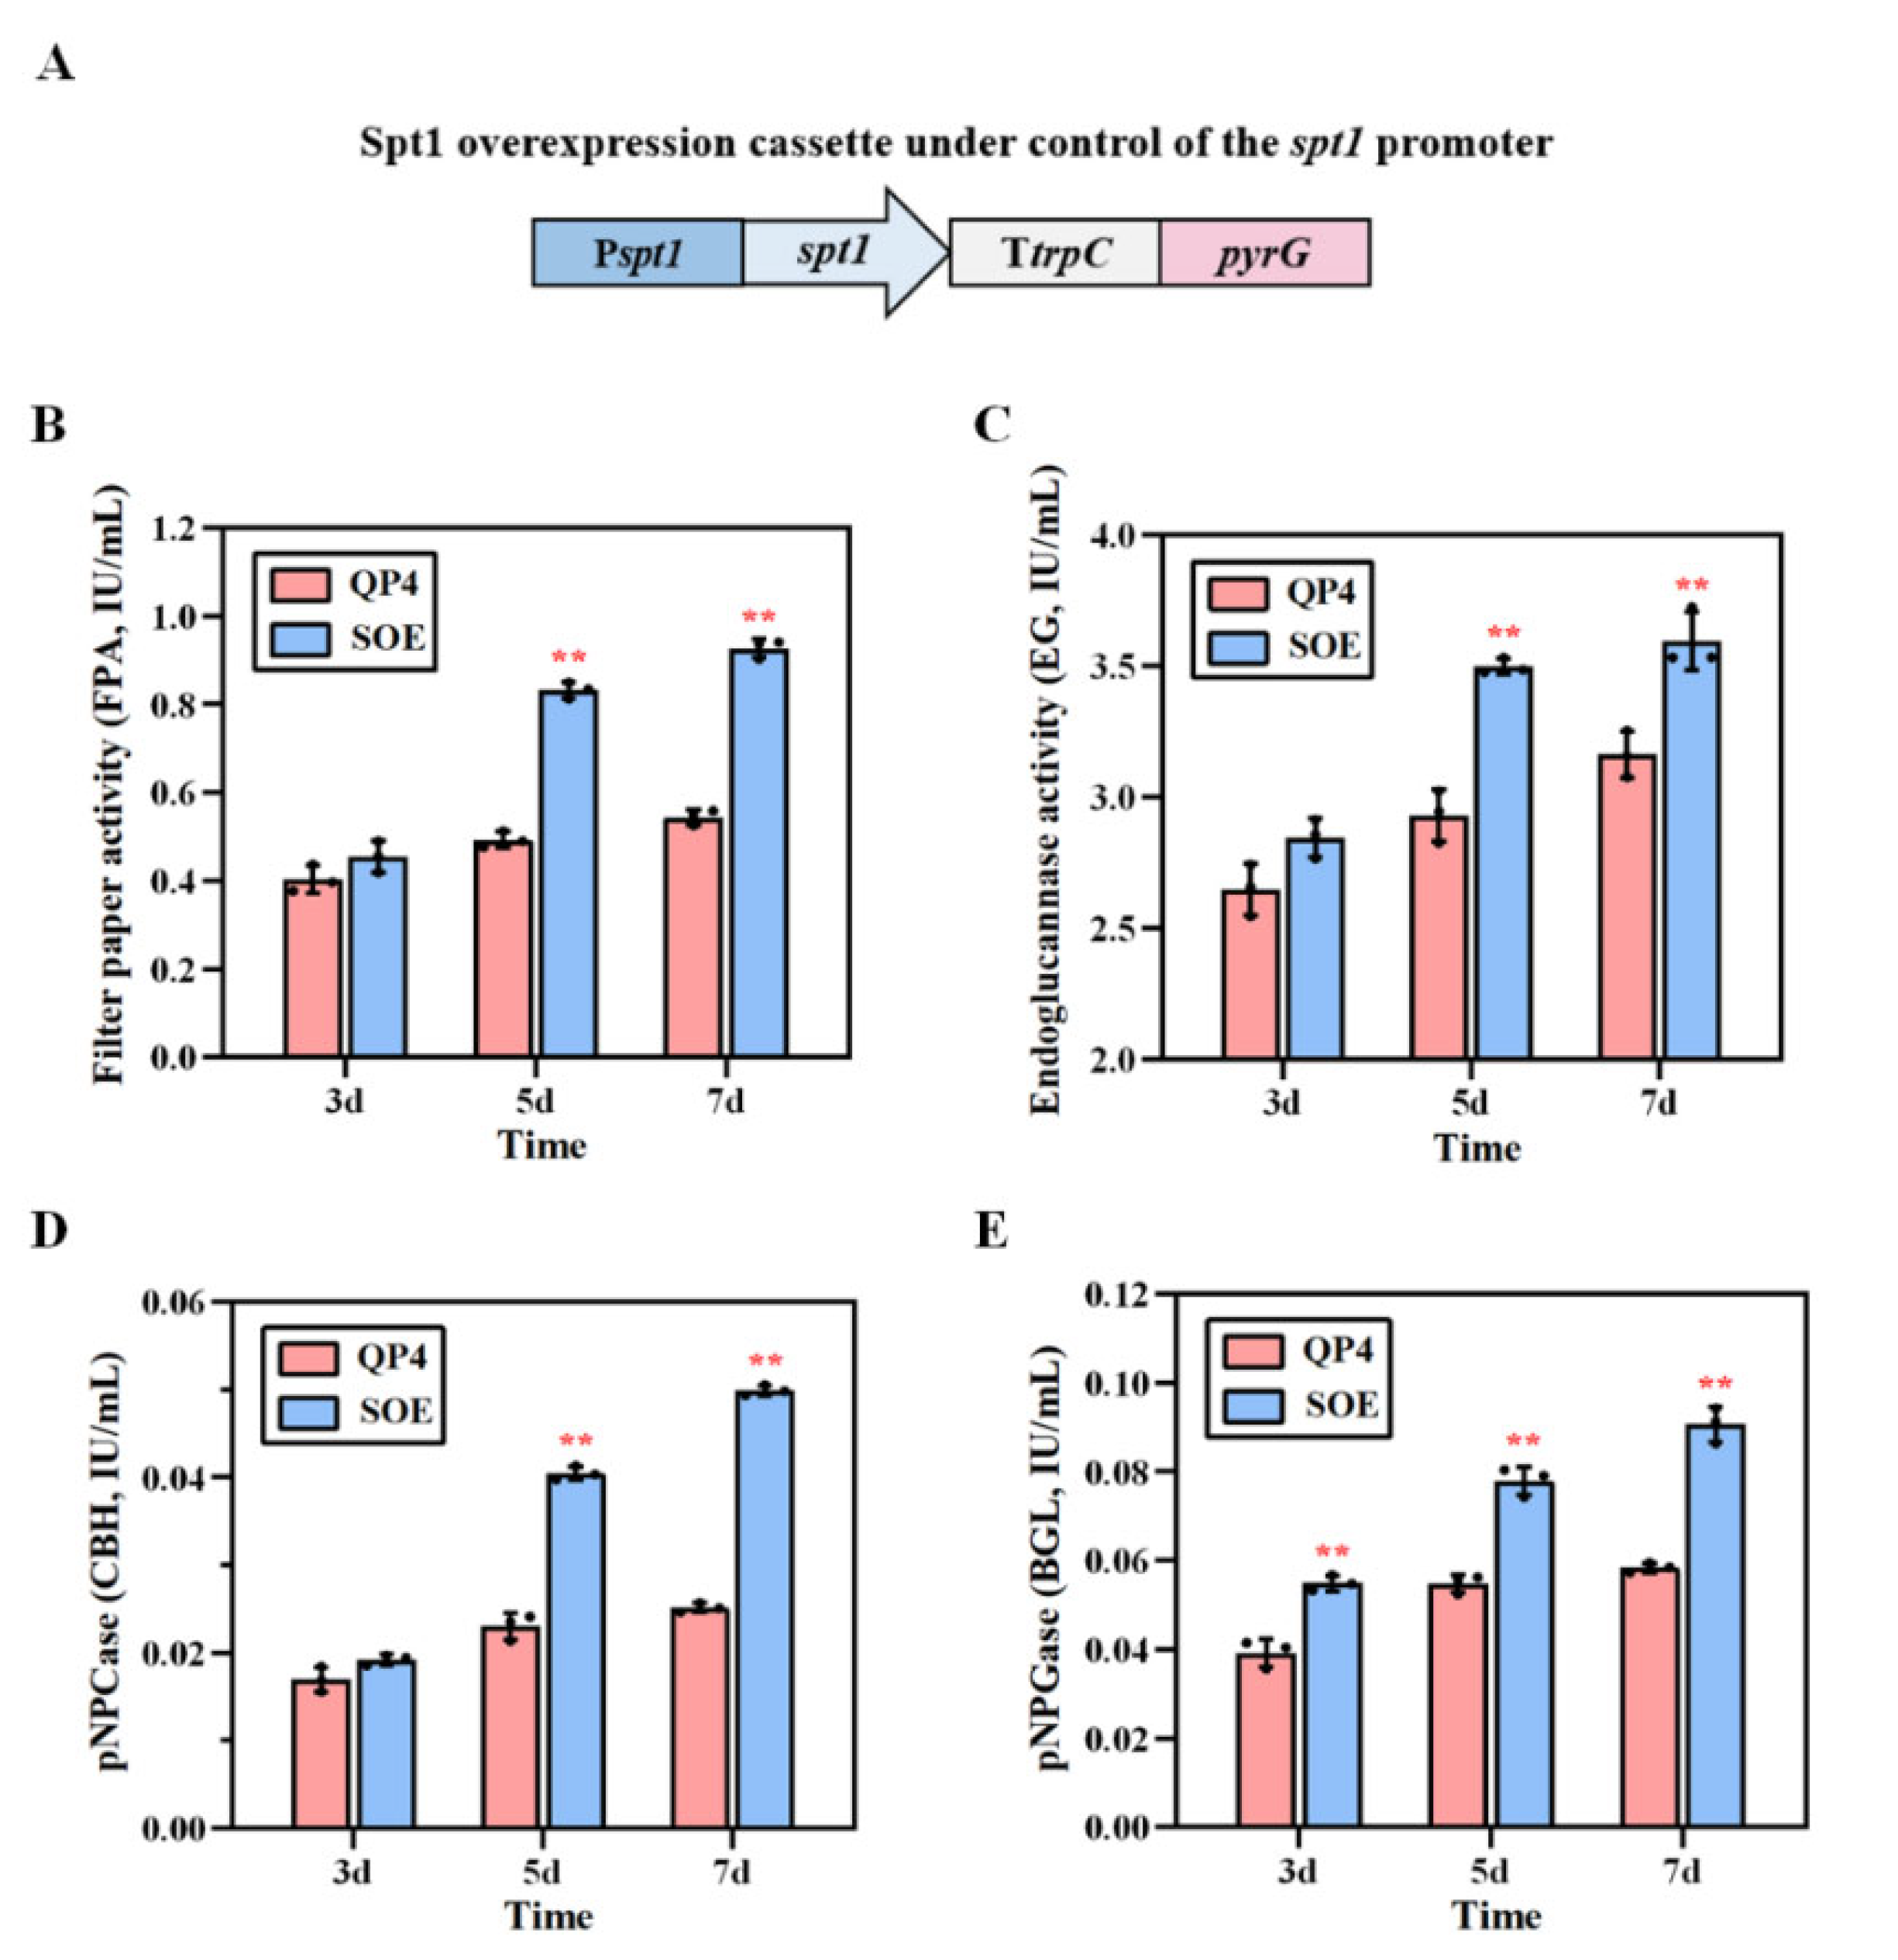
3.6. Overexpression of spt1, with Multiple Copies Improving Cellulase Production

The absence of spt1 decreased the cellulase production of T. reesei. Thus, to investigate whether the overexpression of spt1 affects cellulase production, the spt1 overexpression strain was constructed by inserting multiple copies of spt1 into the genome of QP4 through a random integration strategy. The spt1 overexpression cassette included the spt1 promoter, the coding region of spt1, the trpC terminator and the marker gene pyrG (Figure 6A). Then, the cassette was transformed into the protoplast of T. reesei QP4, and the transformants were screened on the MM plate without uracil to obtain the spt1 overexpression strain SOE. In order to analyze the influence of spt1 overexpression on the cellulase production of T. reesei, the spt1 overexpression strain SOE and the parental strain QP4 were fermented in CPM medium, and the cellulase activities were measured after taking the supernatant of the fermentation liquid at 3, 5 and 7 days. The results showed that the FPA, EG, CBH and BGL activities of SOE were significantly higher than those of the parental strain QP4 (Figure 6B–E). Specific to the results of the cellulase activities on the 7th day, the FPA, EG, CBH and BGL activities of SOE were 0.93 U/mL, 3.61 U/mL, 0.05 U/mL and 0.09 U/mL, respectively, which were increased by 75.4%, 18.8%, 108.3% and 55.2% compared with those of the parental strain QP4. Altogether, these results indicated that the overexpression of spt1 by introducing multiple copies could improve the cellulase production of T. reesei, suggesting that spt1 could be used as a target to improve the cellulase-producing capacity of T. reesei.

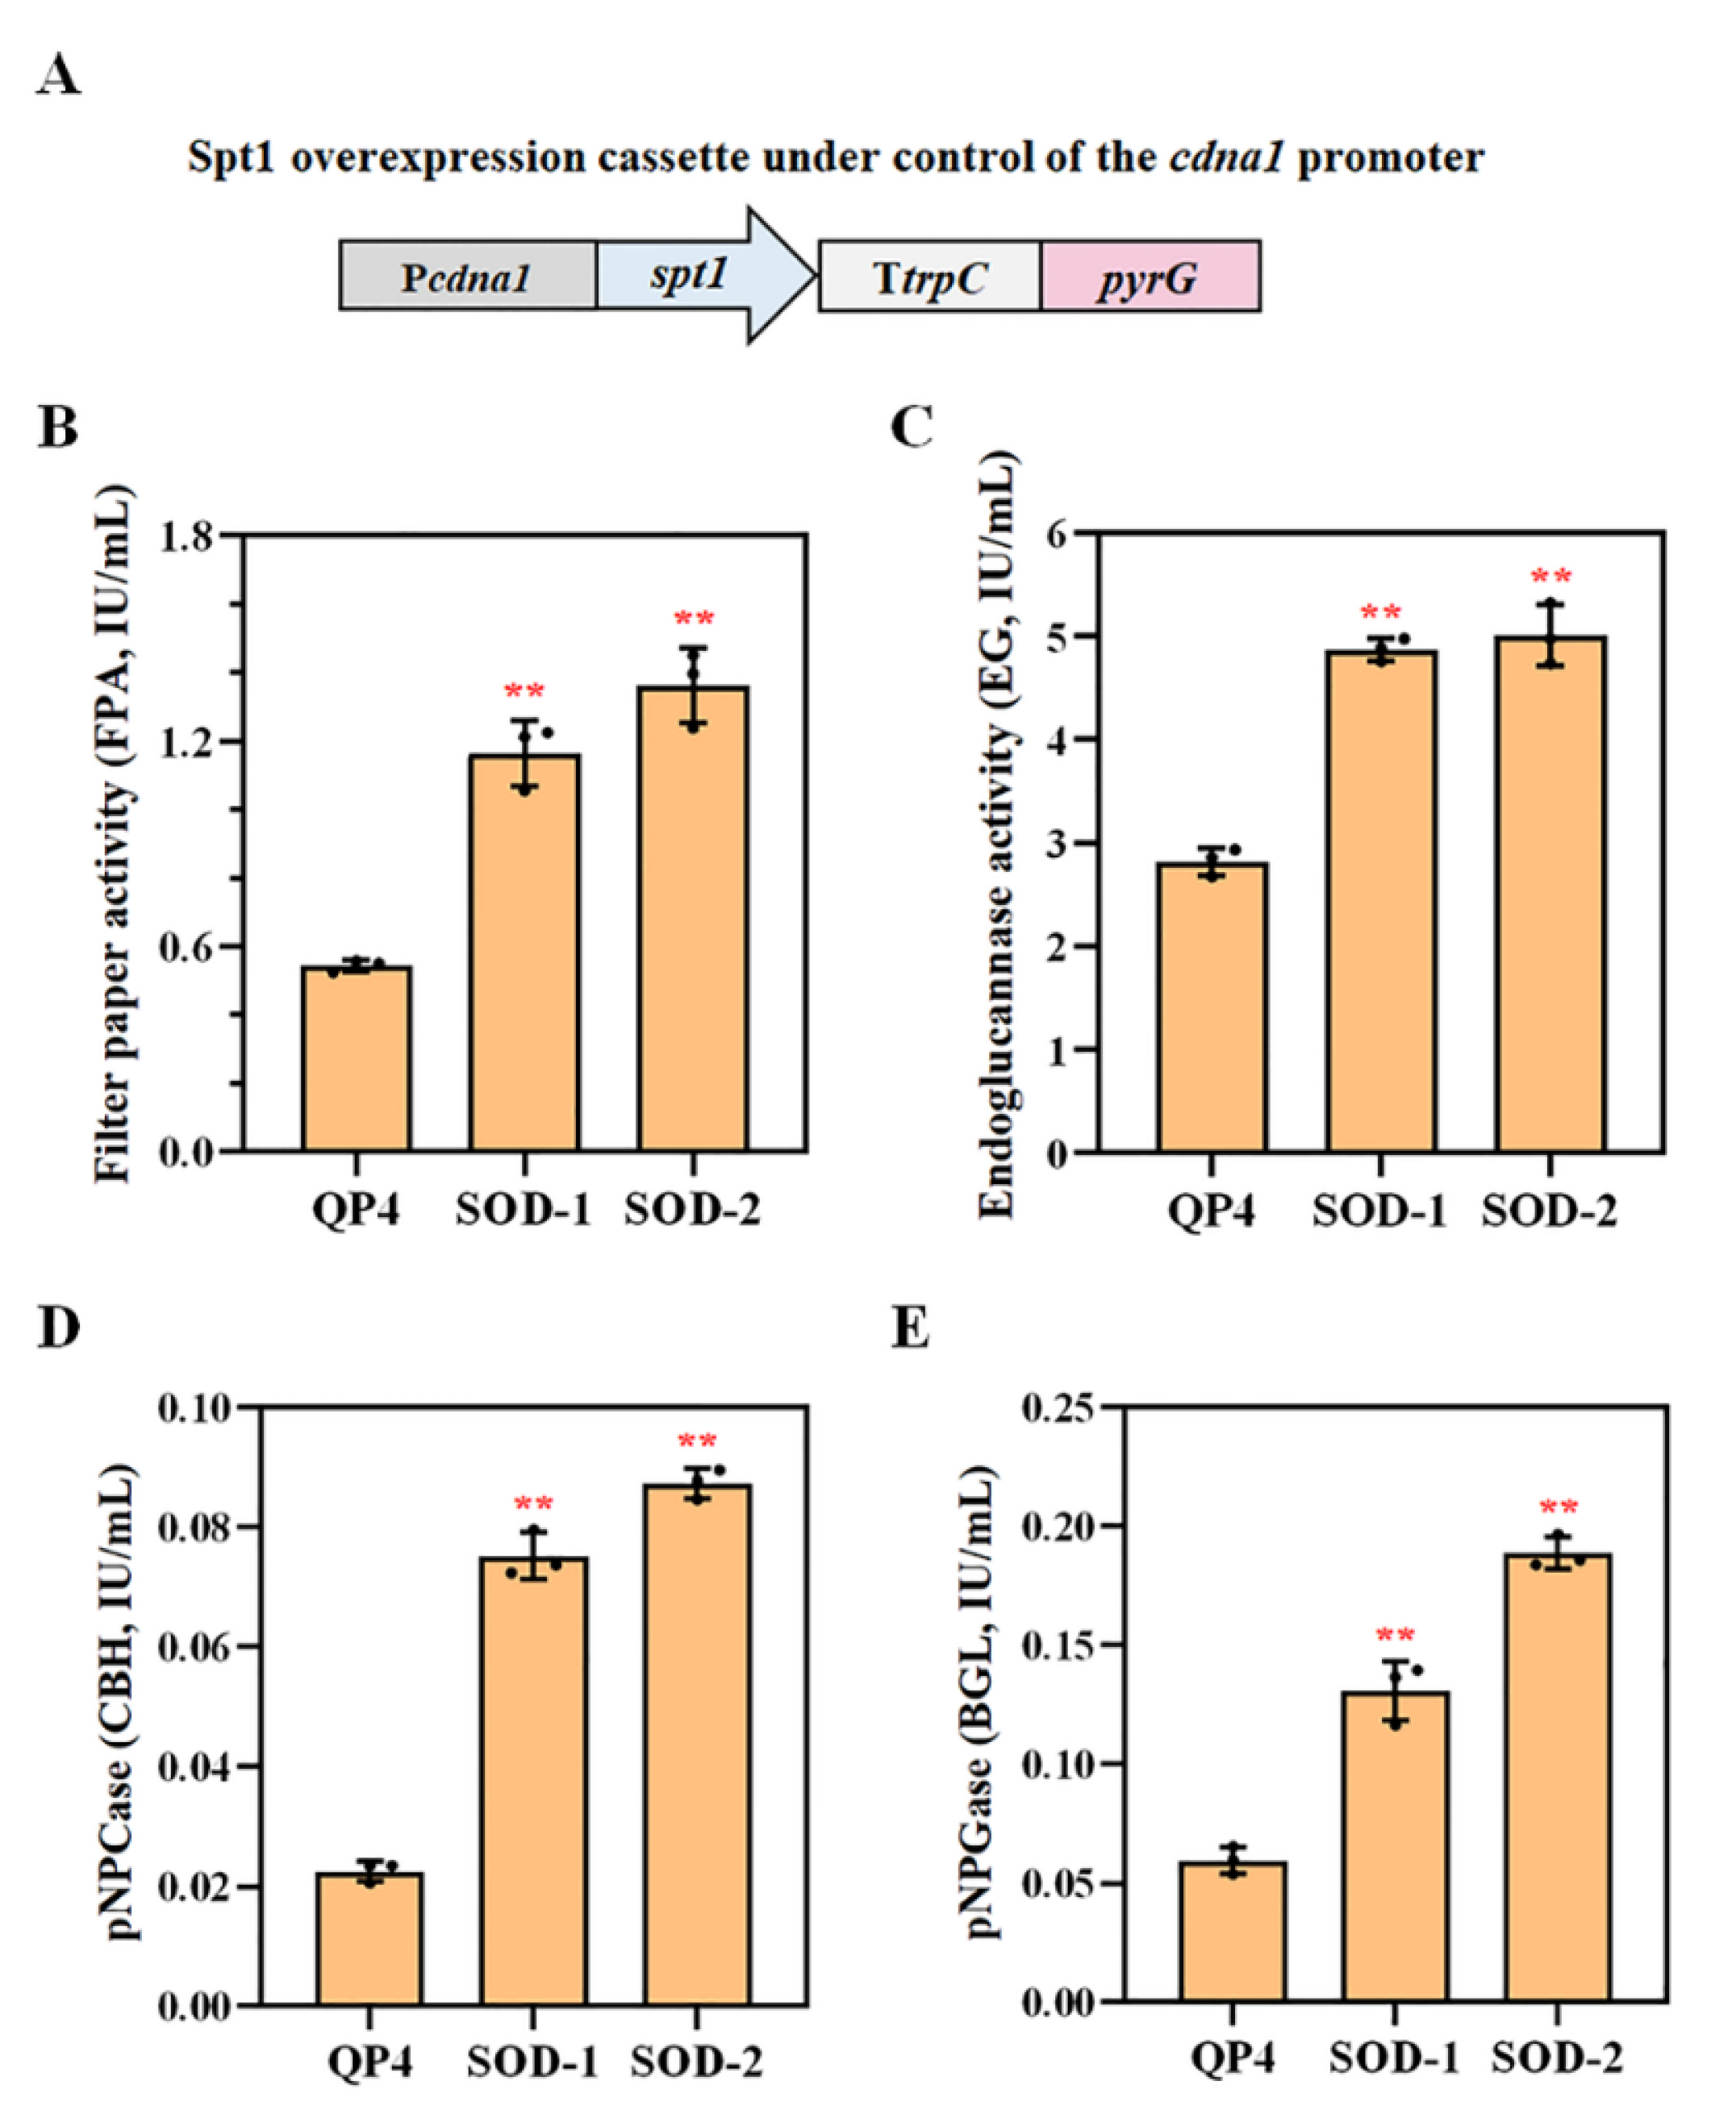
3.7. Overexpression of spt1 with the Strong Promoter Pcdna1 Enhancing the Cellulase Production

As mentioned above, the overexpression of spt1 by introducing multiple copies under the control of its own promoter could increase the cellulase production of T. reesei. It was reported that the uncharacterized gene promoter Pcdna1 was found to be stronger than the glyceraldehyde-3-phosphate dehydrogenase promoter Pgpd1 and the translation extension factor promoter Ptef1 by screening the T. reesei expression cDNA library [35]. Pcdna1 was considered to be one of the strongest constitutive promoters in T. reesei, and its activity was much higher than that of Pspt1. Here, Pcdna1 was selected to drive the enhanced overexpression of the spt1 gene. As shown in Figure 7A, the spt1 enhanced the overexpression cassette including the cdna1 promoter, the spt1 gene coding region and the trpC terminator, and the pyrG marker gene was obtained. Then, the overexpression cassette was randomly integrated into the QP4 genome. Among the transformants, two spt1 overexpression strains, SOD-1 and SOD-2, with stable genetic ability, were selected for further analysis. The cellulase production capacity of the two spt1 overexpression strains was detected by measuring the cellulase activities in the supernatant of the CPM medium after 7 days of fermentation. The activities of FPA, EG, CBH and BGL in the SOD-1 and SOD-2 strains were significantly increased compared with those of the parental strain QP4 (Figure 7B–E). The cellulase activities of SOD-2 were higher than those of SOD-1, which might be due to the number of copies of spt1 in the strains. The further analysis of the SOD-2 cellulase activities results showed that the activities of FPA, EG, CBH and BGL in SOD-2 were 1.36 U/mL, 4.95 U/mL, 0.08 U/mL and 0.18 U/mL, respectively, which were increased by 172.0%, 63.3%, 302.0% and 260.0% compared with the results of the parental strain QP4. Among the cellulase components, CBH exhibited the most significant enhancement, suggesting that the increase in FPA might be mainly due to the increase in CBH activity. These results indicated that the overexpression of spt1 with the strong promoter Pcdna1 could significantly promote the cellulase production in T. reesei.

4. Discussion

T. reesei has received increasing attention due to its natural ability to secrete large quantities of cellulase, and it has been used as the main industrial fungus for cellulase production. Improving the cellulase production capacity by constructing the modified T. reesei strains is an effective strategy for reducing the cost of biofuels production using lignocellulosic biomass in industry [36,37]. It was reported that engineering the protein secretory pathway could significantly enhance the cellulase secretion of T. reesei, but the current published research has mainly focused on the modification of genes related to protein secretion in the ER, and the functions of key genes in the vacuole remain poorly understood [13,14]. In this study, we identified a new vacuolar serine protease gene spt1 in T. reesei, investigated the effect of its deletion and overexpression on cellulase production and achieved the construction of a high-yielding cellulase strain by manipulating the spt1 gene.
Here, Spt1 was found to be located in vacuoles by FM4-64 staining and Spt1–eGFP fusion expression, and it was identified as a novel vacuolar protease (Figure 3D). Vacuole is a protease-rich organelle that degrades proteins for energy. In some cases, such as disordered sorting systems, secreted proteins can appear in the vacuole and be degraded, resulting in reduced protein production [12]. It has been reported that manipulating vacuole-related functional genes may contribute to the efficient secretion of extracellular proteins in eukaryotes. Yoon et al. demonstrated that the knockout of the vacuolar protein sorting receptor AoVps10 in A. oryzae could reduce the erroneous transport of proteins to vacuoles, thereby increasing recombinant protein production [38]. In S. cerevisiae, only the knockout of Vps10 had a positive effect on extracellular protein secretion, whereas the knockout of Vps22 and Vps34 resulted in poor protein secretion [39]. In addition, the knockout of Vps8 and Vps21 in P. pastoris could cause a large amount of extracellular protease secretion, thus reducing the production of the target protein [40]. Meanwhile, it was found that the destruction of the μ subunit of adaptor protein 3 (AP-3) to reduce vacuole transport and impair the alkaline phosphatase ALP pathway, which is one of the vacuole sorting pathways, could also increase the production of cellulase in N. crassa [19]. Therefore, it is of great significance to search for vacuole-related functional genes that can improve cellulase production in T. reesei, which can reduce the vacuolar transport and the degradation of cellulase, improve cellulase production and further reveal the powerful protein secretion pathway in T. reesei. In this study, the deletion of the spt1 gene resulted in the defective cellulase secretion of T. reesei, and significantly increased cellulase production was detected in the spt1 overexpression strain (Figure 5 and Figure 6). Although the mechanism of spt1 in the cellulase secretion is still unclear, it is undoubtedly an effective target for improving the cellulase production of T. reesei.
The amino acid sequence of the Spt1 protein contained serine protease catalytic triplets (Asp, His and Ser) belonging to the subtilisin S8 family. Recent advances in vacuolar proteases mainly show that vacuolar serine proteases/subtilisin-like proteases are required for the fungal virulence and phenotypic traits, and they play a role in autophagy. The prb1 mutant significantly weakened the degradation of autophagic bodies inside vacuoles, suggesting that a subtilisin-like protease Prb1 was a major protease for autophagy in S. cerevisiae [41]. Saitoh et al. demonstrated that the vacuolar subtilisin-like protease Spm1 played an important role in autophagy during infection and was involved in spore germination and the appressorium development of M. oryzae [21]. In addition, it was found that the subtilisin-like protease FgPrb1 in F. graminosa regulated fungal virulence and pathogenicity through the autophagy pathway, and its loss impaired mycelium growth and spore production [42]. The absence of Aaprb1 decreased vegetative growth, spore formation, protease production and the virulence of A. alternata, and further studies revealed that some phenotypes of ΔAaprb1 were due to the impaired autophagy [43]. Especially, it has been reported that there is a cross-talk between asexual sporulation and extracellular cellulase production in fungi [44,45]. Thus, we hypothesized that the impaired sporulation in the cellulase-producing fungus T. reesei Δspt1 might be due to the loss-of-function of vacuolar serine proteases, the exact mechanism of which needs further investigation.
In conclusion, we identified a new vacuolar serine protease gene spt1 and investigated the cellulase production of the spt1 deletion strain Δspt1 and the spt1 overexpression strain SOE. The absence of spt1 resulted in a dramatic decrease in the extracellular cellulase secreted by T. reesei, and the overexpression of spt1 could significantly increase the cellulase production of T. reesei. Therefore, we found a new functional gene related to cellulase secretion, which could regulate the expression of spt1 through genetic manipulation to improve cellulase production. Moreover, the SOD-2 strain with spt1 overexpression driven by the strong promoter Pcdna1 was successfully generated, its FPA was raised by 172.0% and its CBH1 activity was prominently increased by 302% compared with the parental strain QP4. Our findings indicate that manipulating the expression of the vacuolar serine protease gene spt1 is a viable strategy for enhancing cellulase production for the efficient conversion of lignocellulosic biomass, suggesting that vacuole-related functional genes play a key role in the protein secretory pathway of T. reesei and deserve further investigation.

Supplementary Materials

The following supporting information can be downloaded at: https://www.mdpi.com/article/10.3390/fermentation9020191/s1. Table S1. Primers used in this study.

Author Contributions

C.Y. and Y.Z. conceived the work and drafted the manuscript. N.S. and C.Y. performed the experiments and analyzed the data. W.G., Y.S., J.Z. and H.L. designed the work and revised the manuscript. All authors have read and agreed to the published version of the manuscript.

Funding

This work was supported by grants from the National Key R&D Program of China (No. 2018YFA0900500; 2021YFC2101300), the National Natural Science Foundation of China (No. 31970070) and the Youth Interdisciplinary Science and Innovative Research Groups of Shandong University (2020QNQT006).

Institutional Review Board Statement

Not applicable.

Informed Consent Statement

Not applicable.

Data Availability Statement

Not applicable.

Acknowledgments

The authors thank Jingyao Qu and Zhifeng Li of the Core Facilities for Life and Environmental Sciences, State Key Laboratory of Microbial Technology of Shandong University, for their help and guidance in the qRT-PCR and protein analysis.

Conflicts of Interest

The authors declare that they have no competing interests.

References

  1. Liu, G.; Qu, Y. Engineering of filamentous fungi for efficient conversion of lignocellulose: Tools, recent advances and prospects. Biotechnol. Adv. 2018, 37, 519–529. [Google Scholar] [CrossRef]
  2. Limayem, A.; Ricke, S.C. Lignocellulosic biomass for bioethanol production: Current perspectives, potential issues and future prospects. Prog. Energy Combus. Sci. 2012, 38, 449–467. [Google Scholar] [CrossRef]
  3. Balan, V. Current challenges in commercially producing biofuels from lignocellulosic biomass. ISRN Biotechnol. 2014, 31, 463074. [Google Scholar] [CrossRef] [Green Version]
  4. Bilal, M.; Iqbal, H.M.N. Recent Advancements in the Life Cycle Analysis of Lignocellulosic Biomass. Curr. Sustain. Renew. Energy Rep. 2020, 7, 100–107. [Google Scholar] [CrossRef]
  5. Garvey, M.; Klose, H.; Fischer, R.; Lambertz, C.; Commandeur, U. Cellulases for biomass degradation: Comparing recombinant cellulase expression platforms. Trends Biotechnol. 2013, 31, 581–593. [Google Scholar] [CrossRef]
  6. Bischof, R.H.; Ramoni, J.; Seiboth, B. Cellulases and beyond: The first 70 years of the enzyme producer Trichoderma reesei. Microb. Cell Fact. 2016, 15, 106. [Google Scholar] [CrossRef] [Green Version]
  7. Kubicek, C.P.; Mikus, M.; Schuster, A.; Schmoll, M.; Seiboth, B. Metabolic engineering strategies for the improvement of cellulase production by Hypocrea jecorina. Biotechnol. Biofuels. 2009, 2, 19. [Google Scholar] [CrossRef] [Green Version]
  8. Martinez, D.; Berka, R.M.; Henrissat, B.; Saloheimo, M.; Arvas, M.; Baker, S.E.; Chapman, J.; Chertkov, O.; Coutinho, P.M.; Cullen, D.; et al. Genome sequencing and analysis of the biomass-degrading fungus Trichoderma reesei (syn. Hypocrea jecorina). Nat. Biotechnol. 2008, 26, 553–560. [Google Scholar] [CrossRef] [Green Version]
  9. Arai, T.; Ichinose, S.; Shibata, N.; Kakeshita, H.; Kodama, H.; Igarashi, K.; Takimura, Y. Inducer-free cellulase production system based on the constitutive expression of mutated XYR1 and ACE3 in the industrial fungus Trichoderma reesei. Sci. Rep. 2022, 12, 19445. [Google Scholar] [CrossRef]
  10. Adnan, M.; Ma, X.; Olsson, S.; Wang, J.; Liu, G. Promoter regulation and genetic engineering strategies for enhanced cellulase expression in Trichoderma reesei. Microbiol. Res. 2022, 259, 127011. [Google Scholar] [CrossRef]
  11. Li, C.; Pang, A.P.; Yang, H.; Lv, R.; Zhou, Z.; Wu, F.G.; Lin, F. Tracking localization and secretion of cellulase spatiotemporally and directly in living Trichoderma reesei. Biotechnol. Biofuels Bioprod. 2019, 12, 200. [Google Scholar] [CrossRef]
  12. Yan, S.; Xu, Y.; Yu, X.W. From induction to secretion: A complicated route for cellulase production in Trichoderma reesei. Bioresour. Bioprocess. 2021, 8, 107. [Google Scholar] [CrossRef]
  13. Shen, L.; Gao, J.; Wang, Y.; Li, X.; Liu, H.; Zhong, Y. Engineering the endoplasmic reticulum secretory pathway in Trichoderma reesei for improved cellulase production. Enzyme Microb. Technol. 2021, 152, 109923. [Google Scholar] [CrossRef]
  14. Gao, F.; Hao, Z.; Sun, X.; Qin, L.; Zhao, T.; Liu, W.; Luo, H.; Yao, B.; Su, X. A versatile system for fast screening and isolation of Trichoderma reesei cellulase hyperproducers based on DsRed and fluorescence-assisted cell sorting. Biotechnol. Biofuels. 2018, 11, 261. [Google Scholar] [CrossRef]
  15. Yao, C.; Yan, M.; Li, K.; Gao, W.; Li, X.; Zhang, J.; Liu, H.; Zhong, Y. The ERAD Pathway Participates in Fungal Growth and Cellulase Secretion in Trichoderma reesei. J. Fungi 2023, 9, 74. [Google Scholar] [CrossRef]
  16. Wu, Y.; Sun, X.; Xue, X.; Luo, H.; Yao, B.; Xie, X.; Su, X. Overexpressing key component genes of the secretion pathway for enhanced secretion of an Aspergillus niger glucose oxidase in Trichoderma reesei. Enzyme Microb. Technol. 2017, 106, 83–87. [Google Scholar] [CrossRef]
  17. Tang, H.; Song, M.; He, Y.; Wang, J.; Wang, S.; Shen, Y.; Hou, J.; Bao, X. Engineering vesicle trafficking improves the extracellular activity and surface display efficiency of cellulases in Saccharomyces cerevisiae. Biotechnol. Biofuels. 2017, 10, 53. [Google Scholar] [CrossRef] [Green Version]
  18. Li, S.C.; Kane, P.M. The yeast lysosome-like vacuole: Endpoint and crossroads. Biochim. Biophys. Acta. 2009, 1793, 650–663. [Google Scholar] [CrossRef] [Green Version]
  19. Pei, X.; Fan, F.; Lin, L.; Chen, Y.; Sun, W.; Zhang, S.; Tian, C. Involvement of the adaptor protein 3 complex in lignocellulase secretion in Neurospora crassa revealed by comparative genomic screening. Biotechnol. Biofuels. 2015, 8, 124. [Google Scholar] [CrossRef] [Green Version]
  20. Yoon, J.; Kikuma, T.; Maruyama, J.; Kitamoto, K. Enhanced production of bovine chymosin by autophagy deficiency in the filamentous fungus Aspergillus oryzae. PloS ONE 2013, 8, e62512. [Google Scholar] [CrossRef] [Green Version]
  21. Saitoh, H.; Fujisawa, S.; Ito, A.; Mitsuoka, C.; Berberich, T.; Tosa, Y.; Asakura, M.; Takano, Y.; Terauchi, R. SPM1 encoding a vacuole-localized protease is required for infection-related autophagy of the rice blast fungus Magnaporthe oryzae. FEMS Microbiol. Lett. 2009, 300, 115–121. [Google Scholar] [CrossRef] [Green Version]
  22. Shi, L.; Li, R.; Liao, S.; Bai, L.; Lu, Q.; Chen, B. Prb1, a subtilisin-like protease, is required for virulence and phenotypical traits in the chestnut blight fungus. FEMS Microbiol. Lett. 2014, 359, 26–33. [Google Scholar] [CrossRef] [Green Version]
  23. Häkkinen, M.; Valkonen, M.J.; Westerholm-Parvinen, A.; Aro, N.; Arvas, M.; Vitikainen, M.; Penttilä, M.; Saloheimo, M.; Pakula, T.M. Screening of candidate regulators for cellulase and hemicellulase production in Trichoderma reesei and identification of a factor essential for cellulase production. Biotechnol. Biofuels. 2014, 7, 14. [Google Scholar] [CrossRef] [Green Version]
  24. Steiger, M.G.; Vitikainen, M.; Uskonen, P.; Brunner, K.; Adam, G.; Pakula, T.; Penttilä, M.; Saloheimo, M.; Mach, R.L.; Mach-Aigner, A.R. Transformation system for Hypocrea jecorina (Trichoderma reesei) that favors homologous integration and employs reusable bidirectionally selectable markers. Appl. Environ. Microbiol. 2011, 77, 114–121. [Google Scholar] [CrossRef] [Green Version]
  25. Qian, Y.; Zhong, L.; Hou, Y.; Qu, Y.; Zhong, Y. Characterization and Strain Improvement of a Hypercellulytic Variant, Trichoderma reesei SN1, by Genetic Engineering for Optimized Cellulase Production in Biomass Conversion Improvement. Front. Microbiol. 2016, 7, 1349. [Google Scholar] [CrossRef] [Green Version]
  26. Punt, P.J.; van den Hondel, C.A. Transformation of filamentous fungi based on hygromycin B and phleomycin resistance markers. Methods Enzymol. 1992, 216, 447–457. [Google Scholar] [CrossRef]
  27. Krappmann, S.; Bayram, O.; Braus, G.H. Deletion and allelic exchange of the Aspergillus fumigatus veA locus via a novel recyclable marker module. Eukaryot. Cell. 2005, 4, 1298–1307. [Google Scholar] [CrossRef] [Green Version]
  28. Pöggeler, S.; Masloff, S.; Hoff, B.; Mayrhofer, S.; Kück, U. Versatile EGFP reporter plasmids for cellular localization of recombinant gene products in filamentous fungi. Curr. Genet. 2003, 43, 54–61. [Google Scholar] [CrossRef]
  29. Hartl, L.; Seiboth, B. Sequential gene deletions in Hypocrea jecorina using a single blaster cassette. Curr. Genet. 2005, 48, 204–211. [Google Scholar] [CrossRef]
  30. Penttilä, M.; Nevalainen, H.; Rättö, M.; Salminen, E.; Knowles, J. A versatile transformation system for the cellulolytic filamentous fungus Trichoderma reesei. Gene 1987, 61, 155–164. [Google Scholar] [CrossRef]
  31. Qian, Y.; Zhong, L.; Gao, J.; Sun, N.; Wang, Y.; Sun, G.; Qu, Y.; Zhong, Y. Production of highly efficient cellulase mixtures by genetically exploiting the potentials of Trichoderma reesei endogenous cellulases for hydrolysis of corncob residues. Microb. Cell Fact. 2017, 16, 207. [Google Scholar] [CrossRef] [Green Version]
  32. Yu, J.H.; Hamari, Z.; Han, K.H.; Seo, J.A.; Reyes-Domínguez, Y.; Scazzocchio, C. Double-joint PCR: A PCR-based molecular tool for gene manipulations in filamentous fungi. Fungal Genet. Biol. 2004, 41, 973–981. [Google Scholar] [CrossRef]
  33. Ghose, T.K. Measurement of cellulase activities. Pure Appl. Chem. 1987, 59, 257–268. [Google Scholar] [CrossRef]
  34. Sun, Y.; Qian, Y.; Zhang, J.; Yao, C.; Wang, Y.; Liu, H.; Zhong, Y. Development of a novel expression platform for heterologous protein production via deleting the p53-like regulator Vib1 in Trichoderma reesei. Enzyme Microb. Technol. 2022, 155, 109993. [Google Scholar] [CrossRef]
  35. Nakari-Setälä, T.; Penttilä, M. Production of Trichoderma reesei cellulases on glucose-containing media. Appl. Environ. Microbiol. 1995, 61, 3650–3655. [Google Scholar] [CrossRef] [Green Version]
  36. Druzhinina, I.S.; Kubicek, C.P. Genetic engineering of Trichoderma reesei cellulases and their production. Microb. Biotechnol. 2017, 10, 1485–1499. [Google Scholar] [CrossRef]
  37. Fang, H.; Li, C.; Zhao, J.; Zhao, C. Biotechnological advances and trends in engineering Trichoderma reesei towards cellulase hyperproducer. Biotechnol. Bioprocess Eng. 2021, 26, 517–528. [Google Scholar] [CrossRef]
  38. Yoon, J.; Aishan, T.; Maruyama, J.; Kitamoto, K. Enhanced production and secretion of heterologous proteins by the filamentous fungus Aspergillus oryzae via disruption of vacuolar protein sorting receptor gene Aovps10. Appl. Environ. Microbiol. 2010, 76, 5718–5727. [Google Scholar] [CrossRef] [Green Version]
  39. Idiris, A.; Tohda, H.; Sasaki, M.; Okada, K.; Kumagai, H.; Giga-Hama, Y.; Takegawa, K. Enhanced protein secretion from multiprotease-deficient fission yeast by modification of its vacuolar protein sorting pathway. Appl. Microbiol. Biotechnol. 2010, 85, 667–677. [Google Scholar] [CrossRef]
  40. Marsalek, L.; Gruber, C.; Altmann, F.; Aleschko, M.; Mattanovich, D.; Gasser, B.; Puxbaum, V. Disruption of genes involved in CORVET complex leads to enhanced secretion of heterologous carboxylesterase only in protease deficient Pichia pastoris. Biotechnol. J. 2017, 12, 584. [Google Scholar] [CrossRef]
  41. Takeshige, K.; Baba, M.; Tsuboi, S.; Noda, T.; Ohsumi, Y. Autophagy in yeast demonstrated with proteinase-deficient mutants and conditions for its induction. J. Cell Biol. 1992, 119, 301–311. [Google Scholar] [CrossRef] [Green Version]
  42. Xu, L.; Wang, H.; Zhang, C.; Wang, J.; Chen, A.; Chen, Y.; Ma, Z. System-wide characterization of subtilases reveals that subtilisin-like protease FgPrb1 of Fusarium graminearum regulates fungal development and virulence. Fungal Genet. Biol. 2020, 144, 103449. [Google Scholar] [CrossRef]
  43. Fu, H.; Chung, K.R.; Liu, X.; Li, H. Aaprb1, a subtilsin-like protease, required for autophagy and virulence of the tangerine pathotype of Alternaria alternata. Microbiol. Res. 2020, 240, 126537. [Google Scholar] [CrossRef]
  44. Yao, G.; Li, Z.; Wu, R.; Qin, Y.; Liu, G.; Qu, Y. Penicillium oxalicum PoFlbC regulates fungal asexual development and is important for cellulase gene expression. Fungal Genet. Biol. 2016, 86, 91–102. [Google Scholar] [CrossRef]
  45. Lei, Y.; Liu, G.; Li, Z.; Gao, L.; Qin, Y.; Qu, Y. Functional characterization of protein kinase CK2 regulatory subunits regulating Penicillium oxalicum asexual development and hydrolytic enzyme production. Fungal Genet. Biol. 2014, 66, 44–53. [Google Scholar] [CrossRef]
Figure 1. Sequence and phylogenetic analysis of T. reesei Spt1 and its homologs in fungi. (A) Phylogenetic tree of Spt1 homologs in various fungal species. The sequence alignments were performed using the Clustal W program, and the phylogenetic tree was constructed using a neighbor-joining tree, with a bootstrap method of 1000 replications, in the MEGA 6 program. The numbers represent bootstrap values. The scale bar denotes 0.01 changes per nucleotide position. (B) Diagram for the domain architecture of Spt1 homologs. These proteins contain an inhibitor I9 domain (yellow box) and a peptidase S8 domain (blue box). (C) Alignment of the amino acid sequence of Spt1 with related fungal sequences. The high-identity regions in the amino acid sequence are indicated with black backgrounds. The red boxes indicate the active sites for the serine protease belonging to the subtilisin family. * indicate that where the active sites for the serine protease are located. The sequence accession numbers are as follows: XP_006967823.1 (Trichoderma reesei Spt1), OTA08635.1 (Trichoderma parareesei Sub8), UKZ55678.1 (Trichoderma virens Spm1), ABI84117.1 (Trichoderma harzianum Spm1), RSL72882.1 (Fusarium floridanum Spm1), RSM13570.1 (Fusarium ambrosium Spm1), XP_965813.3 (Neurospora crassa p2), KAH8844371.1 (Pyricularia oryzae Spm1), XP_001391470 (Aspergillus niger PepC), XP_715244 (Candida albicans PrB) and NP_010854 (Saccharomyces cerevisiae Prb1).
Fermentation 09 00191 g001
Figure 2. Construction of the spt1 deletion strain Δspt1 and the spt1 complementation strain Com-spt1. (A) Schematic diagram of the spt1 deletion cassette. The cassette was inserted into the endogenous spt1 locus by homologous recombination to knock out the spt1 gene. (B) Schematic diagram of the spt1 complementation cassette. The cassette was inserted into the hph gene locus by homologous recombination to complement the spt1 gene in the Δspt1 strain. (C) Phenotypic analysis of the strains under different carbon sources. The strains were grown on plates containing minimal medium supplemented with 2% glucose, 2% glycerol, 2% lactose or PDA at 30 °C for 3 days. (D) The fungal growth curves of the strains, using 2.0% glucose as the carbon sources. (E) The fungal growth curves of the strains, using 2.0% lactose as the carbon sources. The values represent the mean of three repeated measurements taken from at least three parallel experiments. The error bars refer to the standard deviations (SD). The difference between the parental strain and the recombinant strains was shown by the analysis of ANOVA followed by the Turkey test. ns = not significant.
Fermentation 09 00191 g002
Figure 3. Subcellular localization of Spt1 in T. reesei. (A) Evaluation of the ability to produce extracellular proteases by the Δspt1 strain. The strains were grown on media containing 1% skim milk. (B) The ratios of the hydrolysis halo to the colony diameter presented by panel (A). The values represent the average of three repeated measurements obtained from three different angles. The error bars refer to the standard deviations (SD). The difference between the parental strain and the deletion strain was shown by thr analysis of ANOVA followed by the Turkey test. ns = not significant. (C) Schematic diagram of the Spt1–eGFP fusion cassette. The cassette was inserted into the hph gene locus by homologous recombination in the Δspt1 strain. (D) The vacuolar localization of Spt1 was checked out in fungal mycelia under a confocal fluorescence microscope. Scale bar = 10 μm.
Fermentation 09 00191 g003
Figure 4. The detection of the cellulase secretion capacity of the spt1 deletion strain Δspt1 using the plates. (A) Qualitative analysis of the cellobiohydrolase (CBH) activity using the plate containing MCC (0.5%). The halo size around the fungal colony after 5 days of growth reflected the ability of the strains to produce cellobiohydrolase (CBH). (B) Qualitative analysis of the endoglucanase (EG) activity using the plate containing CMC-Na (1.0%). The plate was stained with 0.1% Congo red before the hydrolytic haloes were observed. The halo size around the fungal colony after 3 days of growth reflected the extent of the CMC-Na hydrolysis due to the endoglucanase (EG) production. (C) Qualitative analysis of the β-glucosidase (BGL) activity using the plate containing esculin (0.3%). The size of black area around the fungal colony after 24 h of growth indicated the ability of the strains to secrete β-glucosidase (BGL). (D) The cellobiohydrolase (CBH) activity was evaluated by quantifying the ratios of the hydrolytic halo to the colony diameter on the Avicel plate, as shown in (A). (E) The endoglucanase (EG) activity was evaluated by quantifying the ratios of the hydrolytic halo to the colony diameter on the CMC-Na plate, as shown in (B). (F) The β-glucosidase (BGL) activity was evaluated by quantifying the ratios of the black area to the colony diameter on the CMC-esculin plate, as shown in (C). The boundaries of the halos and the colonies are indicated by black or white arrows on the plates. The values represent the average of three repeated measurements obtained from three different angles. The error bars refer to the standard deviations (SD). The difference between the parental strain and the deletion strain was shown by the analysis of ANOVA, followed by the Turkey test. * p < 0.05; ** p < 0.01.
Fermentation 09 00191 g004
Figure 5. A comparison of cellulase production in T. reesei Δspt1, Com-spt1 and the parental strain QM53 during liquid fermentation, using MCC as the carbon source. The filter paper activity (A), the endoglucanase (EG) activity (B), the cellobiohydrolase (CBH) activity (C) and the β-glucosidase (BGL) activity (D) were determined in the fermentation broth on the 7th day. The strains were cultured in cellulase-inducing medium containing MCC as the carbon source at 30 °C for 7 days. The values represent the mean of three repeated measurements taken from at least three parallel experiments. The error bars refer to the standard deviations (SD). The difference between the parental strain and the recombinant strains was shown by the analysis of ANOVA, followed by the Turkey test. ** p < 0.01.
Fermentation 09 00191 g005
Figure 6. Cellulase production by the strain SOE, using the native promoter Pspt1 to drive spt1 overexpression. (A) Schematic diagram of the spt1 gene overexpression cassette (6.0 kb) under the control of the native promoter Pspt1. The cassette would be inserted into the genome of T. reesei with multiple copies by random integration. The filter paper activity (B), the endoglucanase (EG) activity (C), the cellobiohydrolase (CBH) activity (D) and the β-glucosidase (BGL) activity (E) were measured at 3 d, 5 d, and 7 d of cellulase-inducing cultivation. The strains were cultured in cellulase-inducing medium containing MCC as the carbon source at 30 °C for 7 days. The values represent the mean of three repeated measurements taken from at least three parallel experiments. The error bars refer to the standard deviations (SD). The difference between the parental strain and the overexpression strain was shown by the analysis of ANOVA, followed by the Turkey test. ** p < 0.01.
Fermentation 09 00191 g006
Figure 7. Cellulase production by the strains SOD-1 and SOD-2, using the strong constitutive promoter Pcdna1 to drive spt1 overexpression. (A) Schematic diagram of the spt1 gene overexpression cassette (6.0 kb) under the control of the strong constitutive promoter Pcdna1. The cassette would be inserted into the genome of T. reesei with multiple copies by random integration. The filter paper activity (B), the endoglucanase (EG) activity (C), the cellobiohydrolase (CBH) activity (D) and the β-glucosidase (BGL) activity (E) of the culture supernatant from the spt1 overexpression strains (SOD-1, SOD-2) and the parental strain QM53 were measured on the 7th day of fermentation. The strains were cultured in cellulase-inducing medium containing MCC as the carbon source at 30 °C for 7 days. The values represent the mean of three repeated measurements taken from at least three parallel experiments. The error bars refer to the standard deviations (SD). The difference between the parental strain and the overexpression strains was shown by the analysis of ANOVA, followed by the Turkey test. ** p < 0.01.
Fermentation 09 00191 g007
Disclaimer/Publisher’s Note: The statements, opinions and data contained in all publications are solely those of the individual author(s) and contributor(s) and not of MDPI and/or the editor(s). MDPI and/or the editor(s) disclaim responsibility for any injury to people or property resulting from any ideas, methods, instructions or products referred to in the content.

