Article

Food Ingredients for the Future: In-Depth Analysis of the Effects of Lactic Acid Bacteria Fermentation on Spent Barley Rootlets

1
School of Food and Nutritional Science, University College Cork, Western Road, T12K8AF Cork, Ireland
2
Department of Environmental Biology, “Sapienza” University of Rome, 00185 Rome, Italy
3
Global Innovation & Technology Centre, Anheuser-Busch InBev SA/NV, 3000 Leuven, Belgium
4
APC Microbiome Ireland, University College Cork, Western Road, T12K8AF Cork, Ireland
*
Author to whom correspondence should be addressed.
Fermentation 2023, 9(1), 78; https://doi.org/10.3390/fermentation9010078
Submission received: 22 December 2022 / Revised: 10 January 2023 / Accepted: 14 January 2023 / Published: 16 January 2023
(This article belongs to the Special Issue Bioactivity Change in Fermented Foods)

Abstract

:
Repurposing by-products to alternative applications has become a vital part of food research. Barley rootlets (BRs) are a side-stream of malting and brewing industries. This study focuses on processing BRs into food ingredients, using fermentation with five lactic acid bacteria (LAB) as a valorisation technique. The strains used were Lactiplantibacillus plantarum FST 1.7, Lactobacillus amylovorus FST2.11, Weissella cibaria MG1, Leuconostoc citreum TR116 and Limosilactobacillus reuteri R29. The influence of fermentation on sugar/FODMAP/acid compositions and microbial metabolites in BRs was analysed. A variety of techno-functional properties were also evaluated. Results showed BRs were a suitable substrate for LAB, particularly for Lactiplantibacillus plantarum FST 1.7 and Lactobacillus amylovorus FST2.11. Sugar, acid and the FODMAP composition of the fermented BRs demonstrated various traits imparted by LABs, including high mannitol production from Leuconostoc citreum TR116 and Limosilactobacillus reuteri R29. Limosilactobacillus reuteri R29 also produced fructans using BRs as a substrate. A techno-functional analysis of BRs showed a significant reduction in α-amylase activity post sterilisation and fermentation. Fermentation reduced water-binding capacity and significantly increased oil-binding capacity. The LAB used displayed great potential in improving the functionality of BRs as a food ingredient while also showcasing LAB fermentation as a viable processing aid for BR valorisation.

1. Introduction

By-product valorisation has become an important part of food research in recent years. Rootlets are the main by-product of the malting industry and can be generated in quantities of 3–5% of the weight of the malt produced [1,2]. As the malting industry is intrinsically associated with the brewing industry, rootlets are also considered a by-product of the brewing industry [3]. Rootlets, often referred to as malt coombes/culms/sprouts/germs, are produced during the germination stage of malting and are collected in the deculming process, which follows malt kilning [4]. Depending on the type of malt produced, rootlets may be sourced from a variety of grains [5]. However, barley (hordeum vulgare) is the most common grain used for brewing purposes [3]; therefore, the vast majority of rootlets originate from barley.
Barley rootlets (BRs) are an excellent source of nutrients, containing high levels of fibre (9.7–43%), protein (20.34–38.7%), minerals (2.8–8.7%) and minor amounts of fat (1.7–4.4%) [4]. In addition to this, BRs are a natural source of a diverse set of enzymes and antioxidants while also serving as a suitable substrate for lactic acid bacteria (LAB) fermentations and biochar production [4]. However, the main use of BRs to date has been confined to animal feed [6], with limited studies available investigating their use as a food ingredient [7,8,9,10]. Hence, further processing and exploration of BRs is required to make them a viable food ingredient.
Heat treatment is widely used as a processing aid in the food sector, with a variety of thermal treatments used depending on the end-goal requirements. Much like other brewing by-products, high microbial loads and high enzymatic activity is expected in BRs [11]. Thus, an initial thermal treatment is required to aid in the development of BRs as a food ingredient. In recent years, LAB fermentation has been explored as a processing aid for the valorisation of a variety of side-stream products, including brewers’ spent grain [12,13,14,15,16,17,18], bran and germ from wheat- and maize-milling side streams [19,20,21,22], surplus bread [23] and apple by-products [24]. These studies showed that the fermentation of the by-products improved ingredient properties as well as the techno-functional, sensory and nutritional aspects of bread and pasta products formulated with the fermented ingredients. In relation to BRs specifically, a previous study by Waters et al. [10] included fermented BR sourdough in a bread system, which reported improvements in bread texture and flavour perception with inclusion levels of 5–10% when compared to a wholemeal control, further showcasing the potential of fermentation as a processing aid.
This study investigates the use of batch LAB fermentation as a processing aid for the rejuvenation of BRs using five different LAB strains. This study differs from previous literature as it provides a fundamental study on the effects of processing (sterilisation and fermentation) on BRs and showcases the potential of the developed BR ingredients as ingredients for food applications, particularly in the cereal and bakery industry.

2. Materials and Methods

2.1. Raw Materials

BRs were provided by Anheuser-Busch InBev (Leuven, Belgium). All chemicals used in the experimental analysis were purchased from Sigma-Aldrich (St. Louis, MO, USA) unless stated otherwise. BRs were sieved, milled and fermented with Lactiplantibacillus plantarum (formerly Lactobacillus plantarum) FST 1.7 (BR-FST1.7), Lactobacillus amylovorus FST2.11 (BR-FST2.11), Weissella cibaria MG1 (BR-MG1), Leuconostoc citreum TR116 (BR-TR116) and Limosilactobacillus reuteri (formerly Lactobacillus reuteri) R29 (BR-R29). Unfermented (BR-UnF) and heat-treated BR (BR-Ster) ingredients were used as controls. L. plantarum FST 1.7, L. amylovorus FST2.11, W. cibaria MG1 and L. reuteri R29 belong to the culture collection stock of the Cereal and Beverages Research Group in of the School of Food and Nutritional Sciences, University College Cork, Ireland (Table 1). L. citreum TR116 belongs to the culture collection of the Department of Biological Sciences, Munster Technology University, Ireland. LAB isolates were maintained as frozen stocks in 40% glycerol at −80 °C. The strains were routinely subcultured on deMan Rogosa Sharpe (MRS) agar plates supplemented with 0.05 g/L bromocresol green under anaerobic conditions using AnaeroGen gas packs (Thermo Fisher Scientific, Waltham, MA, USA) at 30 °C for 48 h.

2.2. Rootlet Preparation

Approximately 5 kg of the BR mixture was sieved using an Endecotts Titan 450 sieve shaker (Endecotts, London, UK) at power level 5 for 30 min to remove husks, barley dust, broken barley kernels, acrospires and debris within the BR mixture. Sieves of size 1 mm, 500 µm, 250 µm, 500 µm and 150 µm were used to fractionate the BR mixture. The BRs with a size between 499 µm and 250 µm were milled using a laboratory scale disk mill (Buhler group, Uzwil, Switzerland) with the distance between disks set to 3 mm. Sieved and milled rootlets (BR-UnF) were frozen until usage.

2.3. Rootlet Fermentation

Prior to fermentation, cell suspensions of the single LAB strains were prepared by inoculating one single colony into MRS broth, incubated at 30 °C for 24 h, and subculturing (1%) into fresh MRS broth at 30 °C for 16 h. Cells were harvested by centrifugation (5000 rpm, 10 min, 4 °C), the supernatant was discarded and the cell pellet was resuspended in sterile Ringers’ solution. Cells were washed twice by repeating the centrifugation and resuspension step. Rootlet fermentations were performed in 1 litre batch bioreactor vessels on the DASGIP Bioblock combined with the DASGIP TC4SC4 and DASGIP PH8 modules (Eppendorf, Stevenage, UK) for temperature and agitation control. BR-UnF were defrosted and mixed with water at 12.5% (w/v) addition level. A total volume of 800 mL of substrate was placed in the bioreactor, to which 40 g (5% w/v) of the appropriate sugar (Table 1) was added. Sucrose was added as a sugar source for L. plantarum FST 1.7, L. amylovorus FST2.11, W. cibaria MG1 and L. reuteri, while fructose was used in the case of L. citreum TR116 to trigger mannitol production [25,26,27,28,45]. The mixture was sterilised by heating at 90 °C for 30 min, after which it was cooled to 30 °C. LAB strains were inoculated into the rootlet mixture to give a cell concentration of 107 CFU/mL. Fermentations were performed at 30 °C with constant mixing (400 rpm) for 96 h. Aliquots were taken at time point 0 and at 24 h intervals and pH, titratable acidity (TA) and viable cell count was determined. After fermentation, the mixture was pasteurised at 72 °C for 15 min. Untreated rootlets (BR-UnF) and rootlets which just underwent sterilisation at 90 °C for 30 min (without the addition of sugar) were used as controls. Fermented rootlets and sterilised control rootlets were frozen and freeze-dried to produce dried ingredients.

2.3.1. Acidification of Rootlets and Microbial Growth

A 10 g sample of the fermentate was mixed with 95 mL of distilled water and 5 mL of acetone using a magnetic stirrer (Stuart, Thermo Fisher Scientific, Waltham, MA, USA). The pH of the solution was measured using a digital pH meter (Mettler Toledo, Columbus, OH, USA) [10]. TA was determined by titration of the mixture with 0.1 M NaOH until a pH of 8.5 was reached [10]. Microbial growth was determined by serial dilution of 10 g of fermentate in 90 mL of sterile Ringers’ solution and plating of the dilutions on MRS agar supplemented with 0.05 g/L bromocresol green. Plates were incubated anaerobically using AnaeroGen gas packs (Thermo Fisher Scientific, Waltham, MA, USA) at 30 °C for 48 h and colony-forming units were determined by counting [10].

2.4. Compositional Analysis of Ingredients

2.4.1. Basic Composition of Unfermented Barley Rootlets

Compositional analysis of the BR-UnF was performed by an accredited lab (Chelab S.r.l, Merieux NutriSciences Corporation, Resana TV, Italy). Protein was measured by Dumas method using a modified version of AOAC 992.23 1992. Fat was determined using the Soxhlet method according to the ISTISAN report [46]. Ash in samples was calculated using AOAC 923.03. Moisture was analysed using ISO 712:2009. Total carbohydrates for rootlets measured by difference based on AOAC 986.25. Fibre was determined using AOAC 2017.2016.

2.4.2. Quantification of Sugars, Organic Acids and FODMAPs

All ingredients were lysed using QIAGEN Tissue Lyser II (QIAGEN, Hilden, Germany) for 30 s at a frequency of 30 Hz prior to extraction. All extractions were performed in triplicate unless stated otherwise.

Extraction and Detection of Mono-,di-, Trisaccharides and Organic Acids

Mono-, di-, and trisaccharides present in BR ingredients were extracted using a protocol outlined previously [28], with the exception that 2 g of sample was exposed to the extraction method instead of 1 g. Glucose, fructose, sucrose, maltose, and maltotriose were quantified via high-performance anion exchange chromatography coupled with pulsed amperometric detection (HEPAC-PAD) on a Dionex ICS-5000+ system (Thermo Fisher Scientific, Sunnyvale, CA, USA) and external standard calibrations between 0.05–1 mg/L and 1–20 mg/L using the conditions described by Ispiryan et al. [47]. Two different columns were used for the chromatographic separation of the different saccharides, the Dionex CarboPac PA200 (3 mm × 250 mm) and the Dionex CarboPac PA1 columns (2 mm × 250 mm) with their corresponding guards, respectively. The same extracts were used to analyse the organic acids (lactic acid, acetic acid) present in the BR ingredients. The organic acids were quantified on a Dionex Ultimate 3000 system (Thermo Fisher Scientific, Waltham, MA, USA), with ultraviolet light/diode array detection (UV/DAD; Thermo Fisher Scientific, Waltham, MA, USA) at 210 nm using an external calibration between 0.03–6 g/L. Separation of the analytes was achieved using a Hi-Plex H column (8 µm, 7.7 mm × 300 mm; Agilent Technologies, Santa Clara, CA, USA) with isocratic elution with 5 mM sulfuric acid and a flow rate of 0.5 mL/min at 60 °C.

Extraction and Detection of Fermentable Oligo-,di- and Monosaccharides and Polyols (FODMAPs)

FODMAP (Fermentable oligosaccharides, disaccharides, monosaccharides and polyols) levels in BR ingredients were determined according to Ispiryan et al. [47] via HPAEC-PAD using the same analytical set-up as described above for the analysis of the mono-,di- and trisaccharides. Sample preparation and analysis of the ingredients were performed according to the method described by Ispiryan et al. [47] without any modifications, except for the fructan analysis, which required an additional assay. First, according to the method described by Ispiryan et al. [47], two 500 µL aliquots of the diluted sample extracts were hydrolysed with 150 µL of two enzyme mixtures, respectively (A, containing 1:1:1 mixture of amyloglucosidase, α-galactosidase, 0.1 M sodium acetate buffer and B, containing 1:1:1 mixture of amyloglucosidase, α-galactosidase, inulinase). The fructan contents of BR-UnF and BR-Ster were calculated based on the glucose and fructose released from the fructans, as described by Ispiryan et al. [47]. The fructan contents of the fermented BR ingredients were calculated based on only fructose released from fructans (unknown interference impairing accurate determination of glucose released from fructans). Therefore, a third and a fourth 500 µL aliquot of the same diluted extract were incubated with 150 µL sucrase (30 U/mL in 0.1 M sodium maleate buffer) and 150 µL of 50 mg/L sodium azide solution, respectively, for 30 min at 30 °C, providing information on free eluting and matrix-associated sucrose in the samples (matrix-associated sucrose is not eluting as free sucrose but contributing to an increase in glucose and fructose upon sucrase treatment). The fructan content was then calculated according to Equations (1)–(5). The concentration of fructose released from fructans was calculated according to Equation (2), where FA/B are fructose concentrations (µmol/L) from hydrolysates A and B, and FS is the fructose released from free and matrix-associated sucrose, calculated according to Equation (1); FSuc is the fructose concentration after sucrase treatment and Ffree represents the fructose in the unhydrolysed sample; 180.16 is the molecular weight (g/mol) of fructose, DF the dilution factor, VE the extract volume (100 mL) and MS the sample mass (400 mg). The total fructan content was calculated according to Equation (5), with a glucose correction factor (Gf) and water correction factor (k), calculated based on an average degree of polymerisation (DPav) of 4.5 determined from the unfermented and sterilised rootlets (Equations (3) and (4)).
F S   ( µ mol / L ) = F Suc F free
F f ( % ) = ( F B F A F S ) × 180.16 × DF × V E 10000 × M s
k = 180 + 162 × ( DP av 1 ) 180 × DP av = 0.92   ( for   DP av = 4.5 )
G f = F f DP av 1
Fructan   ( % ) = 0.92 × ( G f + F f )

2.4.3. Metabolomic Analysis

BR ingredients were lysed with a QIAGEN Tissue Lyser II (QIAGEN, Hilden, Germany) for 30 s using a frequency of 30 Hz to optimise extraction. Extractions were performed in duplicate. For extraction, 200 mg of each ingredient was suspended in 1200 µL of autoclaved ultrapure water and vortexed thoroughly. Samples were centrifuged at 16,000× g for 30 min and the supernatant was retained. Three centrifugation cycles were performed, and the pooled supernatants were transferred to micro-centrifuge filters (Merck Ultrafree-CL GV 0.22 µm, Merck, Rahway, NJ, USA) for a final centrifugation step (4800× g, 20 min, 20 °C). The sample supernatants were retained and analysed by MS-Omics, Denmark. Briefly, samples were derivatized with methyl chloroformate using a slightly modified version of the protocol described by Smart et al. [48]. The analysis was conducted using gas chromatography (7890B, Agilent, Santa Clara, CA, USA) accompanied with a quadrupole mass spectrometry detector (5977B, Agilent, Santa Clara, CA, USA). Several metabolites typical of the tricarboxylic acid cycle were analysed (pyruvic acid, succinic acid, fumaric acid, malic acid, α-ketoglutaric acid, cis-aconitic acid, citric acid, isocitric acid and lactic acid). Lactic acid values were also determined in this analysis and included in the metabolomics analysis for completeness. Pyruvic acid values are given as normalised peak areas to an internal standard of deuterium-labelled alanine. Data were evaluated using Chemstation (Agilent, Santa Clara, CA, USA) and Matlab R2018b (Mathworks Inc., Natick, MA, USA).

2.4.4. Alpha and Beta Amylase Activity

The alpha-amylase activity of all ingredients was measured in duplicate using the ceralpha method assay kit supplied by Megazyme (Bray, Ireland) with minor modifications. The sample quantity used in the analysis was 1.5 g to accommodate high buffer absorption and to allow for sufficient sample mixing. An additional filtering step was also employed using a HPLC grade polyamide filter (0.2 µm, Thermo Fisher Scientific, Waltham, MA, USA) after enzyme extraction to improve the clarity of extracts before photometric analysis. The beta amylase activity of all ingredients was measured in duplicate using a K-BETA3 assay kit supplied by Megazyme (Bray, Ireland), following assay-kit instructions.

2.5. Scanning Electron Microscopy

Ingredients were mounted on stubs (G 306; 10 mm × 10 mm diameter; Agar Scientific, Stansted, UK) and fixed with carbon tape (G3357N; carbon tabs 9 mm; Agar Scientific, Stansted, UK). The mounted ingredients were then sputter coated (Polaron E5150 sputter-coating unit) using a gold-palladium alloy (ratio of 80/20) and images were captured using a JEOL scanning electron microscope (JSM-5510, Jeol Ltd., Tokyo, Japan). The following settings were used for the analysis: 5 kV 185 voltage, 20 mm working distance and a magnification factor of 1500.

2.6. Functional Properties of Rootlet Ingredients

2.6.1. Water- and Oil-Binding Capacity

Water- and oil-binding capacity measurements were determined using modified methods based on Salama et al. [8] and Traynham et al. [49] and were expressed as the amount of distilled water/sunflower oil retained per 100 g of sample. Briefly, 0.125 g ± 0.005 g of the BR ingredients were suspended in 6 g of distilled water/sunflower oil and contents of the tubes were vortexed for 3 min. The tubes were allowed to stand for 1 h to allow sufficient uptake of distilled water/sunflower oil and then centrifuged at 4000× g for 30 min at 20 °C. Following centrifugation, the supernatant was carefully removed from the tubes and the tubes were inverted for 30 min to allow for sufficient drainage. The weight of the tubes content was determined and water/oil-binding capacity was calculated according to the following formula (Equation (6)):
( W e i g h t   o f   t u b e   a n d   p e l l e t w e i g h t   o f   t u b e s a m p l e   w e i g h t ) s a m p l e   w e i g h t   × 100

2.6.2. pH and Titratable Acidity

The pH and titratable acidity (TA) of each ingredient was carried out using the method outlined by Waters et al. [10], in line with the methods previously described for pH and TA in Section 2.3.1.

2.6.3. Colour

Ingredient colour was measured using a hand-held colorimeter (Minolta CR-331, Konica Minolta Holdings Inc., Osaka, Japan) using the CIE L*a*b* colour measuring system [13,50,51] with adaptations made for dry ingredients. Briefly, fifteen grams of each ingredient was placed in a high precision glass tube cell (40.5 × 60 mm; Hellma analytics, Müllheim, Germany) and a smooth, flat surface was created. Measurements were taken at 5 different points. The differential colour index (ΔE) was calculated to determine the difference in ingredient colour with sterilisation and fermentation processes applied compared to BR-UnF using the following Equation (7):
Δ E = ( Δ L * ) 2 + ( Δ a * ) 2 + ( Δ b * ) 2
where ΔL* = L*control − L*sample, Δa* = a*control − a*sample, Δb* = b*control − b*sample

2.7. Statistical Analysis

All analyses were completed in triplicate unless stated otherwise. A one-way ANOVA with post-hoc Tukey test (p value ≤ 0.05) was performed using SPSS statistical software (version 28.0.1.0, IBM SPSS, Chicago, IL, USA) to identify significant differences among groups. In the cases where equal variances were not assumed, a correction using the Welch test and a Games–Howell (p value ≤ 0.05) post hoc test was applied to the data. When data were not normally distributed, a non-parametric Kruskal–Wallis test (p < 0.05) was used.

3. Results

3.1. Microbial Growth and Acidification

The microbial kinetics of L. citreum TR116, L. plantarum FST 1.7, W. cibaria MG1, L. amylovorus FST2.11 and L. reuteri R29 fermentations were analysed to determine their suitability for the BR substrate. Figure 1 displays the pH, TA and cell counts determined during rootlet fermentation. Acidification kinetics were characterised by changes in pH and TA during fermentation (Figure 1A). Similar initial pH values (5.34–5.42) were determined for all strains, with a steep decline observed during the first 24 h. The pH values remained relatively stable for the remainder of the fermentation period. L. amylovorus FST2.11 had the lowest final pH (3.11 ± 0.05), with significantly higher final pH values observed for L. plantarum FST1.7 (3.35 ± 0.03), L. reuteri R29 (3.66 ± 0.01), W. cibaria MG1 (4.09 ± 0.02) and L. citreum TR116 (4.04 ± 0.01). Corresponding to the decrease in pH, a significant increase in TA was noted in all fermentations. After 24 h the greatest increase in TA was observed with L. reuteri R29 (26.10 ± 0.1 mL of 0.1 M NaOH), after which the TA remained steady until the end of the fermentation. The lowest increase in TA was observed with W. cibaria MG1, reaching a final value of just 14.82 ± 0.10 mL of 0.1 M NaOH after 96 h fermentation. For the L. citreum TR116 fermentation, the TA value rapidly increased at the beginning of the fermentation, reaching a maximum value of 21.47 ± 0.06 mL of 0.1 M NaOH at T48 and slightly declining after this point. L. plantarum FST1.7 and L. amylovorus FST2.11 displayed similar acidification patterns, with a continuous increase in TA observed during the first 72 h of fermentation, reaching final values of 29.0 ± 1.41 mL of 0.1 M NaOH and 29.97 ± 0.21 mL of 0.1 M NaOH at T96, respectively.
Initial cell counts for all strains were between 6.8–7.4 log CFU/mL (Figure 1B). Results showed that all strains reached a maximum cell count within the first 24 h (W. cibaria MG1, L. citreum TR116 and L. reuteri R29) and 48 h (L. plantarum FST1.7 and L. amylovorus FST2.11) of fermentation, with cell counts of 8.97–9.68 CFU/mL. L. plantarum FST1.7 had the highest cell count and displayed the highest growth curve while W. cibaria MG1 showed the weakest growth, entering the decline phase after T24, with a final cell count 8.04 ± 0.05 CFU/mL at T96. Similarly, L. citreum TR116 also entered the death phase after T24 with a final cell count determined of 8.49 ± 0.15 CFU/mL. L. reuteri R29 showed strong growth until T48 and rapidly declined thereafter, and displayed the lowest cell count at T96 (7.57 ± 0.16 CFU/mL). Both L. amylovorus FST2.11 and L. plantarum FST1.7 displayed rapid growth during the first 48 h of fermentation and remained in the stationary phase thereafter, with significantly higher cell numbers (9.16 ± 0.07 CFU/mL and 9.21 ± 0.13, respectively) observed after 96 h of fermentation compared to the other strains.

3.2. Composition of Ingredients

3.2.1. Compositional Analysis Results of BR

Compositional analysis of the raw material (BR-UnF) was completed in order to gain a greater understanding of the basic nutrients present in BRs. A protein value of 35.80 ± 1.5% was determined in BRs. In addition, a high amount of fibre (36.64 ± 8.51%) was present. Of the total fibre, 1.24 ± 0.30% was soluble fibre whereas 35.40 ± 8.50% was high-molecular-weight dietary fibre. Minimal amounts of fat (1.77 ± 0.11%) and relatively low levels of ash (5.98 ± 0.30% ) were also determined in BR-UnF.

3.2.2. Mono-, di-, Trisaccharide Profile

Analysis of the mono-,di- and trisaccharides in BR ingredients was determined to provide insight into the effects processing (sterilisation and fermentation) has on their profile. Table 2 illustrates the mono, di- and trisaccharide profile of the BR ingredients after 96 hr fermentation.
Glucose levels were the lowest in BR-UnF (0.261 ± 0.021 g/100 g d.m.). A significant increase in glucose levels was noted in BR-Ster (0.521 ± 0.009 g/100 g d.m.) while glucose values for BR-TR116 were below the limit of detection. Among the fermented ingredients, the lowest amount of glucose was determined in BR-FST2.11 (2.176 ± 0.029 g/100 g d.m) while BR-MG1 had almost fourfold higher amounts of glucose (8.094 ± 0.147 g/100 g d.m), significantly higher than that of BR-FST1.7 (4.581 ± 0.050 g/100 g d.m.) and BR-R29 (3.190 ± 0.040 g/100 g d.m. No significant differences were observed in fructose levels in BR-UnF (1.149 ± 0.076 g/100 g d.m) and BR-Ster (1.249 ± 0.023 g/100 g d.m). In comparison, a significantly lower amount of fructose was determined in BR-TR116 (0.347 ± 0.006 g/100 g d.m) and BR-R29 (0.495 ± 0.004 g/100 g d.m). In relation to BR-FST1.7, BR-FST2.11 and BR-MG1 ingredients, significantly higher amounts of fructose were measured with values ranging between 9.991–13.234 g/100 g d.m. Low levels of sucrose were determined in BR-UnF (0.063 ± 0.002 g/100 g d.m.) and BR-Ster (0.016 ± 0.000 g/100 g d.m.), with only a minor increase in sucrose contents observed in BR-MG1 (0.586 ± 0.033 g/100 g d.m.) and BR-R29 (0.042 ± 0.00 g/100 g d.m.). The sucrose content of BR-TR116 was below the limit of detection. Sucrose was present in significant higher amounts in BR-FST1.7 (2.060 ± 0.036 g/100 g d.m.) and BR-FST2.11 (2.690 ± 0.069 g/100 g d.m.) ingredients, with BR-FST2.11 displaying the highest amount of sucrose. Low levels of maltose and maltotriose were detected in all ingredients (≤0.046 g/100 g d.m.), with the exception of the BR-MG1 ingredient, which had a significantly higher amount of maltose present (0.137 ± 0.001 g/100 g d.m.).

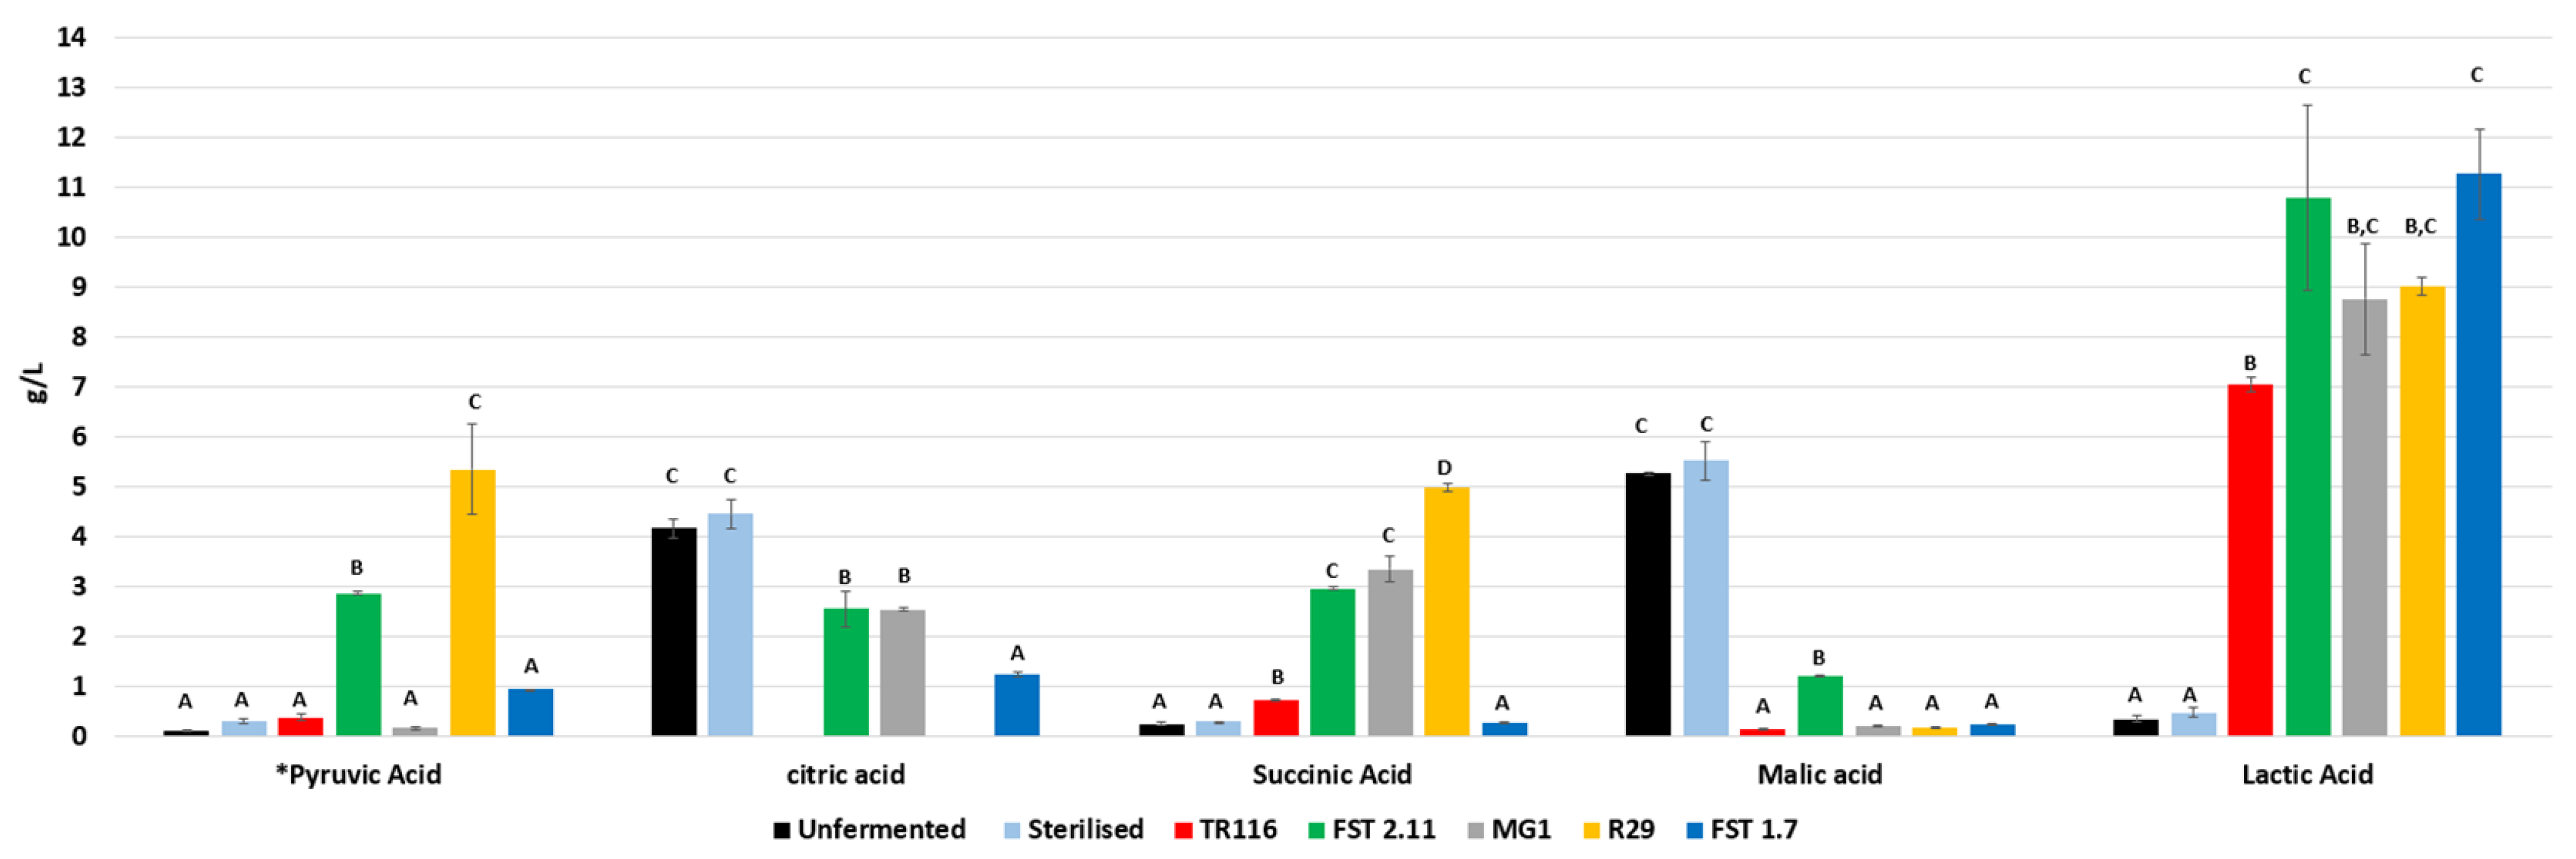
3.2.3. Organic Acids

An analysis of the organic acids present in BRs was completed to determine the native acids present in BRs as well as providing insight into the extent to which acids were produced during each LAB fermentation. A summary of the amounts of lactic and acetic acid present in the final BR ingredients is shown in Table 2.
Lactic acid was not determined in the BR-UnF and BR-Ster ingredients, as values were below the limit of detection. Lactic acid was detected in all BR fermented ingredients, with significant differences found between all groups. The highest amount of lactic acid was measured in BR-FST1.7 (12.498 ± 0.029 g/100 g d.m.), followed closely by BR-FST2.11 (11.743 ± 0.441 g/100 g d.m.). Almost half this amount of lactic acid was determined in BR-R29 (5.929 ± 0.036 g/100 g d.m.), while a further twofold decrease in the amount of lactic acid present was found in BR-MG1 (3.306 ± 0.050 g/100 g d.m.) and BR-TR116 (2.822 ± 0.035 g/100 g d.m.). Concerning the acetic acid levels illustrated in Table 2, values are likely to be overestimated as chromatogram peaks for acetic acid are impure, due to an unknown compound coeluting at the same retention time as acetic acid. The coeluting compound had a UV max of 267 nm. Further identification of unknown compounds was outside the scope of this study. Nonetheless, trends may still be examined. Low amounts of acetic acid were found in BR-UnF (0.573 ± 0.019 g/100 g d.m.). In comparison, significantly higher levels of acetic acid were determined in BR-Ster (3.980 ± 0.012 g/100 g d.m.) and in the fermented rootlet ingredients. BR-FST2.11 contained lower amount of acetic acid (0.428 ± 0.020 g/100 g d.m.) compared to BR-UnF. Significantly higher amounts of acetic acid were recorded in BR-MG1 (1.681 ± 0.024 g/100 g d.m.), BR-R29 (2.060 ± 0.008 g/100 g d.m.) and BR-FST1.7 (4.272 ± 0.031 g/100 g d.m.), with the highest amount determined in BR-TR116 (5.523 ± 0.045 g/100 g d.m.).

3.2.4. FODMAPs

FODMAP analysis was completed to provide fundamental knowledge on the level of these nutrients present in BRs as well as showing the altering effects LAB fermentation can have on the FODMAPs present. FODMAPs detected in BR ingredients are illustrated on Table 2. Lactose was below the limit of detection in all samples.
The amount of excess fructose (EF) present in BR-UnF (0.944 ± 0.035 g/100 g d.m.) and BR-Ster (0.764 ± 0.004 g/100 g d.m.) were comparable, with no significant differences found. EF was not determined in BR-R29, while low levels were present in BR-TR116 (0.400 ± 0.004 g/100 g d.m.). In contrast, almost twofold more EF was measured in BR-FST1.7 (5.648 ± 0.035 g/100 g d.m.) and BR-MG1 (6.109 ± 0.112 g/100 g d.m.), with the highest amount of EF determined in BR-FST2.11 (11.780 ± 0.127 g/100 g d.m.). The sorbitol levels of BR-UnF (0.377 ± 0.017 g/100 g d.m.) and BR-Ster (0.340 ± 0.002 g/100 g d.m.) were comparable, while the sorbitol contents of the fermented ingredients were slightly lower (≤0.292 ± 0.002 g/100 g d.m.). Both BR-UnF (0.025 ± 0.000 g/100 g d.m.) and BR-Ster (0.024 ± 0.000 g/100 g d.m.) contained low levels of mannitol. In comparison, the mannitol contents in BR-MG1 and BR-FST2.11 were below the limit of detection, while BR-FST1.7 contained a slightly higher amount (0.149 ± 0.001 g/100 g d.m.). Significant levels of mannitol were found in BR-R29 (16.779 ± 0.292 g/100 g d.m.), with the highest amount measured in BR-TR116 (20.074 ± 0.065 g/100 g d.m.). Trends in the levels of total polyols were relative to that of the mannitol and sorbitol contents of the ingredients. Overall, low levels of polyols were determined in BR-FST2.11, BR-MG1 and BR-FST1.7, along with BR-UnF and BR-Ster, with values ranging between 0.278–0.441 g/100 g d.m. Over 17 g/100 g of polyols were found in BR-R29 (17.037 ± 0.291 g/100 g d.m.), while the highest content of polyols was measured in BR-TR116 (20.315 ± 0.066 g/100 g d.m.). Raffinose/stachyose levels were detected at low levels in BR-UnF (0.012 ± 0.000 g/100 g d.m.) and BR-Ster (0.035 ± 0.000 g/100 g d.m.) The highest amount of raffinose/stachyose was determined in BR-MG1 (0.101 ± 0.001 g/100 g d.m.) while raffinose/stachyose amounts in BR-TR116, BR-FST2.11, BR-29 and BR-FST1.7 were below the limit of detection. Verbascose was not detected in any of the BR ingredients. With regards to GOS (α-galactooligosaccharides), residual GOS levels were similar to the trends discussed previously for raffinose/stachyose values. A similar amount of fructans were determined in BR-UnF (1.711 ± 0.083 g/100 g d.m.) and BR-Ster (1.786 ± 0.042 g/100 g d.m.), with no significant differences found between ingredients. In comparison, a significant reduction in the level of fructans present was noted in all fermented BR ingredients, with the exception of BR-R29, where a significant increase in fructans was determined (1.925 ± 0.014 g/100 g d.m.).

3.2.5. Alpha and Beta Amylase Activity

Determination of alpha and beta amylase activity in BR ingredients was conducted to enhance knowledge on the enzymatic activity of BR ingredients and the effects that processing can have on their activity. Alpha and beta amylase activity levels of the BR ingredients are shown in Table 3.
Alpha amylase activity of BR-UnF was 5.12 ± 0.302 CU/g d.m. A significant decrease in the alpha amylase activity was found post sterilisation of the BRs (0.026 ± 0.000 CU/g d.m.). Similar to BR-Ster, very low alpha-amylase activities were determined in all of the fermented BR ingredients, with values ranging from 0.00–0.041 CU/g d.m. Beta amylase activity showed similar trends, with the highest beta amylase activity found in the BR-UnF (0.772 ± 0.185 CU/g d.m.) and significantly lower activity determined for BR-Ster (0.010 ± 0.014 CU/g d.m.) and fermented BR ingredients.

3.2.6. Metabolite Analysis

Analysis of the metabolomic profile of BR ingredients provides detail on the major pathways occurring during LAB fermentation while also gaining better insight on the level of these metabolites present at the end of fermentation. Figure 2 demonstrates the main metabolites of the tricarboxylic cycle present in the BR ingredients. In relation to the compounds fumaric acid, 2-oxoglutaric acid, cis-aconitic acid and iso-citric acid, negligible amounts (0.022–0.298 g/L, results not shown) were measured in all BR ingredients, with little difference observed between samples, and they were therefore not included in Figure 2.
Pyruvic acid was detected at negligible levels in BR-UnF and BR-Ster (<0.298 ± 0.041). Similarly, low levels of pyruvic acid were found in BR-TR116 (0.376 ± 0.063) and BR-MG1 (0.162 ± 0.029) with a slight increase in pyruvic acid in BR-FST1.7 (0.930 ± 0.006). Pyruvic acid amounts in BR-FST2.11 (2.857 ± 0.022) increased greatly, with the highest amount determined in BR-R29 (5.345 ± 0.915). Significantly higher amounts of citric acid were present in BR-UnF (4.158 ± 0.184 g/L) and BR-Ster (4.444 ± 0.294 g/L), with a reduction observed in BR-FST2.11 (2.546 ± 0.349 g/L), BR-MG1 (2.529 ± 0.031 g/L) and BR-FST1.7 (1.233 ± 0.051 g/L). Citric acid levels in BR-TR116 and BR-R29 were below the limit of detection. Succinic acid was detected in very low amounts in BR-UnF and BR-Ster as well as BR-TR116 and BR-FST1.7, with values in the range of 0.243–0.715 g/L. An approximately threefold increase in succinic acid levels were determined for BR-FST2.11, BR-MG1 and BR-R29 (2.949–3.340 g/L). High amounts of malic acid were found in the control ingredients BR-UnF (5.255 ± 0.039 g/L) and BR-Ster (5.510 ± 0.390 g/L), whereas much lower levels were present in in the fermented BR ingredients. Comparing the fermented BR ingredients, BR-FST2.11 contained the highest amount of malic acid (1.208 ± 0.023 g/L) with negligible amounts (0.149–0.233 g/L) found in the remaining ingredients. Lactic acid amounts were very low in BR-UnF and BR-Ster ingredients (0.339–0.473 g/L), with little difference observed between samples. High levels of lactic acid were measured in the fermented BR ingredients. The highest amount of lactic acid was determined in BR-FST1.7 (11.252 ± 0.901 g/L) followed sequentially in descending order by BR-FST2.11 (10.781 ± 1.862 g/L), BR-R29 (9.002 ± 0.182 g/L), BR-MG1 (8.755 ± 1.112 g/L) and BR-TR116 (7.051 ± 0.141 g/L).

3.3. Scanning Electron Microscopy

Scanning electron microscopy analysis was performed on the unfermented, sterilised and LAB fermented ingredients to gain insight into the effects of the processing of BRs on the external structure of the ingredient (Figure 3).
As seen in Figure 3A,B, smooth, fibrous and intact structures were visible in BR-UnF. The surface of BR-UnF (Figure 3B) appears to be a continuous matrix with smaller particles dispersed within longer fibrous strands. In contrast, a much more disrupted, broken and discontinuous structure was evident in BR-Ster (Figure 3C,D). Particles present in BR-Ster are more fragmented and brittle, indicating some disruption to the fibrous structures present. Figure 3E,F characterises BR-R29 and is representative of all fermented ingredients, as little difference was observed between fermented samples. The structure of BRs post fermentation more closely resembled BR-Ster rather than BR-UnF, displaying a more severed, uneven surface.

3.4. Techno-Functional Properties of BR Ingredients

3.4.1. Water- and Oil-Binding Capacity

The WBC and OBC of the BR ingredients are depicted in Table 3. The highest WBC was determined in BR-Ster (523.90 ± 25.73 g H2O/100 g BR) followed by BR-UnF (500.29 ± 11.02 g H2O/100 g BR) with no significant differences found between the samples. BR-FST2.11 also had a high WBC (459.25 ± 35.09 g H2O/100 g BR) and was comparable to BR-UnF and BR-Ster. Fermentation resulted in a significant reduction in the WBC of the ingredients. A significant reduction in WBC was measured in BR-TR116 (427.33 ± 17.20 g H2O/100 g BR), BR-FST1.7 (418.09 ± 25.25 g H2O/100 g BR), BR-R29 (384.07 ± 23.88 g H2O/100 g BR) and BR-MG1 (377.76 ± 18.61 g H2O/100 g BR) compared to BR-UnF and BR-Ster. With respect to the OBCs, BR-UnF had the lowest OBC (237.20 ± 22.74 g oil/100 g BR). Heat treatment appeared to increase the OBC significantly, with a value of 367.93 ± 21.24 g oil/100 g BR for BR-Ster. Similarly, a significant increase in OBC was also observed after fermentation with the OBC of the fermented BR ingredients ranging from 287.87–409.39 g oil/100 g BR. The highest OBC was observed in BR-TR116 and the lowest in BR-MG1, with values of 409.39 ± 12.98 g oil/100 g BR and 287.87 ± 9.62 g oil/100 g BR determined, respectively.

3.4.2. pH, TA and Colour

The pH, TA and colour of the BR ingredients are shown in Table 3. About the ingredient pH, BR-UnF (5.20 ± 0.01) and BR-Ster (5.16 ± 0.01) had the highest pH values, with no significant differences found between samples. As expected, the fermented BR ingredients had a lower pH. Similar pH values were measured for BR-MG1 (4.09 ± 0.01) and BR-TR116 (4.09 ± 0.02), while BR-R29 had a pH of 3.69 ± 0.01. The lowest pH values were observed for BR-FST1.7 and BR-FST2.11, with values of 3.38 ± 0.01 and 3.37 ± 0.01 determined, respectively. BR-UnF had the lowest TA value (4.5 ± 0.13 0.1 M NaOH/g) with a significantly higher TA value obtained for BR-Ster (6.08 ± 0.06 0.1 M NaOH/g). The TA values for fermented BR ingredients were significantly higher, ranging from 8.42 ± 0.11–17.01 ± 0.25 0.1 M NaOH/g, depending on the LAB strain used for fermentation. Regarding the ΔE values recorded for the BR ingredients, a colour change was noted in the fermented ingredients compared to BR-UnF. No significant differences were found between samples, except for in the case of BR-FST2.11 (3.65 ± 0.47), which had a significantly lower ΔE value compared to all other BR ingredients.

4. Discussion

The implementation of by-products into the food chain has been a challenge and often requires further processing to improve their viability. Research relating to the rejuvenation of BRs is limited and an in-depth analysis of their potential as food ingredients using fermentation as a processing aid has not yet been explored. The LAB strains W. cibaria MG1, L. amylovorus FST2.11, L. plantarum FST1.7, L. reuteri R29 and L. citreum TR116 have been used across a variety of studies using various substrates [25,27,28,29,31,32,36,37,39,40,41,44,45]; however, their behaviour in a BR system has not yet been investigated.
Firstly, the variation in the growth of the LABs suggests that BRs are a more favourable substrate for growth for some LABs than others. The rapid entry of L. citreum TR116, W. cibaria MG1 and L. reuteri R29 into the decline phase and the ability for L. plantarum FST1.7 and L. amylovorus FST2.11 to maintain high cell counts suggests that BRs may serve as a more suitable substrate for L. plantarum FST1.7 and L. amylovorus FST2.11 over longer fermentation times. However, other factors, such as strain origin and acid tolerance, are likely to be contributing factors to the growth observed. L. plantarum FST1.7 and L. amylovorus FST2.11 have been described as strains which are tolerant to acidic environments [31,32,42] which may explain their ability to maintain high cell counts until the end of these fermentations (96 h). In addition, both L. plantarum FST1.7 and L. amylovorus FST2.11 originate from a brewing environment, indicating they may have had higher adaptability to the BR matrix. In the case of the W. cibaria MG1, comparable maximum cell counts were observed after 24 h in a previous study using a quinoa-based fermented yoghurt alternative [39]. Although W. cibaria MG1 originates from a cereal environment, its low tolerance to acid may have inhibited growth after T24. Peyer et al. [42] observed similar growth kinetics and pH values with W. cibaria PS2 and suggested that W. cibaria strains may have lower intrinsic acid tolerance. Growth curves for L. reuteri R29 and L. citreum TR116 were comparable to those previously described in other studies [28,42], reaching a maximum cell count between 40–48 h.
The final pH and TA values obtained during the fermentation coincide and may be explained by the lactic and acetic acid levels determined. Relatively high TA values and greater reductions in pH were observed with L. amylovorus FST2.11, L. reuteri R29 and L. plantarum FST1.7 and were complimented by higher amounts of lactic and acetic acid detected in these ingredients. W. cibaria MG1 did not reduce the pH and increase TA measurements to the same extent as the other LABs, which may be explained by the lower lactic and acetic acid contents in BR-MG1, corresponding to the poorer growth kinetics previously discussed. Similar pH values were recorded for BR-TR116 and BR-MG1; however, the higher TA value attained for BR-TR116 is likely due to the higher acetic acid content in BR-TR116 compared to BR-MG1. Acetic acid is a weaker acid with a pKa value of 4.75 versus lactic acid, which has a pKa value of 3.86; thus, lactic acid has a stronger influence on reducing pH than acetic acid [52,53]. This type of behaviour has also been discussed in alternative yoghurt systems [29]. In addition, the buffering capacities of lactic and acetic acid could play a role in the differences in TA values observed. Acetic acid has an optimal buffering capacity in the pH range of 3.75–5.75 compared to lactic acid, which lies in the range of 2.86–4.86 [25,54]. As the starting pH of the ingredient was approx. 4.09 and the end point required for the TA analysis was 8.5, this pH dimension favoured the acetic acid buffering capacity range. Thus, higher volumes of 0.1 M NaOH were needed to reach pH 8.5, resulting in a higher TA value for BR-TR116 [25].
Lactic and acetic acid quantities are largely dependent on the homo- or hetero-fermentative metabolisms of LAB. The Emden–Meyerhoff–Parnas pathway is employed during homofermentative metabolism (L. amylovorus FST2.11) where hexoses are converted to pyruvate, which is later converted to lactic acid catalysed by lactate dehydrogenase [55]. For heterofermentative metabolism (L. citreum TR116, L. plantarum FST1.7, L. reuteri R29, W. cibaria MG1), hexoses are metabolised using the phosphoketolase pathway. Similar to homofermentative metabolism, this results in the production of lactic acid from pyruvate; however, other end products, such as CO2 and ethanol or acetic acid, can also be produced [55]. However, alternative routes of pyruvate must also be considered, which are both strain- and condition-sensitive [55]. As expected, L. amylovorus FST2.11 produced almost exclusively lactic acid and has previously been used in beer souring for this purpose [31]. L. plantarum FST1.7, has been documented as a strong acidifier in sourdough, acidified wort- and malt-based substrates [32,35,42]; therefore, high amounts of lactic and acetic acid were to be expected. Similarly, L. citreum TR116 and L. reuteri R29 are capable of producing both lactic and acetic acid. The elevated levels of acetic acid in the BR-TR116 is a reflection of the capability of L. citreum TR116 to produce acetic acid using a pyruvate dehydrogenase complex as well as the tendency for the strain to produce acetic acid from acetyl phosphate when fructose is present [26]. Although W. cibaria MG1 is a heterofermentative strain [33], the lower amounts of lactic and acetic acid in the BR-MG1 might be a reflection of the poorer growth of W. cibaria MG1 in BRs, as demonstrated in Figure 1B.
The analysis of mono-,di- and trisaccharides in the BR ingredients give a further insight into variations in LAB growth and metabolism. Firstly, the mono-, di- and trisaccharide levels were low in BR-UnF, suggesting few are readily available in BRs. The values obtained in this study were lower than previously reported [10], likely due to variances in extraction protocols, diversities in germination processes and also differences in sieved BR fractions. The slight increase observed in the short-chain carbohydrates in the BR-Ster ingredient might be explained by enzymes naturally present in BRs. BRs contain exceptionally high levels of alpha amylase and reasonable levels of beta amylase, with literature also suggesting the presence of invertase [56]. Thus, the gradual increase in temperature during the sterilisation process is likely to activate these enzymes at different time points, resulting in a very slight increase in mono-, di- and trisaccharide profiles. A comparison of these profiles of the fermented ingredients, primarily glucose, fructose and sucrose, reveals differences in LAB metabolism. The reduction in supplemented fructose and complete depletion of naturally occurring glucose to below detectable levels observed in BR-TR116 can be explained by the phosphoketolase metabolic pathway (glucose) and the presence of mannitol-2-dehydrogenase (fructose) expressed by L. citreum TR116 [26]. The L. reuteri R29 fermentation was supplemented with sucrose, which was hydrolysed to glucose and fructose, hence its depletion. Results from this study suggest that L. reuteri R29 preferred fructose, as levels of this sugar were reduced compared to glucose. Previous studies using L. reuteri R29 revealed maltose as the preferred substrate [40,42]. However, as maltose was present in minor amounts in the BR substrate, L. reuteri R29 likely used fructose as its primary carbon source, activating mannitol-2-dehydrogenase, an enzyme which has been found in some L. reuteri strains [57,58,59]. W. cibaria MG1 can utilise sucrose, maltose, fructose, ribose, xylose, gluconate and galactose (using Leloir pathway) as carbon sources [33]. High amounts of glucose and fructose were present in BR-MG1, likely as a result of the poorer growth of W. cibaria MG1 and subsequent lower metabolic activity leading to the presence of residual monosaccharides. In the case of the BR-FST2.11 and the BR-FST1.7 ingredients, the residual sucrose, fructose and glucose in the ingredient again might be related to the growth pattern of the L. plantarum FST1.7 and L. amylovorus FST2.11 strains. During fermentation, these strains remained in the stationary phase of growth suggesting sufficient sugar substrate was available. The excess of fructose rather than glucose also suggests that L. plantarum FST1.7 and L. amylovorus FST2.11 had preference for glucose as carbon source when fermented in a BR matrix. Peyer et al. [31,42] also reported a similar trend in sugar metabolism with L. plantarum FST1.7 and L. amylovorus FST2.11, with both strains showing a preference for glucose during the fermentation of malt-based substrates and in sour beer production. As the sugar substrate was not limiting at the end of fermentation for L. plantarum FST1.7 and L. amylovorus FST2.11, the restriction to growth might be linked to the low pH and possible limitation of other LAB metabolic growth factors.
Much like the mono- and disaccharide profile, diversities in the FODMAP profile of the fermented BR ingredients were also observed. The term FODMAP refers to a class of short-chain carbohydrates which are poorly digested in the small intestine and migrate to the large intestine where they can be utilised as a carbon source for the gut microflora [60]. This study shows that BRs are naturally high in FODMAPs and may contain higher levels than those found in the barley grain itself, depending on the variety of barley used [60]. Thus, for a person who does not suffer from digestive issues such as irritable bowel syndrome, BRs can be implemented in the diet as a natural source of prebiotics [61].
The main FODMAPs found in the BR ingredients were polyols, EF and fructans, as all other FODMAPs measured were not found in significant amounts. Among the polyols detected, mannitol is of greater interest since sorbitol levels did not vary greatly during sterilisation and fermentation. The high levels of mannitol in the BR-TR116 and BR-R29 ingredients provide evidence for the expression of mannitol-2-dehydrogenase during fermentation which reduces fructose to mannitol [26,62]. This also gives plausible reason for the lowest amounts of EF being found in these ingredients. The mannitol-2-dehydrogenase gene is generally absent in most W. cibaria strains, which explains the lack of mannitol in the BR-MG1 ingredient [63]. L. amylovorus FST2.11 and L. plantarum FST1.7 do not appear to synthesise mannitol-2-dehydrogenase when BR is used as the primary substrate, hence the undetected or negligible levels of mannitol. As these strains likely lacked the mannitol-2-dehydrogenase enzyme, fructose was not subsequently converted to mannitol, which may justify the high EF levels in the BR-MG1, BR-FST2.11 and BR-FST1.7 ingredients. The hyperproduction of mannitol in BR-TR116 and BR-R29 may be a favourable characteristic imparted by L. citreum TR116 and L. reuteri R29 strains, as mannitol may be used as a sugar replacer in food products [25,27,45,64].
Fructans, which are a non-digestible storage carbohydrate in a variety of plants, are comprised of β (2-1) and/or β (2-6) connected fructose chains (both linear and branched) and a single glucose residue [60,65], and were measured in considerable amounts in BRs. Previous studies by Ispiryan et al. [65] investigated the effect of malting on the FODMAP profile of a variety of wholegrains (cereals, pseudo cereals, pulses) and revealed that the level of fructans in barley, wheat and oat increased during the malting process, particularly during the germination phase. Thus, the high levels of fructans in BRs are likely related to their synthesis during germination. Different trends were noted in the fermented BR ingredients with some increases (BR-R29) and decreases (BR-TR116, BR-MG1, BR-FST2.11, BR-FST1.7) in fructans observed. The increase in fructans in the BR-R29 ingredient might be explained by the metabolism of L. reuteri. L. reuteri 121 has previously been shown to synthesise fructans of the levan type and high-molecular-weight inulin using levansucrase and inulosucrase enzymes [66,67,68,69]. Thus, it is plausible that L. reuteri R29 may also have the same potential. This may be beneficial when formulating high-fibre products which aim to prevent fructan degradation, particularly in the bread system [70]. The reduction in fructan content in all other BR ingredients indicates that L. citreum TR116, W. cibaria MG1, L. amylovorus FST2.11 and L. plantarum FST1.7 can degrade fructans in BRs, which may be a characteristic of interest for these strains as a bio-technological aid when formulating low-FODMAP foods/ingredients [71,72].
Metabolomic analysis provided some insights into LAB metabolism during the fermentation of BRs. As expected, the most abundant compound of the tricarboxylic acid (TCA) cycle was lactic acid with amounts present following the trends of the lactic acid values previously discussed. In the case of BR-FST2.11 and BR-FST1.7, the residual levels of pyruvate might be a result of the ongoing pathways previously mentioned, as the growth patterns of both of these strains at the end of fermentation was stable. The residual levels of pyruvic acid in BR-R29 may indicate the inhibition of the lactate dehydrogenase enzyme over the course of the fermentation process due to its entry into the death phase after T48. Furthermore, pyruvate may also be produced from citric acid, a compound which appears to be naturally present in BRs. Citric acid can be used as an alternative carbon source, which is converted to oxaloacetate, followed by pyruvate, using the citrate lyase complex and oxaloacetate decarboxylase, respectively [63,73]. In addition, citrate and sugar co-metabolism can result in the excess production of pyruvate, which might also give a reason for the excess pyruvate accumulation in these BR ingredients [73]. Citric acid was fully depleted in BR-R29 and BR-TR116 ingredients and only partially used in the other fermented BR ingredients, highlighting the ability of L. reuteri R29 and L. citreum TR116 to utilise citric acid as an alternative carbon source. Citric acid metabolism in L. reuteri has also been demonstrated in other studies [74,75,76] while the expression of a citrate-lyase gene has been reported for L. citreum TR116 [26] as well as other Leuconostoc spp. [73]. Citric acid metabolism has also been shown to occur in L. plantarum [77,78] which supports the decreased level of citric acid in BR-FST1.7. Citric acid metabolism can also result in the formation of succinic acid through a series of enzyme-catalysed reactions [63,79]. Thus, the higher amount of succinic acid in BR-R29, BR-MG1 and BR-FST2.11 indicates this pathway might have been favoured during fermentation, particularly during L. reuteri R29 fermentation [74,80]. Much like citric acid, malic acid also appears to be a native organic acid present in BRs. Malic acid is decarboxylated to lactic acid and CO2, a reaction which is mediated by malolactic enzyme, with this pathway being strain-dependent [81]. The reduction in malic acid levels across all fermented ingredients putatively shows malic acid metabolism may occur in the selected LAB strains when using BRs as a substrate. Malic acid metabolism has been found to occur in a variety of LABs [82], including L. plantarum [81,83] and Leuconostoc spp. [84]; however, the use of malic acid as a carbon source is more relevant in modern wine production.
Evaluation of the techno-functional properties of BR ingredients provides information on how BRs may behave in a food system, while also showing how different processing techniques may alter them. BR-UnF and BR-Ster naturally have a very high WHC, which was in agreement with previous studies by Salama et al. [8]. The high WBC of BRs is likely due to the significant proportion of fibre in their composition, as fibre in general has a high WBC [85,86]. Fermentation significantly reduced the WHC of BRs, which might be linked to a change in protein structure post fermentation. The fermentation process likely unfolds the natural configuration of the proteins present in BRs and exposes more hydrophobic regions, resulting in a reduction in the WHC. This theory is also complimented by the increase in the OBC capacity of the fermented BRs [87]. In addition, previous literature suggests the freeze-drying process may also have a contributory effect to the reduction in WHC and increase in OBC [87,88]. As expected, trends in the pH and TA values of the BR ingredients followed a similar pattern to the final fermentation values. The significant reduction in alpha and beta enzymatic activity post sterilisation and fermentation is a favourable characteristic primarily imparted by the sterilisation process. In particular, the reduction in the high α-amylase activity is very beneficial, especially for the implementation of BRs in a cereal-based application. Excessive amounts of alpha-amylase can lead to processing defects such as sticky doughs, poor crumb structures and darker crusts [89]. The slightly higher amylase activity in BR-FST2.11 is likely linked with the ability of L. amylovorus FST2.11 to produce extracellular amylases [31]. From an ingredient-colour perspective, BRs have a naturally dark brown hue, likely due to the Maillard reaction products created during the malting process. However, the sterilisation and fermentation processes slightly alter the colour of the ingredients, reflected in the ΔE values. A slightly lighter colour is perceived post processing, which might be linked with changes in colour pigments during the freeze-drying process. However, overall changes are relatively minimal as freeze-drying tends to preserve colour pigments rather well [90,91].
Aside from the techno-functional characteristics, the ingredient structure was also affected post sterilisation and fermentation. The broken, fragmented and enhanced porous structure of the sterilised ingredients might be linked with the freeze-drying process. BRs are suspended in high volumes of water for sterilisation and before freeze-drying to a powder, implying BRs are fully hydrated. Voda et al. [92] describes how water embedded in the food matrix expands during freezing and applies pressure to the cell walls of the food, which ultimately distorts the original cell-wall structure and might constitute a reason for the degraded structure. The changes observed in the sterilised and fermented ingredients are likely a combination of the aforementioned freeze-drying process as well as some potential enzymatic degradation of the protein and fibre matrix of BRs post fermentation. Some degradation of proteins was observed in an SDS-PAGE analysis (results not shown) of the ingredients. Proteases play a vital role in the germination stage of malting [3,93], which is the point at which rootlets are produced, likely implying a certain proportion of proteases are present in the rootlets. LABs may also secrete carbohydrases and proteinases [79], which could also physically degrade polysaccharide and protein structures

5. Conclusions

The revitalisation of by-products for implementation in the food-ingredient sector is an important area of research to help address the sustainability goals of the future. The valorisation of BRs for use as a food ingredient would aid in improving the carbon footprint of both the malting and brewing industries. However, further processing of BRs is an essential part of their future as a food ingredient. This work showcases fundamental knowledge on BRs which has been rather limited to date, while also exhibiting the use of LAB fermentation as a valorisation technique for BRs. LAB fermentation was found to alter the BR matrix, transforming the compositional and techno-functional profile of the ingredients, with various modifications being strain-dependent. L. amylovorus FST2.11 and L. plantarum FST1.7 displayed optimal growth in BRs for longer fermentation times. From a compositional perspective, changes in the residual carbohydrate and acid profile were altered depending on the type of LAB used. FODMAP analysis demonstrated that L. citreum TR116 and L. reuteri R29 were capable of converting fructose to mannitol, highlighting the potential use of BR-TR116 and BR-R29 ingredients in sugar-reduced products. Fermentation with L. reuteri R29 also resulted in an enhanced fructan content, suggesting potential for future fibre-product development. In addition, metabolomic analysis provided an insight into LAB metabolism utilising BRs as a substrate. Finally, from a functionality perspective, LAB fermentation altered the techno-functional characteristics of BRs, particularly the WHC and OBC, where significant changes were observed. In addition, the sterilisation step aided in the reduction in the high alpha-amylase activity of the BR ingredient, which enhances its potential for use as a food ingredient. Further work on the utilisation of the fermented BR ingredients in a food application such as in bakery and/or cereal-based applications where BRs could be used as partial flour replacers would be of great interest, to analyse whether characteristics imparted by LAB fermentation have further benefits in these applications.

Author Contributions

Conceptualization, E.K.A. and A.W.S.; Methodology. E.N., L.N. and E.K.A.; Software, E.N.; Validation, E.N., L.N., T.M. and S.M.; Formal Analysis, E.N.; Investigation, E.N.; Resources, S.M. and T.M.; Data Curation, E.N. and L.N.; Writing—Original Draft Preparation, E.N.; Writing—Review and Editing, L.N., E.Z., E.K.A. and A.W.S.; Visualization, E.N.; Supervision, E.K.A. and A.W.S.; Project Administration, E.K.A. and E.Z.; Funding Acquisition, E.K.A. and E.Z. All authors have read and agreed to the published version of the manuscript.

Funding

This project received funding from the European Union’s Horizon 2020 research and innovation program under grant agreement No. 818368 (MASTER). This manuscript reflects only the authors’ views, and the European Commission are not responsible for any use that may be made of the information it contains.

Institutional Review Board Statement

Not applicable.

Informed Consent Statement

Not applicable.

Data Availability Statement

The data are available from the corresponding author upon request.

Acknowledgments

The authors wish to take the opportunity to thank Patrick O’Riordan and Gregory Belt for providing the barley rootlets for the experimental study and for their helpful input during discussions. The authors would like to thank Aidan Coffey for providing L. citreum TR116 for inclusion in the study. In addition, the authors would like to express their gratitude to Jonas Atzler for his assistance in SEM images, Lilit Ispiriyan for her work in FODMAP analysis and Tom Hannon for his technical support.

Conflicts of Interest

The authors declare no conflict of interest.

References

  1. Briggs, D.E. Malts and Malting, 1st ed.; Blackie Academic & Professional: London, UK, 1998. [Google Scholar]
  2. Kunze, W. Technology Brewing and Malting, 3rd ed.; VLB: Berlin, Germany, 2004. [Google Scholar]
  3. Stewart, G.G.; Russell, I.; Anstruther, A. Handbook of Brewing, 3rd ed.; Taylor & Francis Group: Boca Raton, FL, USA, 2017; ISBN 9781498751919. [Google Scholar]
  4. Neylon, E.; Arendt, E.K.; Lynch, K.M.; Zannini, E.; Bazzoli, P.; Monin, T.; Sahin, A.W. Rootlets, a Malting By-Product with Great Potential. Fermentation 2020, 6, 117. [Google Scholar] [CrossRef]
  5. Koistinen, V.M.; Tuomainen, M.; Lehtinen, P.; Peltola, P.; Auriola, S.; Jonsson, K.; Hanhineva, K. Side-stream products of malting: A neglected source of phytochemicals. npj Sci. Food 2020, 4, 21. [Google Scholar] [CrossRef] [PubMed]
  6. The Maltsters Association of Great Britain Malting Co-Products—Valuable Nutritional Ingredients for the Feed Industry. Available online: https://www.ukmalt.com/technical/8-food-and-feed-safety/malting-co-products/ (accessed on 11 February 2022).
  7. Chiş, M.S.; Pop, A.; Păucean, A.; Socaci, S.A.; Alexa, E.; Man, S.M.; Bota, M.; Muste, S. Fatty acids, volatile and sensory profile of multigrain biscuits enriched with spent malt rootlets. Molecules 2020, 25, 442. [Google Scholar] [CrossRef] [PubMed] [Green Version]
  8. Salama, A.R.A.; El-Sahn, M.A.; Mesallam, A.S.; El-Tabey Shehata, A.M. The chemical composition, the nutritive value and the functional properties of malt sprout and its components (acrospires, rootlets and husks). J. Sci. Food Agric. 1997, 75, 50–56. [Google Scholar] [CrossRef]
  9. Salama, A.A.; El-Sahn, M.A.; Mesallam, A.S.; Shehata, A.M.E. Evaluation of the quality of bread, biscuit and butcher’s sausage supplemented with rootlets of malt sprouts. Nahrung 1997, 41, 228–231. [Google Scholar] [CrossRef]
  10. Waters, D.M.; Kingston, W.; Jacob, F.; Titze, J.; Arendt, E.K.; Zannini, E. Wheat bread biofortification with rootlets, a malting by-product. J. Sci. Food Agric. 2013, 93, 2372–2383. [Google Scholar] [CrossRef]
  11. Bianco, A.; Budroni, M.; Zara, S.; Mannazzu, I.; Fancello, F.; Zara, G. The role of microorganisms on biotransformation of brewers’ spent grain. Appl. Microbiol. Biotechnol. 2020, 104, 8661–8678. [Google Scholar] [CrossRef]
  12. Neylon, E.; Arendt, E.K.; Zannini, E.; Sahin, A.W. Fundamental study of the application of brewers spent grain and fermented brewers spent grain on the quality of pasta. Food Struct. 2021, 30, 100225. [Google Scholar] [CrossRef]
  13. Neylon, E.; Arendt, E.K.; Zannini, E.; Sahin, A.W. Fermentation as a tool to revitalise brewers’ spent grain and elevate techno-functional properties and nutritional value in high fibre bread. Foods 2021, 10, 1639. [Google Scholar] [CrossRef]
  14. Waters, D.M.; Jacob, F.; Titze, J.; Arendt, E.K.; Zannini, E. Fibre, protein and mineral fortification of wheat bread through milled and fermented brewer’s spent grain enrichment. Eur. Food Res. Technol. 2012, 235, 767–778. [Google Scholar] [CrossRef]
  15. Aprodu, I.; Simion, A.B.; Banu, I. Valorisation of the Brewers’ Spent Grain Through Sourdough Bread Making. Int. J. Food Eng. 2017, 13, 1–9. [Google Scholar] [CrossRef]
  16. Ktenioudaki, A.; Alvarez-Jubete, L.; Smyth, T.J.; Kilcawley, K.; Rai, D.K.; Gallagher, E. Application of bioprocessing techniques (sourdough fermentation and technological aids) for brewer’s spent grain breads. Food Res. Int. 2015, 73, 107–116. [Google Scholar] [CrossRef]
  17. Verni, M.; Pontonio, E.; Krona, A.; Jacob, S.; Pinto, D.; Rinaldi, F.; Verardo, V.; Díaz-de-Cerio, E.; Coda, R.; Rizzello, C.G. Bioprocessing of Brewers’ Spent Grain Enhances Its Antioxidant Activity: Characterization of Phenolic Compounds and Bioactive Peptides. Front. Microbiol. 2020, 11, 1831. [Google Scholar] [CrossRef]
  18. Schettino, R.; Verni, M.; Acin-albiac, M.; Vincentini, O.; Krona, A.; Knaapila, A.; Di Cagno, R.; Gobbetti, M.; Rizzello, C.G.; Coda, R. Bioprocessed brewers’ spent grain improves nutritional and antioxidant properties of pasta. Antioxidants 2021, 10, 742. [Google Scholar] [CrossRef]
  19. Pontonio, E.; Lorusso, A.; Gobbetti, M.; Rizzello, C.G. Use of fermented milling by-products as functional ingredient to develop a low-glycaemic index bread. J. Cereal Sci. 2017, 77, 235–242. [Google Scholar] [CrossRef]
  20. Verni, M.; Rizzello, C.G.; Coda, R. Fermentation biotechnology applied to cereal industry by-products: Nutritional and functional insights. Front. Nutr. 2019, 6, 42. [Google Scholar] [CrossRef] [Green Version]
  21. Pontonio, E.; Dingeo, C.; Gobbetti, M.; Rizzello, C.G. Maize milling by-products: From food wastes to functional ingredients through lactic acid bacteria fermentation. Front. Microbiol. 2019, 10, 561. [Google Scholar] [CrossRef] [Green Version]
  22. Schettino, R.; Pontonio, E.; Rizzello, C.G. Use of fermented hemp, chickpea and milling by-products to improve the nutritional value of semolina pasta. Foods 2019, 8, 604. [Google Scholar] [CrossRef] [Green Version]
  23. Immonen, M.; Maina, N.H.; Wang, Y.; Coda, R.; Katina, K. Waste bread recycling as a baking ingredient by tailored lactic acid fermentation. Int. J. Food Microbiol. 2020, 327, 108652. [Google Scholar] [CrossRef]
  24. Cantatore, V.; Filannino, P.; Gambacorta, G.; De Pasquale, I.; Pan, S.; Gobbetti, M.; Di Cagno, R. Lactic Acid Fermentation to Re-cycle Apple By-Products for Wheat Bread Fortification. Front. Microbiol. 2019, 10, 2574. [Google Scholar] [CrossRef]
  25. Sahin, A.W.; Rice, T.; Zannini, E.; Axel, C.; Coffey, A.; Lynch, K.M.; Arendt, E.K. Leuconostoc citreum TR116: In-situ production of mannitol in sourdough and its application to reduce sugar in burger buns. Int. J. Food Microbiol. 2019, 302, 80–89. [Google Scholar] [CrossRef]
  26. Sahin, A.W.; Rice, T.; Coffey, A. Genomic analysis of Leuconostoc citreum TR116 with metabolic reconstruction and the effects of fructose on gene expression for mannitol production. Int. J. Food Microbiol. 2021, 354, 109327. [Google Scholar] [CrossRef]
  27. Rice, T.; Sahin, A.W.; Heitmann, M.; Lynch, K.M.; Jacob, F.; Arendt, E.K.; Coffey, A. Application of mannitol producing Leuconostoc citreum TR116 to reduce sugar content of barley, oat and wheat malt-based worts. Food Microbiol. 2020, 90, 103464. [Google Scholar] [CrossRef]
  28. Hoehnel, A.; Bez, J.; Sahin, A.W.; Coffey, A.; Arendt, E.K.; Zannini, E. Leuconostoc citreum TR116 as a Microbial Cell Factory to Functionalise High-Protein Faba Bean Ingredients for Bakery Applications. Foods 2020, 9, 1706. [Google Scholar] [CrossRef]
  29. Boeck, T.; Ispiryan, L.; Hoehnel, A.; Sahin, A.W.; Coffey, A.; Zannini, E.; Arendt, E.K. Lentil-Based Yogurt Alternatives Fermented with Multifunctional Strains of Lactic Acid Bacteria—Techno-Functional, Microbiological, and Sensory Characteristics. Foods 2022, 11, 2013. [Google Scholar] [CrossRef]
  30. Ryan, L.A.M.; Zannini, E.; Dal Bello, F.; Pawlowska, A.; Koehler, P.; Arendt, E.K. Lactobacillus amylovorus DSM 19280 as a novel food-grade antifungal agent for bakery products. Int. J. Food Microbiol. 2011, 146, 276–283. [Google Scholar] [CrossRef]
  31. Peyer, L.C.; Zarnkow, M.; Jacob, F.; De Schutter, D.P.; Arendt, E.K. Sour brewing: Impact of Lactobacillus amylovorus FST2.11 on technological and quality attributes of acid beers. J. Am. Soc. Brew. Chem. 2017, 75, 207–216. [Google Scholar] [CrossRef] [Green Version]
  32. Peyer, L.C.; Bellut, K.; Lynch, K.M.; Zarnkow, M.; Jacob, F.; De Schutter, D.P.; Arendt, E.K. Impact of buffering capacity on the acidification of wort by brewing-relevant lactic acid bacteria. J. Inst. Brew. 2017, 123, 497–505. [Google Scholar] [CrossRef] [Green Version]
  33. Lynch, K.M.; Lucid, A.; Arendt, E.K.; Sleator, R.D.; Lucey, B.; Coffey, A. Genomics of Weissella cibaria with an examination of its metabolic traits. Microbiology 2015, 161, 914–930. [Google Scholar] [CrossRef]
  34. Galle, S.; Schwab, C.; Arendt, E.; Gänzle, M. Exopolysaccharide-forming weissella strains as starter cultures for sorghum and wheat sourdoughs. J. Agric. Food Chem. 2010, 58, 5834–5841. [Google Scholar] [CrossRef]
  35. Wolter, A.; Hager, A.S.; Zannini, E.; Arendt, E.K. Influence of sourdough on in vitro starch digestibility and predicted glycemic indices of gluten-free breads. Food Funct. 2014, 5, 564–572. [Google Scholar] [CrossRef] [PubMed]
  36. Zannini, E.; Mauch, A.; Galle, S.; Gänzle, M.; Coffey, A.; Arendt, E.K.; Taylor, J.P.; Waters, D.M. Barley malt wort fermentation by exopolysaccharide-forming Weissella cibaria MG1 for the production of a novel beverage. J. Appl. Microbiol. 2013, 115, 1379–1387. [Google Scholar] [CrossRef]
  37. Wolter, A.; Hager, A.S.; Zannini, E.; Galle, S.; Gänzle, M.G.; Waters, D.M.; Arendt, E.K. Evaluation of exopolysaccharide producing Weissella cibaria MG1 strain for the production of sourdough from various flours. Food Microbiol. 2014, 37, 44–50. [Google Scholar] [CrossRef] [PubMed]
  38. Belz, M.C.E.; Axel, C.; Arendt, E.K.; Lynch, K.M.; Brosnan, B.; Sheehan, E.M.; Coffey, A.; Zannini, E. Improvement of taste and shelf life of yeasted low-salt bread containing functional sourdoughs using Lactobacillus amylovorus DSM 19280 and Weisella cibaria MG1. Int. J. Food Microbiol. 2019, 302, 69–79. [Google Scholar] [CrossRef] [PubMed]
  39. Zannini, E.; Jeske, S.; Lynch, K.; Arendt, E.K. Development of novel quinoa-based yoghurt fermented with dextran producer Weissella cibaria MG1. Int. J. Food Microbiol. 2018, 268, 19–26. [Google Scholar] [CrossRef]
  40. Axel, C.; Brosnan, B.; Zannini, E.; Peyer, L.C.; Furey, A.; Coffey, A.; Arendt, E.K. Antifungal activities of three different Lactobacillus species and their production of antifungal carboxylic acids in wheat sourdough. Appl. Microbiol. Biotechnol. 2016, 100, 1701–1711. [Google Scholar] [CrossRef]
  41. Schmidt, M.; Lynch, K.M.; Zannini, E.; Arendt, E.K. Fundamental study on the improvement of the antifungal activity of Lactobacillus reuteri R29 through increased production of phenyllactic acid and reuterin. Food Control 2018, 88, 139–148. [Google Scholar] [CrossRef]
  42. Peyer, L.C.; Zannini, E.; Jacob, F.; Arendt, E.K. Growth study, metabolite development, and organoleptic profile of a malt-based substrate fermented by lactic acid bacteria. J. Am. Soc. Brew. Chem. 2015, 73, 303–313. [Google Scholar] [CrossRef]
  43. Dal Bello, F.; Clarke, C.I.; Ryan, L.A.M.; Ulmer, H.; Schober, T.J.; Ström, K.; Sjögren, J.; van Sinderen, D.; Schnürer, J.; Arendt, E.K. Improvement of the quality and shelf life of wheat bread by fermentation with the antifungal strain Lactobacillus plantarum FST 1.7. J. Cereal Sci. 2007, 45, 309–318. [Google Scholar] [CrossRef]
  44. Peyer, L.C.; Axel, C.; Lynch, K.M.; Zannini, E.; Jacob, F.; Arendt, E.K. Inhibition of Fusarium culmorum by carboxylic acids released from lactic acid bacteria in a barley malt substrate. Food Control 2016, 69, 227–236. [Google Scholar] [CrossRef]
  45. Sahin, A.W.; Rice, T.; Zannini, E.; Lynch, K.M.; Coffey, A.; Arendt, E.K. The incorporation of sourdough in sugar-reduced biscuits: A promising strategy to improve techno-functional and sensory properties. Eur. Food Res. Technol. 2019, 245, 1841–1854. [Google Scholar] [CrossRef]
  46. Baldini, M.; Fabietti, F.; Giammarioli, S.; Onori, R.; Orefice, L.; Stacchini, A. Metodi di Analisi Utilizzati Per il Controllo Chimico Degli Alimenti. Rapporti ISTISAN 1996/34. 1996. Available online: https://www.iss.it/documents/20126/45616/Rapp_ISTISAN_96_34_def.pdf/e3149ce3-508d-28f5-d4d2-f30c8479213c?t=1581103178196 (accessed on 20 December 2022).
  47. Ispiryan, L.; Heitmann, M.; Hoehnel, A.; Zannini, E.; Arendt, E.K. Optimization and Validation of an HPAEC-PAD Method for the Quantification of FODMAPs in Cereals and Cereal-Based Products. J. Agric. Food Chem. 2019, 67, 4384–4392. [Google Scholar] [CrossRef] [PubMed]
  48. Smart, K.F.; Aggio, R.B.M.; Van Houtte, J.R.; Villas-Bôas, S.G. Analytical platform for metabolome analysis of microbial cells using methyl chloroformate derivatization followed by gas chromatography-mass spectrometry. Nat. Protoc. 2010, 5, 1709–1729. [Google Scholar] [CrossRef] [PubMed]
  49. Traynham, T.L.; Myers, D.J.; Carriquiry, A.L.; Johnson, L.A. Evaluation of water-holding capacity for wheat-soy flour blends. JAOCS, J. Am. Oil Chem. Soc. 2007, 84, 151–155. [Google Scholar] [CrossRef]
  50. Hoehnel, A.; Axel, C.; Bez, J.; Arendt, E.K.; Zannini, E. Comparative analysis of plant-based high-protein ingredients and their impact on quality of high-protein bread. J. Cereal Sci. 2019, 89, 102816. [Google Scholar] [CrossRef]
  51. Hoehnel, A.; Bez, J.; Petersen, I.L.; Amarowicz, R.; Juśkiewicz, J.; Arendt, E.K.; Zannini, E. Enhancing the nutritional profile of regular wheat bread while maintaining technological quality and adequate sensory attributes. Food Funct. 2020, 11, 4732–4751. [Google Scholar] [CrossRef] [PubMed]
  52. Graves, T.; Narendranath, N.V.; Dawson, K.; Power, R. Effect of pH and lactic or acetic acid on ethanol productivity by Saccharomyces cerevisiae in corn mash. J. Ind. Microbiol. Biotechnol. 2006, 33, 469–474. [Google Scholar] [CrossRef] [PubMed]
  53. Tirloni, E.; Bernardi, C.; Celandroni, F.; Ghelardi, E.; Stella, S. Effectiveness of lactic and acetic acids on the growth of Listeria monocytogenes and Bacillus cereus in primo sale fresh cheese. Lwt 2021, 151, 112170. [Google Scholar] [CrossRef]
  54. Chang, R. Physical Chemistry for the Biosciences; University Science Books: Sausalito, CA, USA, 2005. [Google Scholar]
  55. Von Wright, A.; Axelsson, L. Lactic Acid Bacteria—An introduction. In Lactic Acid Bacteria; Vinderola, G., Ouwehand, A.C., Salminen, S., Von Wright, A., Eds.; CRC Press: Boca Raton, FL, USA, 2019; pp. 1–17. [Google Scholar]
  56. Prentice, N. Invertase of Germinated Barley. J. Agric. Food Chem. 1972, 20, 764–768. [Google Scholar] [CrossRef]
  57. Sasaki, Y.; Laivenieks, M.; Zeikus, J.G. Lactobacillus reuteri ATCC 53608 mdh gene cloning and recombinant mannitol dehydrogenase characterization. Appl. Microbiol. Biotechnol. 2005, 68, 36–41. [Google Scholar] [CrossRef]
  58. Ortiz, M.E.; Fornaguera, M.J.; Raya, R.R.; Mozzi, F. Lactobacillus reuteri CRL 1101 highly produces mannitol from sugarcane molasses as carbon source. Appl. Microbiol. Biotechnol. 2012, 95, 991–999. [Google Scholar] [CrossRef]
  59. Ortiz, M.E.; Raya, R.R.; Mozzi, F. Efficient mannitol production by wild-type Lactobacillus reuteri CRL 1101 is attained at constant pH using a simplified culture medium. Appl. Microbiol. Biotechnol. 2015, 99, 8717–8729. [Google Scholar] [CrossRef] [PubMed]
  60. Ispiryan, L.; Zannini, E.; Arendt, E.K. Characterization of the FODMAP-profile in cereal-product ingredients. J. Cereal Sci. 2020, 92, 102916. [Google Scholar] [CrossRef]
  61. Gibson, P.R.; Halmos, E.P.; Muir, J.G. Review article: FODMAPS, prebiotics and gut health-the FODMAP hypothesis revisited. Aliment. Pharmacol. Ther. 2020, 52, 233–246. [Google Scholar] [CrossRef] [PubMed]
  62. Ortiz, M.E.; Bleckwedel, J.; Fadda, S.; Picariello, G.; Hebert, E.M.; Raya, R.R.; Mozzi, F. Global analysis of mannitol 2-dehydrogenase in Lactobacillus reuteri crl 1101 during mannitol production through enzymatic, genetic and proteomic approaches. PLoS ONE 2017, 12, e0169441. [Google Scholar] [CrossRef] [PubMed] [Green Version]
  63. Gänzle, M.G. Lactic metabolism revisited: Metabolism of lactic acid bacteria in food fermentations and food spoilage. Curr. Opin. Food Sci. 2015, 2, 106–117. [Google Scholar] [CrossRef]
  64. Sahin, A.W.; Axel, C.; Zannini, E.; Arendt, E.K. Xylitol, mannitol and maltitol as potential sucrose replacers in burger buns. Food Funct. 2018, 9, 2201–2212. [Google Scholar] [CrossRef]
  65. Ispiryan, L.; Kuktaite, R.; Zannini, E.; Arendt, E.K. Fundamental study on changes in the FODMAP profile of cereals, pseudo-cereals, and pulses during the malting process. Food Chem. 2021, 343, 128549. [Google Scholar] [CrossRef]
  66. Van Hijum, S.A.F.T.; Van Geel-Schutten, G.H.; Rahaoui, H.; Van der Maarel, M.J.E.C.; Dijkhuizen, L. Characterization of a novel fructosyltransferase from Lactobacillus reuteri that synthesizes high-molecular-weight inulin and inulin oligosaccharides. Appl. Environ. Microbiol. 2002, 68, 4390–4398. [Google Scholar] [CrossRef] [PubMed] [Green Version]
  67. Van Geel-Schutten, G.H.; Faber, E.J.; Smit, E.; Bonting, K.; Smith, M.R.; Ten Brink, B.; Kamerling, J.P.; Vliegenthart, J.F.G.; Dijkhuizen, L. Biochemical and structural characterization of the glucan and fructan exopolysaccharides synthesized by the Lactobacillus reuteri wild-type strain and by mutant strains. Appl. Environ. Microbiol. 1999, 65, 3008–3014. [Google Scholar] [CrossRef]
  68. Van Hijum, S.A.F.T.; Bonting, K.; Van Der Maarel, M.J.E.C.; Dijkhuizen, L. Purification of a novel fructosyltransferase from Lactobacillus reuteri strain 121 and characterization of the levan produced. FEMS Microbiol. Lett. 2001, 205, 323–328. [Google Scholar] [CrossRef] [PubMed]
  69. Ozimek, L.K.; Kralj, S.; van der Maarel, M.J.E.C.; Dijhuizen, L. The levansucrase and inulosucrase enzymes of Lactobacillus reuteri 121 catalyse processive and non-processive transglycosylation reactions. Microbiology 2006, 152, 1187–1196. [Google Scholar] [CrossRef] [PubMed] [Green Version]
  70. Verspreet, J.; Hemdane, S.; Dornez, E.; Cuyvers, S.; Delcour, J.A.; Courtin, C.M. Maximizing the concentrations of wheat grain fructans in bread by exploring strategies to prevent their yeast (Saccharomyces cerevisiae)-mediated degradation. J. Agric. Food Chem. 2013, 61, 1397–1404. [Google Scholar] [CrossRef]
  71. Ispiryan, L.; Zannini, E.; Arendt, E.K. FODMAP modulation as a dietary therapy for IBS: Scientific and market perspective. Compr. Rev. Food Sci. Food Saf. 2022, 21, 1491–1516. [Google Scholar] [CrossRef]
  72. Fedewa, A.; Rao, S.S.C. Dietary fructose intolerance, fructan intolerance and FODMAPs. Curr. Gastroenterol. Rep. 2014, 16, 370. [Google Scholar] [CrossRef] [Green Version]
  73. Laëtitia, G.; Pascal, D.; Yann, D. The Citrate Metabolism in Homo- and Heterofermentative LAB: A Selective Means of Becoming Dominant over Other Microorganisms in Complex Ecosystems. Food Nutr. Sci. 2014, 05, 953–969. [Google Scholar] [CrossRef] [Green Version]
  74. Mauro, C.S.I.; Garcia, S. Coconut milk beverage fermented by Lactobacillus reuteri: Optimization process and stability during refrigerated storage. J. Food Sci. Technol. 2019, 56, 854–864. [Google Scholar] [CrossRef]
  75. Saulnier, D.M.; Santos, F.; Roos, S.; Mistretta, T.A.; Spinler, J.K.; Molenaar, D.; Teusink, B.; Versalovic, J. Exploring metabolic pathway reconstruction and genome-wide expression profiling in Lactobacillus reuteri to define functional probiotic features. PLoS ONE 2011, 6, e18783. [Google Scholar] [CrossRef] [Green Version]
  76. Østlie, H.M.; Helland, M.H.; Narvhus, J.A. Growth and metabolism of selected strains of probiotic bacteria in milk. Int. J. Food Microbiol. 2003, 87, 17–27. [Google Scholar] [CrossRef] [PubMed]
  77. Hashemi, S.M.B.; Mousavi Khaneghah, A.; Barba, F.J.; Nemati, Z.; Sohrabi Shokofti, S.; Alizadeh, F. Fermented sweet lemon juice (Citrus limetta) using Lactobacillus plantarum LS5: Chemical composition, antioxidant and antibacterial activities. J. Funct. Foods 2017, 38, 409–414. [Google Scholar] [CrossRef]
  78. Hashemi, S.M.B.; Jafarpour, D. Fermentation of bergamot juice with Lactobacillus plantarum strains in pure and mixed fermentations: Chemical composition, antioxidant activity and sensorial properties. Lwt 2020, 131, 109803. [Google Scholar] [CrossRef]
  79. Wang, Y.; Wu, J.; Lv, M.; Shao, Z.; Hungwe, M.; Wang, J.; Bai, X.; Xie, J.; Wang, Y.; Geng, W. Metabolism Characteristics of Lactic Acid Bacteria and the Expanding Applications in Food Industry. Front. Bioeng. Biotechnol. 2021, 9, 612285. [Google Scholar] [CrossRef] [PubMed]
  80. Kaneuchi, C.; Seki, M.; Komagata, K. Production of Succinic Acid from Citric Acid and Related Acids by Lactobacillus Strains. Appl. Environ. Microbiol. 1988, 54, 3053–3056. [Google Scholar] [CrossRef] [PubMed] [Green Version]
  81. Bartowsky, E.J.; Costello, P.J.; Chambers, P.J. Emerging trends in the application of malolactic fermentation. Aust. J. Grape Wine Res. 2015, 21, 663–669. [Google Scholar] [CrossRef]
  82. Ferreira, A.M.; Mendes-Faia, A. The role of yeasts and lactic acid bacteria on the metabolism of organic acids during winemaking. Foods 2019, 9, 1231. [Google Scholar] [CrossRef]
  83. Garcerci Garcera, M.A.J.; Campos, M.A.; Zuniga, M.A.; Uruburu, F.E. Growth and Metabolism of L-malic Acid by Lactobacillus plantarum CECT 220 in a Defined Medium. J. Food Sci. 1992, 57, 778–780. [Google Scholar] [CrossRef]
  84. Arendt, E.K.; Hammes, W.P. Isolation and characterization of Leuconostoc oenos phages from German wines. Appl. Microbiol. Biotechnol. 1992, 37, 643–646. [Google Scholar] [CrossRef]
  85. Rosell, C..; Rojas, J.A.; Benedito de Barber, C. Influence of hydrocolloids on dough rheology and bread quality. Food Hydrocoll. 2001, 15, 75–81. [Google Scholar] [CrossRef]
  86. Sudha, M.L.; Vetrimani, R.; Leelavathi, K. Influence of fibre from different cereals on the rheological characteristics of wheat flour dough and on biscuit quality. Food Chem. 2007, 100, 1365–1370. [Google Scholar] [CrossRef]
  87. Shi, Y.; Singh, A.; Kitts, D.D.; Pratap-Singh, A. Lactic acid fermentation: A novel approach to eliminate unpleasant aroma in pea protein isolates. Lwt 2021, 150, 111927. [Google Scholar] [CrossRef]
  88. Mirhosseini, H.; Amid, B.T. Effect of different drying techniques on flowability characteristics and chemical properties of natural carbohydrate-protein Gum from durian fruit seed. Chem. Cent. J. 2013, 7, 1. [Google Scholar] [CrossRef] [Green Version]
  89. Olaerts, H.; Vandekerckhove, L.; Courtin, C.M. A closer look at the bread making process and the quality of bread as a function of the degree of preharvest sprouting of wheat (Triticum aestivum). J. Cereal Sci. 2018, 80, 188–197. [Google Scholar] [CrossRef]
  90. Nindo, C.I.; Sun, T.; Wang, S.W.; Tang, J.; Powers, J.R. Evaluation of drying technologies for retention of physical quality and antioxidants in asparagus (Asparagus officinalis, L.). LWT—Food Sci. Technol. 2003, 36, 507–516. [Google Scholar] [CrossRef]
  91. Argyropoulos, D.; Heindl, A.; Müller, J. Assessment of convection, hot-air combined with microwave-vacuum and freeze-drying methods for mushrooms with regard to product quality. Int. J. Food Sci. Technol. 2011, 46, 333–342. [Google Scholar] [CrossRef]
  92. Voda, A.; Homan, N.; Witek, M.; Duijster, A.; van Dalen, G.; van der Sman, R.; Nijsse, J.; van Vliet, L.; Van As, H.; van Duynhoven, J. The impact of freeze-drying on microstructure and rehydration properties of carrot. Food Res. Int. 2012, 49, 687–693. [Google Scholar] [CrossRef]
  93. Rizvi, S.M.H.; Beattie, A.D.; Rossnagel, B.; Scoles, G. Thermostability of barley malt proteases in Western Canadian two-row malting barley. Cereal Chem. 2011, 88, 609–613. [Google Scholar] [CrossRef]
Figure 1. Acidification and microbial growth of Leuconostoc citreum TR116 (TR116) (Fermentation 09 00078 i001), Lactobacillus amylovorus FST2.11 (FST2.11) (Fermentation 09 00078 i002), Weissella cibaria MG1 (MG1) (Fermentation 09 00078 i003), Limosilactobacillus reuteri R29 (R29) (Fermentation 09 00078 i004) and Lactiplantibacillus plantarum FST1.7 (FST1.7) (Fermentation 09 00078 i005
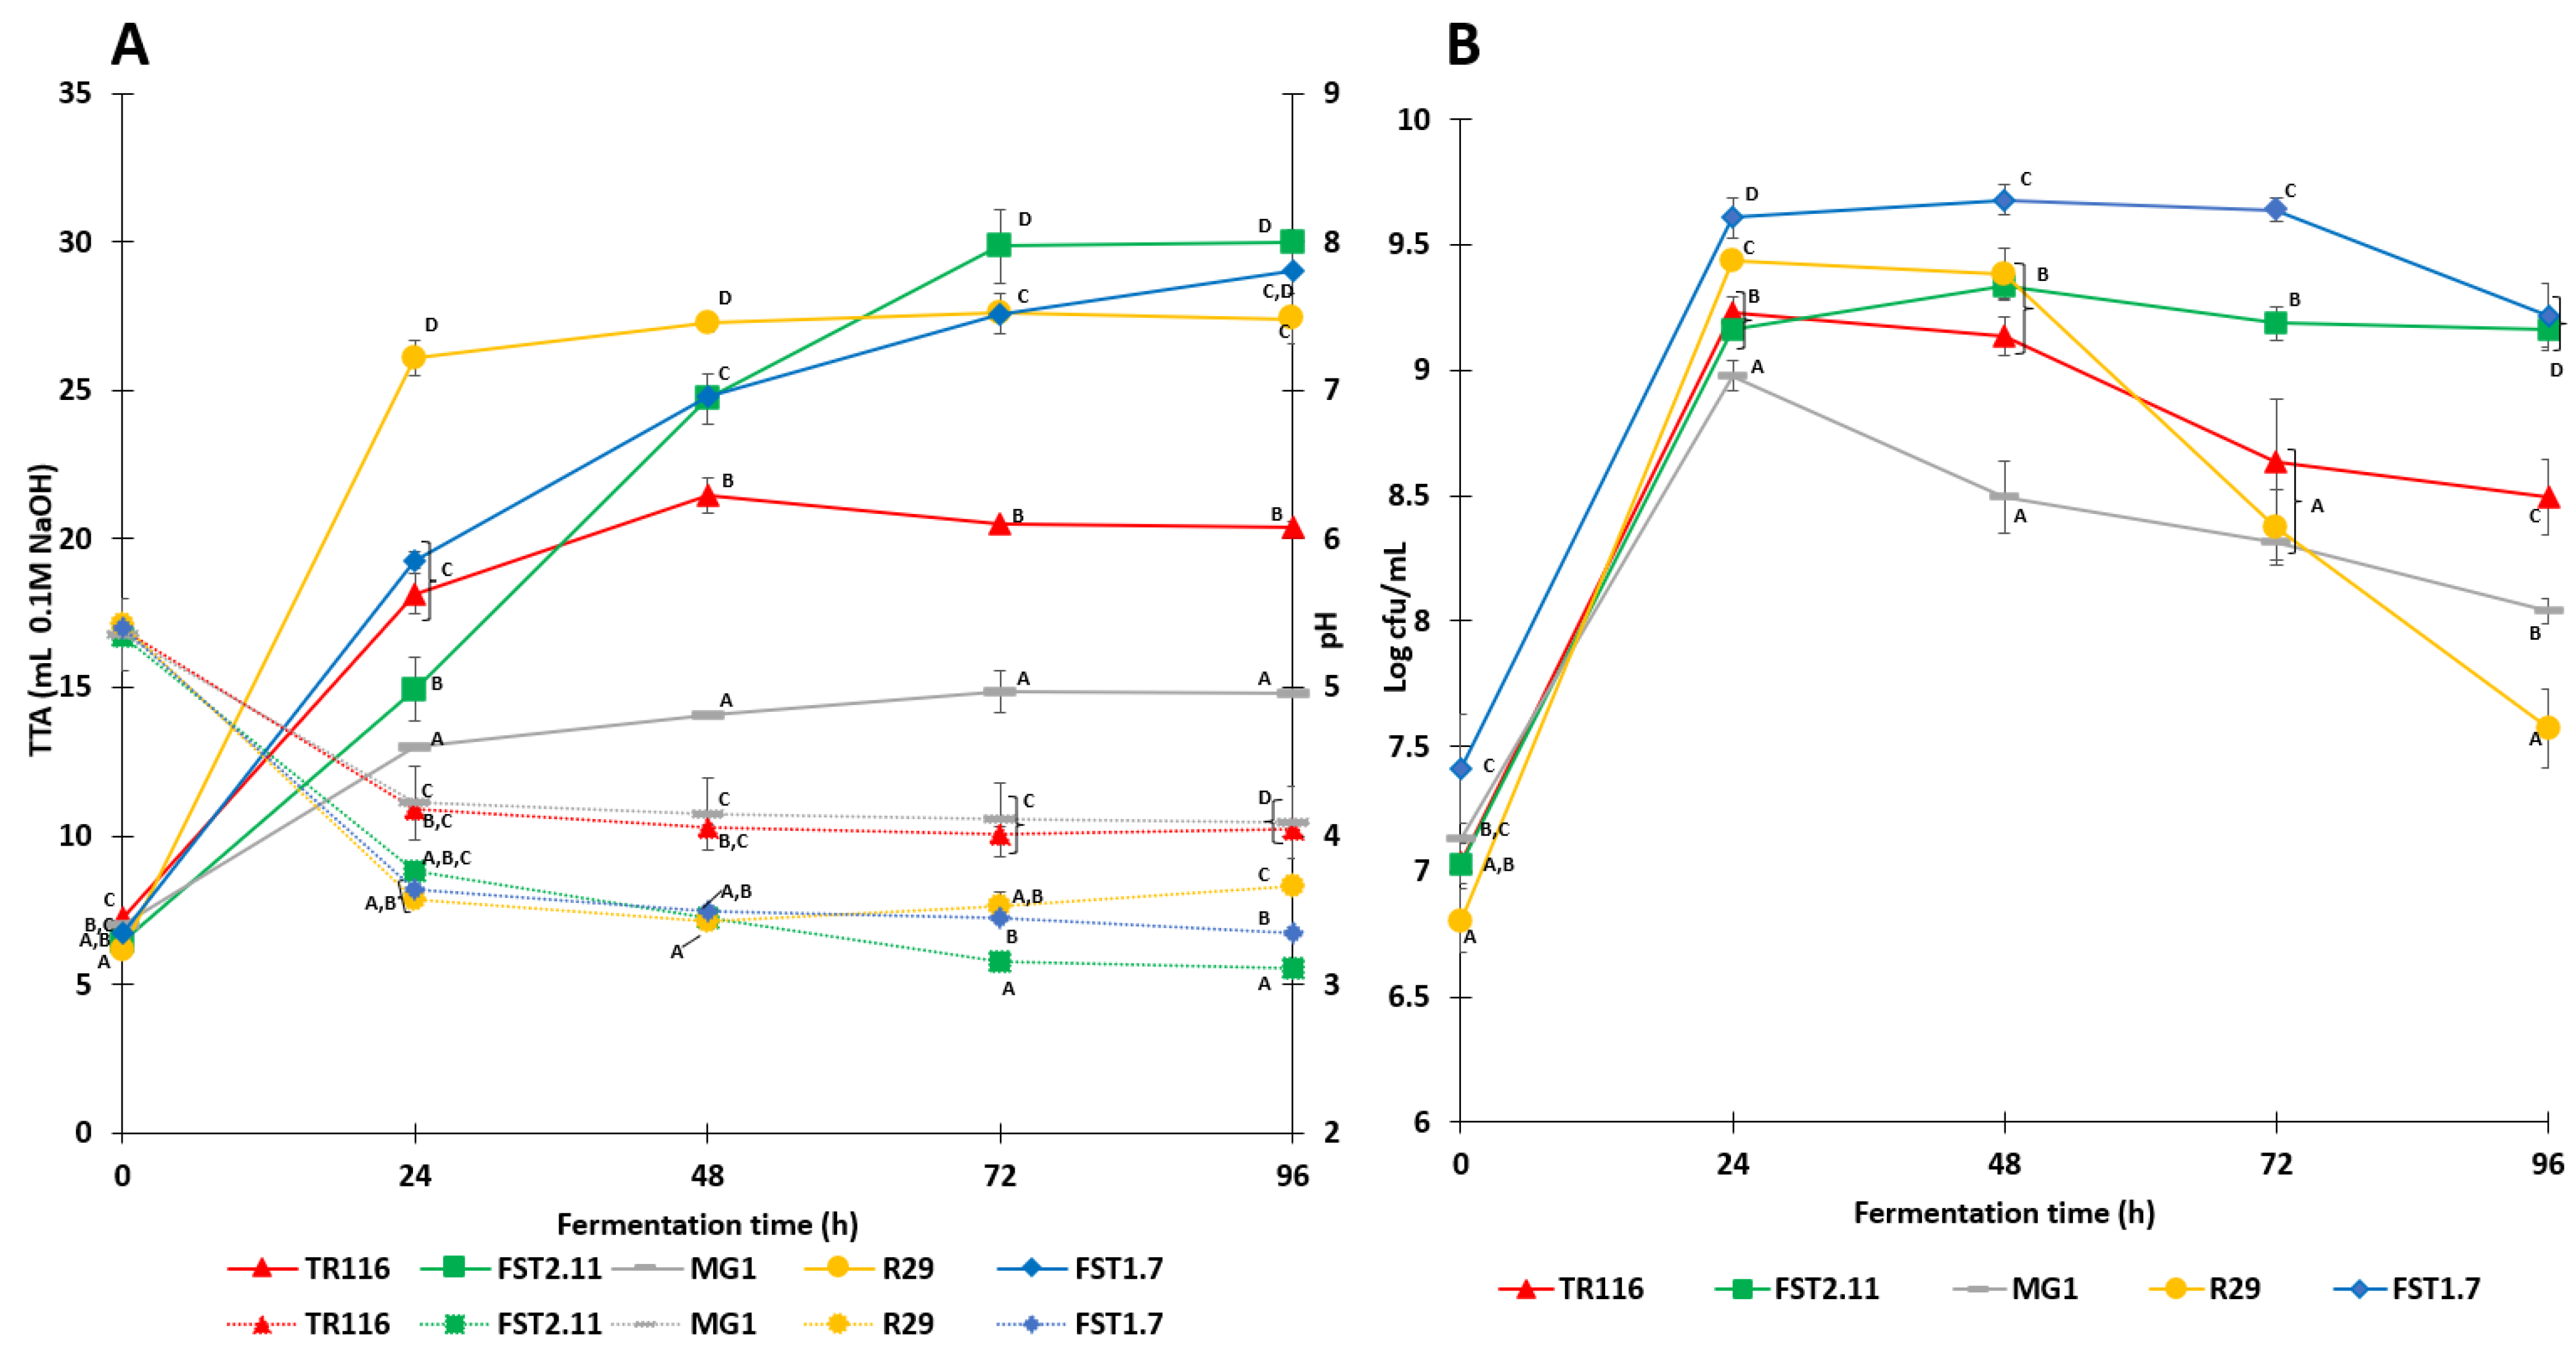
). (A) Development of total titratable acids (TTA) (solid line) and pH (dotted line); (B) cell count (CFU/mL) during fermentation. Points which share the same letter do not differ significantly.
Fermentation 09 00078 g001
Figure 2. GC-MS metabolomic analysis of rootlet ingredients. TR116, FST2.11, MG1, R29 and FST 1.7 represent barley rootlets fermented with Leuconostoc citreum TR116, Lactobacillus amylovorus FST2.11, Weissella cibaria MG1, Limosilactobacillus reuteri R29 and Lactiplantibacillus plantarum FST1.7, respectively. Error bars on the graph indicate the standard deviations found within samples. * indicates relative peak area values, which are normalised based on an internal standard (deuterium-labelled alanine). No statistical difference was found with values in the same row which share the same uppercase letter.
Fermentation 09 00078 g002
Figure 3. Scanning electron micrograph (SEM) of unfermented rootlets (A,B), sterilised rootlets (C,D) and rootlets fermented with Limosilactobacillus reuteri R29 (E,F) at magnifications of ×50 (A,C,E) and ×1000 (B,D,F).
Fermentation 09 00078 g003
Table 1. Attributes of the lactic acid bacteria used for experimental analysis.
SpeciesLeuconostoc
citreum
Lactobacillus amylovorusWeissella
cibaria
Limosilactobacillus reuteriLactiplantibacillus plantarum
StrainTR116FST 2.11MG1R29FST 1.7
MetabolismHeterofermentativeHomofermentativeHeterofermentativeHeterofermentativeHeterofermentative
Fermentation substrateFructoseSucroseSucroseSucroseSucrose
SourceYellow
pea sourdough
Brewing environmentSourdoughHuman
intestine
Malted
barley
Special traitsMannitol producer, antifungal
producer
Antimicrobial producer, high acid producerDextran exopolysaccharide producerMannitol producer, antifungal producerAntifungal producer, high acid producer
References[25,26,27,28,29][30,31,32][33,34,35,36,37,38,39][40,41,42][32,35,42,43,44]
Table 2. Quantities of residual carbohydrates and acids in rootlet ingredients. BR-UnF and BR-Ster represent unfermented barley rootlet and sterilised barley rootlets, respectively. BR-TR116, BR-MG1, BR-FST2.11, BR-29 and BR-FST1.7 represent results for barley rootlets after 96 h fermentation, fermented with five different lactic acid bacteria: Leuconostoc citreum TR116, Weissella cibaria MG1, Lactobacillus amylovorus FST2.11, Limosilactobacillus reuteri R29 and Lactiplantibacillus plantarum FST 1.7, respectively. Values reported represent the mean ± standard deviation in g/100 g d.m. Values in the same row which share the same uppercase letter do not differ significantly.
BR-UnFBR-SterBR-TR116BR-MG1BR-FST2.11BR-R29BR-FST1.7
Sugars a
Glucose0.261 ± 0.021 A0.521 ± 0.009 Bn.d.8.094 ± 0.147 F2.176 ± 0.029 C3.190 ± 0.040 D4.581 ± 0.050 E
Fructose1.149 ± 0.076 C1.249 ± 0.023 C0.347 ± 0.006 A13.234 ± 0.229 F11.870 ± 0.167 E0.495 ± 0.004 B9.991 ± 0.134 D
Sucrose0.063 ± 0.002 C0.016 ± 0.000 An.d.0.586 ± 0.033 D2.690 ± 0.069 F0.042 ± 0.000 B2.060 ± 0.036 E
Maltose0.006 ± 0.000 A0.137 ± 0.001 Dn.d.n.d.0.041 ± 0.001 C0.012 ± 0.001 B0.007 ± 0.001 A
Maltotriosen.d.0.026 ± 0.000 B0.010 ± 0.000 A0.036 ± 0.001 Dn.d.0.046 ± 0.001 E0.034 ± 0.001 C
Acids a
Lacticn.d.n.d.2.822 ± 0.035 A3.306 ± 0.050 B11.743 ± 0.441 D5.929 ± 0.036 C12.498 ± 0.029 D
Aceticb0.573 ± 0.019 B3.980 ± 0.012 E5.523 ± 0.045 G1.681 ± 0.024 C0.428 ± 0.020 A2.060 ± 0.008 D4.272 ± 0.031 F
FODMAPs a,c
Excess Fructose d0.944 ± 0.035 B0.764 ± 0.004 B0.400 ± 0.004 A6.109 ± 0.112 D11.780 ± 0.127 E0.000 ± 0.0005.648 ± 0.035 C
Sorbitol0.377 ± 0.017 E,F0.340 ± 0.002 F0.241 ± 0.001 A0.283 ± 0.002 D0.278 ± 0.002 C0.258 ± 0.002 B0.292 ± 0.002 E
Mannitol0.025 ± 0.000 A0.024 ± 0.000 A20.074 ± 0.065 Dn.d.n.d.16.779 ± 0.292 C0.149 ± 0.001 B
Σ Polyols0.402 ± 0.003 B,C0.364 ± 0.000 B20.315 ± 0.066 E0.283 ± 0.002 A0.278 ± 0.002 A17.037 ± 0.291 D0.441 ± 0.003 C
Raffinose/Stachyose0.012 ± 0.000 A0.035 ± 0.000 Bn.d.0.101 ± 0.001 Cn.d.n.d.n.d.
Verbascosen.d.n.d.n.d.n.d.n.d.n.d.n.d.
Σ GOS e0.012 ± 0.000 A0.035 ± 0.000 B-0.101 ± 0.001 C---
Fructans1.711 ± 0.083 C1.786 ± 0.042 C,D0.895 ± 0.022 A1.277 ± 0.123 B1.277 ± 0.099 B1.925 ± 0.014 D1.090 ± 0.041 A,B
a n.d. is defined as not detected (below LOD) or levels below 0.002 g/100 g (sugars), 0.030 g/100 g (acids) and 0.012 g/100 g (FODMAPs). b Acetic acid values are overestimated due to an unknown compound coeluting at the same retention time. c No lactose was detected in any of the FODMAP extracts and therefore was not included in the table. d Excess fructose = fructose − glucose. e no α-galactooligosaccarides present.
Table 3. Analysis of the functional properties of rootlet ingredients. BR-UnF and BR-Ster represent unfermented barley rootlet and sterilised barley rootlets, respectively. BR-TR116, BR-MG1, BR-FST2.11, BR-29 and BR-FST1.7 represent barley rootlets fermented with: Leuconostoc citreum TR116, Weissella cibaria MG1, Lactobacillus amylovorus FST2.11, Limosilactobacillus reuteri R29 and Lactiplantibacillus plantarum FST1.7, respectively. The values in the table represent the mean + standard deviation. No statistical difference was found with values in the same row which share the same uppercase letter.
PropertiesBR-UnFBR- SterBR-TR116BR-MG1BR-FST2.11BR-R29BR-FST1.7
Water-Binding Capacity
(g H2O/100 g sample)
500.29 ±11.02 C523.90 ± 25.78 C 427.33 ± 17.20 A,B377.76 ± 18.61 A459.25 ± 39.09 B,C384.07 ± 23.88 A418.09 ± 25.25 A,B
Oil-Binding Capacity
(g oil/100 g sample)
237.20 ± 22.74 A367.93 ± 21.24 C409.39 ± 12.98 D287.87 ± 9.62 B305.61 ± 3.50 B319.90 ± 5.27 B290.23 ± 3.84 B
pH5.20 ± 0.01 D5.16 ± 0.01 C,D4.09 ± 0.02 B,C4.09 ± 0.01 B,C,D3.37 ± 0.01 A3.69 ± 0.01 A,B,C3.38 ± 0.01 A,B
Total Titratable Acidity (mL 0.1 M NaOH/g)4.5 ± 0.13 A6.08 ± 0.06 B10.55 ± 0.21 D8.42 ± 0.0.11 C16.82 ± 0.38 F17.01 ± 0.25 F14.31 ± 0.06 E
Colour (ΔE − BR-UnF)-8.15 ± 0.77 B9.13 ± 0.57 B10.14 ± 1.15 B3.65 ± 0.47 A8.32 ± 0.85 B9.02 ± 0.25 B
Alpha amylase (cu/g d.m)5.120 ± 0.302 B0.026 ± 0.000 A0.000 ± 0.000 A 0.025 ± 0.005 A0.030 ± 0.000 A0.025 ± 0.015 A0.041 ± 0.016 A
Beta amylase (cu/g d.m)0.772 ± 0.185 B0.010 ± 0.014 A0.000 ± 0.000 A0.006 ± 0.000 A0.124 ± 0.000 A0.045 ± 0.016 A0.035 ± 0.017 A
Disclaimer/Publisher’s Note: The statements, opinions and data contained in all publications are solely those of the individual author(s) and contributor(s) and not of MDPI and/or the editor(s). MDPI and/or the editor(s) disclaim responsibility for any injury to people or property resulting from any ideas, methods, instructions or products referred to in the content.

