Article

Lactic Bacteria in Artisanal Cheese: Characterization through Metagenomics

by
Magnolia Martins Erhardt
1,2,*,
Wemerson de Castro Oliveira
1,3,
Hans Fröder
1,
Pedro Henrique Marques
4,
Maria Beatriz Prior Pinto Oliveira
5 and
Neila Silvia Pereira dos Santos Richards
2
1
Department of Food Science and Technology, State University of Rio Grande do Sul, Encantado 95960-000, RS, Brazil
2
Department of Food Science and Technology, Federal University of Santa Maria, Santa Maria 97105-900, RS, Brazil
3
Department of Research and Extension, Instituto Federal de Educação, Ciência e Tecnologia Sul-Rio-Grandense, Lajeado 95910-016, RS, Brazil
4
Department of Microbiology, Immunology and Parasitology, Universidade Federal do Triângulo Mineiro, Uberaba 38025-440, MG, Brazil
5
REQUIMTE/LAQV, Department of Chemical Sciences, Faculty of Pharmacy, University of Porto, 4050-313 Porto, Portugal
*
Author to whom correspondence should be addressed.
Fermentation 2023, 9(1), 41; https://doi.org/10.3390/fermentation9010041
Submission received: 4 December 2022 / Revised: 28 December 2022 / Accepted: 29 December 2022 / Published: 3 January 2023
(This article belongs to the Special Issue Recent Trends in Lactobacillus and Fermented Food)

Abstract

:
Artisanal cheese, produced with raw milk by a predominantly manual approach, has a historical and cultural tradition related to the region of origin. Given its economic and cultural importance, the main objective of this study was to investigate and characterize the diversity of lactic acid bacteria (LAB) of artisanal cheeses produced and traded by family agro-industries in a region of southern Brazil. The LAB composition of artisanal cheese samples, belonging to different municipalities of the Region of Vale do Taquari, were characterized by the next-generation sequencing (NGS) method, amplifying the V3/V4 region of the 16S rRNA gene. A total of 35 LAB species, distributed in seven genera, were identified, and rarefaction analysis suggested that the total diversity assessed by 16S rRNA analysis was high in the analyzed samples. The average Ph ranged from 4.6 to 6.6, and a correlation with the genus Lactococcus (r = 0.62) was the most expressive. The LAB genera identified in the cheese samples were Bavariicococcus, Enterococcus, Lactobacillus, Lactococcus, Leuconostoc, Marinillactibacillus, and Pediococcus. Lactococcus lactis was the most predominant species, present in all samples. Although some species have been identified in the three altitudes studied, the abundance varied according to geographic environments. Enterococcus italicus is more present at high altitudes, unlike Lactococcus plantarum and Lactococcus raffinolactis at low altitudes. Lactococcus lactis was present in the three geographic environments evaluated, but the highest abundance was observed at high altitudes. The identification of LAB present in fermented cheeses is essential to understand the organoleptic quality during the maturation process as well as to establish the shelf life, including the safety and the overall quality of the cheese. This specific microbiota contributes to the flavor and unique characteristics of the regional dairy products, and on the other hand can be a source of specific starter cultures that guarantee the product’s identity.

1. Introduction

Historical, socioeconomic, and cultural aspects of artisanal fermented foods have received increasing prominence related to the health benefits provided. Among them are traditional cheeses, which have an epiphytic flora that improves product quality in terms of flavor, texture, and safety [1,2]. Although Brazilian cheese production is based on practices brought by European colonizers and immigrants, factors such as climate, diet, animals breed, and the raw milk quality have resulted in differentiated products that are part of the heritage and identity of different regions of the country [3,4]. Among them, the artisanal cheeses produced in southeastern (Araxá, Campo das Vertentes, Cerrado, Canastra, and Serro), southern (Colonial and Serrano), central (Caipira), northern (Marajó), and northeastern (Manteiga and Coalho) regions of Brazil stand out [5]. The guidelines regarding the preparation and marketing of food products of animal origin produced in an artisanal way were recently regulated in Decree No. 11,099, on 21 June 2022 [6]. Those that fit the regulations and are elaborated by traditional methods are authorized to use the unique identification seal “Queijo Artesanal” (artisanal cheese) and the official inspection body seal. In agreement with the current legislation, artisan cheese is “considered to be one made using traditional methods, with territorial, regional or cultural ties and appreciation, according to a specific elaboration protocol established for each type and variety, and with the use of good agricultural and manufacturing practices” [6,7].
According to the literature, cheeses, especially artisanal cheeses, are potential sources of LABs and can be used to develop starter cultures. Therefore, it is important and necessary to deepen studies in the characterization of the biodiversity of these dairy products [2,8]. This knowledge can provide greater product safety, support the development of regulations, and maintain historical and cultural recognition. Nevertheless, most of these studies focus on the internal microbiota of the cheese, disregarding the surface flora present on the rind that may harbor halotolerant and halophilic bacteria and yeasts, which are fundamental to cheese ecology and technology [2,9,10].
In agreement with De Antônio and Borelli [11], the presence of LABs in artisanal minas cheese is important not only in the fermentation process and transformation of milk into cheese, but they are also essential for the development of the organoleptic characteristics of the product, such as aroma, texture, and flavor. They also point out that these bacteria act significantly as natural preservatives by producing antimicrobial substances with antagonistic action against pathogens during the maturation process, in addition to the microbiological quality and safety improvement of the product.
There are still many unanswered questions about Brazilian artisanal cheeses. They require a more detailed investigation of the composition at species and even strain level, the specific microbiota of the rind surface [2], as well as a better understanding of the predominance of the microbiota in different environments, especially altitudes. Given the above, several studies have been conducted using next-generation sequencing (NGS) to characterize the structure of the microbiota in cheeses [12,13,14,15]. This tool has shown promise, allowing researchers to investigate the endogenous microbiota of the raw material or those acquired exogenously from contaminated processing environments [14,16]. In general, cheese has a diverse microbiota, with Lactococcus, Streptococcus, Lactobacillus, and Enterococcus being the most abundant genera [16]. Together with the other genera of the LAB group such as Carnobacterium, Aerococcus, Pediococcus, Tetragenococcus, Leuconostoc, Oenococcus, Weisella, and Vagococcus, all of them play an important role in imprinting final organoleptic properties and in the overall quality of the product [15,17].
Five varieties of Brazilian artisanal cheeses (Araxá, Canastra, Serro, Colonial, and Serrano) from southern and southeastern Brazil had their microbiota characterized by Kothe et al. [2] using metagenomics. Lactococcus lactis subsp. lactis was the most frequent, followed by Streptococcus thermophilus in southern Brazil. In addition, several samples from the southeastern region contained LABs as dominant species, with predominance of Streptococcus salivarius and S. infantarius and the halotolerant bacterium Corynebacterium variabile in the rinds. In another study using NGS [18], in artisanal Minas cheese with 60 days of maturation, Sant’Anna et al. reported the presence of the Planococcaceae family and observed interactions with the Leuconostocaceae family on the surface. In addition, the authors consider that abiotic factors such as geographic location, humidity, and acidity are the main drivers of microbial change. The geographical influence, such as altitude, was also reported by Resende et al. [19] in minas frescal cheeses, produced in plants located at altitudes above 600 m. The highest LAB populations were present in the cheese samples produced at altitudes between 600 and 900 m.
In this context, the objective of this study was to investigate and characterize the diversity of LAB in artisanal cheeses produced and commercialized by family agribusinesses in a region in southern Brazil. The study was carried out using the NGS technique in 13 artisanal cheeses from different municipalities that make up the Vale do Taquari (Rio Grande do Sul State).

2. Materials and Methods

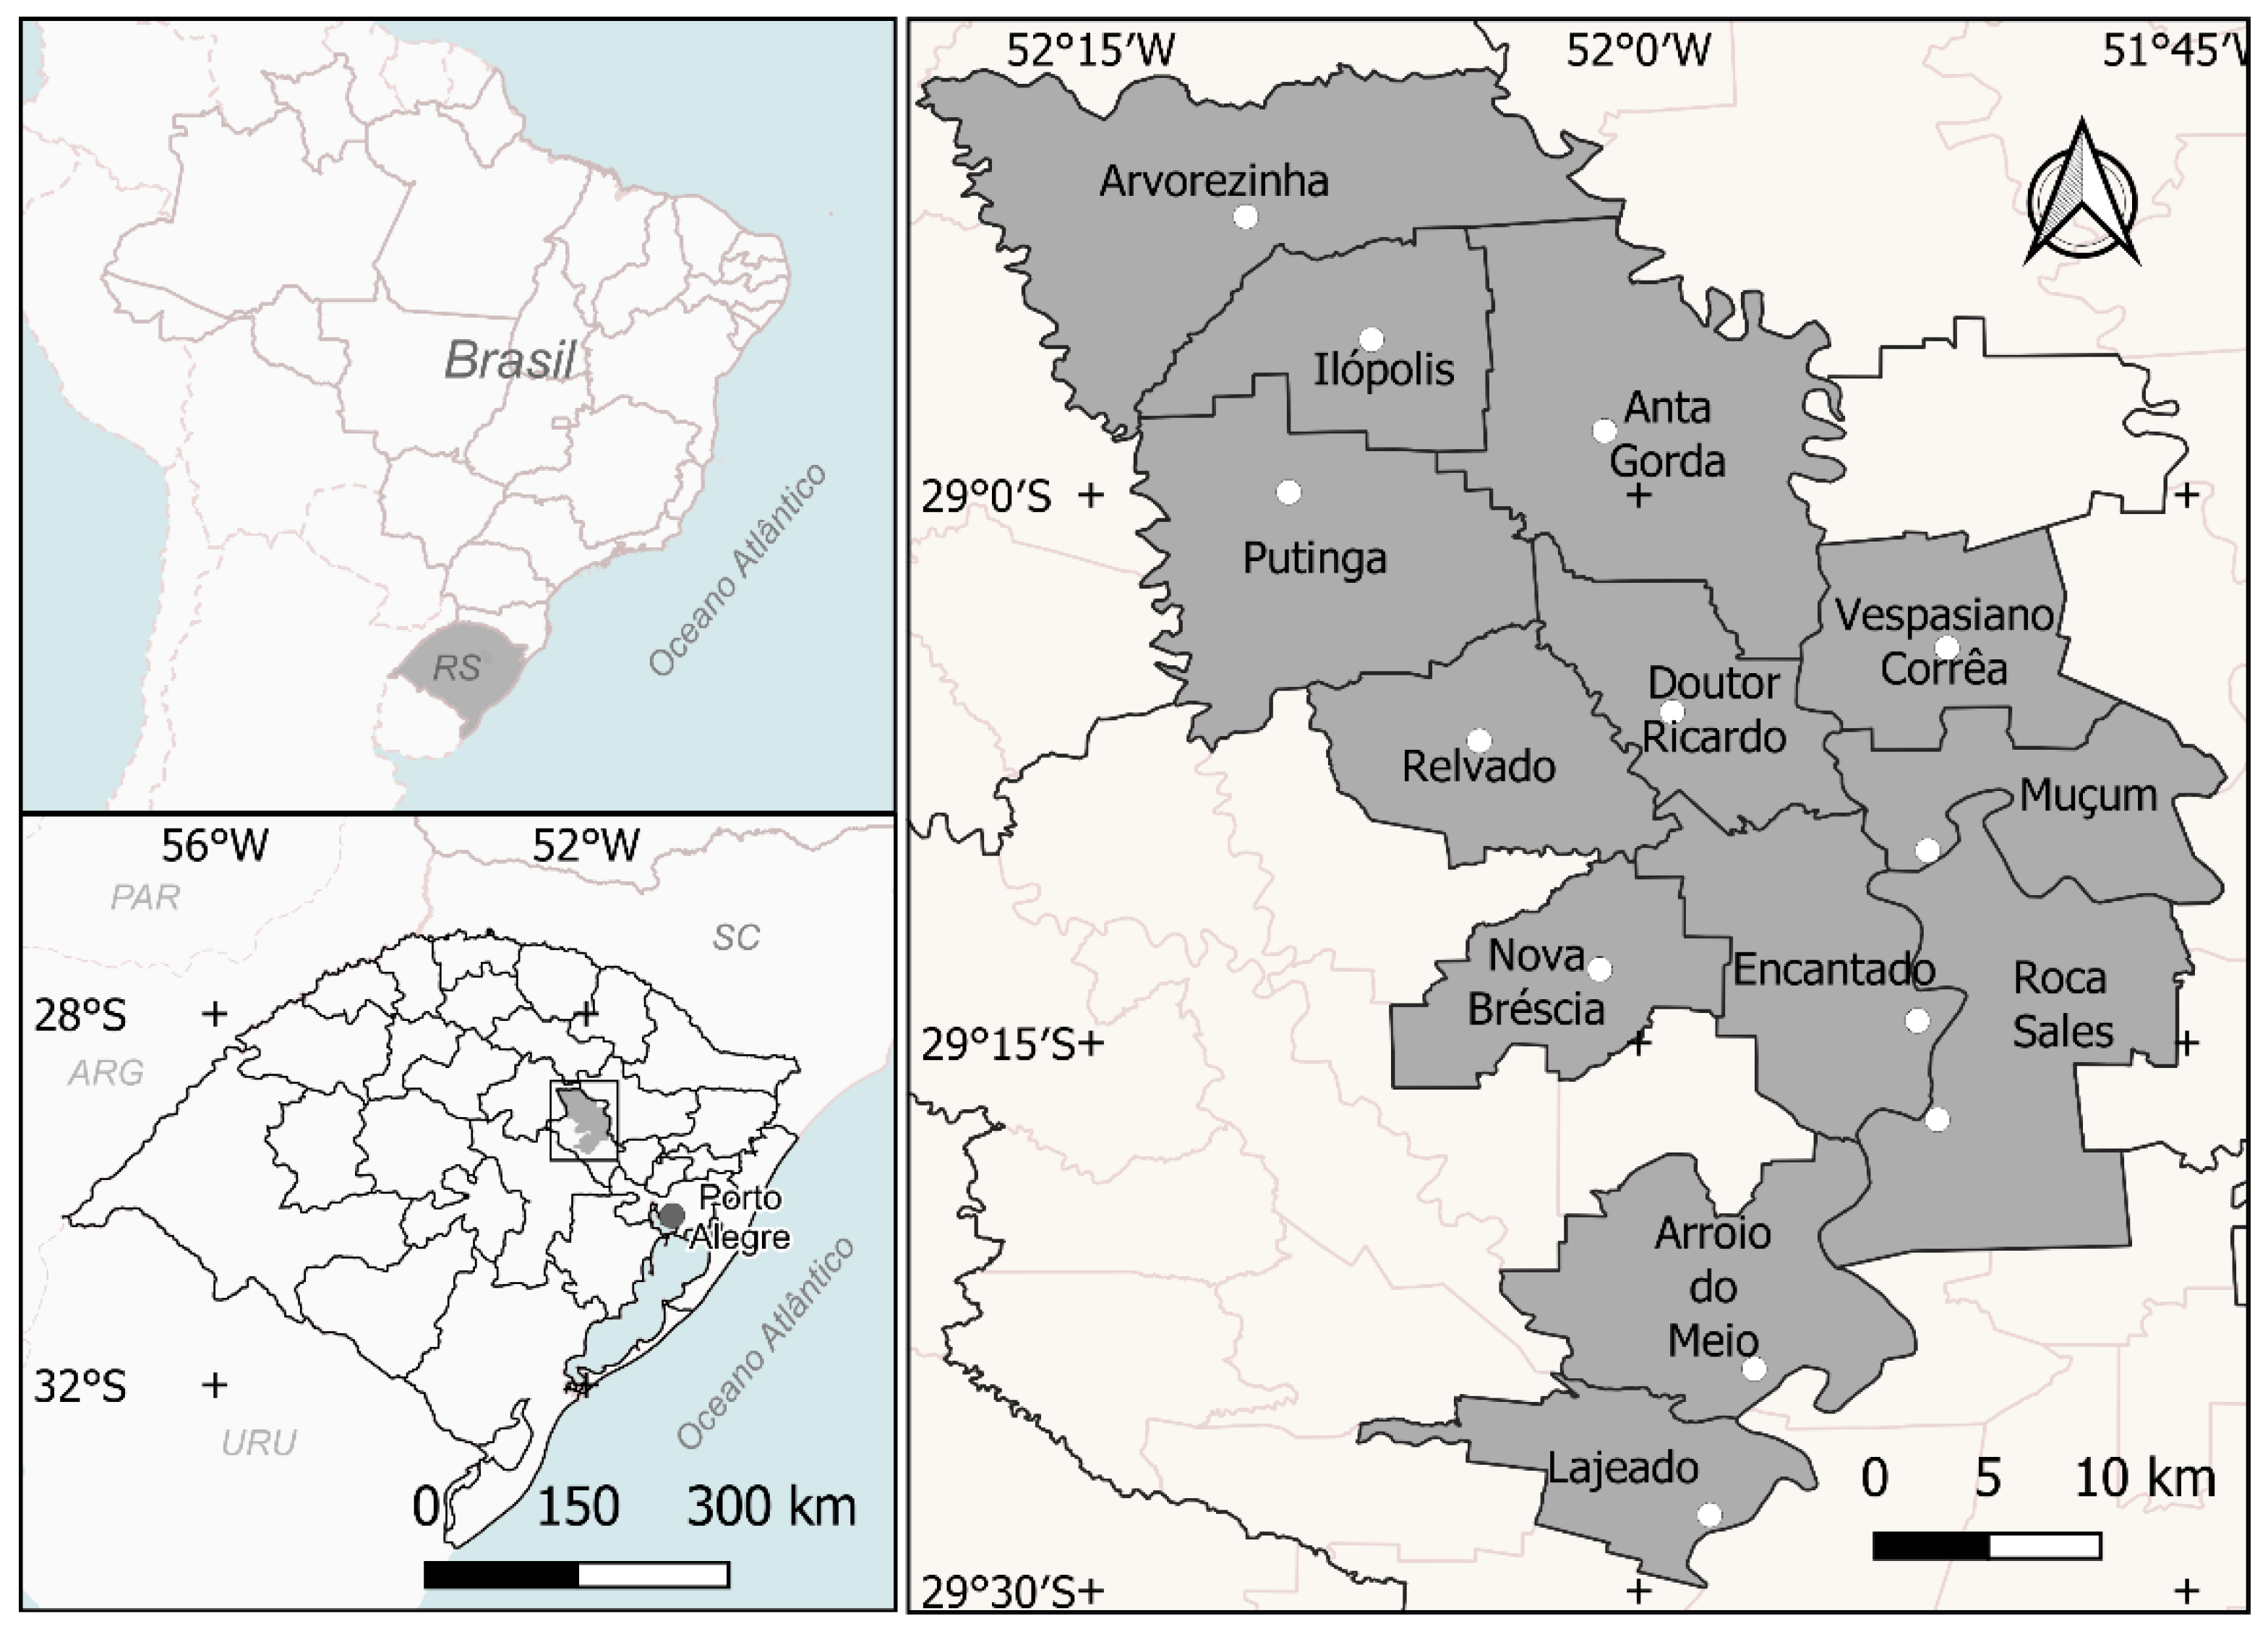
2.1. Characterization of the Region

Located in the central region of Rio Grande do Sul (a state in southern Brazil), the Vale do Taquari Region (RVT) is formed by 36 municipalities, totaling 4821.1 km2 (1.71% of the state). Agriculture and cattle raising have an important role in the economy of the RVT, especially poultry, pigs, beef, and dairy cattle. This production takes place mostly on small farms; therefore, the production of artisanal cheese with raw milk stands out in the region. The municipalities where the samples were collected have strong influences of German (Lajeado, Arroio do Meio, and Roca Sales) and Italian (Encantado Muçum, Nova Bréscia, Relvado, Anta Gorda, Arvorezinha, Doutor Ricardo, Ilópolis, Putinga, and Vespasiano Correa) colonization.

2.2. Sample Collection

Thirteen samples of artisanal cheeses soft and high moisture produced with raw milk using commercial starter cultures and matured between seven and ten days were purchased directly from producers and local markets in different municipalities of the RVT (Figure 1). The samples were grouped according to the altitude of the municipalities into low (<150 m), medium (>150 and <350 m), and high (>350 m), based on the average altitude of the state of Rio Grande do Sul (206 m) [20].
The samples were packed in an isothermal box and kept under refrigeration until arrival at the food analysis laboratory of the State University of Rio Grande do Sul (UERGS). Afterward, the samples were aseptically portioned and sent for pH (Datalogger-Digital Instruments model) and metagenomic analysis. Aliquots of 200 g of cheese were sent under refrigeration for metagenomic analysis in an accredited service provider laboratory (Santa Catarina, Brazil).

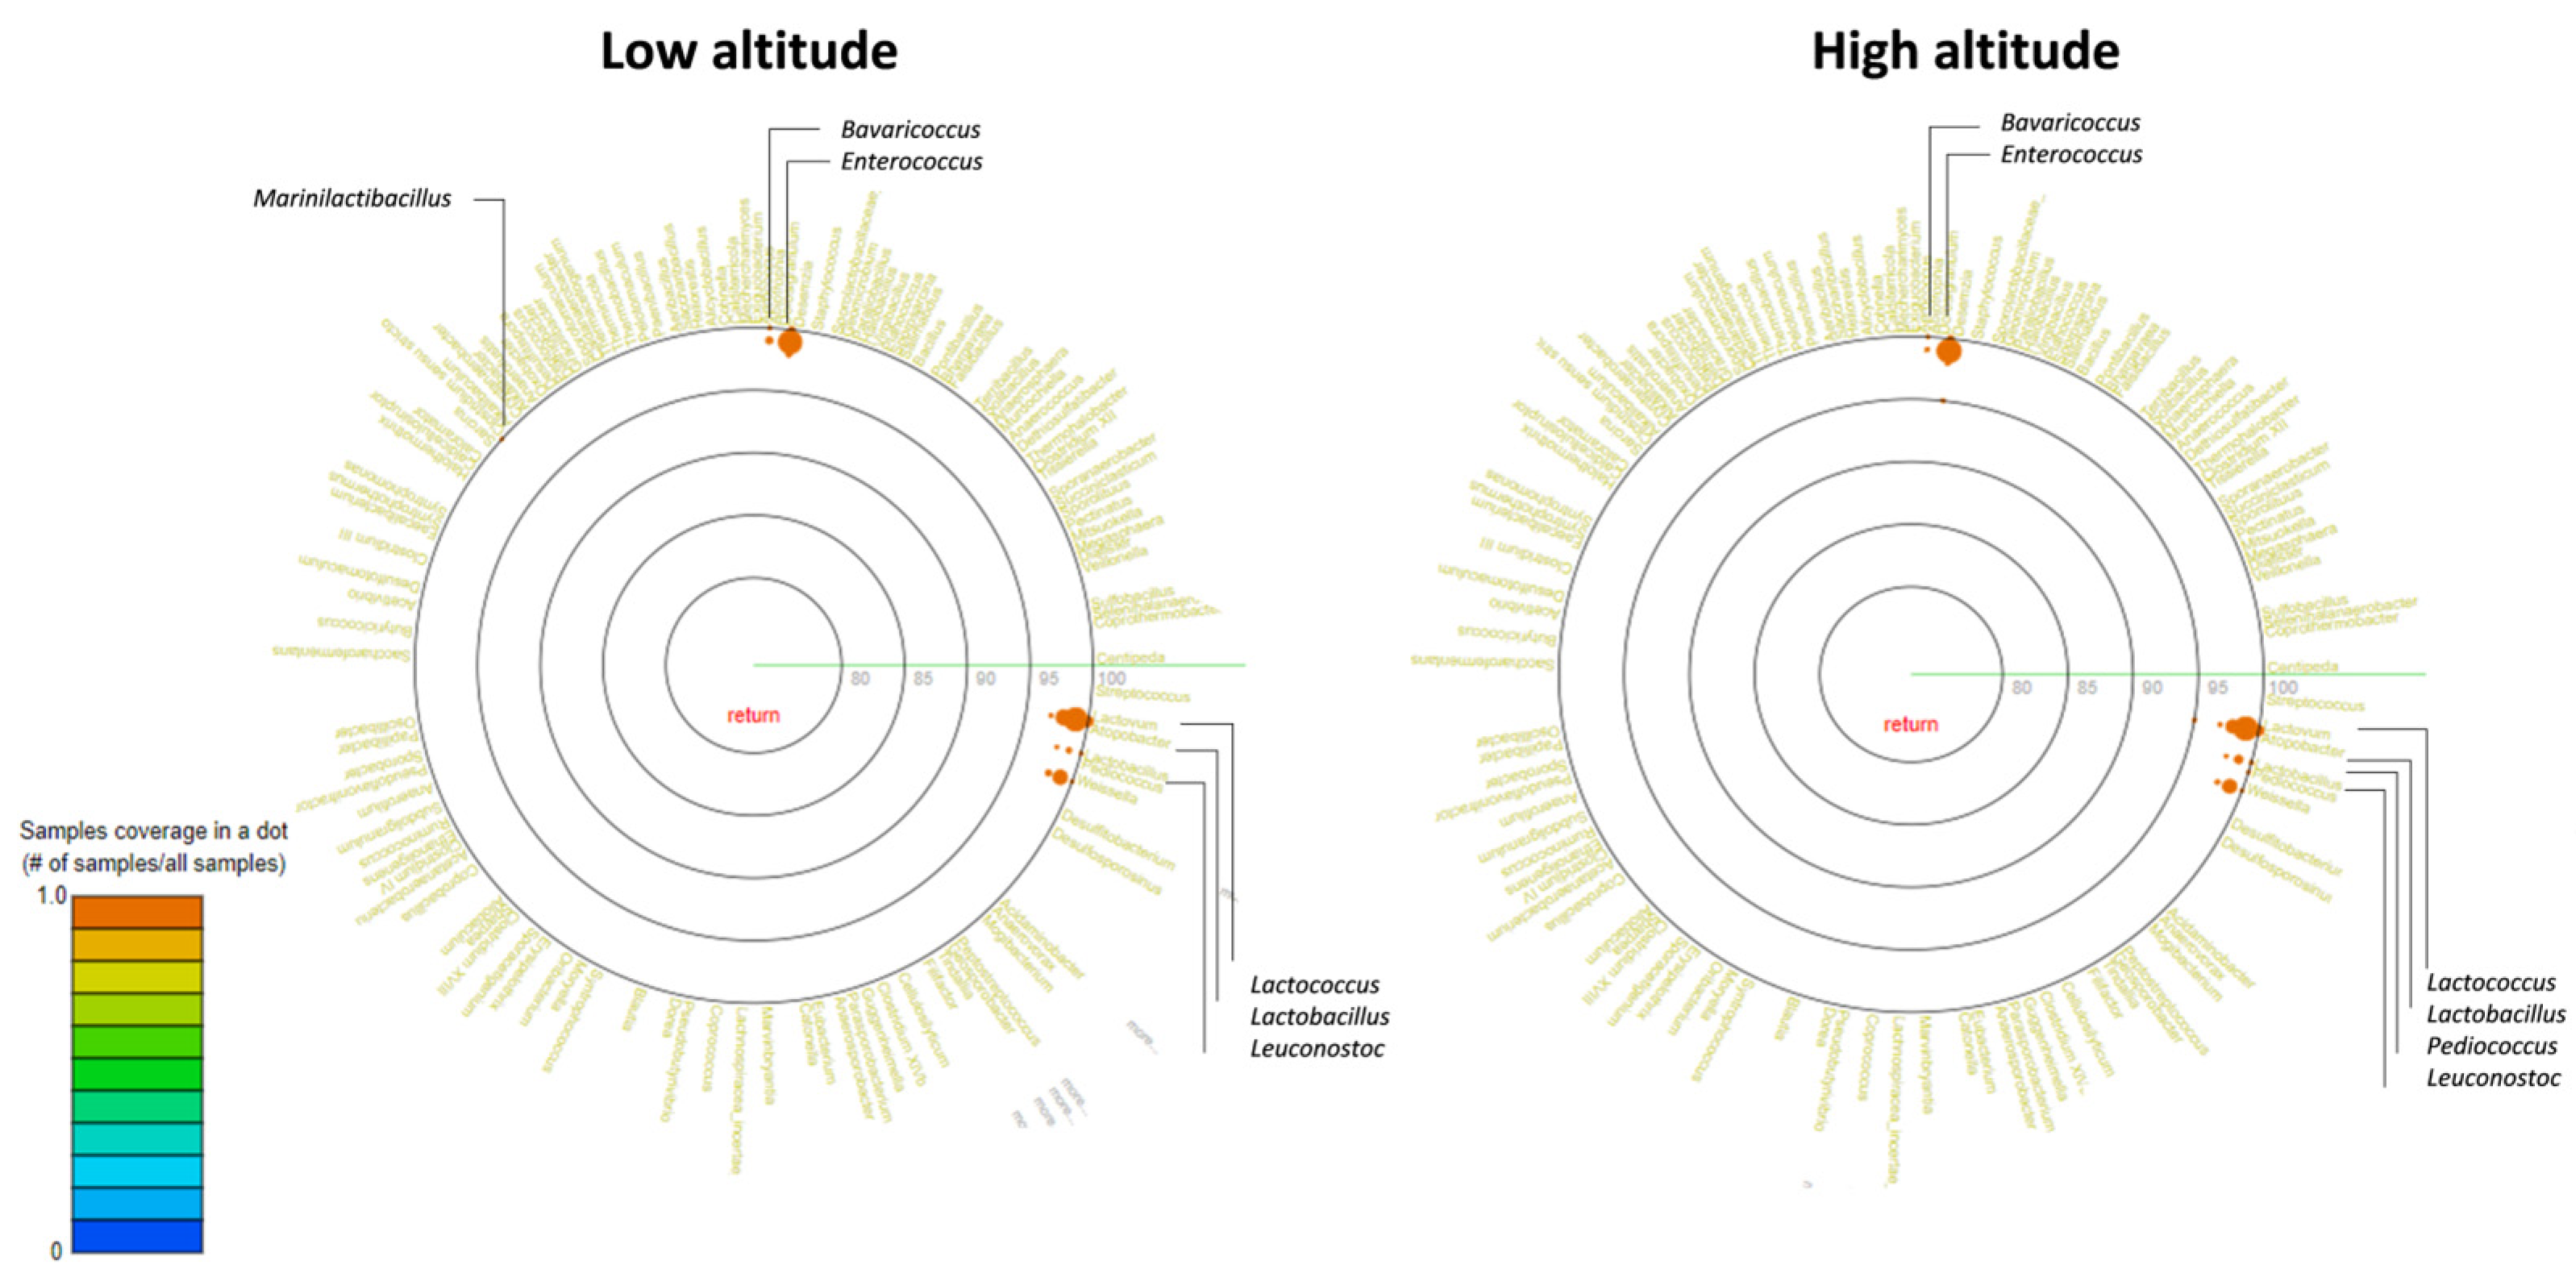
2.3. Metagenomic Analysis

Bacterial population profiling and bacterial identification were performed using NGS. The preparation of the libraries followed the protocol developed by the third-party laboratory, described below, where amplification was performed with primers for the V3–V4 region of the 16S rRNA gene, 341F with sequence (CCTACGGGRSGCAGCAG), and 806R with sequence (GGACTACHVGGGTWTCTAAT) [21,22]. Afterward, the libraries were sequenced using MiSeq Sequencing System equipment (Illumina Inc., San Diego, CA, USA), and the sequences were analyzed using the Sentinel pipeline (information provided by the laboratory).
In the Sentinel pipeline, fastq files are evaluated for Phred quality (QP) (FastQC v.0.11.8). Next, the fastq files are trimmed for primers and sequences with low quality (Phred < 20) using proprietary software built in Python v.3.6. For paired-end data, before the trimming step, two pairs of files (R1 and R2) are merged (Pandaseq v.2.11). Clusters with abundance less than 5 are removed from the analyses. The taxonomic identifications are carried out with blastn v.2.6.0+, using a database of the Sentinel pipeline as a reference. As for the definition of a species, among the 20 hits returned for each cluster, a Python instruction evaluates whether one of the following three requirements are met: (a) highest bit score, (b) lower e-value, and (c) taxonomies with greater representation. Species are defined using 99% identity. Bacterial DMD analyzes were performed against reference databases for the Sentinel pipeline’s own 16S rRNA genes. The 16S rRNA gene sequence bank itself has complete gene sequences (mostly), which contain sequences retrieved from genomes, unambiguous and filtered for chimera sequences.
The rarefaction curve was checked for the representation of species richness for a given number of individual samples using the Silvangs tool (version 1.9.8/1.4.9), which clustered all 16S rRNA sequences and, based on the database from SILVA data, was able to generate the graph of the rarefaction curve [23].

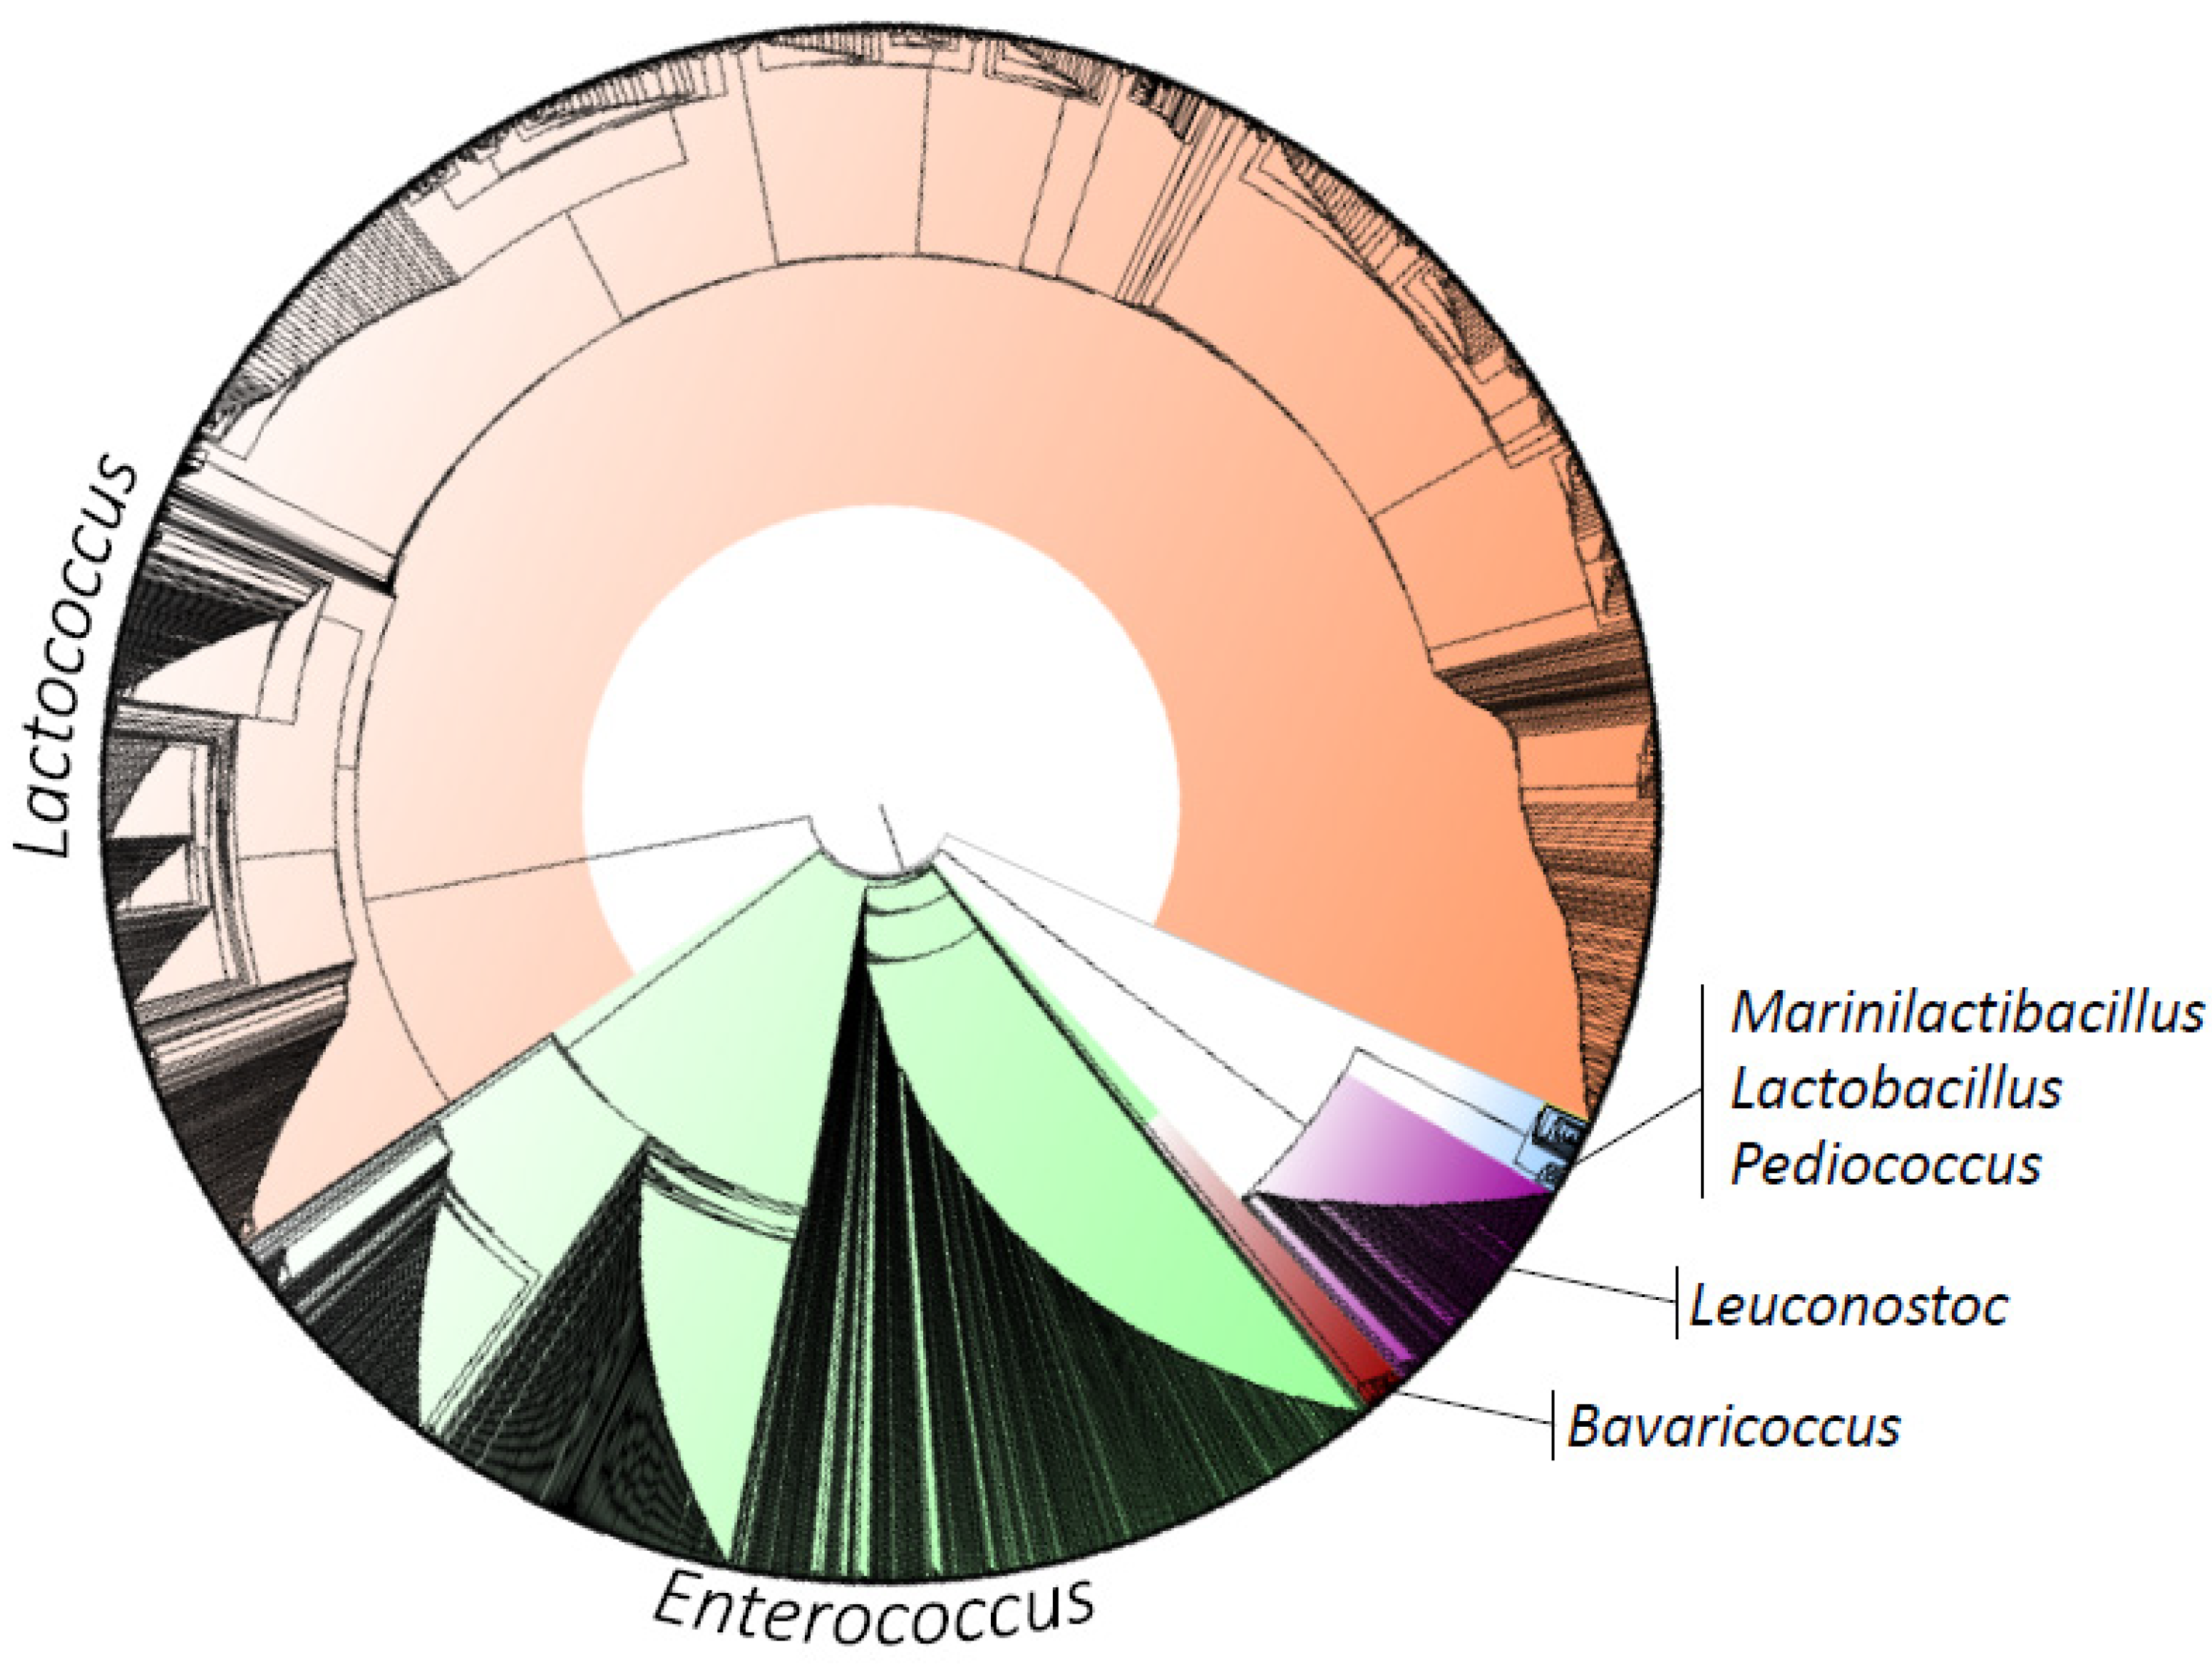
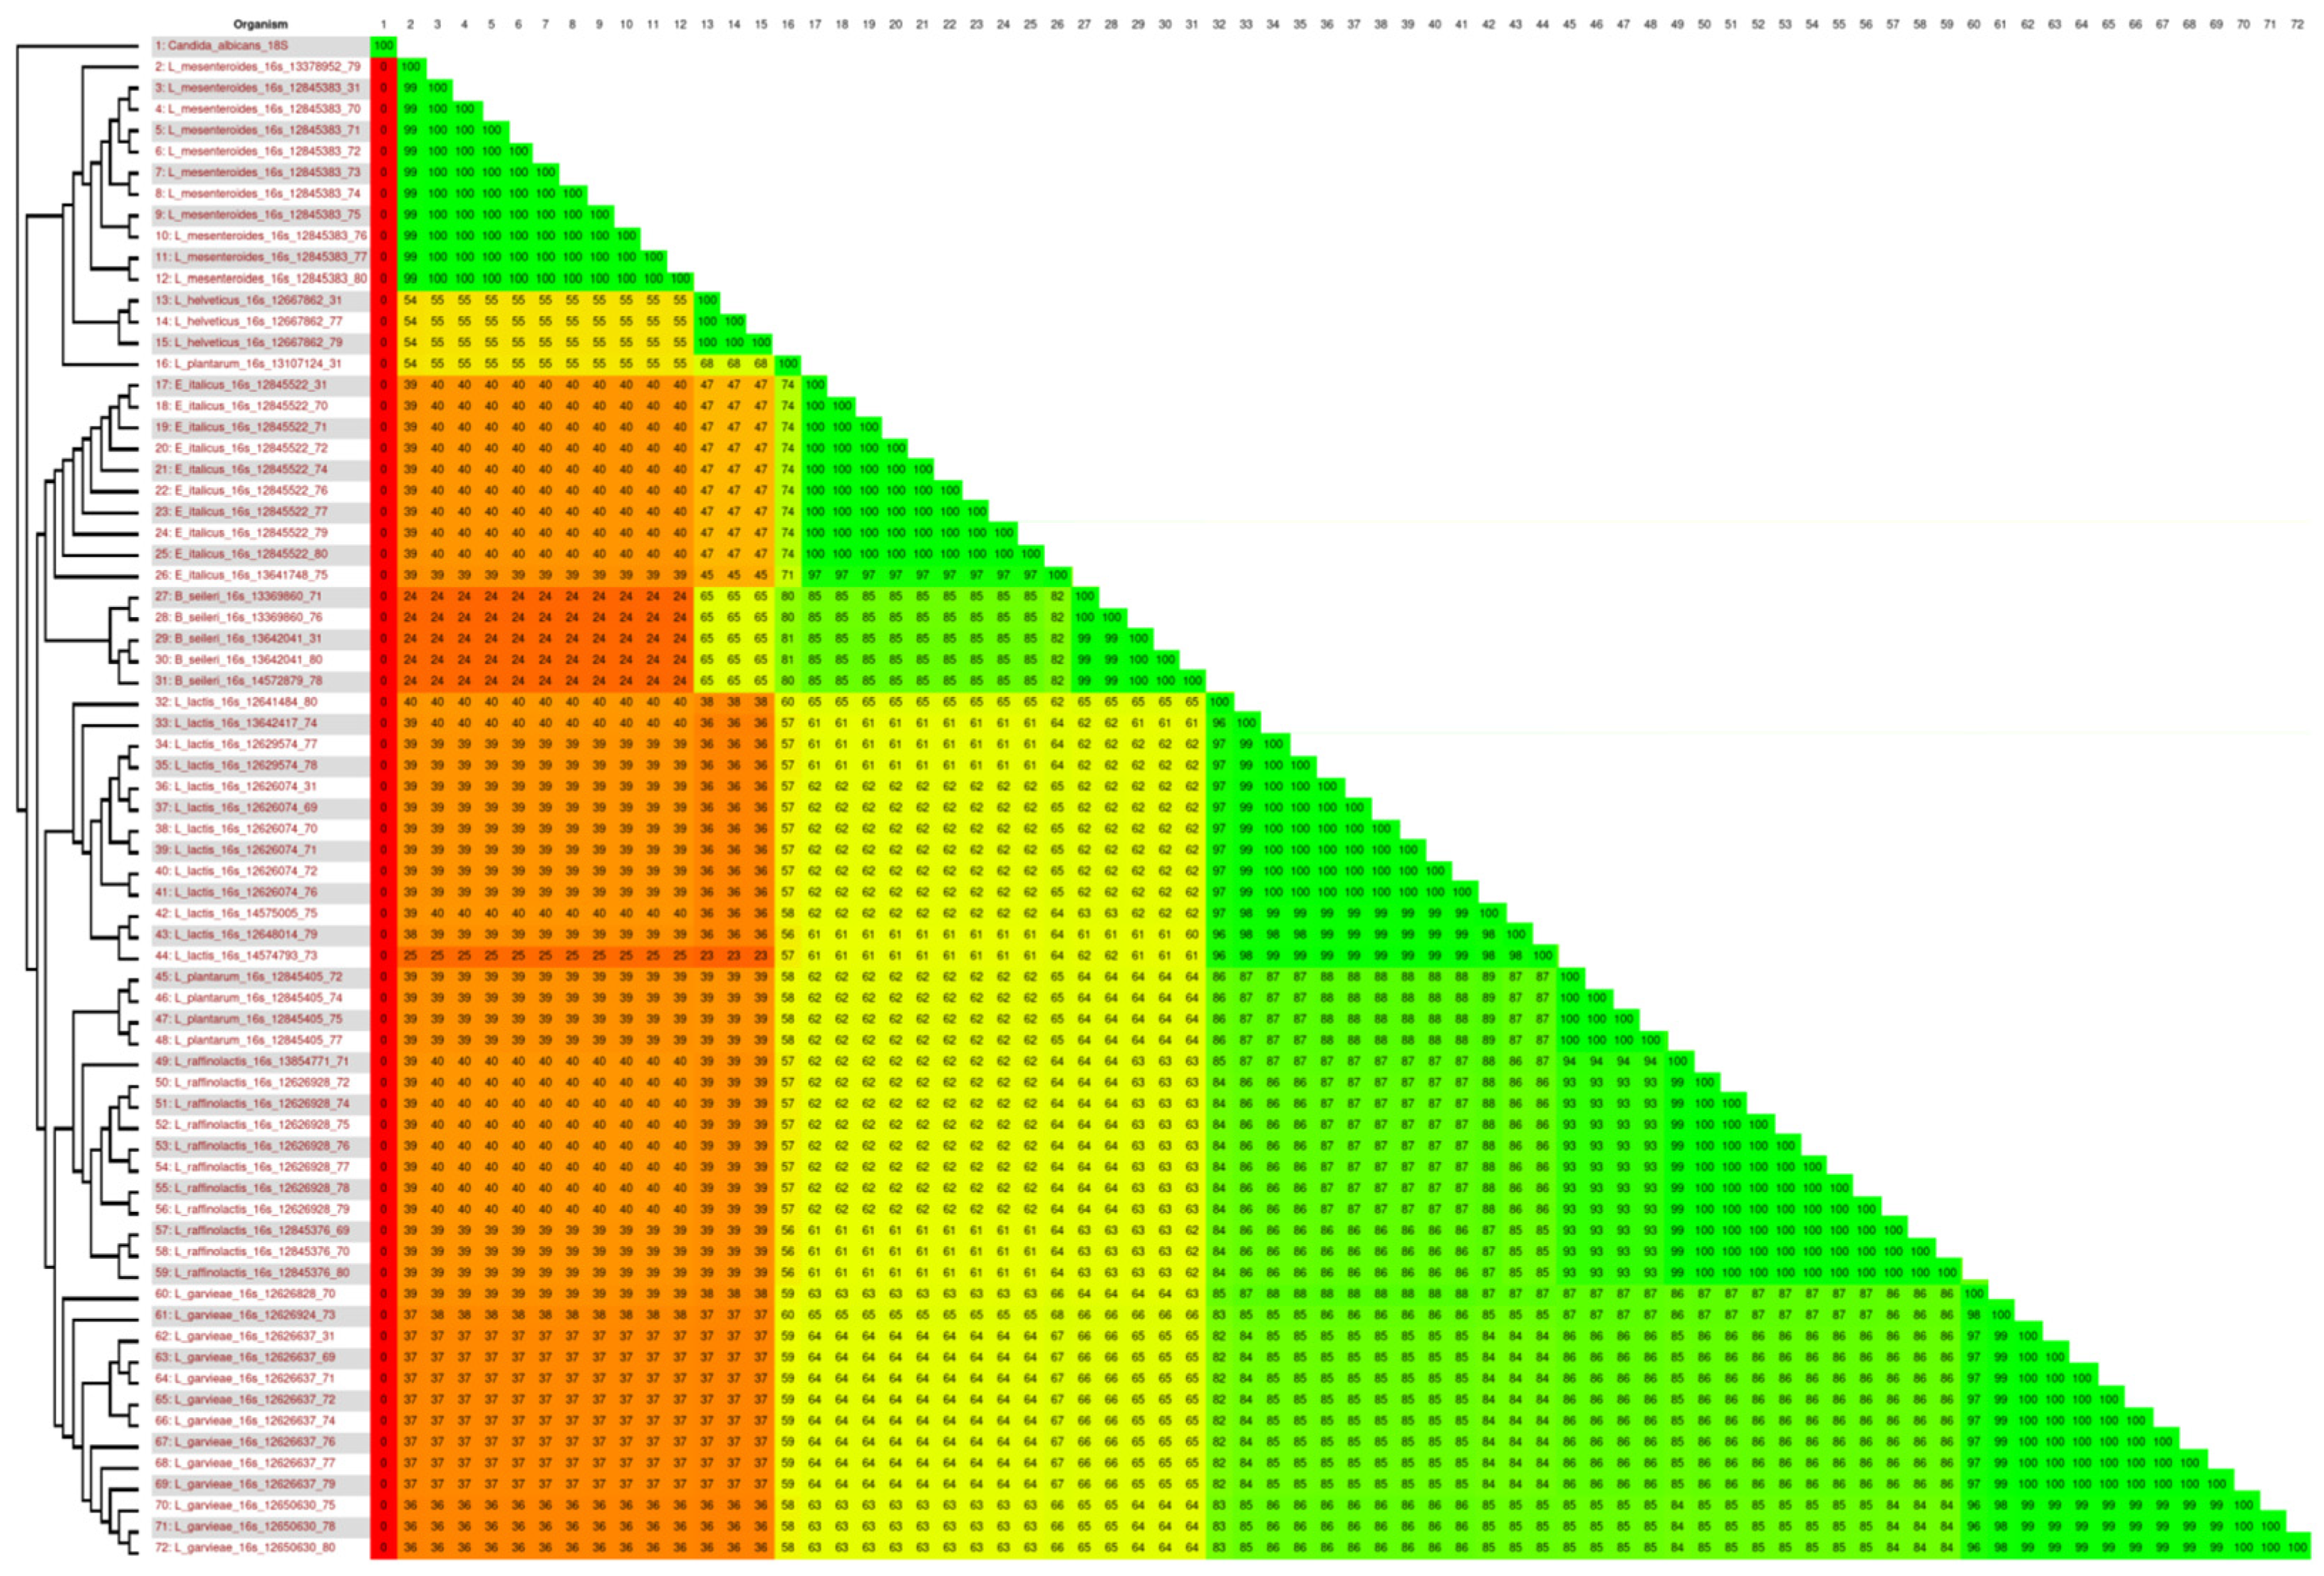
2.4. Phylogenetic Analysis

Multiple alignments with the non-redundant 16S sequences were performed using the Clustal Omega tool [24] that uses seeded guide trees and HMM profile–profile techniques to generate alignments between the sequences. After that, a phylogenetic tree was generated (newick file) based on the neighbor joining method, and we visualized it graphically using the FigTree v1.4.4 tool (http://tree.bio.ed.ac.uk/software/figtree/, accessed on 27 October 2022).
After that, among the representative LAB species, the 16S sequences of the most abundant oligotypes from each of the evaluated samples (Bavariicococcus seileri, Enterococcus italicus, Lactobacillus helveticus, L. plantarum, Lactococcus garvieae, L. lactis, L. plantarum, L. raffinolactis, Leuconostoc mesenteroides) were compared regarding their gene content by Gegenees [25]. This software calculates the percent similarity between the 16S sequences of all strains. The BLASTn alignment method was used with a sequence fragmentation length of 200 base pairs (bp) and size of 100 bp, generating a heat map where green colors represent high similarity and red colors represent low similarity. The heat map from this analysis was exported in nexus format for phylogenomic analysis using SplitsTree software [26], with neighbor joining methods. The heat map was edited together with the tree into one figure for better visual understanding.
Finally, the VITCOMIC2 tool [27] was used for simultaneous representation of the taxonomic composition of microbial communities and phylogenetic relationships between taxa, building a circular diagram from reference sequences. This tool was used to understand the microbial composition and its differences between low altitude (AM, EN, LA, MU, and RC), medium altitude (NB and RV), and high altitude (AG, AV, DR, IL, PT, and VC) samples.

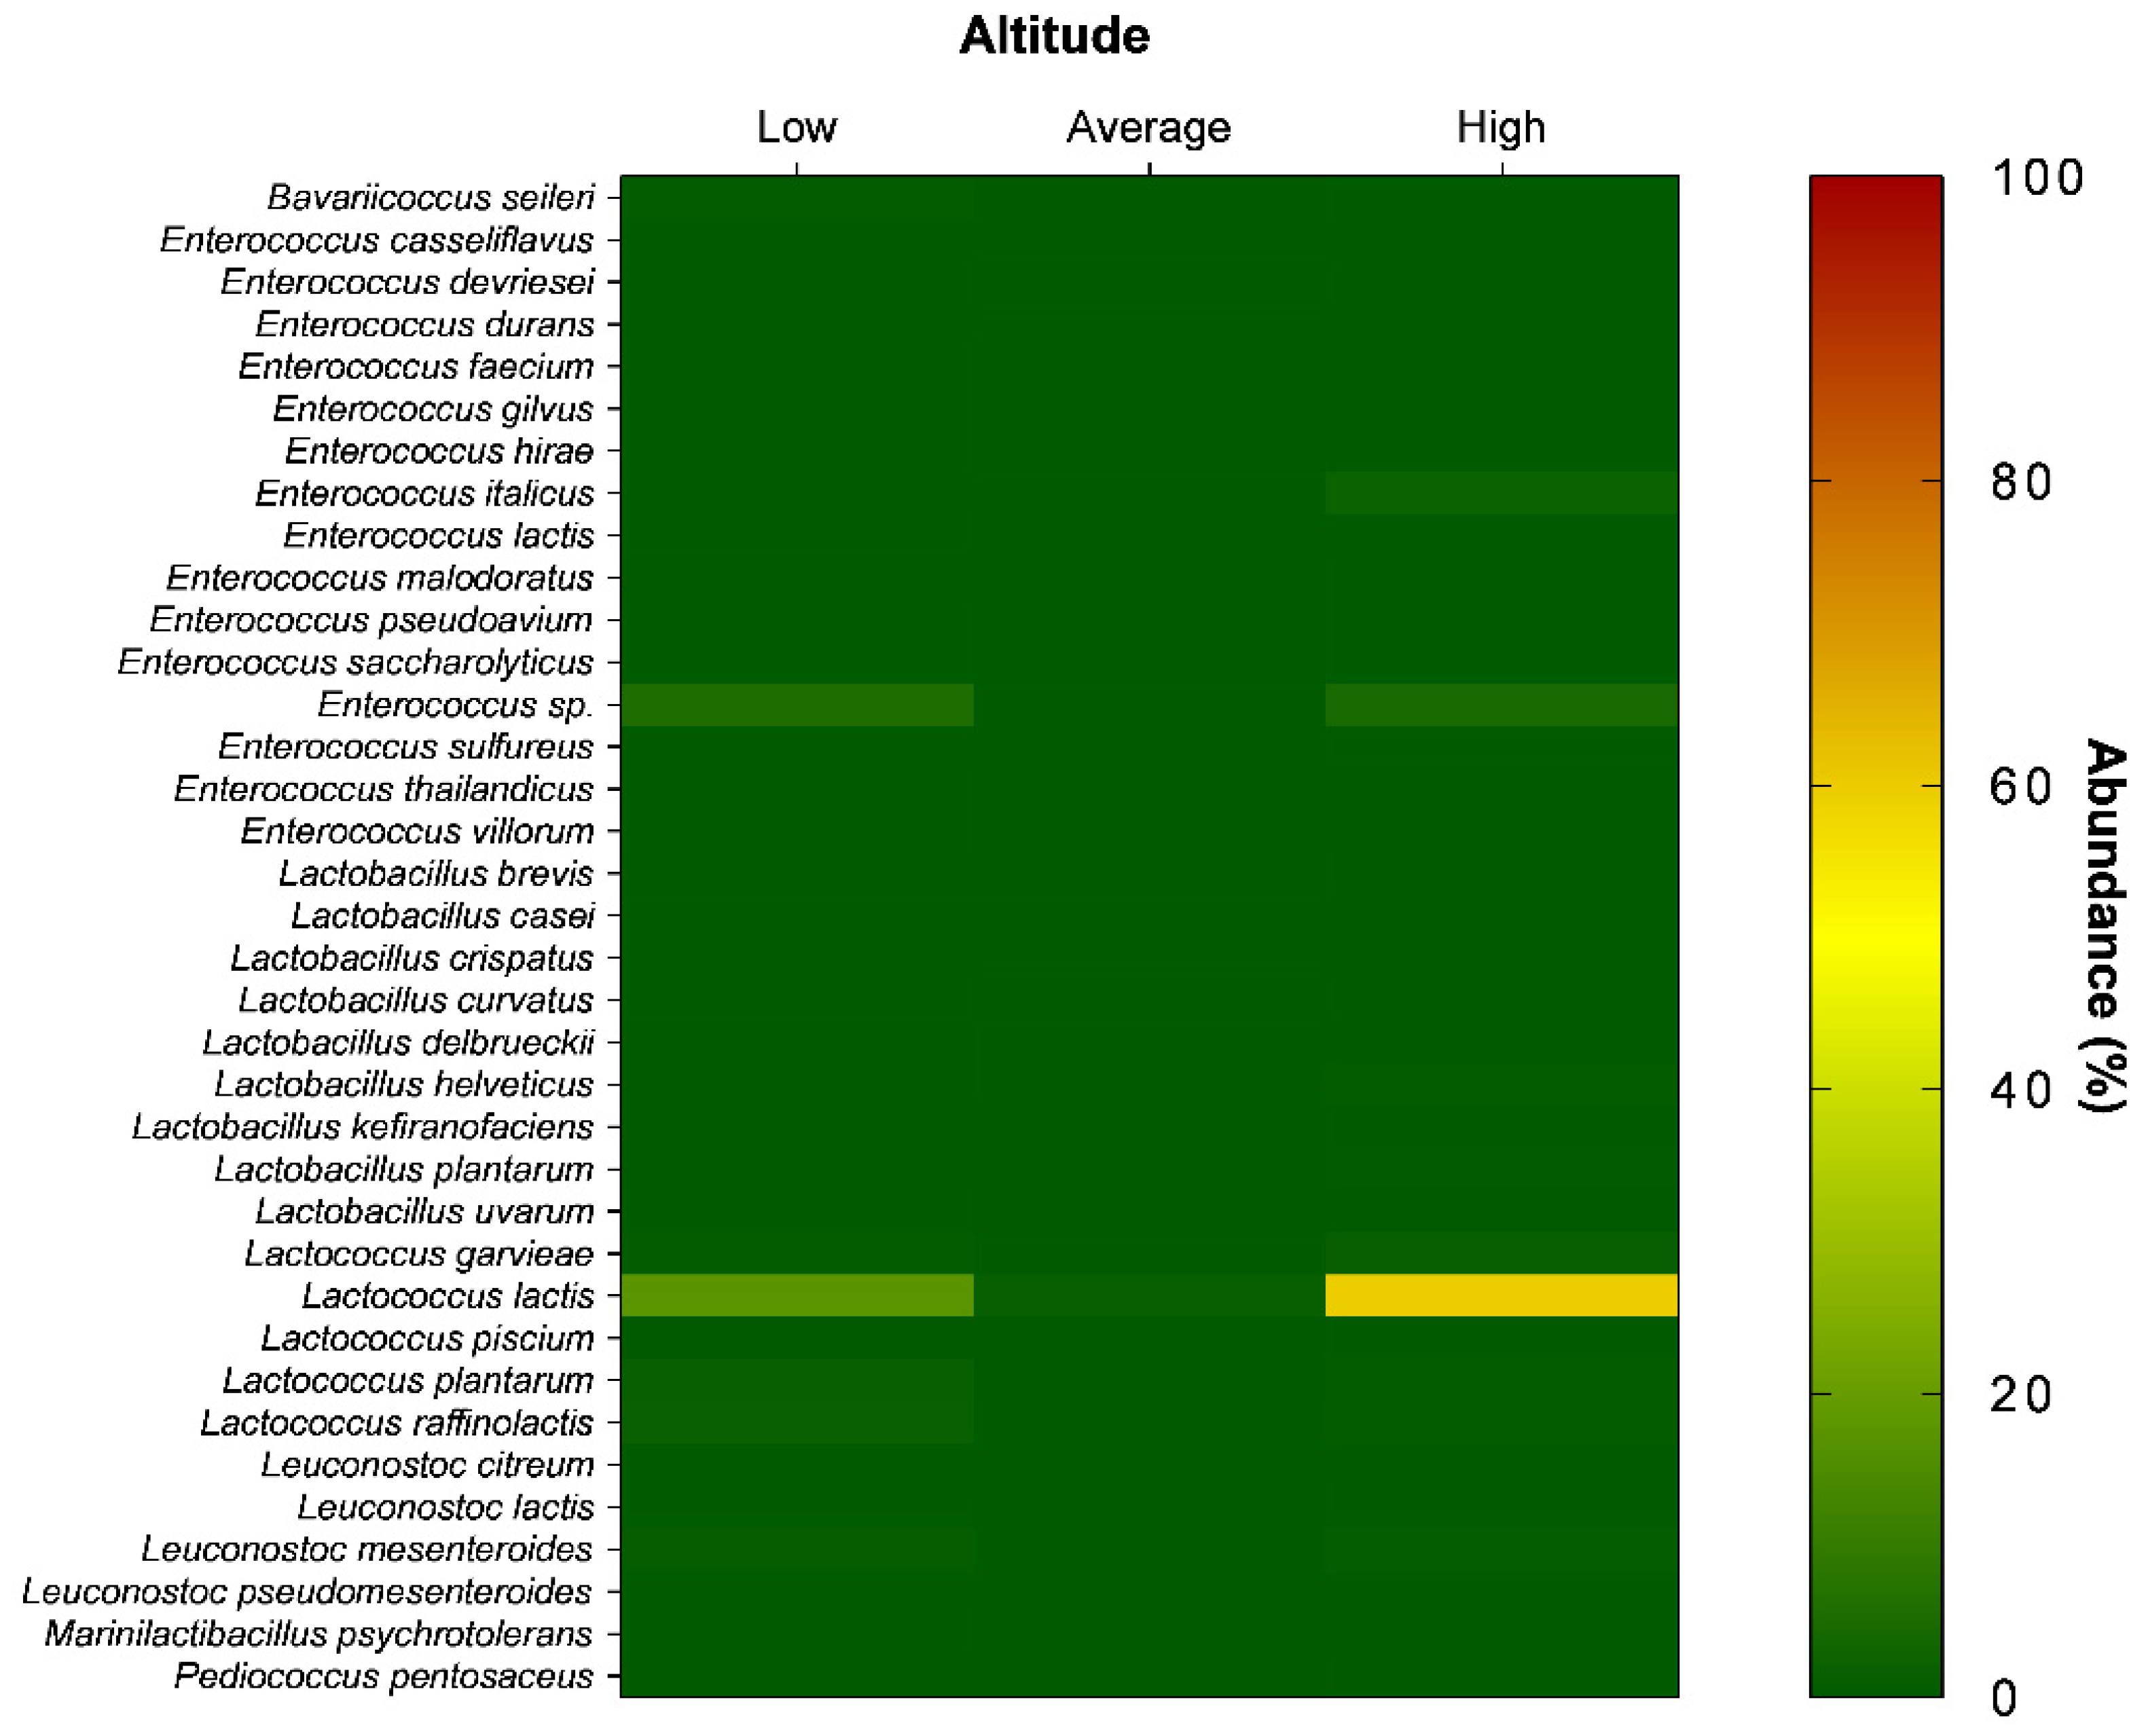
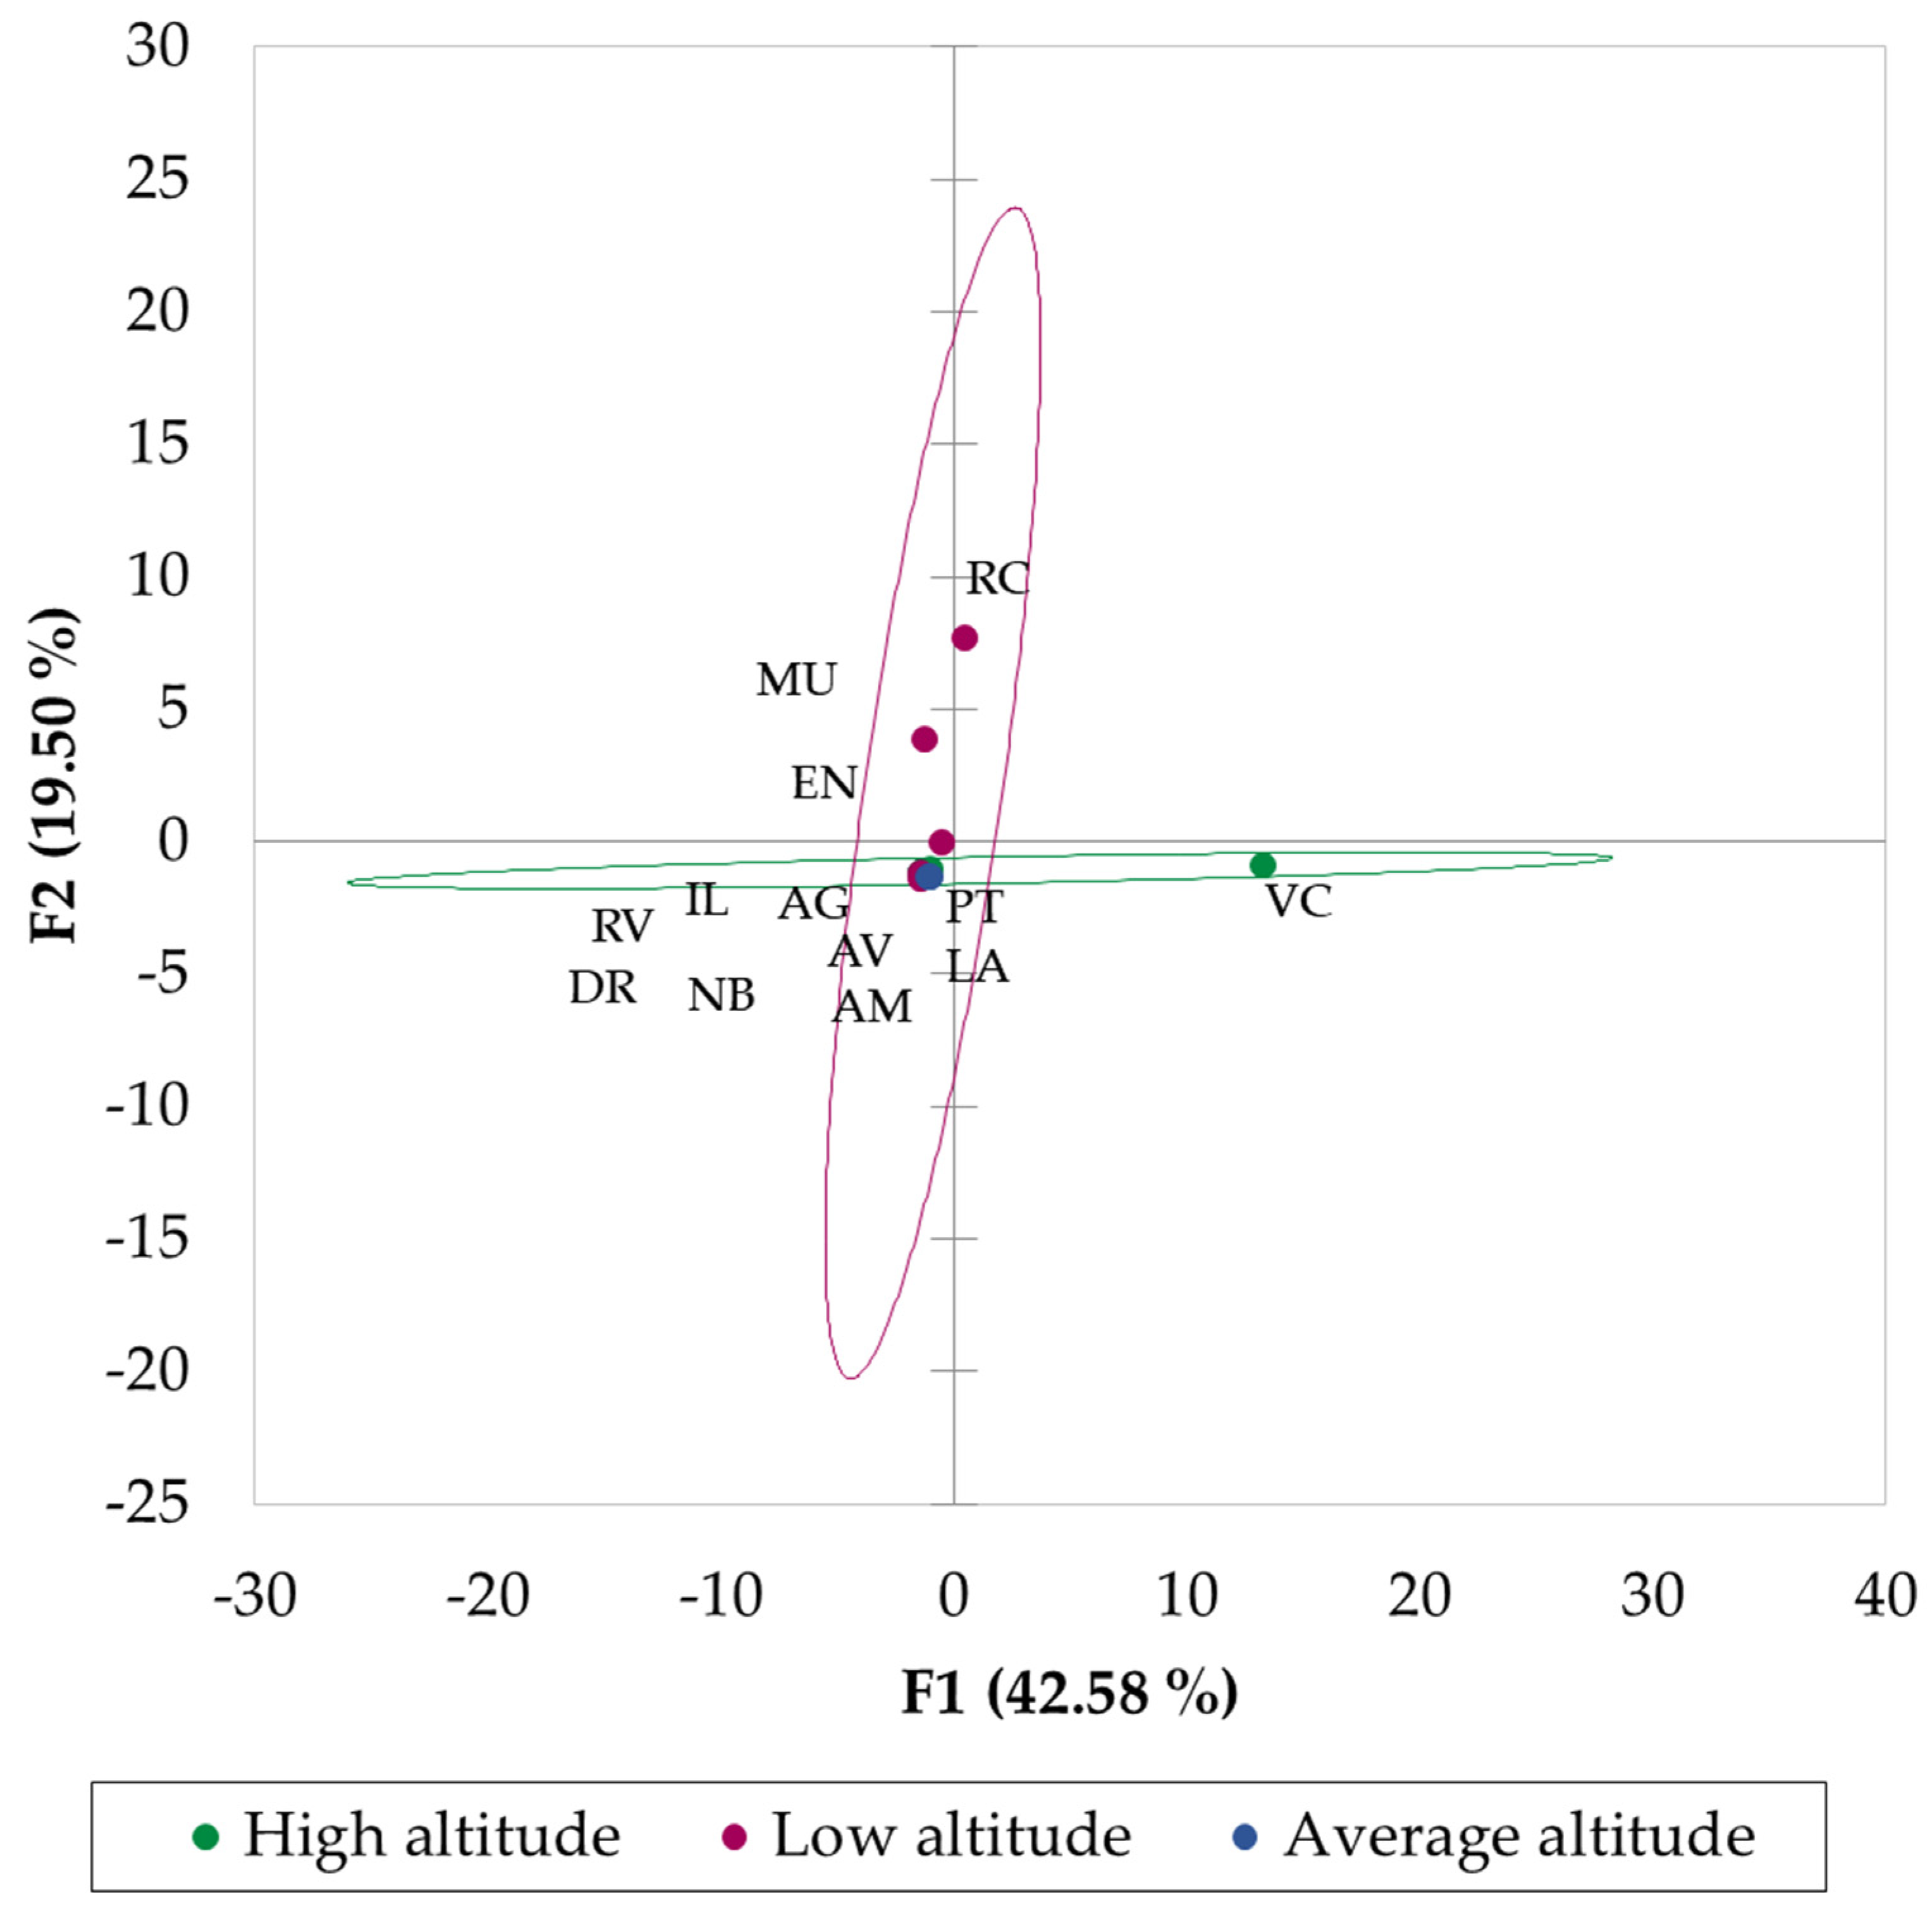
2.5. Statistical Analysis

The Statistica 8 and Excel programs were used to perform the statistical analysis of variance, and the means were compared using the Tukey and ANOVA tests, with a significance level of 95%. In addition, principal component analysis (PCA) was also performed, which is a statistical technique for multivariate analysis. To perform the clustering of the altitudes, agglomerative hierarchical clustering (AHC) analysis was performed considering the Euclidean distance. Spearman’s non-parametric correlation test (95% confidence interval) (version 8.2, GraphPad Software, Inc., La Jolla, CA, USA) was used.

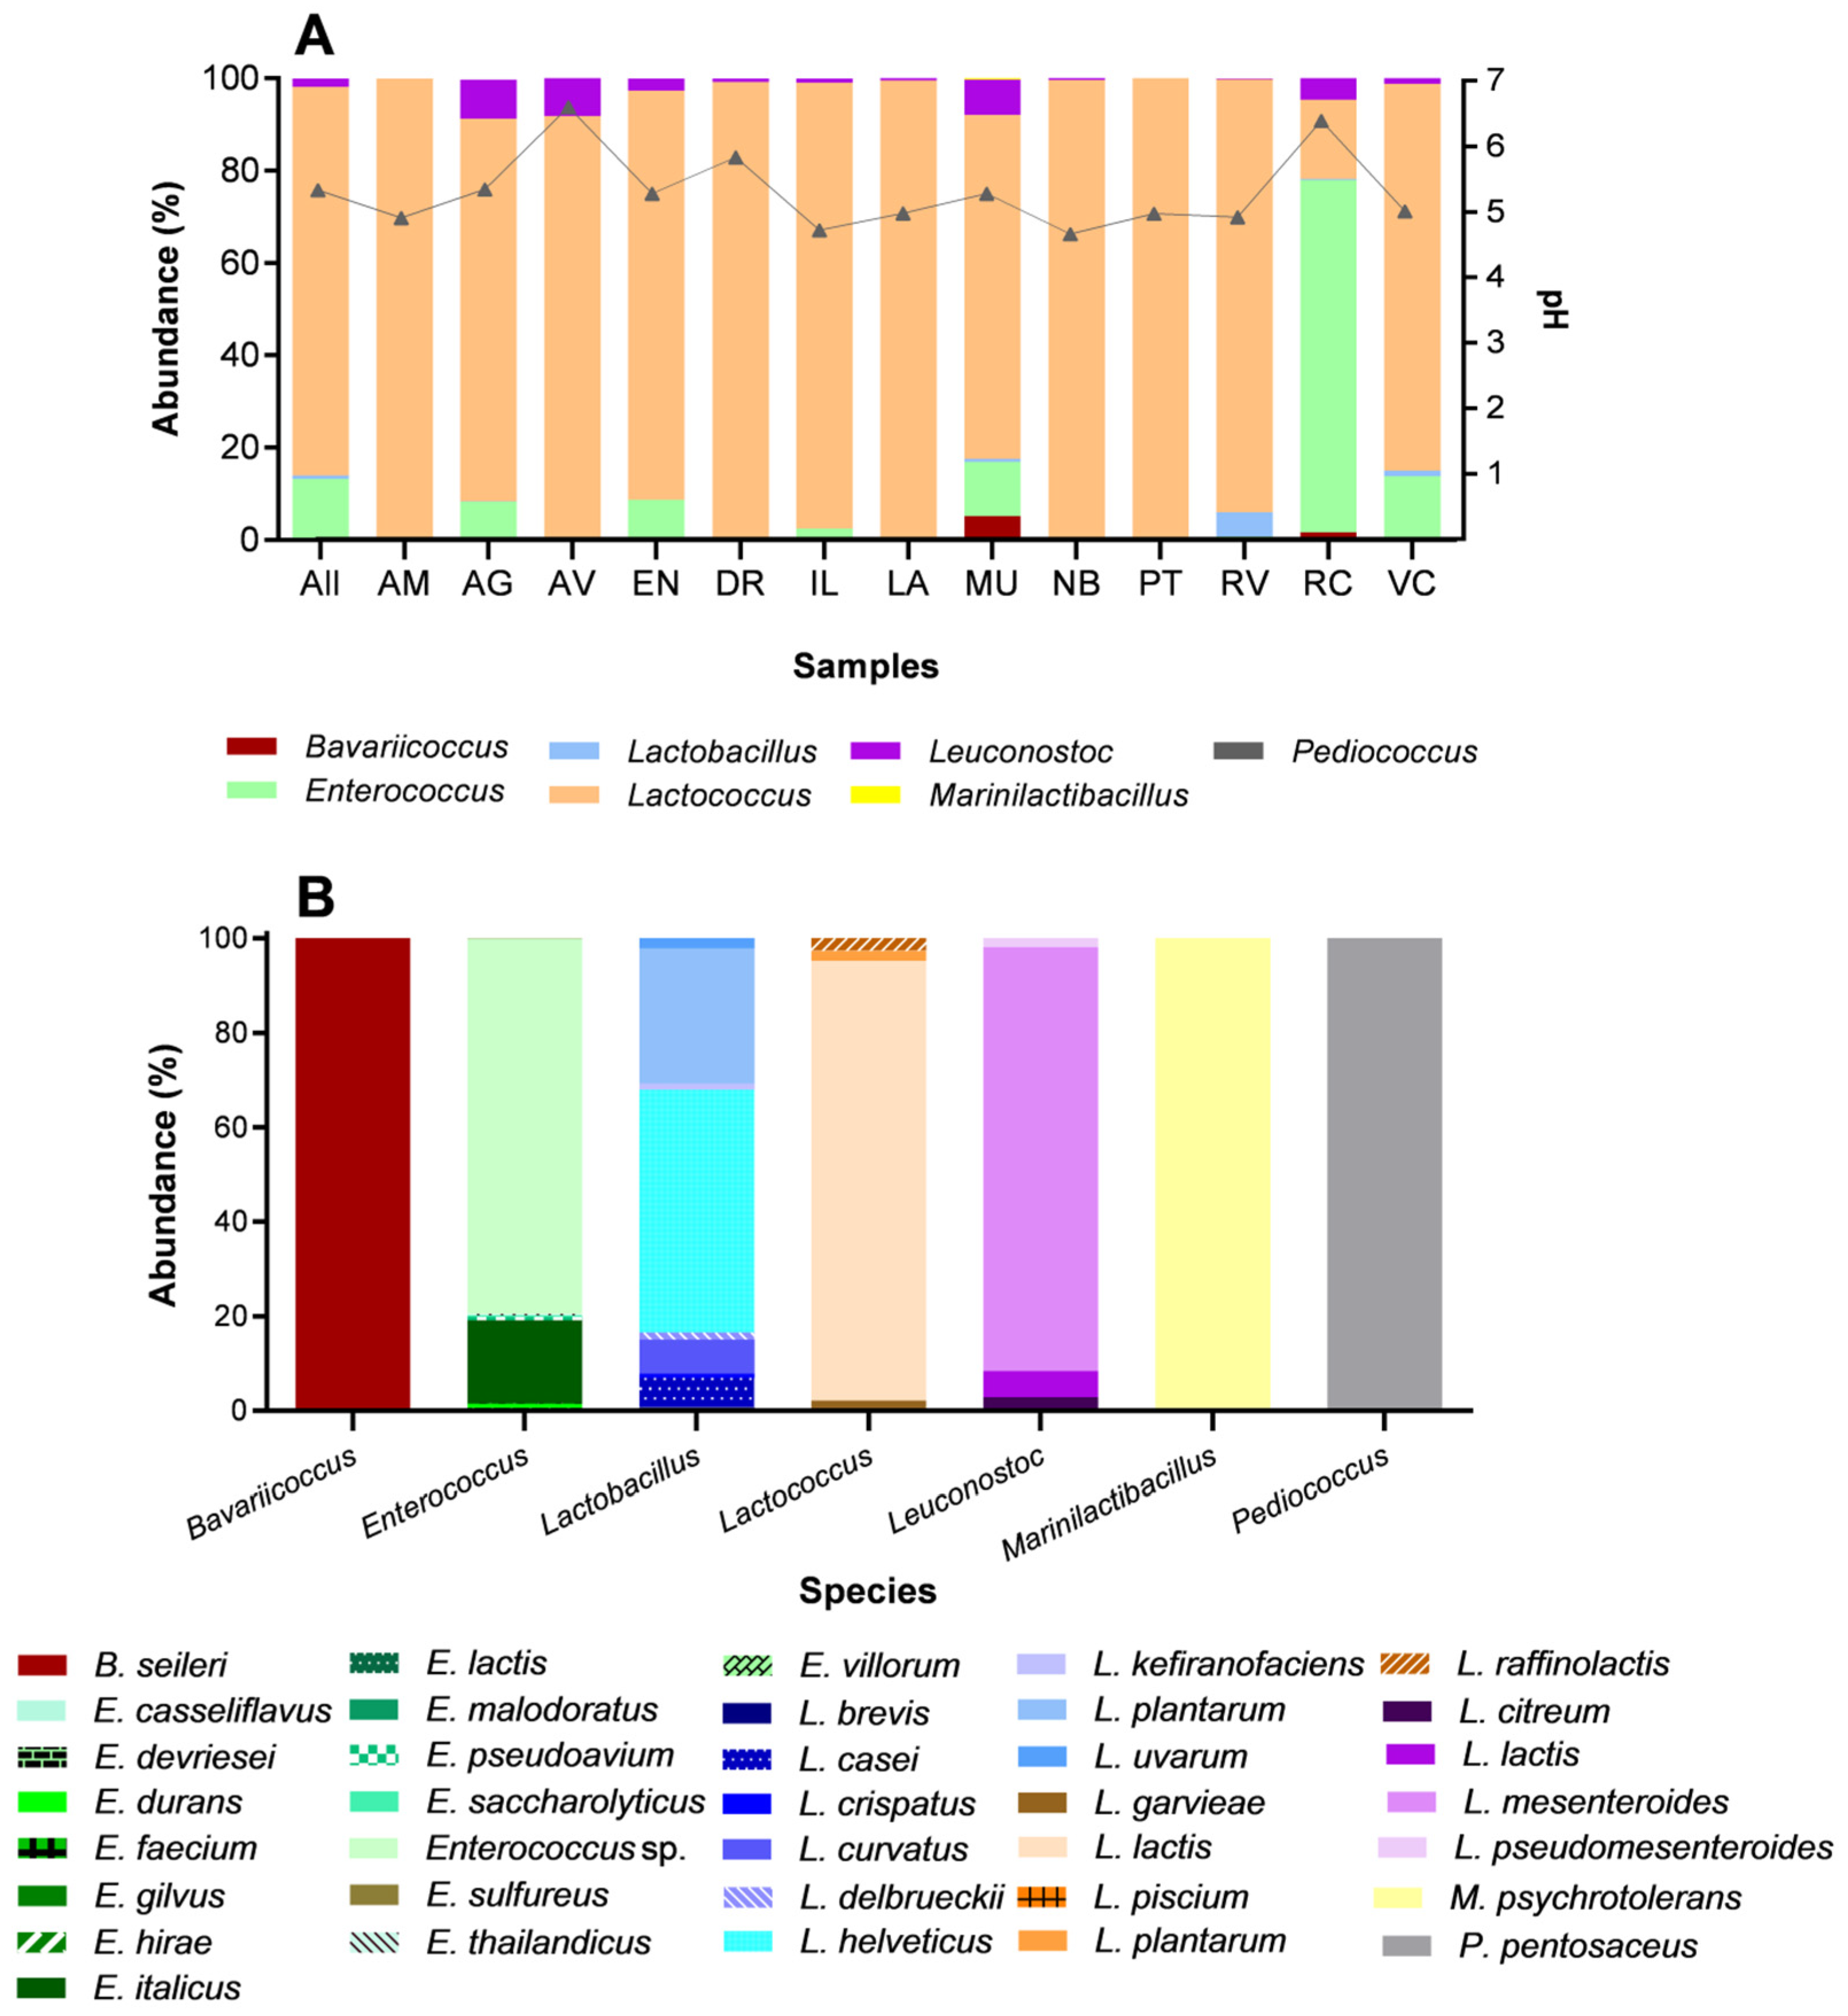
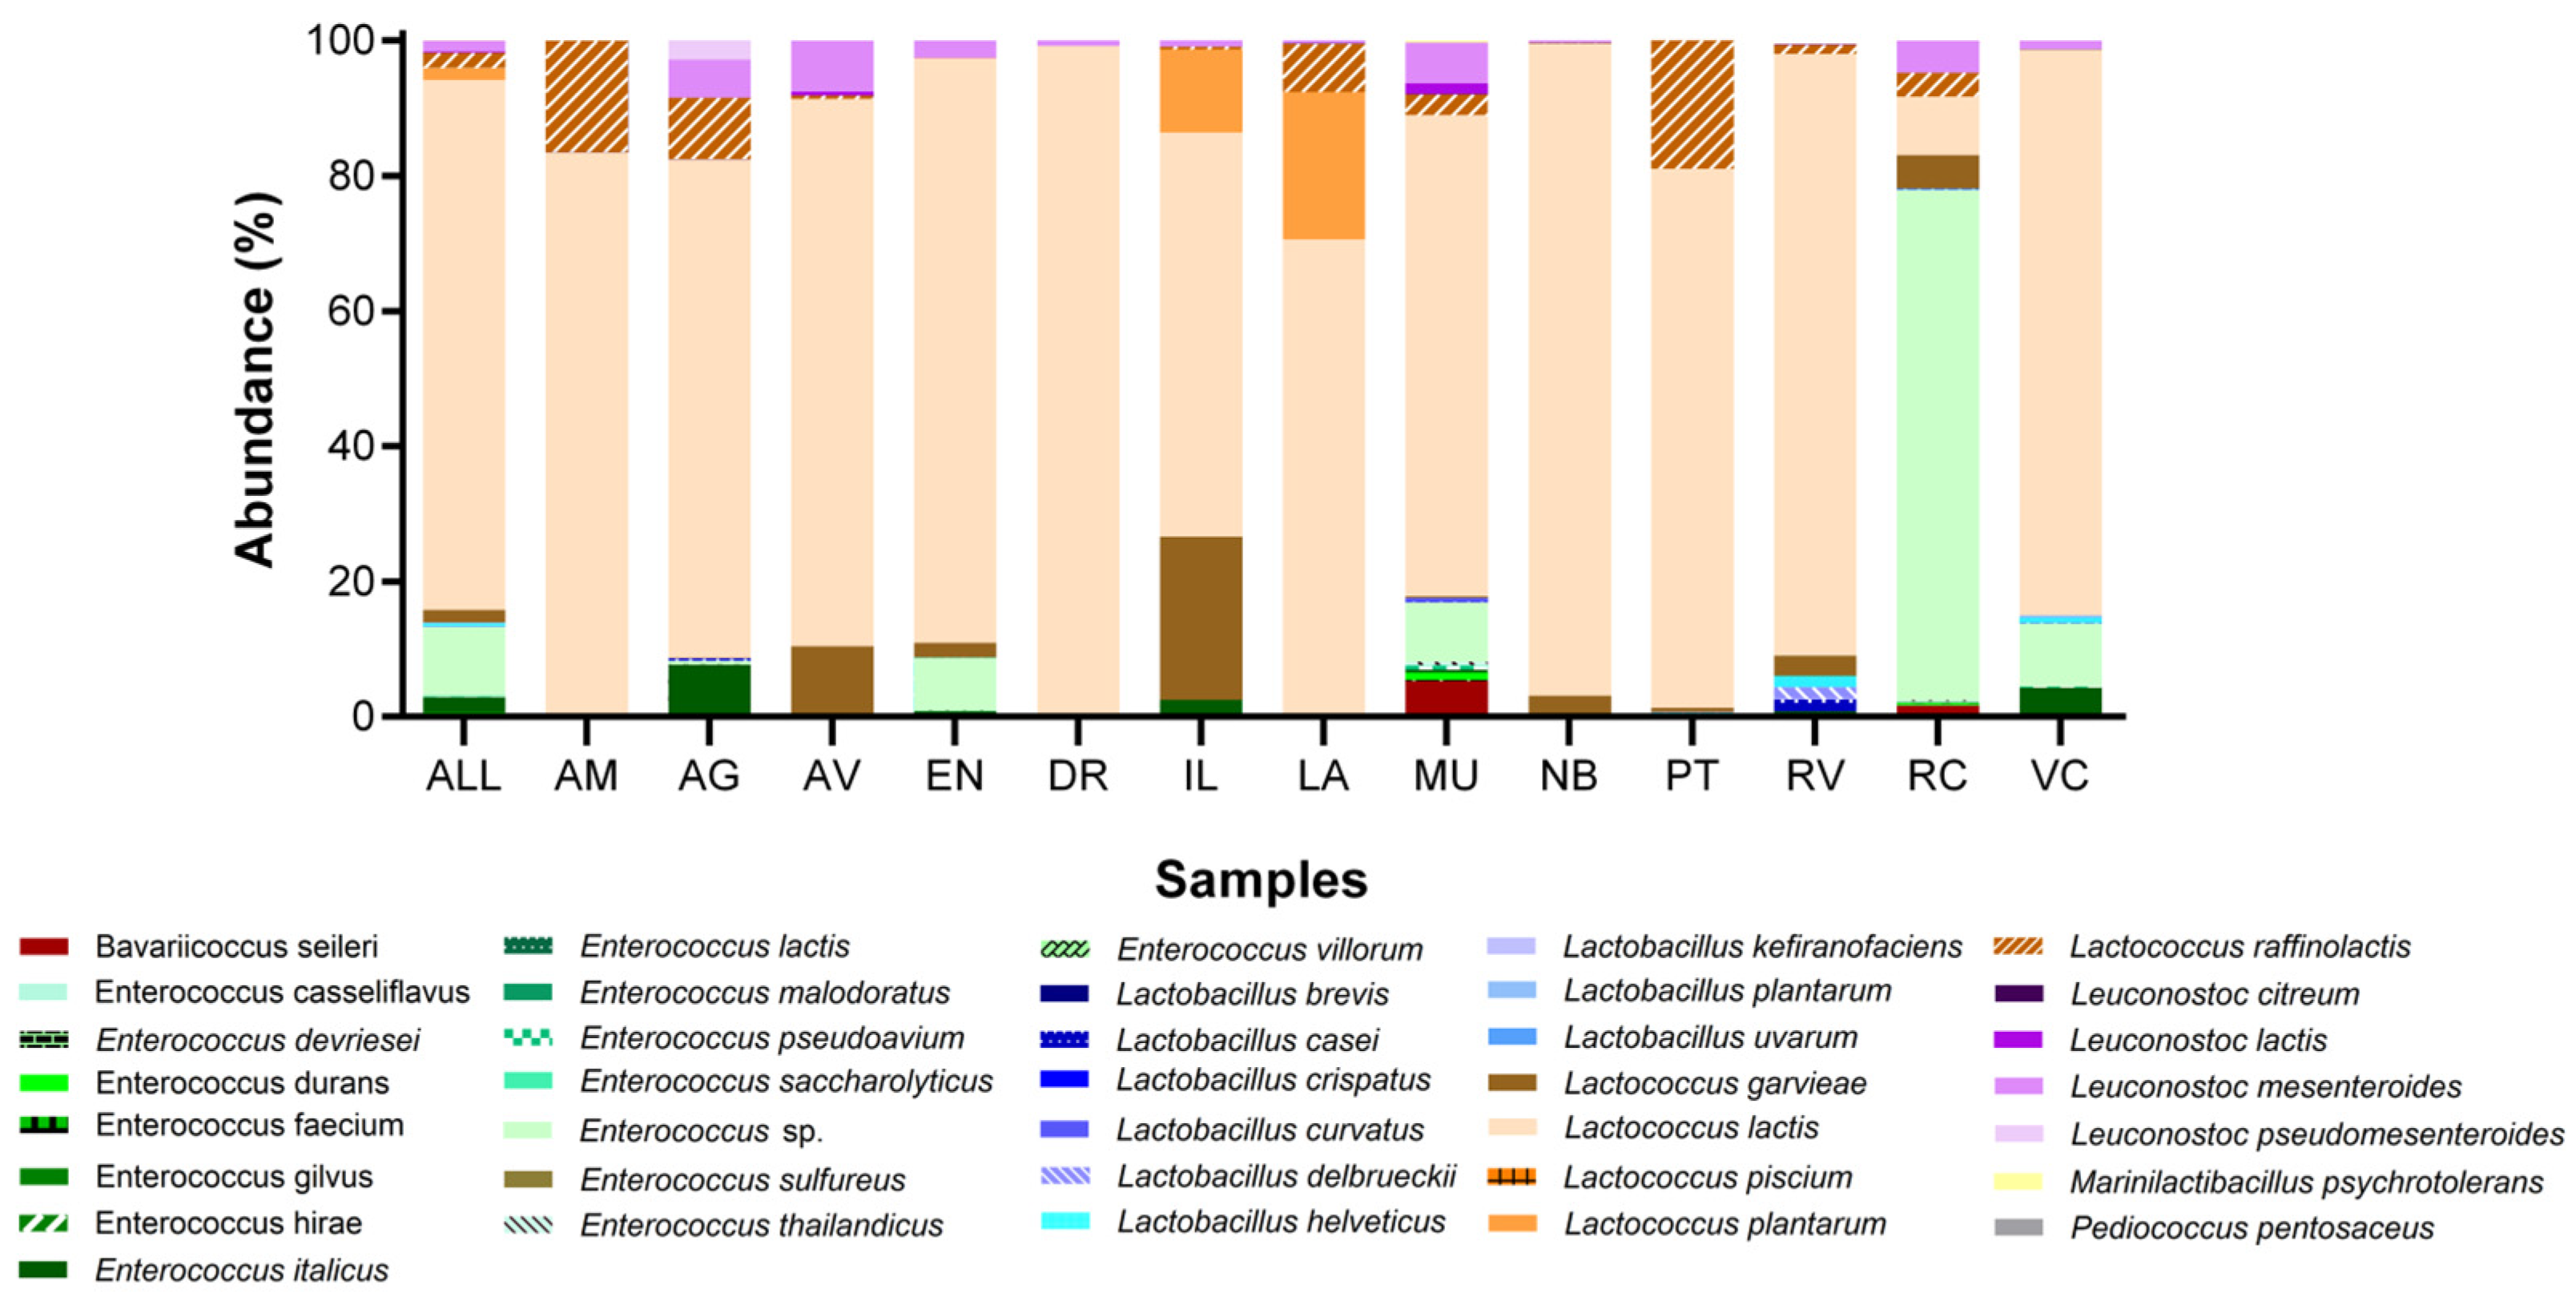
3. Results and Discussion

To characterize the taxonomic composition of LABs from samples of artisanal cheeses belonging to different municipalities of the RVT, the NGS methodology amplifying the V3/V4 region of the 16S rRNA gene was used. The sequences were grouped into bacterial operational taxonomic units (OTUs) that allowed the taxonomic identification of 35 LAB species distributed in seven genera. The number of OTUs of total bacteria from the samples of the 13 municipalities was 424,361, mean 32,643; of these, 60% were identified as LAB species (n = 254,678) with a mean value of 19,591 OTUs. No statistical difference was observed (p > 0.05) in relation to the number of OTUs of the LAB and the group formed by the other bacteria. The species with the highest abundance was Lactococcus lactis with 47.0%, also representing 78.4% of the total among the LAB species (Table 1). The highest OTU richness identified was in the sample VC and DR, with 123,812 and 20,710 OTUs, respectively, and the lowest in RV, with 1454 and AV with 1879 OTUs.
Regarding pH, the samples of artisanal cheeses AV and RC presented pH above 6.0, with a predominance of Lactococcus/Leuconostoc and Enterococcus, respectively. The remaining samples had hydrogen potential of around 5.0. The average pH value of the 13 samples was 5.3, ranging from 4.6 to 6.6. All samples of artisanal cheeses presented the genus Lactococcus as the most expressive, except RC, which highlighted Enterococcus (Figure 2A). Spearman’s correlation analysis between pH and the genera revealed significance only with the genus Leuconostoc (r = 0.62), showing that the species of this genus have a direct relationship with the acidification of the medium (Supplementary Figure S1). A study by Morgalho et al. [28], which aimed to evaluate the technological characteristics of different types of Brazilian artisanal cheeses, showed an intra-species variability in the acidification rates of the dairy products, being more pronounced among isolates from minas, caipira, and coalho artisanal cheeses. Lacticaseibacillus paracasei and Levilactobacillus brevis showed faster acidification rates.
The LAB genera identified in the cheese samples were Bavariicococcus, Enterococcus, Lactobacillus, Lactococcus, Leuconostoc, Marinilactibacillus, and Pediococcus (Figure 2A,B and Table 1), with the most abundant being Lactococcus (84.2%) and Enterococcus (12.8%) being present in all 13 samples. Turkish Tulum artisanal cheeses showed 30.7% of their sequences classified within the phylum Lactobacillaceae and 59.8% of Streptococcaceae (Lactobacillus, Lactococcus, Streptococcus, and Pediococcus) [29], showing similarity with the bacterial profile found in this study. These genera are naturally present as native microorganisms. They are commonly identified in studies to characterize the microbiota of different types of cheeses because they are part of the fermentative process of dairy products and have the potential to act as probiotics [14,29,30,31,32,33].
A correlation between the total population of LAB and the genus Lactococcus (r = 0.83) was observed, which has its species frequently isolated in high abundance in cheese. In addition, this genus showed the highest diversity of species, with 14 identified, followed by Lactobacillus with nine. The other genera presented richness below 2% each (Table 1). Dairy products, especially cheeses, have a great diversity of LAB which give their own characteristics, as reported by Myazaki [34]. This author identified 30 genera and 57 species, mainly Lactococcus lactis (30.6%), Corynebacterium variabile (17.9%), Enterococcus sp. (17.4%), and Bifidobacterium psychraerophilum (7.2%) in the most significant number. In a similar study of Suarez et al. [32] on cheese, Lactococcus lactis, Streptococcus thermophilus, Enterococcus saccharominimusi, and E. durans were the most predominant species.
The genera Marinilactibacillus and Pediococcus, represented by the species Marinilactibacillus psychrotolerans and Pediococcus pentosaceus, were each restricted to only one sample, MU and VC, respectively, and even with low abundance, had 43 and 8 OTUs. Both samples also had the highest genus diversity, with six out of seven (Figure 2 and Figure 3). Marinilactibacillus is a group of halophilic and alkaliphilic lactic acid bacteria of marine origin and has been reported to be subdominant and described as part of the microbiota of soft and semi-hard cheese playing a role in cheese ripening [12,35,36,37]. Pediococcus pentosaceus has played an important role in LAB applications, as it interacts with the human gastrointestinal tract and can be used as a natural preservative for food, plants, or animals or as a possible emerging probiotic, as well as an animal growth biopromoter [38].
Another genus with a low frequency was Bavariicoccus (n = 1144 OTUs), with only one species (B. seileri) identified, being detected only in five samples (AV, MU, PT, RC, and VC). It was most abundant in MU (n = 868) and RC (n = 261), both produced and matured in regions below 77 m altitude (Figure 1 and Figure 2). This species was also identified in cheeses from the southeastern and southern regions of Brazil, although it was in greater proportion in regions of higher altitude [2].
Regarding the diversity and abundance of species in the 13 cheese samples evaluated, 35 species were identified, with Lactococcus lactis present in 100% of the samples and in a greater number of OTUs (n = 199,625) (Figure 3). In addition to imparting flavor, Lactococcus lactis preserves foods due to the acidification of the medium and, in some cases, with the production of bacteriocins [39]. The total diversity assessed by 16S rRNA analysis was high in artisanal cheese samples, as observed in the rarefaction curve (Supplementary Figure S2). The rarefaction curve approached a plateau at the end of the curve, reaching a clear saturation, indicating that there was adequate representation of the microbial community throughout the samples, as most of the abundant species are represented with some rare species. This result shows that the collected samples were sufficient to represent the bacterial diversity of the local artisanal cheese.
Figure 2B shows the species abundance concerning the total genus. Fourteen species of the genus Enterococcus were identified, with E. italicus in the highest amount (5734 OTUs); nine of the genus Lactobacillus, with greater evidence of the species L. helveticus and L. plantarum with 921 and 514 OTUs, respectively; five of the genus Lactococcus, with the predominance of L. raffiolactis (5730 OTUs); and four species of Leuconostoc, the most abundant being L. mesenteroides with 4157 OTUs and Lactococcus lactis with 252 OTUs.
The MU sample showed the highest diversity with 24 species, followed by VC with 21 species and RC with 20 species. The samples DR, AM, and PT presented the lowest diversity, with only five, six, and six species, respectively (Figure 3 and Table 1). Notably, 25,896 OTUs (i.e., 10.2% of LAB sequences) were not identified at the species level (Table 1). In this work, the diversity of LAB found was much lower than that reported by Papadakis et al. [14]. The results obtained by these researchers consisted of 5 phyla, 17 families, 38 genera, and 59 bacterial species. Streptococcaceae and Lactobacillaceae were the most abundant families.
In decreasing order of abundance, considering all samples, there are Lactococcus lactis (199,625 OTUs), Enterococcus italicus (5734 OTUs), Lactococcus raffinolactis (5730 OTUs), L. garvieae (4576 OTUs), L. plantarum (4530 OTUs), and Leuconostoc mesenteroides (4157 OTUs). Some species were present in specific samples, such as: VC—Lactobacillus plantarum, L. brevis, Enterococcus malodoratus, E. sulfureus, and Pediococcus pentosaceus; MU—Marinilactibacillus psychrotolerans and Enterococcus gilvus; and IL—Lactococcus piscium. It should be noted that the Lactobacillus plantarum has a long history of natural presence and safe use in various food products, although it can have adverse effects on cheese quality [40,41]. For example, the presence of this species in Emmental cheese was reported to disrupt the metabolism of propionic acid bacteria, reducing the quality of the cheese due to changes in its flavor [40].
Figure 4 presents the phylogenetics between the LAB sequences obtained from the metagenomic analysis using the neighbor joining method to determine the correlations between the isolated representatives and known reference strains. Clustering occurred in five main clusters: blue (Marinilactibacillus, Lactobacillus, and Pediococcus), purple (Leuconostoc), red (Bavaricococcus), green (Enterococcus), and orange (Lactococcus). The species of the genera Marinilactibacillus, Lactobacillus, and Pediococcus (blue clade) were grouped in different clades from the genus Leuconostoc (purple clade) but share the same common ancestor. This result shows homology between the sequences of the species identified between the genera. The phylogenetic relationship between the sequences of the genera Marinilactibacillus, Pediococcus, and Lactobacillus is justified because they are representatives of the order Lactobacillales.
A similar profile was observed among the species of the genera Bavaricoccus (red) and Enterococcus (green). The other sequences grouped separately, forming a clade with the species of the Lactococcus group. Pediococcus was rooted within the Lactobacillus clade, not presenting an exclusive clade, since both are from the same family. Phenotypic relationships of the dominant LAB strains isolated from 14 traditional cheese samples were plotted by Parsaeimehr et al. [41]. The 105 isolates were grouped into two clusters, one with Lactobacillus species and the second with Enterococcus species.
From the LAB OTUs, a sequence was selected among the repeats representing the most abundant species in each sample, for a total of 71 sequences (Figure 5). The genetic relationships between the most prevalent species were determined automatically using the Gegenees software. Then, the gene contents, 16S rRNA, were compared to generate a phylogenetic tree and plot a heat map in FigTree (Figure 4). According to the phylogenetic tree generated, the most abundant species in the artisanal cheese samples formed two clusters, one clustered by the genera of the Lactobacillaceae family and the second by Enterococcaceae, Carnobacteriaceae, and Streptococcaceae. The similarity percentage between the two clusters was between 24.0% and 47.0%, as seen in the orange region in Figure 5.
The first clade separated into two subclusters, with the species Leuconostoc mesenteroides and Lactobacillus helveticus grouped in the first, with 55.0% similarity. In the second, the species Lactobacillus plantarum formed a separate clade, showing a similarity of 55.0% and 68.0% with the aforementioned species. The second clade was also divided into two subclades: (a) species Enterococcus italicus and Bavariicoccus seileri, grouped separately according to the genus and presented similarity above 85.0%; (b) species of the genus Lactococcus, subdivided into three subgroups—L. lactis, L. plantarum, and L. raffinolactis, L. garvieae, showing similarity with the previous group (a), between 61.0% and 68.0%. The species L. plantarum and L. raffinolactis that share the same subclade showed similarity above 93.0%. The similarity between the subclusters formed by the different species of the genus Lactococcus was greater than 82.0%. Parsaeimehr et al. [41], after verifying the similarity between isolates of LAB of the genera Lactobacillus and Enterococcus, verified low similarity between these two groups, the formation of distinct clusters occurring, as identified in the present study. The sequences of the same species showed a high degree of relatedness between them, indicating no strain variations in the population.
Knowing the diversity and taxonomic structure of the microbial population present in fermented foods is essential to select a “starter” culture, improving the final product’s safety and quality [16]. These researchers used 16S rDNA sequencing using the NGS platform and compared the microbiota present in three commercial Slovak bryndza cheese and one artisanal cheese sample. They obtained a diverse microbiota composed mainly of Lactococcus, Streptococcus, Lactobacillus, and Enterococcus. Lactococcus lactis subsp. lactis and L. lactis subsp. cremoris were the most abundant species in the samples evaluated, followed by Lactococcus fujiensis and L. taiwanensis. The researchers point out that metagenomic analysis using the 16S rRNA gene seems to be a suitable tool for studying the microbial population in cheeses.
Vermote et al. [42] investigated the taxonomic diversity of microbial communities in brine samples from one artisanal and one mass-produced cheese in Flanders, Belgium. Metagenomic sequencing revealed that Tetragenococcus, Chromohalobacter, and Halanaerobium species are the most abundant in different brines. Another NGS-based study was conducted by Dimov et al. [33] to obtain an overview of the microbial composition. Firmicutes were represented by the families Streptococcaceae, Lactobacillaceae, and Staphylococcaceae, while Actinobacteria were mainly represented by the genera Brevibacterium and Corynebacterium. Low populations of Proteobacteria were also detected, mainly halophiles of the genera Cobetia and Psychrobacter.
Many researchers cite the predominance of certain LAB species in distinct geographical environments, with variations at different altitudes [14,19,29,32,43]. In this study, starting from the average elevation of Rio Grande do Sul State (206 m), the samples were grouped according to the altitude (low < 150 m, medium > 150 and <350 m, and high > 350 m) of the municipalities of production, maturation, and sample collection.
An overview of the distribution of the different eubacteria species is given in the Venn diagram (Supplementary Figure S3). Some species, 28.6% (n = 10), were identified in samples at all three altitudes: Enterococcus devriesei, E. italicus, Lactobacillus curvatus, L. casei, Lactococcus lactis, L. raffinolactis, L. garvieae, L. plantarum, Leuconostoc mesenteroides, and L. citreum. In addition, species unique to certain altitudes were observed: (a) low (22.9%, n = 8)—Enterococcus faecium, E. gilvus, E. hirae, E. lactis, E. thailandicus, E. villorum, Lactobacillus uvarum, and Marinilactibacillus psychrotolerans; (b) medium (2.9%, n = 1)—Lactobacillus delbrueckii; and (c) high (20.0%, n = 7)—Enterococcus malodoratus, E. sulfureus, Lactobacillus brevis, L. kefiranofaciens, L. plantarum, Lactococcus piscium, and Pediococcus pentosaceus. No species was common between low and medium altitude. Between low and high altitudes, 22.9% (n = 8) of the identified species were common, and between medium and high altitudes, 2.9% (n = 1) were common. The sequences identified as Enterococcus sp. were not included in the analysis.
Even though some species were identified at all three altitudes, the abundance varied according to the geographical environments. In Figure 6, the abundance of the species is represented graphically. It was observed that Enterococcus italicus is more present at high altitudes, unlike Lactococcus plantarum and L. raffinolactis at low altitudes. Lactococcus lactis species was present in all three geographical environments, but the highest amount (~50%) was observed at high altitudes. The most abundant species, L. lactis, was found at different altitudes, although higher numbers were observed at altitudes above 350 m. Resende et al. [19] reported that altitude could influence the presence of LAB. These researchers evaluated minas frescal cheeses produced in cheese shops with altitudes ranging from 600 to over 1000 m and found higher LAB populations in the cheese samples produced at an altitude between 600 and 900 m. Papadakis et al. [14] surveyed fermented cheeses from two geographical regions of Greece, Epirus and Thessaly, which showed a distinct microbiota fingerprint. In addition, Cotija cheese, a Mexican artisanal product made from raw cow’s milk whose maturation process occurs spontaneously, is influenced by environmental conditions [43].
In addition, a PCA analysis was performed, and high similarity was observed among the three clusters concerning the geographic region located in the same dimension (Cartesian quadrants). According to Margalho et al. [28], multivariate statistics allows insights into a diverse set of technological and biopreservation properties of LABs. According to these authors, establishing relationships among the technological characteristics allows an in-depth understanding of heterogeneity and can contribute to designing starter cultures with varied and combined properties. Figure 7 shows that samples from medium altitudes are grouped with samples from low and medium altitudes. The sample VC (high altitude—green) was distant from the others, as well as RC and MU (low altitude—pink). It should be noted that the sample VC was the one that presented the composition with the highest number of species, including two unique to this sample, also observed in MU, with exclusive species.
In addition, the bacterial species were also grouped by PCA and, consequently, classified into three dimensions. The first quadrant belonging to high altitude had a predominance of Enterococcus devriesei, E. italicus, E. malodoratus, E. pseudoavium, E. saccharolyticus, E. sulfureus, Lactobacillus brevis, L. crispatus, L. helveticus, L. kefiranofaciens, L. plantarum, Lactococcus garvieae, L. lactis, L.piscium, Leuconostoc citreum, L. pseudomesenteroides, and Pediococcus pentosaceus; in the second quadrant predominated the Bavariococcus seileri, Enterococcus casseliflavus, E. durans, E. faecium, E. gilvus, E. hirae, E. lactis, Enterococcus sp., E. thailandicus, E. villorum, Lactobacillus uvarum, Lactococcus plantarum, L. raffinolactis, Leuconostoc lactis, L.mesenteroides, and Marinilactacibacillus psychrotolerans species, being similar to low altitude; and finally, the fourth quadrant had a predominance of Lactobacillus casei and L. curvatus, belonging to medium altitude.
According to the multivariate statistical analysis (Euclidean distance) by clustering, it was established that the samples from the high altitude showed no similarity with the others, unlike those from the low and medium altitude that resulted in a similarity behavior (Supplementary Figure S4), forming a single clade (which was reclassified as low altitude). A figure indicating the relative evolutionary distances was projected from this new grouping (low and high) using the VITCOMIC tool. This visualization software for taxonomic compositions of microbial communities can analyze millions of bacterial 16S rRNA gene sequences and calculate the composition of the overall taxonomy of a community of microorganisms. The 16S rRNA gene sequences of the strains sequenced in the genome are used as references to identify the closest relative of each sample sequence. With this information, the tool projects all sequences into a single figure and indicates relative evolutionary distances.
Figure 8 shows the most abundant LABs (colored circumference) of the two new altitude levels. At low and high altitudes, the genus Lactococcus showed similarity with Lactovum and Atopobacter, and the genus Lactobacillus showed proximity with Lactobacillus and Leuconostoc with the genus Weisella. The genus Enterococcus showed similarity between Desemzia and Dolosigranulum and Bavaricoccus with Aerococcus. Marinilactibacillus showed similarity between Sarcina and Clostridium sensu stricto present only at low altitude, unlike Pediococcus that was similar to itself, present only at high altitude. All genera show similarity >95.0%.

4. Conclusions

With the advent of metagenomics analysis, the characterization of the flora present in cheeses can be better studied by researchers, since the assembly of sequencing libraries allows identifying the present sequences and, therefore, inferring possible relationships such as abundance between cheese samples and its relationship with pH, altitude, organoleptic characteristics, and the study of pathogen inhibition, among others. In this study, we noticed a correlation between the BAL of the genus Leuconostoc and the acidification of the food matrix. In addition, the altitude environmental factor was shown to have an influence on the diversity and abundance of bacteria in the artisanal cheese samples analyzed, determining a specific fingerprint.
The species Enterococcus italicus and Lactococcus lactis were more abundant at high altitudes, also presenting seven species exclusive to this elevation, and Lactococcus plantarum and L. raffinolactis were present in greater quantities at low altitudes, with eight specific species. Through the PCA analysis, it was possible to verify a high similarity between the three groups in relation to the geographic region. The cluster of medium and high elevation samples was also observed in the Euclidean distance cluster analysis. Bacterial species were also grouped by PCA and each altitude had species grouped in specific quadrants.
In this study, it was verified that the diversity of BAL was not so wide, presenting 35 species distributed in seven genera; however, they represented 60% of the total bacterial composition of the samples. The total diversity evaluated by the 16S rRNA analysis, through the rarefaction curve, was high in the local artisan cheese samples. The most abundant genera were Lactococcus, which deserves mention for having the greatest diversity of species (total of 14) and presenting a statistical correlation with the abundance of BAL, and Enterococcus, which were present in all samples. At the species level, Lactococcus lactis was the most representative. It was observed that there is homology between the sequences of the identified species forming five clades, some of which are rooted with the same ancestor.
So far, this is the first work to characterize the lactic acid flora in artisanal cheeses produced in different municipalities of the RVT, using the NGS technique, with maturation time varying between seven and ten days. The identification of bacterial species in fermented cheeses is important, as it contributes significantly to the organoleptic quality in the maturation process by establishing the shelf life, including the safety and overall quality of the cheese. Knowing the specific bacterial microbiota of this type of cheese allows retaining the flavor and unique characteristics of the regional dairy product, thus being able to produce specific starter cultures that guarantee the identity of the product, favoring species that are more specific or are in greater abundance under certain environmental conditions, such as altitude.
For future studies, it is suggested to evaluate the presence of volatile compounds, external bacterial, and fungal microbiota present in the cheese rind and in different fermentation periods.

Supplementary Materials

The following supporting information can be downloaded at: https://www.mdpi.com/article/10.3390/fermentation9010041/s1, Figure S1: Spearman’s correlation between pH and bacterial genera. Figure S2: Rarefaction curve plotted with the total number of sequences versus the total number of OTUs for checking using the Silvangs tool (version 1.9.8/1.4.9) for clustering all 16S rRNA sequences. Figure S3: Venn diagram representing species distribution among the groups of samples collected in the municipalities at different altitudes. The values indicate the number of species for each altitude. The classification of altitude into low altitude (<150 m), medium (>150 and <50 m), and high (>350 m) was made from the average altitude of the state of Rio Grande do Sul (206 m). Venn diagrams were drawn using the VENNY 2.1 software (https://bioinfogp.cnb.csic.es/tools/venny, accessed on 27 October 2022) online web tool. Figure S4: Schematic dendrogram of the groups of different altitudes from the agglomerative hierarchical clustering (AHC) analysis considering Euclidean distance.

Author Contributions

Conceptualization, M.M.E., W.d.C.O. and N.S.P.d.S.R.; Methodology, M.M.E., W.d.C.O., H.F. and P.H.M.; Software, M.M.E., W.d.C.O. and P.H.M.; Validation, M.M.E., W.d.C.O. and H.F.; Formal analysis, M.M.E., W.d.C.O. and H.F.; Investigation, M.M.E., W.d.C.O. and H.F.; Resources, M.M.E.; Data curation, M.M.E., W.d.C.O., H.F. and P.H.M.; Writing—original draft, M.M.E., W.d.C.O., H.F. and P.H.M.; Writing—review & editing, M.M.E., W.d.C.O., H.F. and N.S.P.d.S.R.; Visualization, M.M.E., W.d.C.O., H.F., M.B.P.P.O. and N.S.P.d.S.R.; Supervision, M.M.E., W.d.C.O., H.F. and N.S.P.d.S.R.; Project administration, M.M.E., W.d.C.O. and N.S.P.d.S.R.; Funding acquisition, M.M.E. and N.S.P.d.S.R. All authors have read and agreed to the published version of the manuscript.

Funding

This research received no external funding.

Institutional Review Board Statement

Not applicable.

Informed Consent Statement

Not applicable.

Data Availability Statement

The data presented in this study are available on request from the corresponding author.

Acknowledgments

The authors thank Luiz Felipe Dias Lopes and Voltaire Sant’Anna for their support with the statistical analyses and to João Henrique Quoos with the construction of the location map of the municipalities where the artisanal cheese samples were collected.

Conflicts of Interest

The authors declare no conflict of interest.

References

  1. Montel, M.-C.; Buchin, S.; Mallet, A.; Delbes-Paus, C.; Vuitton, D.A.; Desmasures, N.; Berthier, F. Traditional cheeses: Rich and diverse microbiota with associated benefits. Int. J. Food Microbiol. 2014, 177, 136–154. [Google Scholar] [CrossRef] [PubMed]
  2. Kothe, C.I.; Mohellibi, N.; Renault, P. Revealing the microbial heritage of traditional Brazilian cheeses through metagenomics. Food Res. Int. 2022, 157, 111265. [Google Scholar] [CrossRef] [PubMed]
  3. Penna, A.; Gigante, M.; Todorov, S. Artisanal Brazilian Cheeses—History, Marketing, Technological and Microbiological Aspects. Foods 2021, 10, 1562. [Google Scholar] [CrossRef] [PubMed]
  4. Kamimura, B.A.; Magnani, M.; Luciano, W.A.; Campagnollo, F.B.; Pimentel, T.C.; Alvarenga, V.O.; Pelegrino, B.O.; Cruz, A.G.; Sant’Ana, A.S. Brazilian Artisanal Cheeses: An Overview of their Characteristics, Main Types and Regulatory Aspects. Compr. Rev. Food Sci. Food Saf. 2019, 18, 1636–1657. [Google Scholar] [CrossRef] [Green Version]
  5. Kamimura, B.A.; De Filippis, F.; Sant’Ana, A.S.; Ercolini, D. Large-scale mapping of microbial diversity in artisanal Brazilian cheeses. Food Microbiol. 2018, 80, 40–49. [Google Scholar] [CrossRef]
  6. Brasil. Decreto n° 11.099, de 21 de Junho de Regulamenta o Art. 10-A da Lei n° 1.283, de 18 de Dezembro de 1950, e a Lei n° 13.860, de 18 de Julho de 2019, Para Dispor Sobre a Elaboração e a Comercialização de Produtos Alimentícios de Origem Animal Produzidos de Forma Artesanal. Available online: http://www.planalto.gov.br/ccivil_03/_ato2019-2022/2022/decreto/D11099.htm#:~:text=DECRETO%20N%C2%BA%2011.099%2C%20DE%2021,animal%20produzidos%20de%20forma%20artesanal> (accessed on 3 November 2022).
  7. Brasil. Lei n° 13.860, de 18 de Julho de Dispõe Sobre a Elaboração e a Comercialização de Queijos Artesanais e dá Outras Providências. Available online: https://www.gov.br/agricultura/pt-br/assuntos/producao-animal/selo-arte-selo-queijo-artesanal/legislacao/lei-no-13-860-de-18-de-julho-de-2019.pdf/view> (accessed on 28 December 2022).
  8. Margalho, L.P.; Feliciano, M.D.; Silva, C.E.; Abreu, J.S.; Piran, M.V.F.; Sant’Ana, A.S. Brazilian artisanal cheeses are rich and diverse sources of nonstarter lactic acid bacteria regarding technological, biopreservative, and safety properties—Insights through multivariate analysis. J. Dairy Sci. 2020, 103, 7908–7926. [Google Scholar] [CrossRef]
  9. Wolfe, B.E.; Button, J.E.; Santarelli, M.; Dutton, R.J. Cheese Rind Communities Provide Tractable Systems for In Situ and In Vitro Studies of Microbial Diversity. Cell 2014, 158, 422–433. [Google Scholar] [CrossRef] [Green Version]
  10. Dugat-Bony, E.; Garnier, L.; Denonfoux, J.; Ferreira, S.; Sarthou, A.-S.; Bonnarme, P.; Irlinger, F. Highlighting the microbial diversity of 12 French cheese varieties. Int. J. Food Microbiol. 2016, 238, 265–273. [Google Scholar] [CrossRef]
  11. De Antônio, M.B.; Borelli, B. A importância das bactérias láticas na segurança e qualidade dos queijos minas artesanais. Rev. Inst. Laticínios Cândido Tostes 2020, 75, 204–221. [Google Scholar] [CrossRef]
  12. Delcenserie, V.; Taminiau, B.; Delhalle, L.; Nezer, C.; Doyen, P.; Crevecoeur, S.; Roussey, D.; Korsak, N.; Daube, G. Microbiota characterization of a Belgian protected designation of origin cheese, Herve cheese, using metagenomic analysis. J. Dairy Sci. 2014, 97, 6046–6056. [Google Scholar] [CrossRef]
  13. Dimov, S.G. The unusual microbiota of the traditional Bulgarian dairy product Krokmach—A pilot metagenomics study. Int. J. Dairy Technol. 2021, 75, 139–149. [Google Scholar] [CrossRef]
  14. Papadakis, P.; Konteles, S.; Batrinou, A.; Ouzounis, S.; Tsironi, T.; Halvatsiotis, P.; Tsakali, E.; Van Impe, J.F.M.; Vougiouklaki, D.; Strati, I.F.; et al. Characterization of Bacterial Microbiota of P.D.O. Feta Cheese by 16S Metagenomic Analysis. Microorganisms 2021, 9, 2377. [Google Scholar] [CrossRef] [PubMed]
  15. Papadimitriou, K.; Anastasiou, R.; Georgalaki, M.; Bounenni, R.; Paximadaki, A.; Charmpi, C.; Alexandraki, V.; Kazou, M.; Tsakalidou, E. Comparison of the Microbiome of Artisanal Homemade and Industrial Feta Cheese through Amplicon Sequencing and Shotgun Metagenomics. Microorganisms 2022, 10, 1073. [Google Scholar] [CrossRef] [PubMed]
  16. Planý, M.; Kuchta, T.; Šoltýs, K.; Szemes, T.; Pangallo, D.; Siekel, P. Metagenomic Analysis of Slovak Bryndza Cheese Using Next-Generation 16S rDNA Amplicon Sequencing. Nova Biotechnol. Chim. 2016, 15, 23–34. [Google Scholar] [CrossRef] [Green Version]
  17. Lahtinen, S.; Ouwehand, A.C.; Salminen, S.; Von Wright, A. (Eds.) Lactic Acid Bacteria: Microbiological and Functional Aspects; CRC Press: Boca Raton, FL, USA, 2011. [Google Scholar]
  18. Sant’Anna, F.M.; Wetzels, S.U.; Cicco, S.H.S.; Figueiredo, R.C.; Sales, G.A.; Figueiredo, N.C.; Nunes, C.A.; Schmitz-Esser, S.; Mann, E.; Wagner, M.; et al. Microbial shifts in Minas artisanal cheeses from the Serra do Salitre region of Minas Gerais, Brazil throughout ripening time. Food Microbiol. 2019, 82, 349–362. [Google Scholar] [CrossRef]
  19. Resende, M.F.S.; Costa, H.H.S.; Andrade, E.H.P.; Acúrcio, L.B.; Drummond, A.F.; Cunha, A.F.; Souza, M.R. Queijo de minas artesanal da Serra da Canastra: Influência da altitude das queijarias nas populações de bactérias acidolácticas. Arq. Bras. Med. Vet. Zoo. 2011, 63, 1567–1573. [Google Scholar] [CrossRef]
  20. Topographic. 2022. Available online: https://pt-br.topographic-map.com/map-pb651/Rio-Grande-do-Sul/ (accessed on 14 October 2022).
  21. Wang, Y.; Qian, P.Y. Conservative Fragments in Bacterial 16S rRNA Genes and Primer Design for 16S Ribosomal DNA Amplicons in Metagenomic Studies. PLoS ONE 2009, 4, e7401. [Google Scholar] [CrossRef] [Green Version]
  22. Caporaso, J.G.; Lauber, C.L.; Walters, W.A.; Berg-Lyons, D.; Huntley, J.; Fierer, N.; Owens, S.M.; Betley, J.; Fraser, L.; Bauer, M.; et al. Ultra-high-throughput microbial community analysis on the Illumina HiSeq and MiSeq platforms. ISME J. 2012, 6, 1621–1624. [Google Scholar] [CrossRef] [Green Version]
  23. Quast, C.; Pruesse, E.; Yilmaz, P.; Gerken, J.; Schweer, T.; Yarza, P.; Peplies, J.; Glöckner, F.O. The SILVA ribosomal RNA gene database project: Improved data processing and web-based tools. Nucleic Acids Res. 2013, 41, D590–D596. [Google Scholar] [CrossRef]
  24. Madeira, F.; Pearce, M.; Tivey, A.R.N.; Basutkar, P.; Lee, J.; Edbali, O.; Madhusoodanan, N.; Kolesnikov, A.; Lopez, R. Search and sequence analysis tools services from EMBL-EBI in 2022. Nucleic Acids Res. 2022, 50, W276–W279. [Google Scholar] [CrossRef]
  25. Agren, J.; Sundström, A.; Håfström, T.; Segerman, B. Gegenees: Fragmented alignment of multiple genomes for determining phylogenomic distances and genetic signatures unique for specified target groups. PLoS ONE 2012, 7, e39107. [Google Scholar] [CrossRef] [PubMed]
  26. Huson, D.H.; Kloepper, T.; Bryant, D. SplitsTree 4.0-Computation of phylogenetic trees and networks. Bioinformatics 2008, 14, 68–73. [Google Scholar] [CrossRef] [PubMed] [Green Version]
  27. Mori, H.; Maruyama, T.; Yano, M.; Yamada, T.; Kurokawa, K. VITCOMIC2: Visualization tool for the phylogenetic composition of microbial communities based on 16S rRNA gene amplicons and metagenomic shotgun sequencing. BMC Syst. Biol. 2018, 12, 47–58. [Google Scholar] [CrossRef] [PubMed]
  28. Margalho, L.P.; Kamimura, B.A.; Brexó, R.P.; Alvarenga, V.O.; Cebeci, A.S.; Janssen, P.W.; Dijkstra, A.; Starrenburg, M.J.; Sheombarsing, R.S.; Cruz, A.G.; et al. High throughput screening of technological and biopreservation traits of a large set of wild lactic acid bacteria from Brazilian artisanal cheeses. Food Microbiol. 2021, 100, 103872. [Google Scholar] [CrossRef]
  29. Gezginc, Y.; Karabekmez-Erdem, T.; Tatar, H.D.; Dağgeçen, E.C.; Ayman, S.; Akyol, İ. Metagenomics and volatile profile of Turkish artisanal Tulum cheese microbiota. Food Biosci. 2022, 45, 101497. [Google Scholar] [CrossRef]
  30. Coeuret, V.; Dubernet, S.; Bernardeau, M.; Gueguen, M.; Vernoux, J.P. Isolation, characterisation and identification of lactobacilli focusing mainly on cheeses and other dairy products. Le Lait 2003, 83, 269–306. [Google Scholar] [CrossRef]
  31. Amraii, H.N.; Abtahi, P.; Jafari, H.R.; Mohajerani, M.R.; Fakhroleslam, N. In vitro study of potentially probiotic lactic acid bacteria strains isolated from traditional dairy products. Jundishapur J. Microbiol. 2014, 7, e10168. [Google Scholar]
  32. Suárez, N.; Weckx, S.; Minahk, C.; Hebert, E.; Saavedra, L. Metagenomics-based approach for studying and selecting bioprotective strains from the bacterial community of artisanal cheeses. Int. J. Food Microbiol. 2020, 335, 108894. [Google Scholar] [CrossRef]
  33. Dimov, S.G.; Gyurova, A.; Zagorchev, L.; Dimitrov, T.; Georgieva-Miteva, D.; Peykov, S. NGS-Based Metagenomic Study of Four Traditional Bulgarian Green Cheeses from Tcherni Vit. Lwt 2021, 152, 112278. [Google Scholar] [CrossRef]
  34. Myazaki, N.L. Identificação e Quantificação de Bactérias em Queijo Colonial Utilizando as Regiões V3–V4 do Gene 16S Rrna; TCC, Departamento de Ciência e Tecnologia de Alimentos, Universidade Federal de Santa Catarina: Florianópolis, Brazil, 2021; 80p. [Google Scholar]
  35. Ishikawa, M.; Kodama, K.; Yasuda, H.; Okamoto-Kainuma, A.; Koizumi, K.; Yamasato, K. Presence of halophilic and alkaliphilic lactic acid bacteria in various cheeses. Lett. Appl. Microbiol. 2006, 44, 308–313. [Google Scholar] [CrossRef]
  36. Roth, E.; Miescher Schwenninger, S.; Hasler, M.; Eugster-Meier, E.; Lacroix, C. Population dynamics of two antilisterial cheese surface consortia revealed by temporal temperature gradient gel electrophoresis. BMC Microbiol. 2010, 10, 74. [Google Scholar] [CrossRef] [PubMed]
  37. Ishikawa, M.; Nakajima, K.; Yanagi, M.; Yamamoto, Y.; Yamasato, K. Marinilactibacillus psychrotolerans gen. nov., sp. nov., a halophilic and alkaliphilic marine lactic acid bacterium isolated from marine organisms in temperate and subtropical areas of Japan. Int. J. Syst. Evol. Microbiol. 2003, 53, 711–720. [Google Scholar] [CrossRef]
  38. Jiang, S.; Cai, L.; Lv, L.; Li, L. Pediococcus pentosaceus, a future additive or probiotic candidate. Microb. Cell Factories 2021, 20, 45. [Google Scholar] [CrossRef] [PubMed]
  39. Song, A.A.-L.; In, L.L.A.; Lim, S.H.E.; Rahim, R.A. A review on Lactococcus lactis: From food to factory. Microb. Cell Factories 2017, 16, 55. [Google Scholar] [CrossRef] [PubMed] [Green Version]
  40. Palles, T.; Beresford, T.; Condon, S.; Cogan, M.T. Citrate Metabolism in Lactobacillus plantarum. J. Appl. Microbiol. 1998, 85, 147–154. [Google Scholar] [CrossRef]
  41. Parsaeimehr, M.; Khazaei, M.; Jebellijavan, A.; Staji, H. The Isolation and Identification of Dominant Lactic Acid Bacteria by the Sequencing of the 16S rRNA in Traditional Cheese (Khiki) in Semnan, Iran. J. Human, Environ. Health Promot. 2019, 5, 15–20. [Google Scholar] [CrossRef] [Green Version]
  42. Vermote, L.; Verce, M.; De Vuyst, L.; Weckx, S. Amplicon and shotgun metagenomic sequencing indicates that microbial ecosystems present in cheese brines reflect environmental inoculation during the cheese production process. Int. Dairy J. 2018, 87, 44–53. [Google Scholar] [CrossRef]
  43. Escobar-Zepeda, A.; Sanchez-Flores, A.; Quirasco Baruch, M. Metagenomic analysis of a Mexican ripened cheese reveals a unique complex microbiota. Food Microbiol. 2016, 57, 116–127. [Google Scholar] [CrossRef]
Figure 1. Location of the municipalities where the samples of colonial artisanal cheese were collected. The municipal data source was taken from the Brazilian Institute of Geography and Statistics (IBGE, 2021) and the map was modeled in QGIS 3.4 software. Low altitude references (<150 m): Arroio do Meio—AM (54 m), Encantado—EN (58 m), Lajeado—LJ (34 m), Muçum—MU (77 m), Roca Sales—RC (60 m); medium (>150 and <350): Nova Bréscia—NB (313 m), Relvado—RV (297 m); high (>350 m): Anta Gorda—AG (411 m), Arvorezinha—AV (750 m), Doutor Ricardo—DR (499 m), Ilópolis—IL (786 m), Putinga—PT (435 m), Vespasiano Correa—VC (518 m).
Fermentation 09 00041 g001
Figure 2. Total bacterial abundance and pH variation of artisan cheeses with seven days of maturation. (A) Genus abundance; (B) species abundance in each genus. (All) represents the sum of all samples and the average pH value. The triangles indicate the pH values.
Fermentation 09 00041 g002
Figure 3. Abundance and distribution of species in seven-day aged artisanal cheese samples. (All) represents the sum of all samples.
Fermentation 09 00041 g003
Figure 4. Phylogenetic relationships between the sequences obtained in the metagenomic sequencing detected by the phylogenetic marker located in the V3–V4 region of the 16S rRNA gene. The sequences of the isolates were compared using the neighbor joining method and visualized graphically in FigTree software.
Fermentation 09 00041 g004
Figure 5. Phylogenomic tree analysis and heat map of the most abundant species in the samples. One sequence from each of the most abundant species was selected from the 13 artisanal cheese samples. Comparisons between the variable content of all strains were plotted as percentages of similarity on the heat map using Gegenees. The percent similarity was used to generate a phylogenomic tree with FigTree. The numbers 2 to 72 (left corner and at the top) represent the selected species. The number 1 is a yeast species that was used as an outgroup. The percentages were plotted with a spectrum ranging from red (low similEEarity) to green (high similarity).
Fermentation 09 00041 g005
Figure 6. The abundance of species from different altitudes. The classification of altitude into low (up to 150 m), medium (>150 and <350 m), and high (>350 m) was based on the average altitude of the state of Rio Grande do Sul State (206 m). Source: https://pt-br.topographic-map.com/map-pb651/Rio-Grande-do-Sul/, accessed on 14 October 2022.
Fermentation 09 00041 g006
Figure 7. Representation of the samples grouped by PCA in Cartesian quadrants. The groups of samples are colored according to the different regions (altitudes) where they are produced, that is, pink (low), blue (medium), and green (high).
Fermentation 09 00041 g007
Figure 8. Abundance of bacterial groups from different altitudes employing the VITCOMIC circular diagram. Presence of LAB at low altitude (up to 150 m), medium (>150 and <350 m), and high (>350 m) was derived from the average altitude of Rio Grande do Sul State (206 m).
Fermentation 09 00041 g008
Table 1. Diversity and abundance of bacterial species present in artisanal cheese samples (n = 13).
PhylumClassOrderFamilyGenusSpecieMunicipalityBac Total (%) *LAB Total (%) **
FirmicutesBacilliLactobacillalesEnterococcaceaeBavariicoccusBavariicoccus seileriAV, MU, PT, RC, VC0.2700.449
EnterococcusEnterococcus casseliflavusAG, EN, IL, MU, PT, RC, VC0.0140.023
E. devrieseiAM, EN, MU, NB, VC0.0350.058
E. duransAM, AG, EN, MU, RC, VC0.0600.099
E. faeciumEN, MU, RC0.0030.005
E. gilvusMU0.0030.005
E. hiraeEN, MU, RC0.0020.002
E. italicusAG, AV, EN, IL, LA, MU, NB, RV, RC, VC1.3512.251
E. lactisMU, RC0.0020.002
E. malodoratusVC0.0030.005
E. pseudoaviumAM, EN, MU, RC, VC0.0550.092
E. saccharolyticusEN, MU, RC, VC0.0220.036
E. sulfureusVC0.0010.002
E. thailandicusMU, RC0.0250.041
E. villorumMU, RC0.0020.002
E. sp.AM, AG, AV, EN, DR, LA, MU, PT, RC VC6.10210.168
LactobacillaceaeLactobacillusLactobacillus brevisVC0.0030.005
L. caseiAG, CR, MU, RV, RC, VC0.0260.043
L. crispatusAG, AV, IL, RC, VC0.0040.006
L. curvatusMU, NB, VC0.0300.050
L. delbrueckiiNB, RV0.0060.010
L. helveticusNB, RV, VC0.2170.361
L. kefiranofaciensDR, PT0.0050.008
L. plantarumVC0.1210.201
L. uvarumMU, RC0.0090.014
PediococcusPediococcus pentosaceusVC0.0020.003
StreptococcaceaeLactococcusLactococcus garvieaeAM, AG, AV, EN, DR, IL, LA, MU, NB, PT, RV, RC, VC1.0781.797
L. lactisAM, AG, AV, EN, DR, IL, LA MU, NB, PT, RV, RC, VC47.04178.383
L. pisciumIL0.0010.002
L. plantarumEN, IL, LA, NB,1.0681.779
L. raffinolactisAM, AG, AV, EM, DR, IL, LA, MU, NB, PT, RV, RC1.3502.250
LeuconostocaceaeLeuconostocLeuconostoc citreumIL, LA, MU, RV, RC, VC0.0320.053
L. lactisAV, LA, MU0.0590.098
L. mesenteroidesAG, AV, EN, DR, IL, LA, MU, NB, RV, RC, VC0.9801.632
L. pseudomesenteroidesAG, EN, LA, MU, RC, VC0.0210.034
CarnobacteriaceaeMarinilactibacillusMarinilactibacillus psychrotoleransMU0.0100.016
* Abundance relative to total OTUs (n = 424,361) of total bacteria in the 13 samples. ** Abundance relative to total OTUs (n = 254,678) of lactic acid bacteria in the 13 samples.
Disclaimer/Publisher’s Note: The statements, opinions and data contained in all publications are solely those of the individual author(s) and contributor(s) and not of MDPI and/or the editor(s). MDPI and/or the editor(s) disclaim responsibility for any injury to people or property resulting from any ideas, methods, instructions or products referred to in the content.

