Article

Improved Tolerance of Lactiplantibacillus plantarum in the Presence of Acid by the Heterologous Expression of trxA from Oenococcus oeni

1
Shandong Provincial Engineering and Technology Research Center for Wild Plant Resources Development and Application of Yellow River Delta, College of Biological and Environmental Engineering, Binzhou University, Binzhou 256600, China
2
Key Laboratory of Quality and Safety of Wolfberry and Wine for State Administration for Market Regulation, Ningxia Food Testing and Research Institute, Yinchuan 750004, China
3
College of Food Science and Engineering, Gansu Agricultural University, Lanzhou 730070, China
*
Authors to whom correspondence should be addressed.
Fermentation 2022, 8(9), 452; https://doi.org/10.3390/fermentation8090452
Submission received: 19 August 2022 / Revised: 6 September 2022 / Accepted: 8 September 2022 / Published: 11 September 2022
(This article belongs to the Topic Food Processing and Preservation)

Abstract

:
Oenococcus oeni is the main microorganism that undergoes malolactic fermentation (MLF) in the winemaking industry due to its excellent adaptability to harsh wine environments. The start of MLF is often delayed or even fails, and low pH appears to be a crucial parameter. To study the function of the trxA gene in acid stress, a plasmid containing the trxA gene of O. oeni SD-2a was heterologously expressed in Lactiplantibacillus plantarum WCFS1. The recombinant strain (WCFS1-trxA) grew better than the control strain (WCFS1-Vector) under acid stress. The expression of thioredoxin system genes was much higher in the recombinant strain compared with the control strain under acid stress. In addition, a series of physiological and biochemical assays were conducted. The ATP content was lower in the recombinant strain, while the cell membrane fluidity and integrity improved in the recombinant strain. Moreover, reactive oxygen species (ROS) accumulation, intracellular GSH level, and superoxide dismutase (SOD) activity assays showed that the recombinant strain decreased the intracellular reactive oxygen species (ROS) accumulation by improving the SOD activity. In conclusion, heterologous expression of trxA improves the SOD activity of L. plantarum WCFS1, reducing bacterial ROS and increasing cell membrane fluidity and integrity, enhancing the tolerance of Lactiplantibacillus plantarum WCFS1 under acid stress.

1. Introduction

Malolactic fermentation (MLF) is essential in winemaking [1,2]. Successful MLF can convert the malic acid (dicarboxylic acid) into softer-tasting lactic acid (monocarboxylic acid) and carbon dioxide. Thus, the acidity of the wine is reduced, and the microbial stability is improved [3]. In addition, MLF can change the aroma structure of wine, increase the fruity aroma of the wine, and enrich the structure of wine [4]. Therefore, MLF is considered to be a necessary step in the production of high-quality red wine.
The strains that initiate MLF are mainly distributed in Lactobacillus, Lactiplantibacillus, Pediococcus, Leuconostoc, and Oenococcus [5,6]. Among them, O. oeni is the main initiator of MLF [7]. In the process of MLF, the growth and reproduction of these microorganisms will be inhibited by various physical and chemical properties of wine. The four main factors affecting the progress of malolactic fermentation in wine are low pH (3.0–3.5), ethanol (10–16% v/v), SO2 (over 10 mg/L), and low temperature (possibly below 12 °C) [8,9].
Currently, there are no efficient gene function research tools for O. oeni, such as gene overexpression or gene knockout, which makes the research progress for the O. oeni gene function relatively slow [10,11]. More researchers are directing their attention to the use of Lactiplantibacillus plantarum to study the role of exogenous genes, as it is easy to operate genetic transformation technologies in this species. To date, researchers have successfully expressed the mle, hsp18, argG, puuE, and ctsR genes derived from O. oeni in L. plantarum and verified the function of these stress-related genes from O. oeni using L. plantarum [12,13,14,15,16]. Until now, there has been no report on the regulation of the trxA gene from O. oeni on the stress tolerance to L. plantarum.
TrxA is thioredoxin, which is involved in intracellular redox balance, and is induced with mild ethanol stress [17,18]. Margalef-Catala et al. reported that there were three thioredoxin genes (trxA1, trxA2, and trxA3) in the genome of Oenococcus oeni PSU-1 [19]. Additionally, the trxA1 gene in O. oeni was horizontally transferred from Lactobacillus [19]. Our previous study showed that O. oeni SD-2a has only two trxA genes [2]. One trxA gene was significantly expressed with either acid or ethanol stress pretreatments, and with the increasing intensity of acid or ethanol stresses, the expression level of the trxA gene was increasingly overregulated [20]. To investigate the role of this trxA under acid stress conditions, the trxA gene was amplified from O. oeni SD-2a and heterologously expressed in L. plantarum WCFS1. The expression of thioredoxin system (Trx system) genes, the growth curve, a series of physiological and biochemical assays including the cell membrane integrity, reactive oxygen species (ROS) accumulation, intracellular ATP and GSH level, and superoxide dismutase (SOD) activity were also determined in the recombinant strain (WCFS1-trxA) and the control strain (WCFS1-Vector) under acid stress to investigate the mechanism of trxA gene improving acid stress tolerance.

2. Materials and Methods

2.1. Strains, Growth Conditions, and Plasmids

O. oeni SD-2a was screened from the Shandong wine region, preserved at the China General Microbiological Culture Collection Center (CGMCC 0715, Beijing, China), and grown at 28 °C in FMATB medium [19,21]. The cloning host, Escherichia coli DH5α, was grown at 37 °C in Luria–Bertani medium with 200 μg/mL erythromycin (Solarbio, Beijing, China) when appropriate. L. plantarum WCFS1 was grown at 37 °C in de Man–Rogosa–Sharp (MRS) broth [22] and supplemented with 100 μg/mL erythromycin when necessary. Agar plates were also prepared with MRS or LB media containing agar (10 g/L) supplemented with 100 μg/mL erythromycin. All strains and plasmids employed in this study are listed in Table 1.

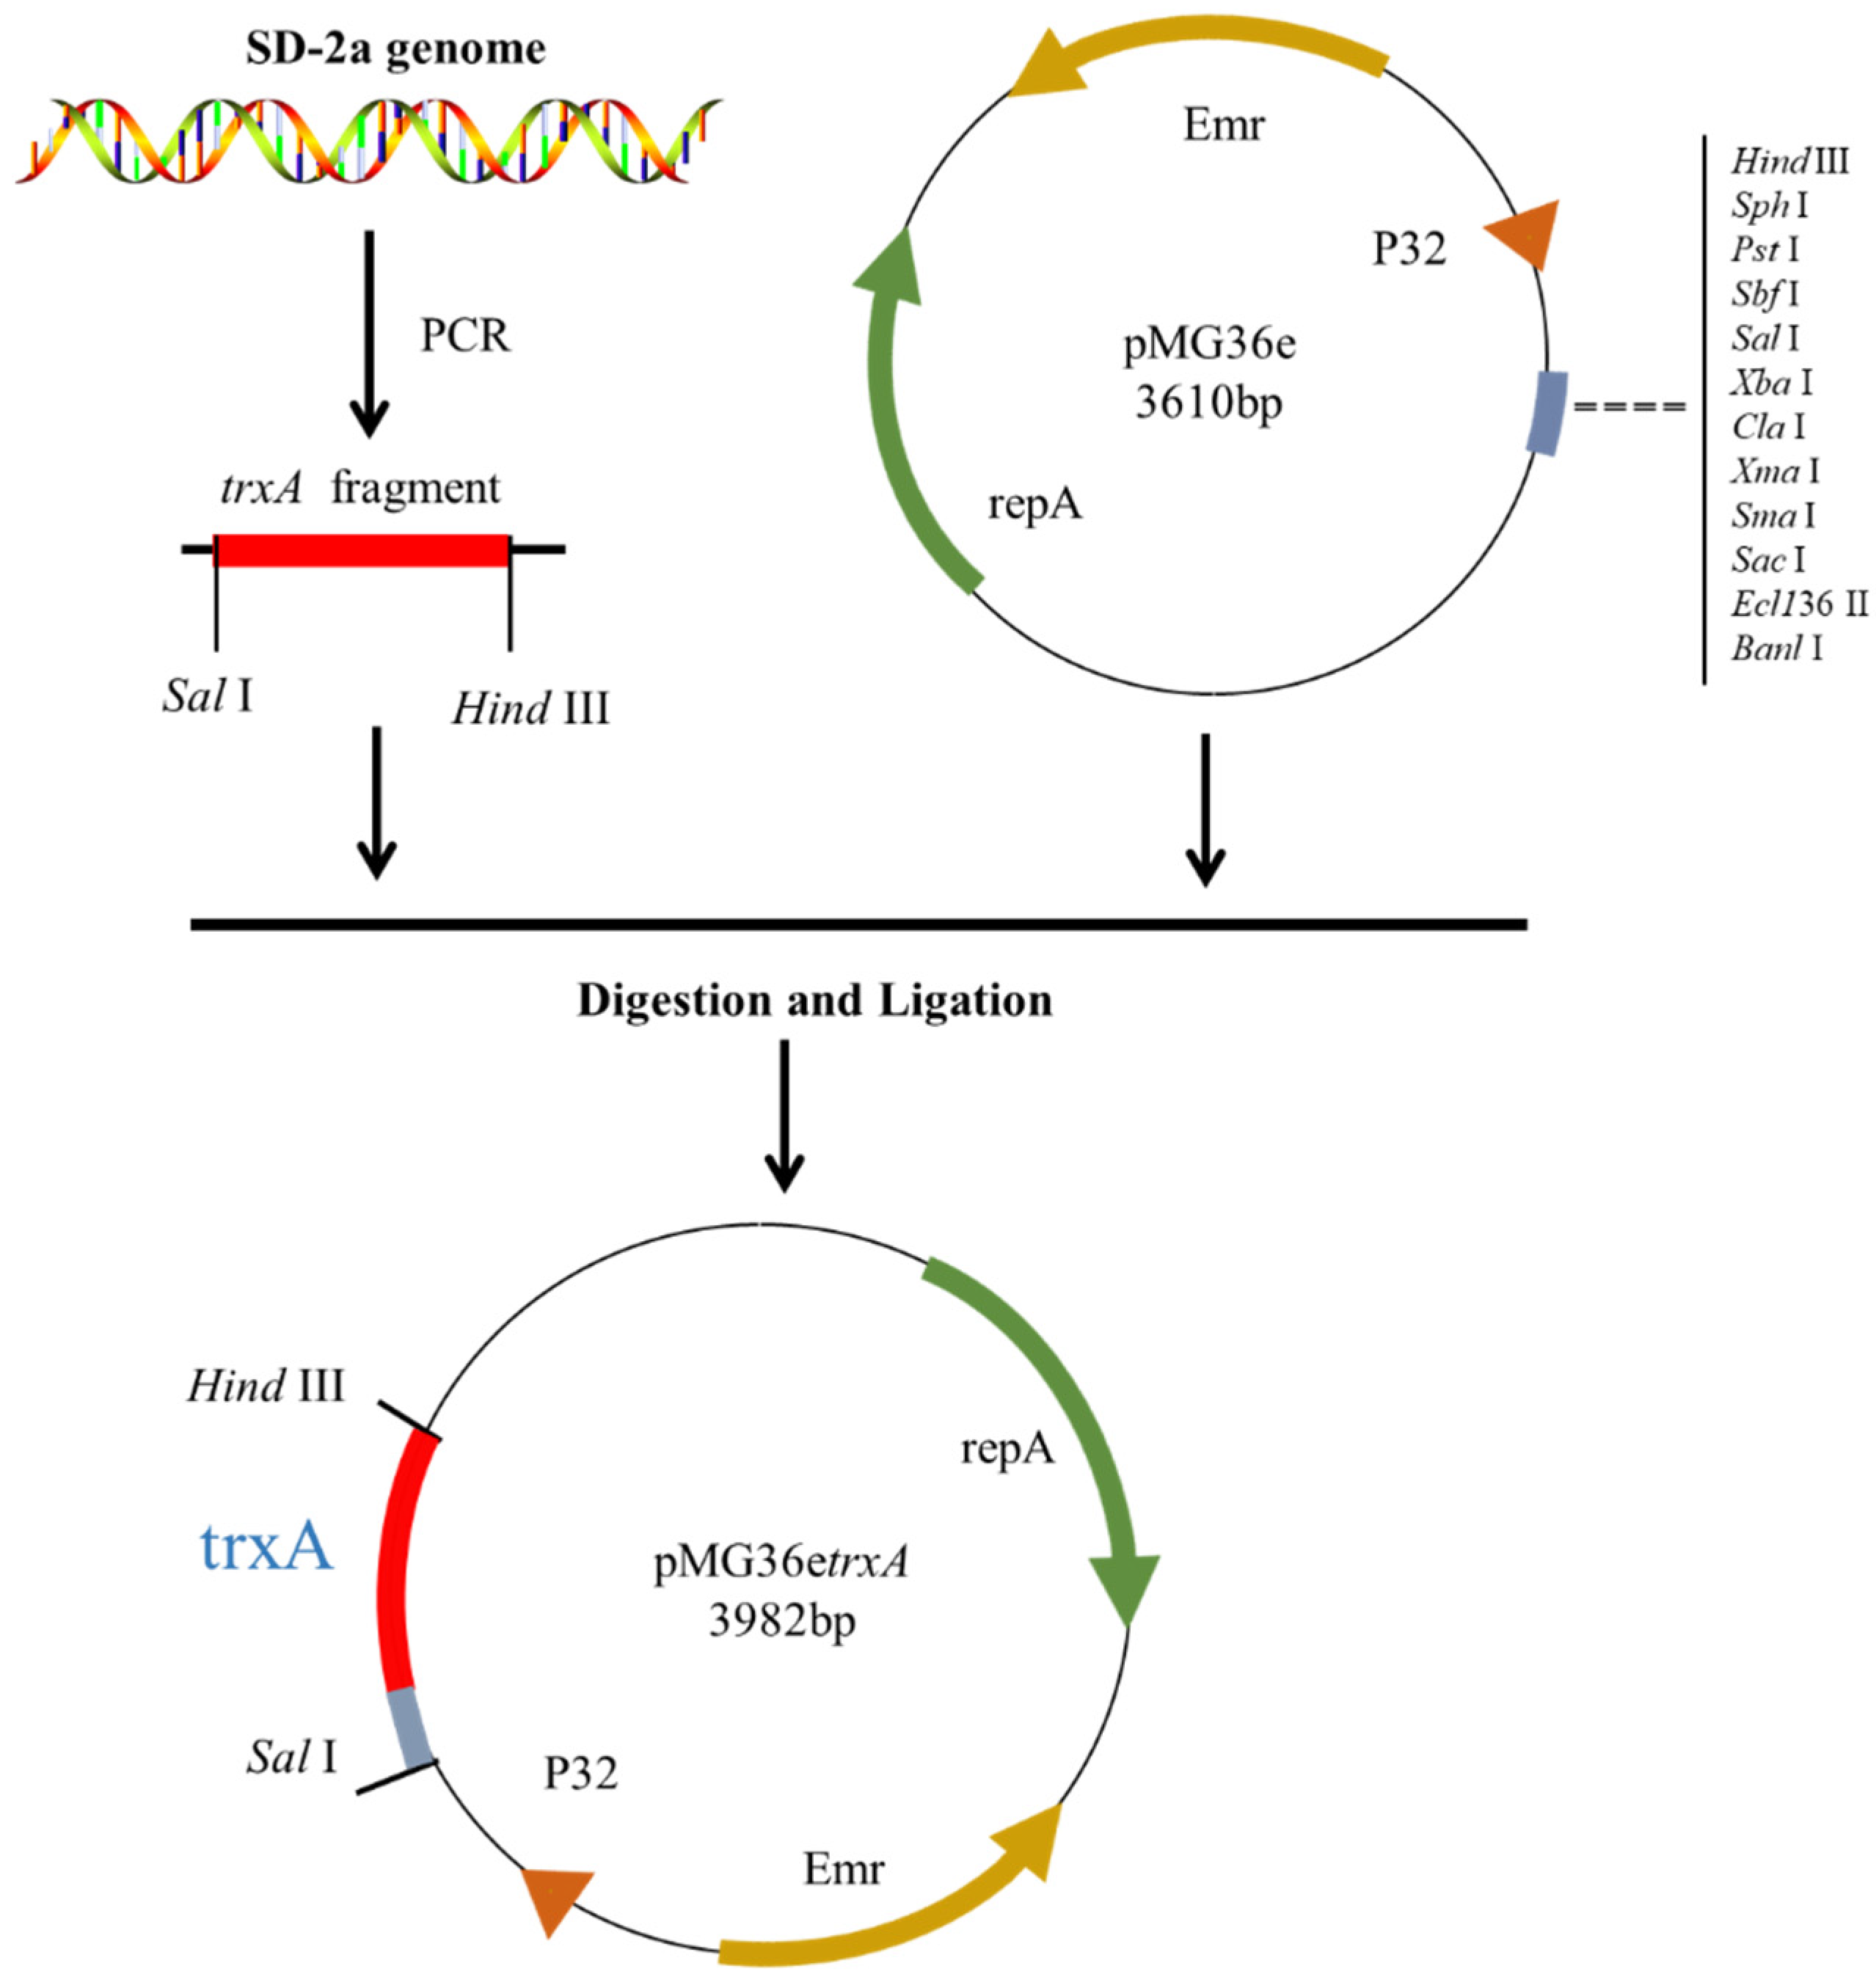
2.2. Plasmid Construction and Transformation

The construction of the expression plasmids is illustrated in Figure 1. The trxA gene was amplified from genomic DNA using primers 5′-GCGTCGACAGAGAAGGAGGAATTATATGGCAAT-3′ and 5′-CCAAGCTTCAGGCTTTTCTTCAATAAAGTATAT-3′; the Hind III and Sal I (underline) were introduced into the amplified gene. The methods of plasmid construction were adopted from reference [12]. The recombinant plasmid was verified by sequencing and named pMG36etrxA; then, it was transformed into L. plantarum WCFS1 by electroporation transformation [12], and these transformants were designated WCFS1-trxA.

2.3. Stress Challenges and the Growth Performance

WCFS1-Vector (L. plantarum WCFS1-pMG36e) and WCFS1-trxA were cultured overnight in MRS media; then, they were transferred (1%, v/v) into fresh MRS media and grown until the OD600nm reached 1.0. To assess the growth performance of both strains, the growth curve was conducted by measuring the absorbance at 600 nm every 4 h under standard MRS (pH 6.3) and acid-stress MRS (from pH 3.2 to pH 4.0, gradient 0.2) medium, with the same inoculum (1%, v/v). The pH of the MRS media was adjusted by 1 M HCl using a pH meter (INESA Scientific Instrument Co., Ltd., Shanghai, China), and 100 μg/mL erythromycin was added to all cultures.

2.4. ROS Accumulation and Membrane Integrity Evaluation

After analyzing the growth performance of the WCFS1-Vector and WCFS1-trxA under acid stress, pH 3.6 was selected to determine the physiological assays. The WCFS1-Vector and WCFS1-trxA cells were collected from an MRS medium (pH 3.6) at the log phase by centrifugation; then, they were washed twice with 10 mM phosphate buffer (PBS, pH 7.0) and resuspended in PBS. The suspension was used to determine the following physiological assays. According to Zhang et al., the oxidant-sensitive probe 2′,7′-dichlorofluorescin diacetate (DCFH-DA) method was adopted to measure the ROS accumulation of strains [23]. The cell suspension was added to 10 µM DCFH-DA and then incubated at 37 °C for 30 min. Fluorescence intensity was measured at λEX 485 nm and λEM 525 nm using a full-wavelength multifunctional microplate reader (Tecan, Männedorf, Switzerland). A positively charged fluorescent nucleic acid dye, propidium iodide (PI), was used to determine the membrane integrity and was used to stain cells with compromised membranes [24]. The samples were collected, washed, and resuspended as previously described; then, they were mixed with 15 μM PI and cultured at 37 °C in the dark for 20 min. Fluorescence intensity was measured at λEX 488 nm and λEM 630 nm using the microplate reader. Values were expressed as the fluorescence intensity per OD600nm.

2.5. Measurement of Cell Membrane Fluidity

The fluorescence anisotropy was measured with 5 µM DPH (1,6-diphenyl-1,3,5-hexatriene), at λEX 360 nm and λEM 430 nm (5 nm slits). The degree of fluorescence polarization (p) and anisotropy (r) were calculated according to reference [25].

2.6. Intracellular ATP Production, Superoxide Dismutase Activity, and Glutathione Concentration

The ATP Content Assay Kit (Solarbio, Beijing, China) was adopted to measure the intracellular ATP levels according to the manufacturer’s instructions. A colorimetric method was employed to measure the total superoxide dismutase (SOD) activity using the Superoxide Dismutase Assay Kit with WST-8 (Beyotime, Shanghai, China). One unit of SOD activity was defined as the amount of enzyme required to decrease 50% of WST-8 formazan formation. The Reduced Glutathione Assay Kit (Nanjing Jiancheng Bioengineering Institute, Nanjing, China) was used to measure the concentration of intracellular glutathione [26]. Additionally, a BCA Protein Assay Kit (Beyotime, Shanghai, China) was used to measure the protein concentration.

2.7. Real-Time Quantitative PCR

The Bacteria RNA Extraction Kit (Vazyme Biotech) and HiScript III 1st Strand cDNA Synthesis Kit (Vazyme Biotech) were used to extract RNA and reverse-transcribe it into complementary DNA. Real-time quantitative PCR (RT-qPCR) was performed on a Real-Time PCR Detection System (Thermo Fisher Scientific) using AceQ qPCR SYBR Green Master Mix (Vazyme Biotech). Relative expression levels were calculated by the 2−ΔΔCt method using 16S ribosomal RNA as the reference gene and WCFS1-Vector as the control strain [12]. The sequences of the forward and reverse primers used for analysis are listed in Table S1.

2.8. Statistical Analysis

All experiments were performed in triplicate. ROS accumulation, membrane integrity evaluation, intracellular ATP production, SOD activity, GSH concentration, and anisotropy were shown as means with standard deviations (SD). Statistical analysis was performed using the Student’s t-test with a significance of p < 0.05.

3. Results and Discussion

3.1. Heterologous Expression of pMG36etrxA in L. plantarum WCFS1

The sequences of the trxA fragments were amplified by PCR and then digested with SalI and HindIII enzymes. pMG36e plasmid was isolated from Escherichia coli DH5α and digested with the same restriction enzymes. Agarose gel electrophoresis was used to test the enzyme digestion effects. As shown in Figure S1a, a linearized DNA band of 3.6 kb indicated that the circular pMG36e plasmids had been digested completely. The band at 0.4 kb represented the digested trxA fragments. Agarose gel was cut at the position of the two strands, and the DNA fragments were then purified by a DNA recovery kit. T4 DNA ligase was then used to ligate the two bands. The resulting recombinant plasmid pMG36etrxA then formed and was transformed into E. coli DH5α. To identify positive clones that contained the resulting recombinant plasmid of pMG36etrxA, colony PCR was performed using primers pMG36e-F and pMG36e-R. As shown in Figure S1b, using positive clones as PCR templates can show a band of 1.0 kb in agarose gel (Figure S1b). Meanwhile, the results of the sequencing confirmed that the recombinant plasmid pMG36etrxA had successfully been expressed heterologously in DH5α. The pMG36etrxA was extracted from DH5α, transformed in WCFS1 by electroporation, and subjected to colony PCR analysis using the primers pMG36e-F and pMG36e-R to screen recombinant cells. The positive clones showed a band at 1.0 kb (Figure S1c). Meanwhile, the sequencing results confirmed that the recombinant plasmid pMG36etrxA had successfully expressed heterologously in WCFS1.

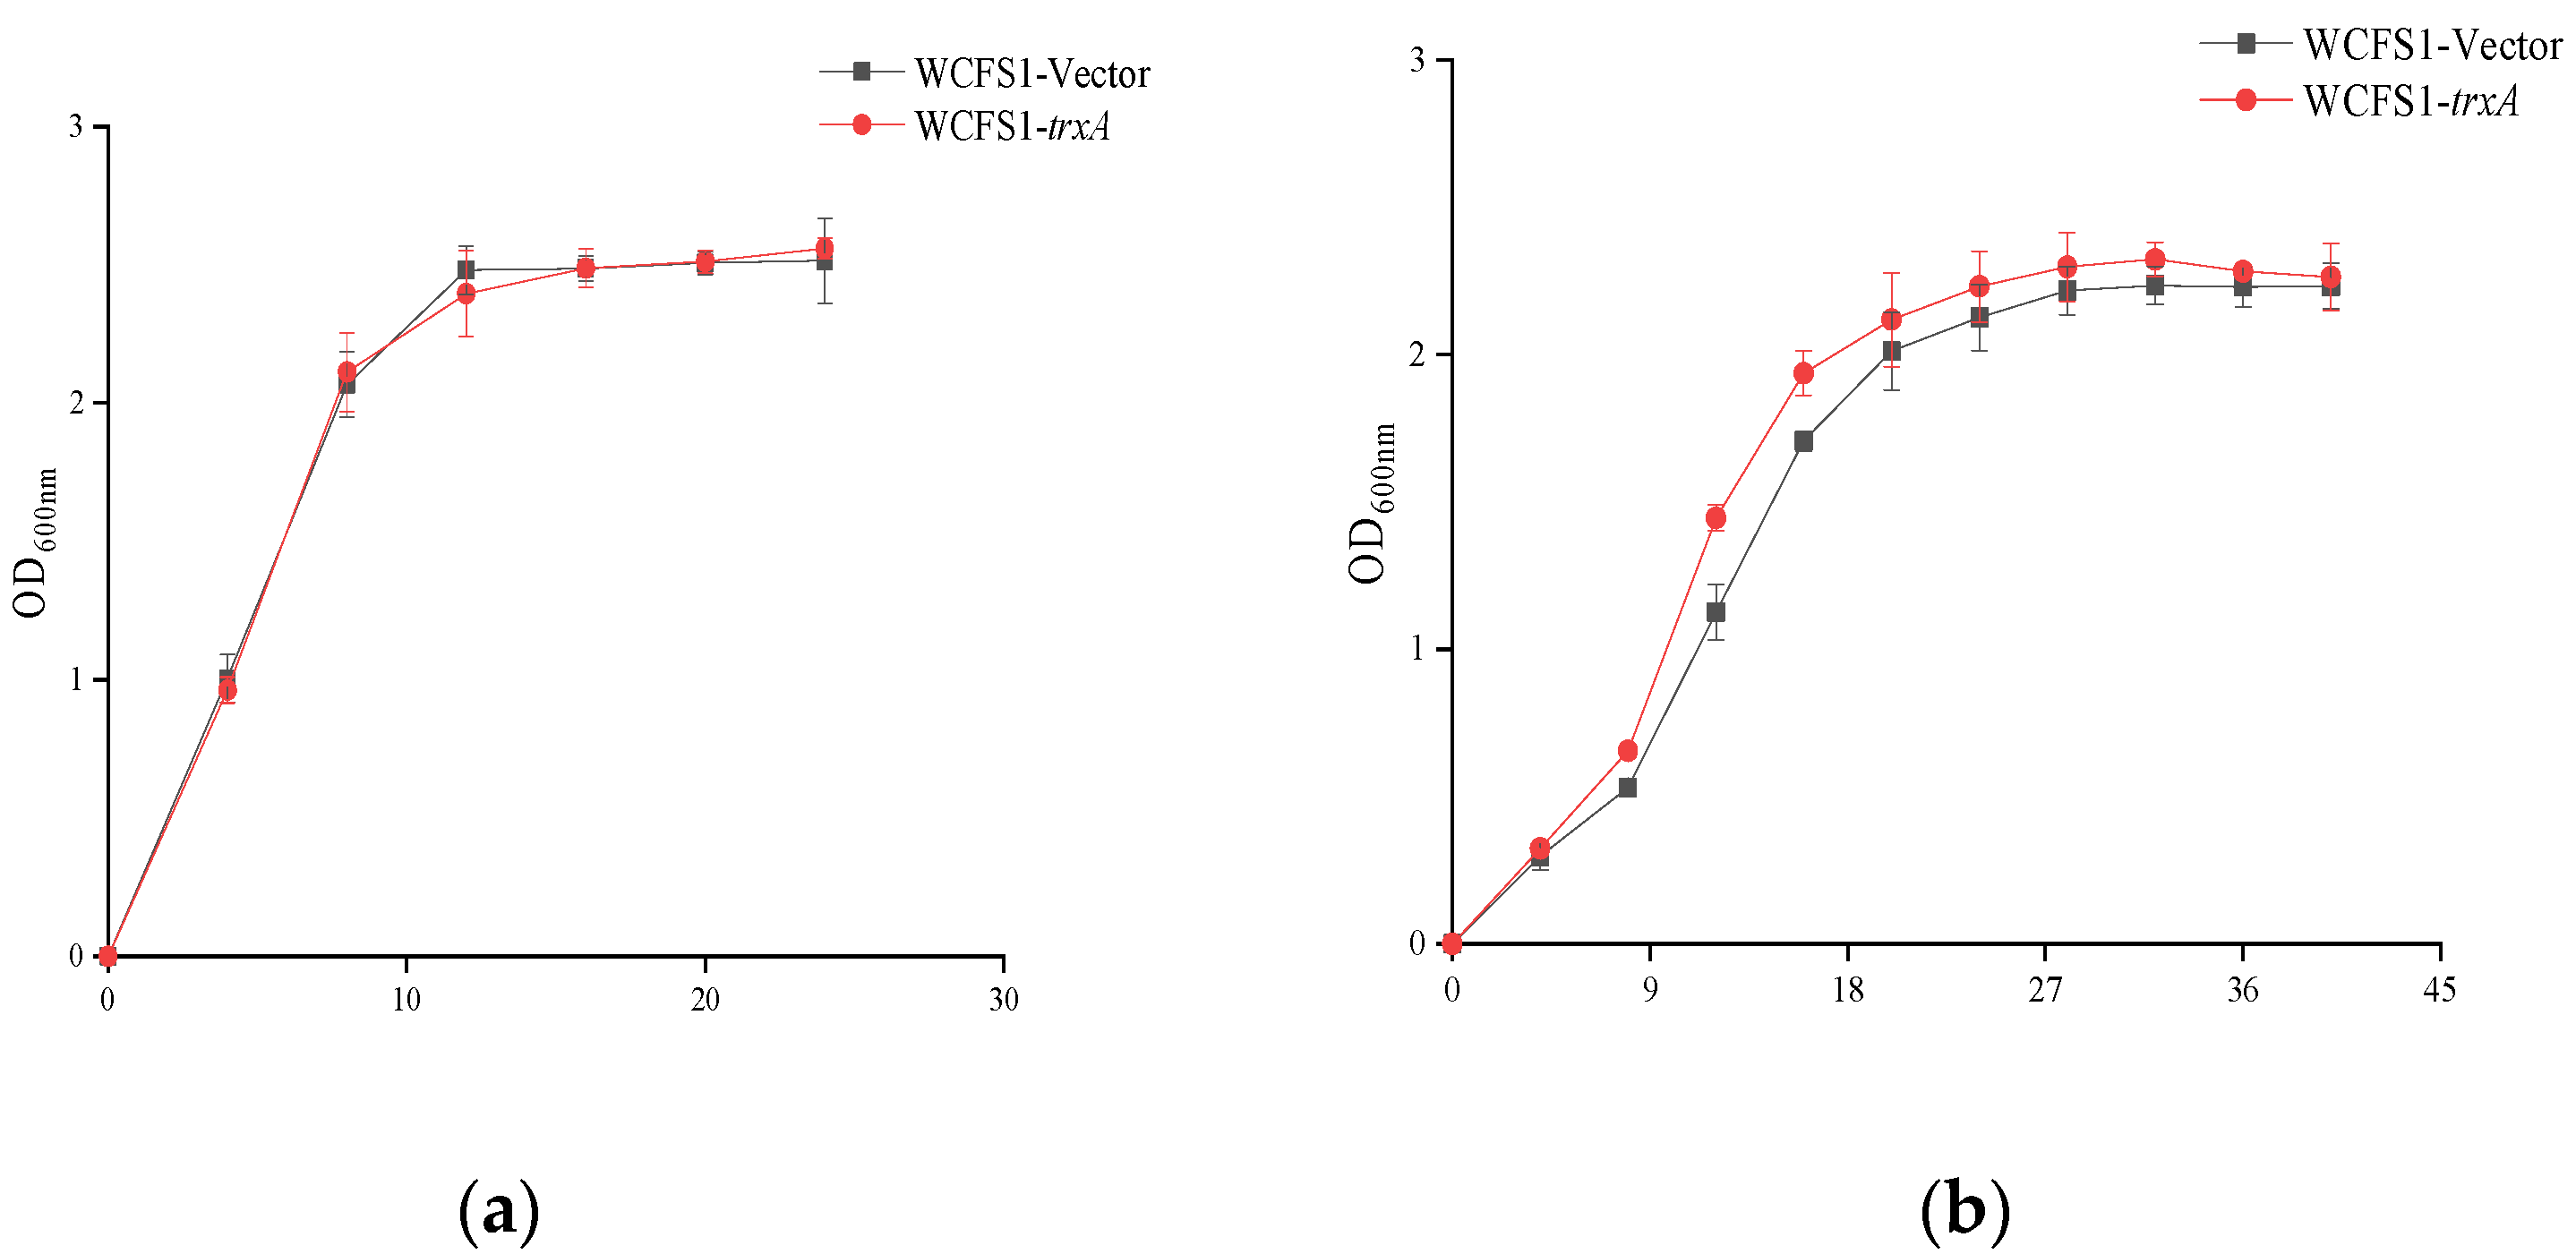
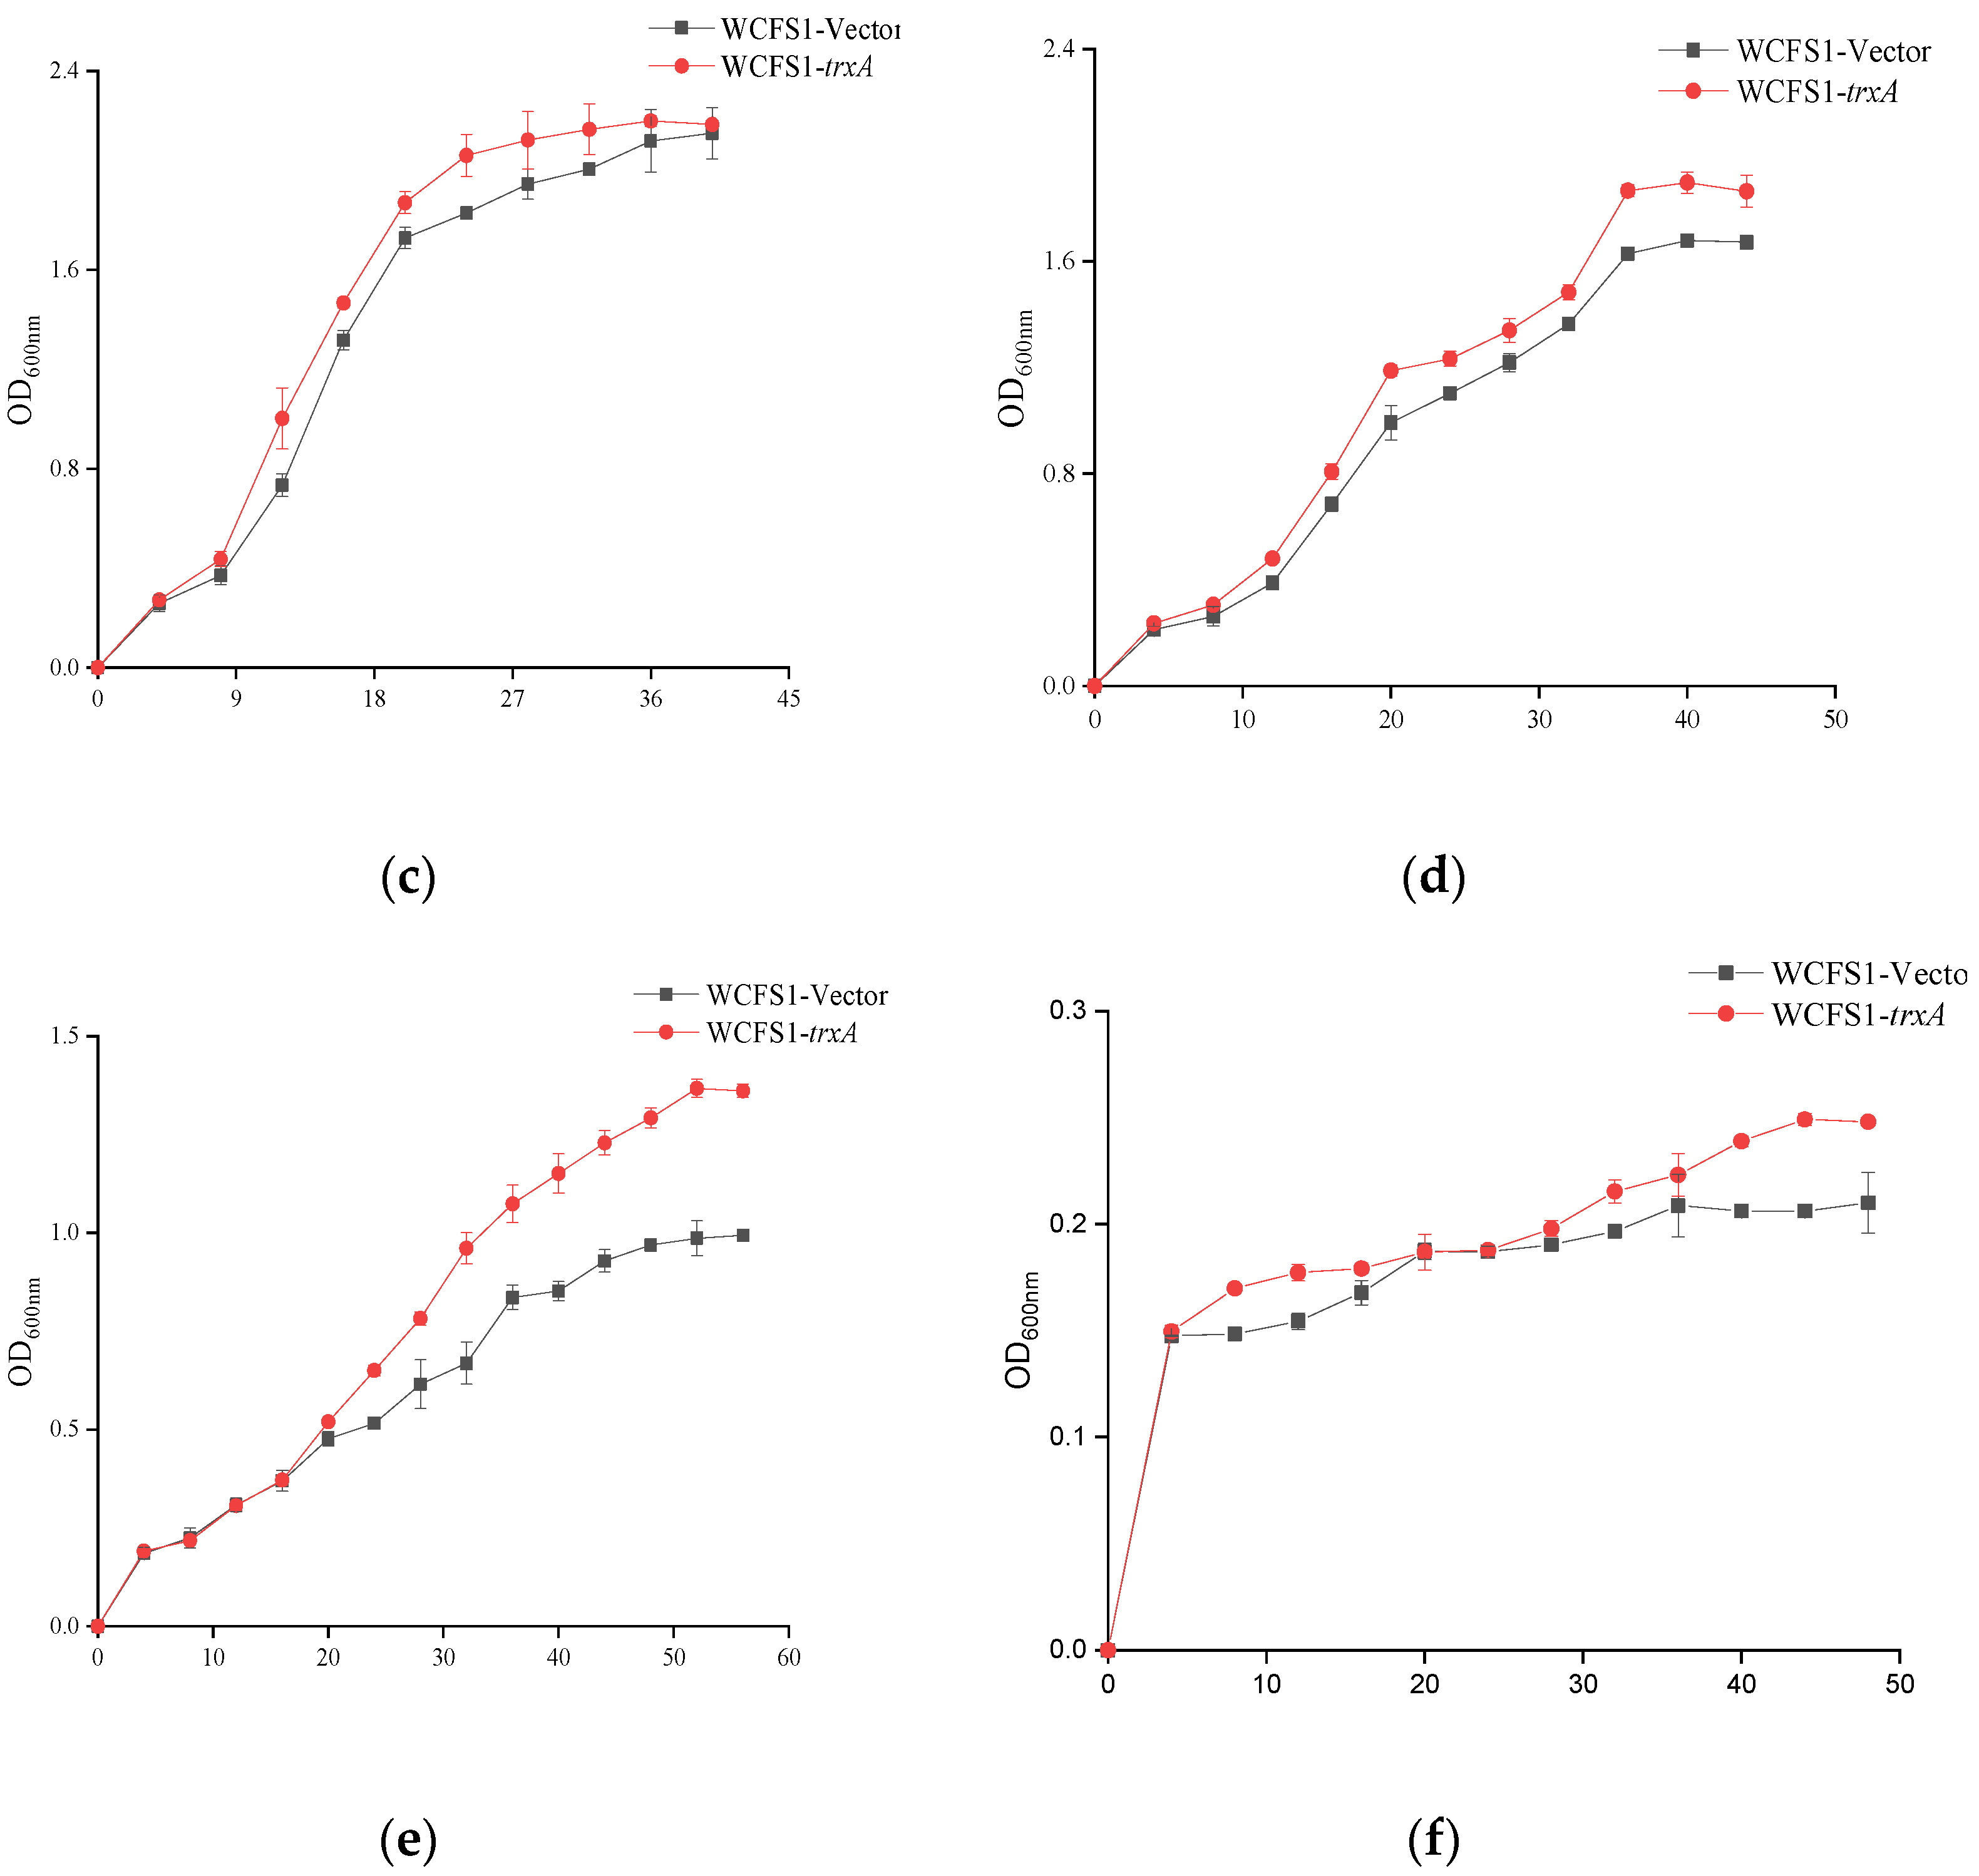
3.2. Improved Growth Ability of WCFS1-pMG36etrxA

The effects of heterologously expressed trxA on cell growth under acid stress were investigated. As illustrated in Figure 2a, heterologously expressed trxA did not influence the growth of L. plantarum WCFS1 under normal conditions (MRS media with pH 6.3) compared with the control strain WCFS1-Vector. Contrastingly, the heterologous expression of trxA improved cell growth when cells were exposed to acid stress, with a higher maximum OD600 nm value of WCFS1-trxA compared with the WCFS1-Vector (Figure 2b–f). These results demonstrated that the heterologous expression of trxA from O. oeni SD-2a enhances the tolerance of L. plantarum WCFS1 cells under acid stress.

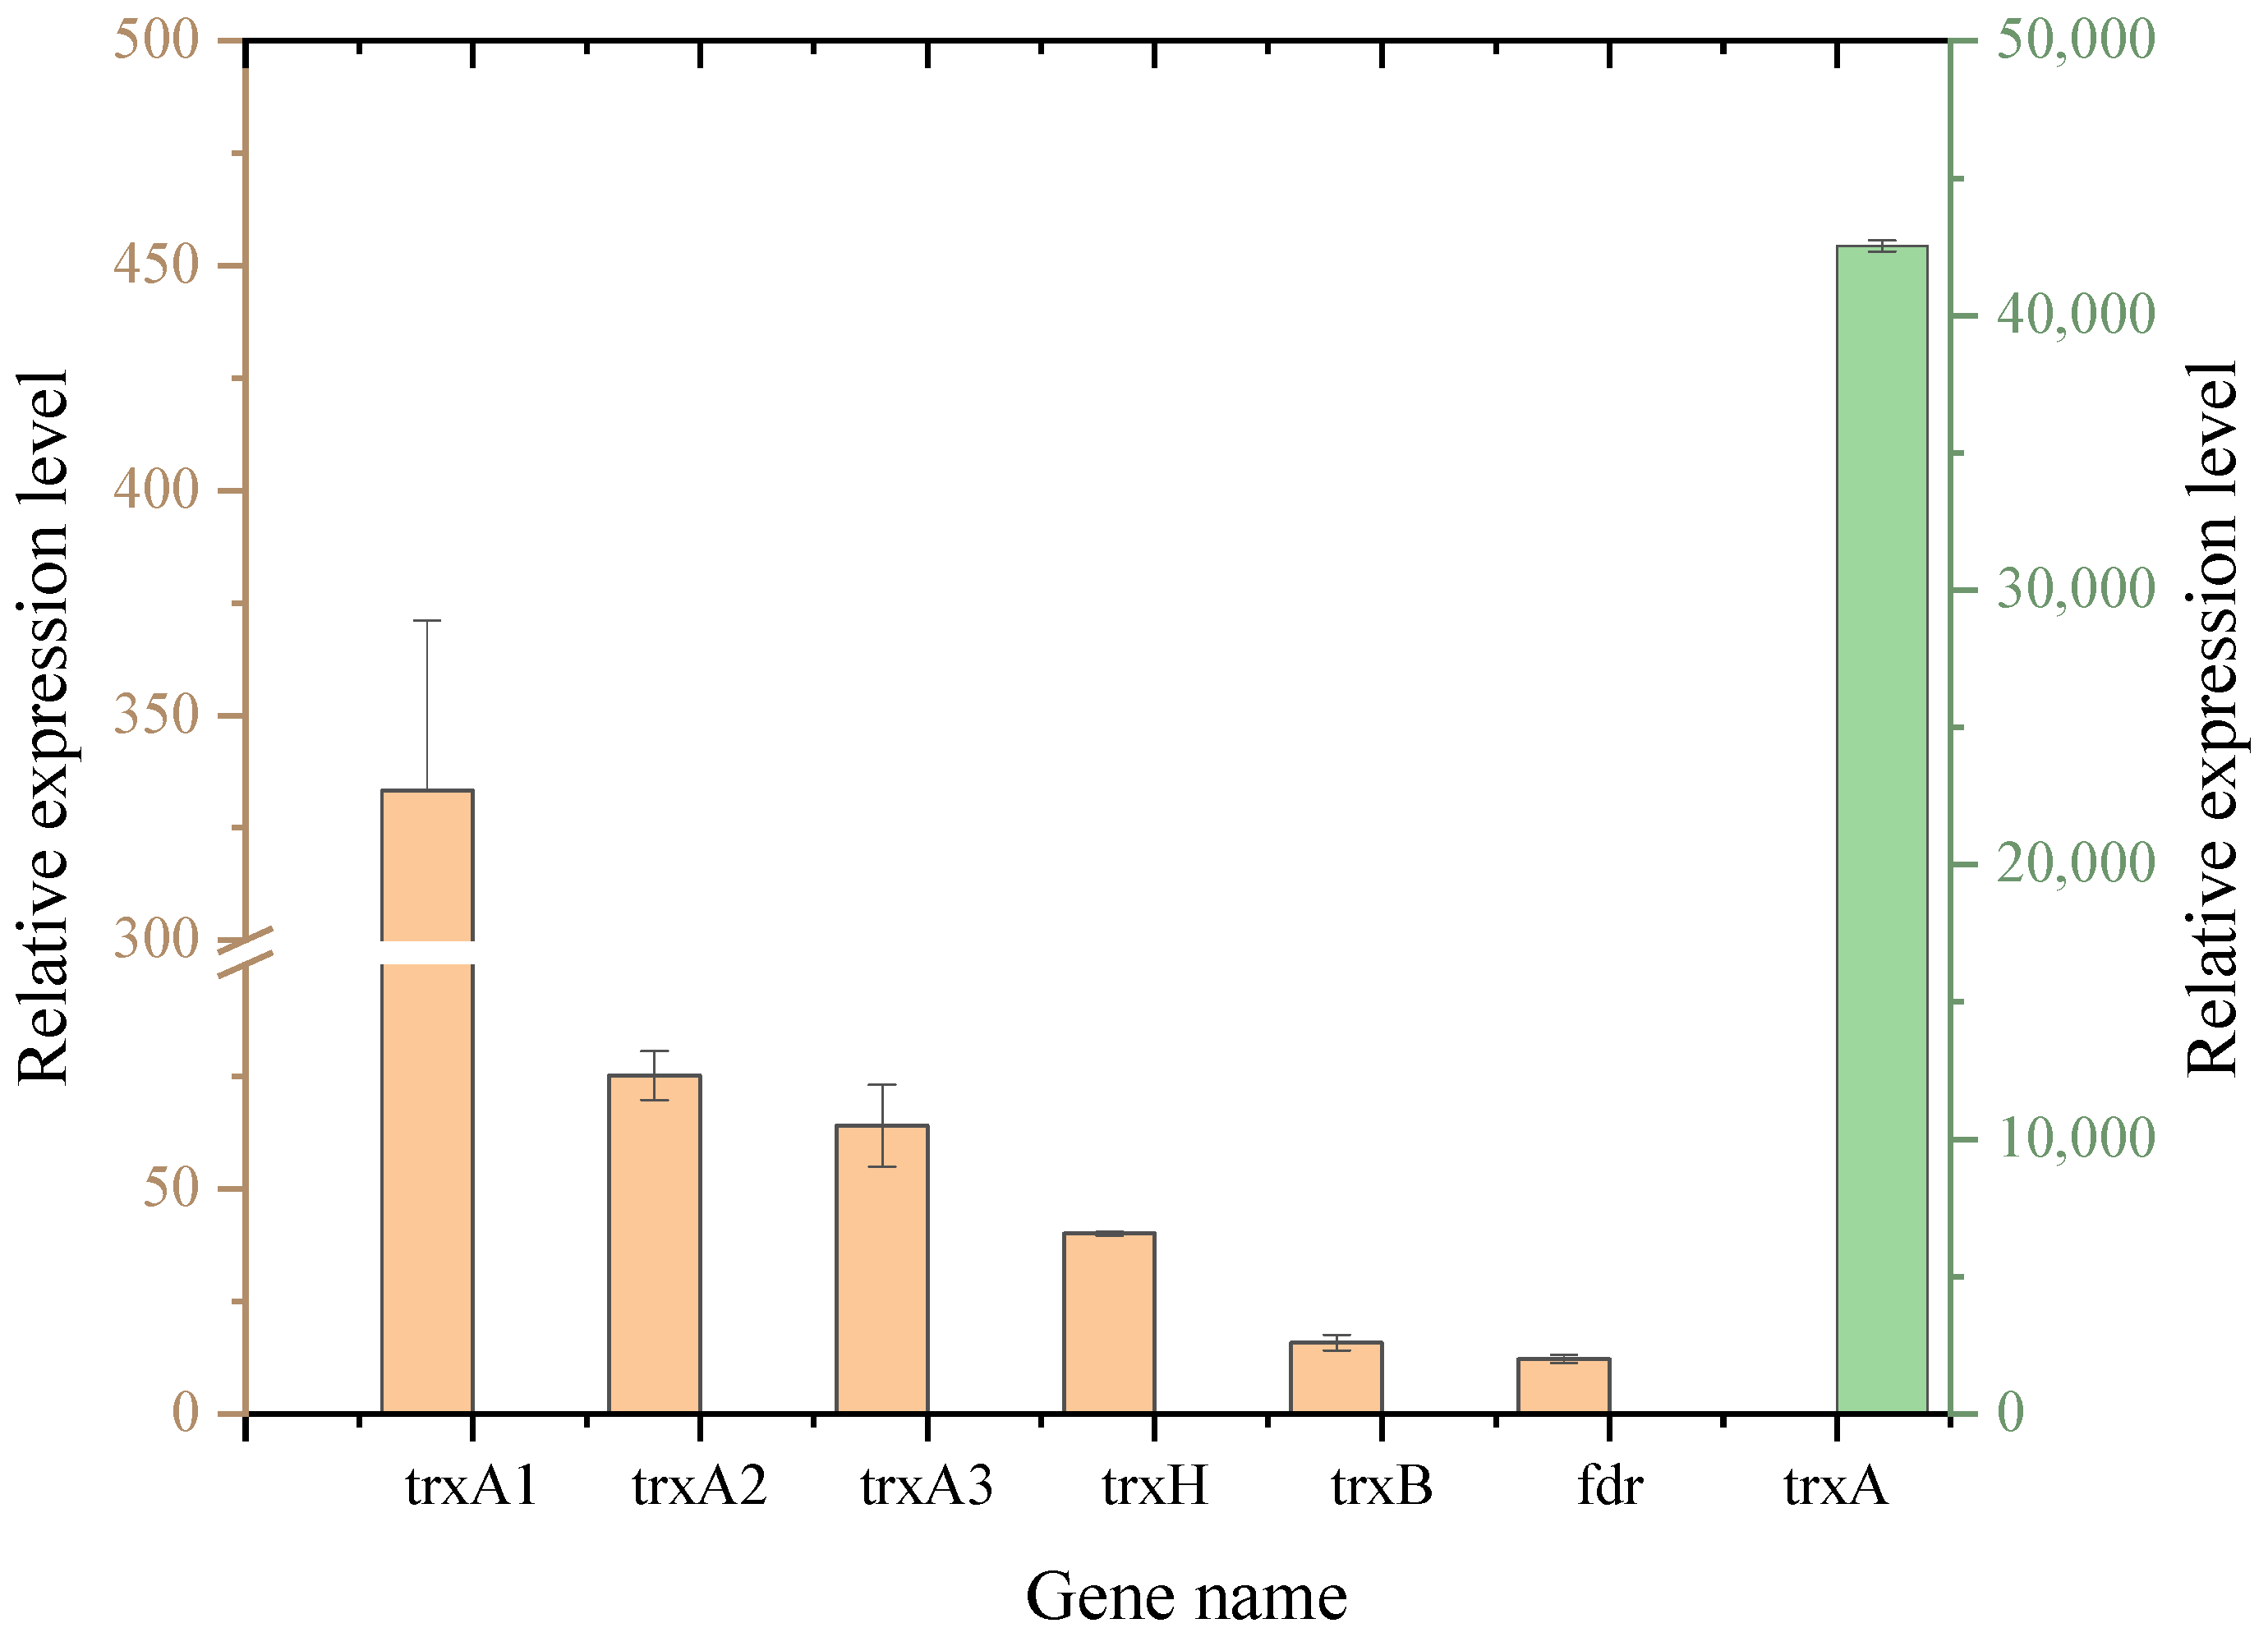
3.3. Heterologous Expression of trxA Affects the Transcription Levels of the Inherent Trx System Genes in L. plantarum WCFS1

Since the trxA gene often works with other Trx system genes and plays a central role in the Trx system, the expression levels of inherent Trx system genes in WCFS1-trxA and WCFS1-Vector were studied under acid stress (pH 3.6). A former study showed that in the L. plantarum WCFS1 genome, the Trx system had six ORFs: four thioredoxins genes (trxA1, trxA2, trxA3, and trxH), a thioredoxin reductase (trxB), and a ferredoxin NAD (P) reductase (fdr) [19]. This study calculated the expression levels of all the genes in WCFS1-trxA compared with control strain WCFS1-Vector under the same culture conditions. As shown in Figure 3, all Trx system gene expressions were significantly increased. Additionally, the trxA gene increased more than 40,000-fold in WCFS1-trxA compared with WCFS1-Vector, which indicated that the trxA gene derived from O. oeni SD-2a was successfully expressed in WCFS1-trxA, while it had almost no expression in the WCFS1-Vector. The expression levels of fdr, trxB, trxH, trxA3, trxA2, and trxA1 in WCFS1-trxA increased 12.18-, 15.79-, 40.14-, 64.11-, 75.28-, and 333.27-fold compared with those in the WCFS1-Vector, respectively. These results indicated that the heterologous expression of the trxA gene significantly increased the expression level of the inherent thioredoxin system genes in L. plantarum WCFS1 cells, conferring these cells with enhanced resistance to damage caused by acid stress. The heterologous expression of the O. oeni SD-2a trxA gene may affect the activity of the transcription regulator, which activates the transcription of inherent thioredoxin system genes in L. plantarum WCFS1. However, the specific mechanism of this phenomenon needs further study.

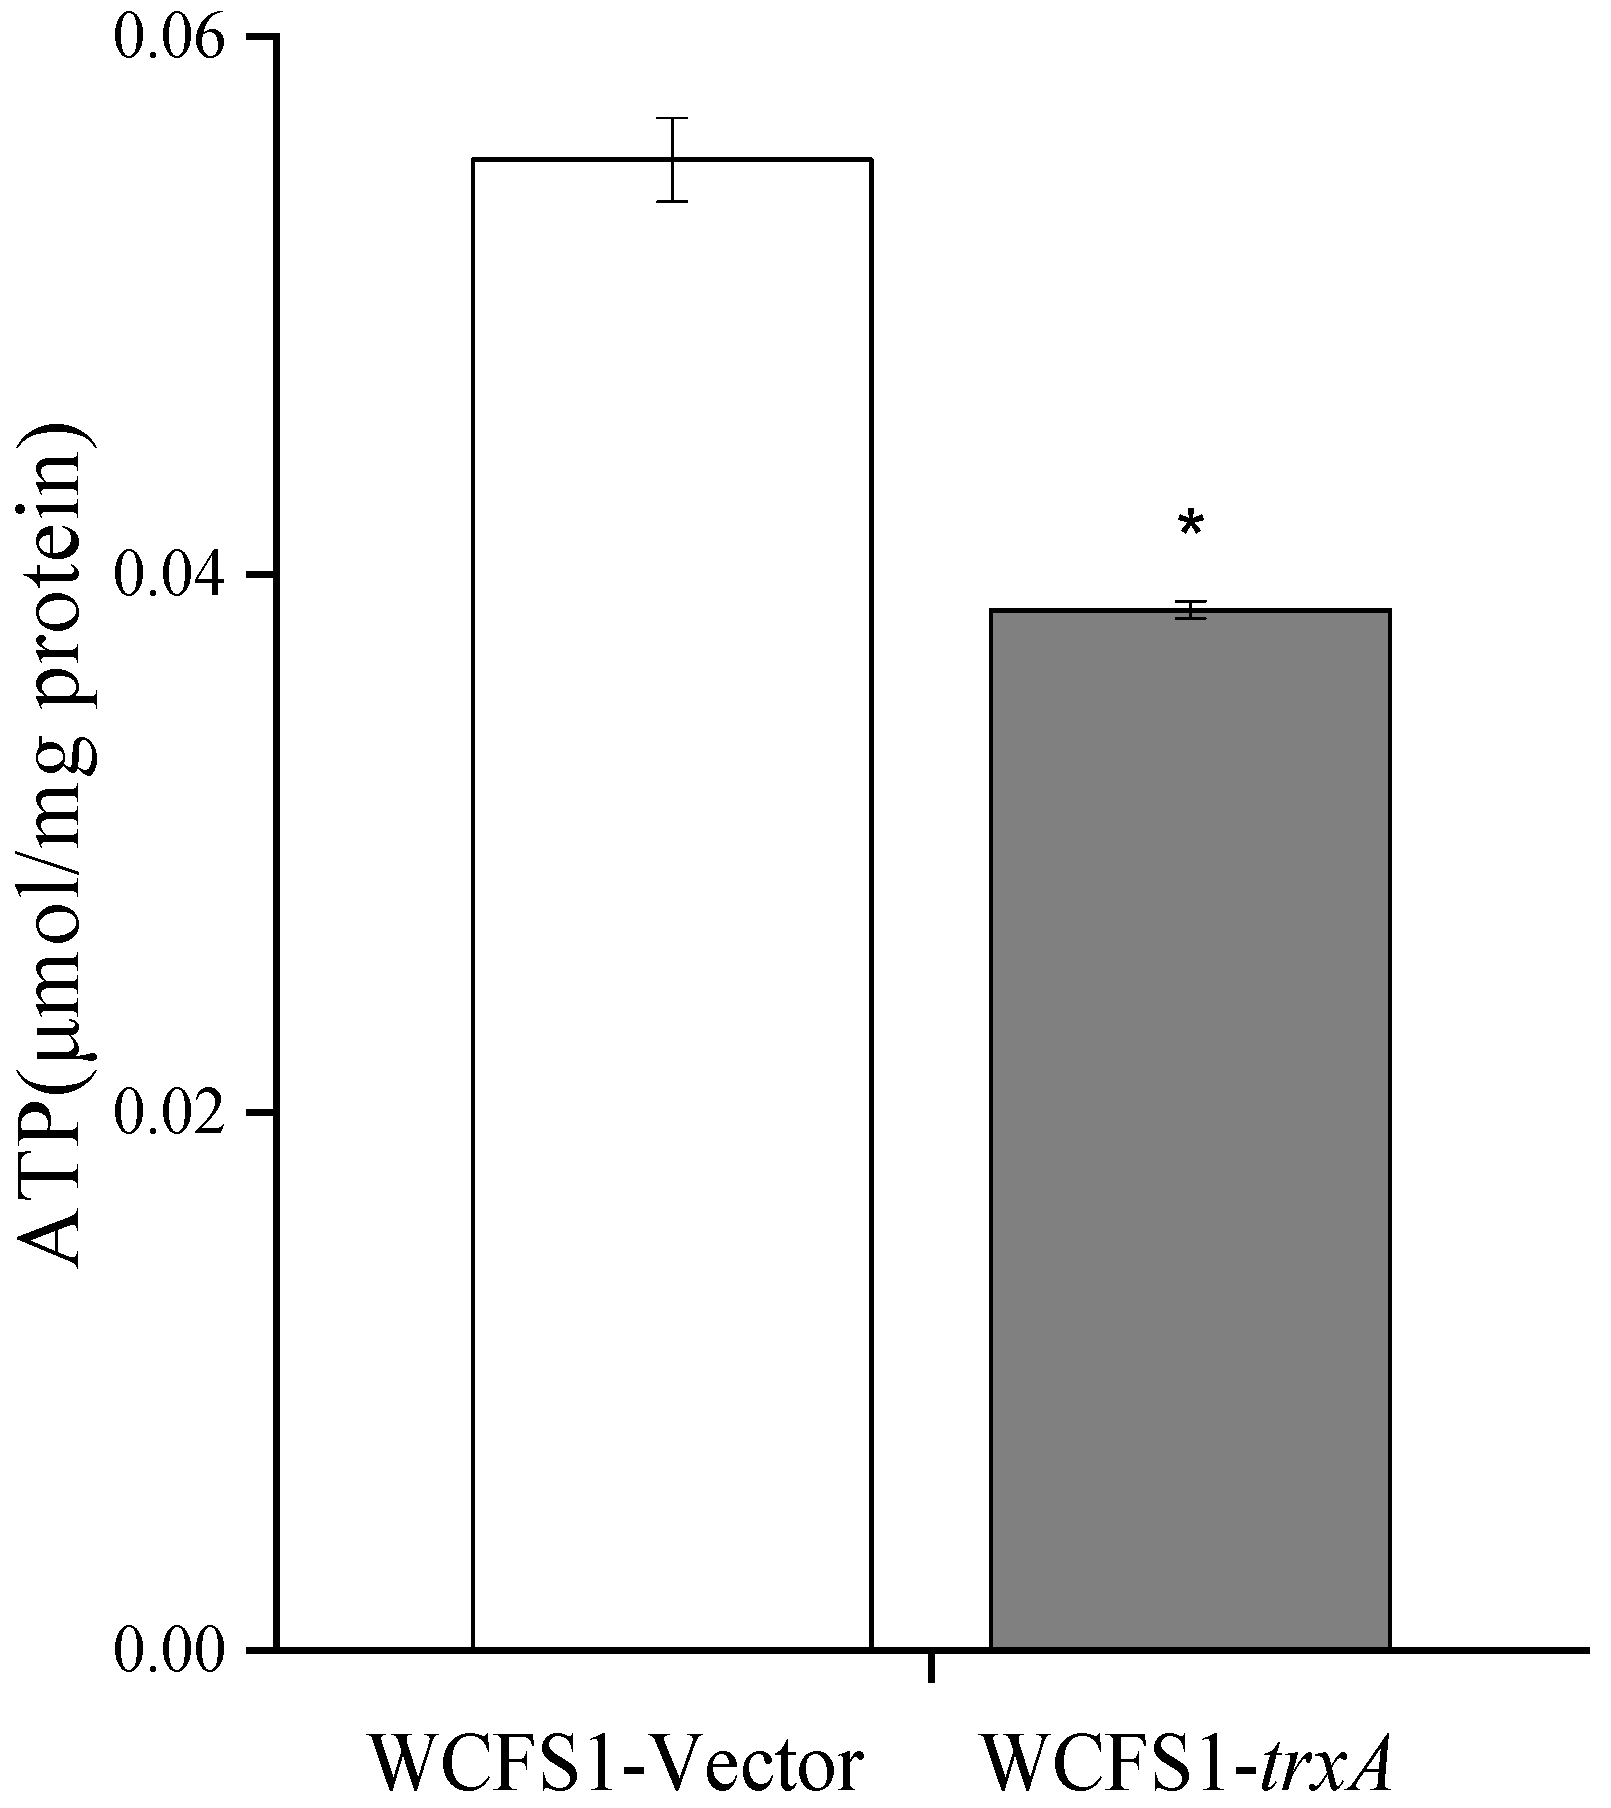
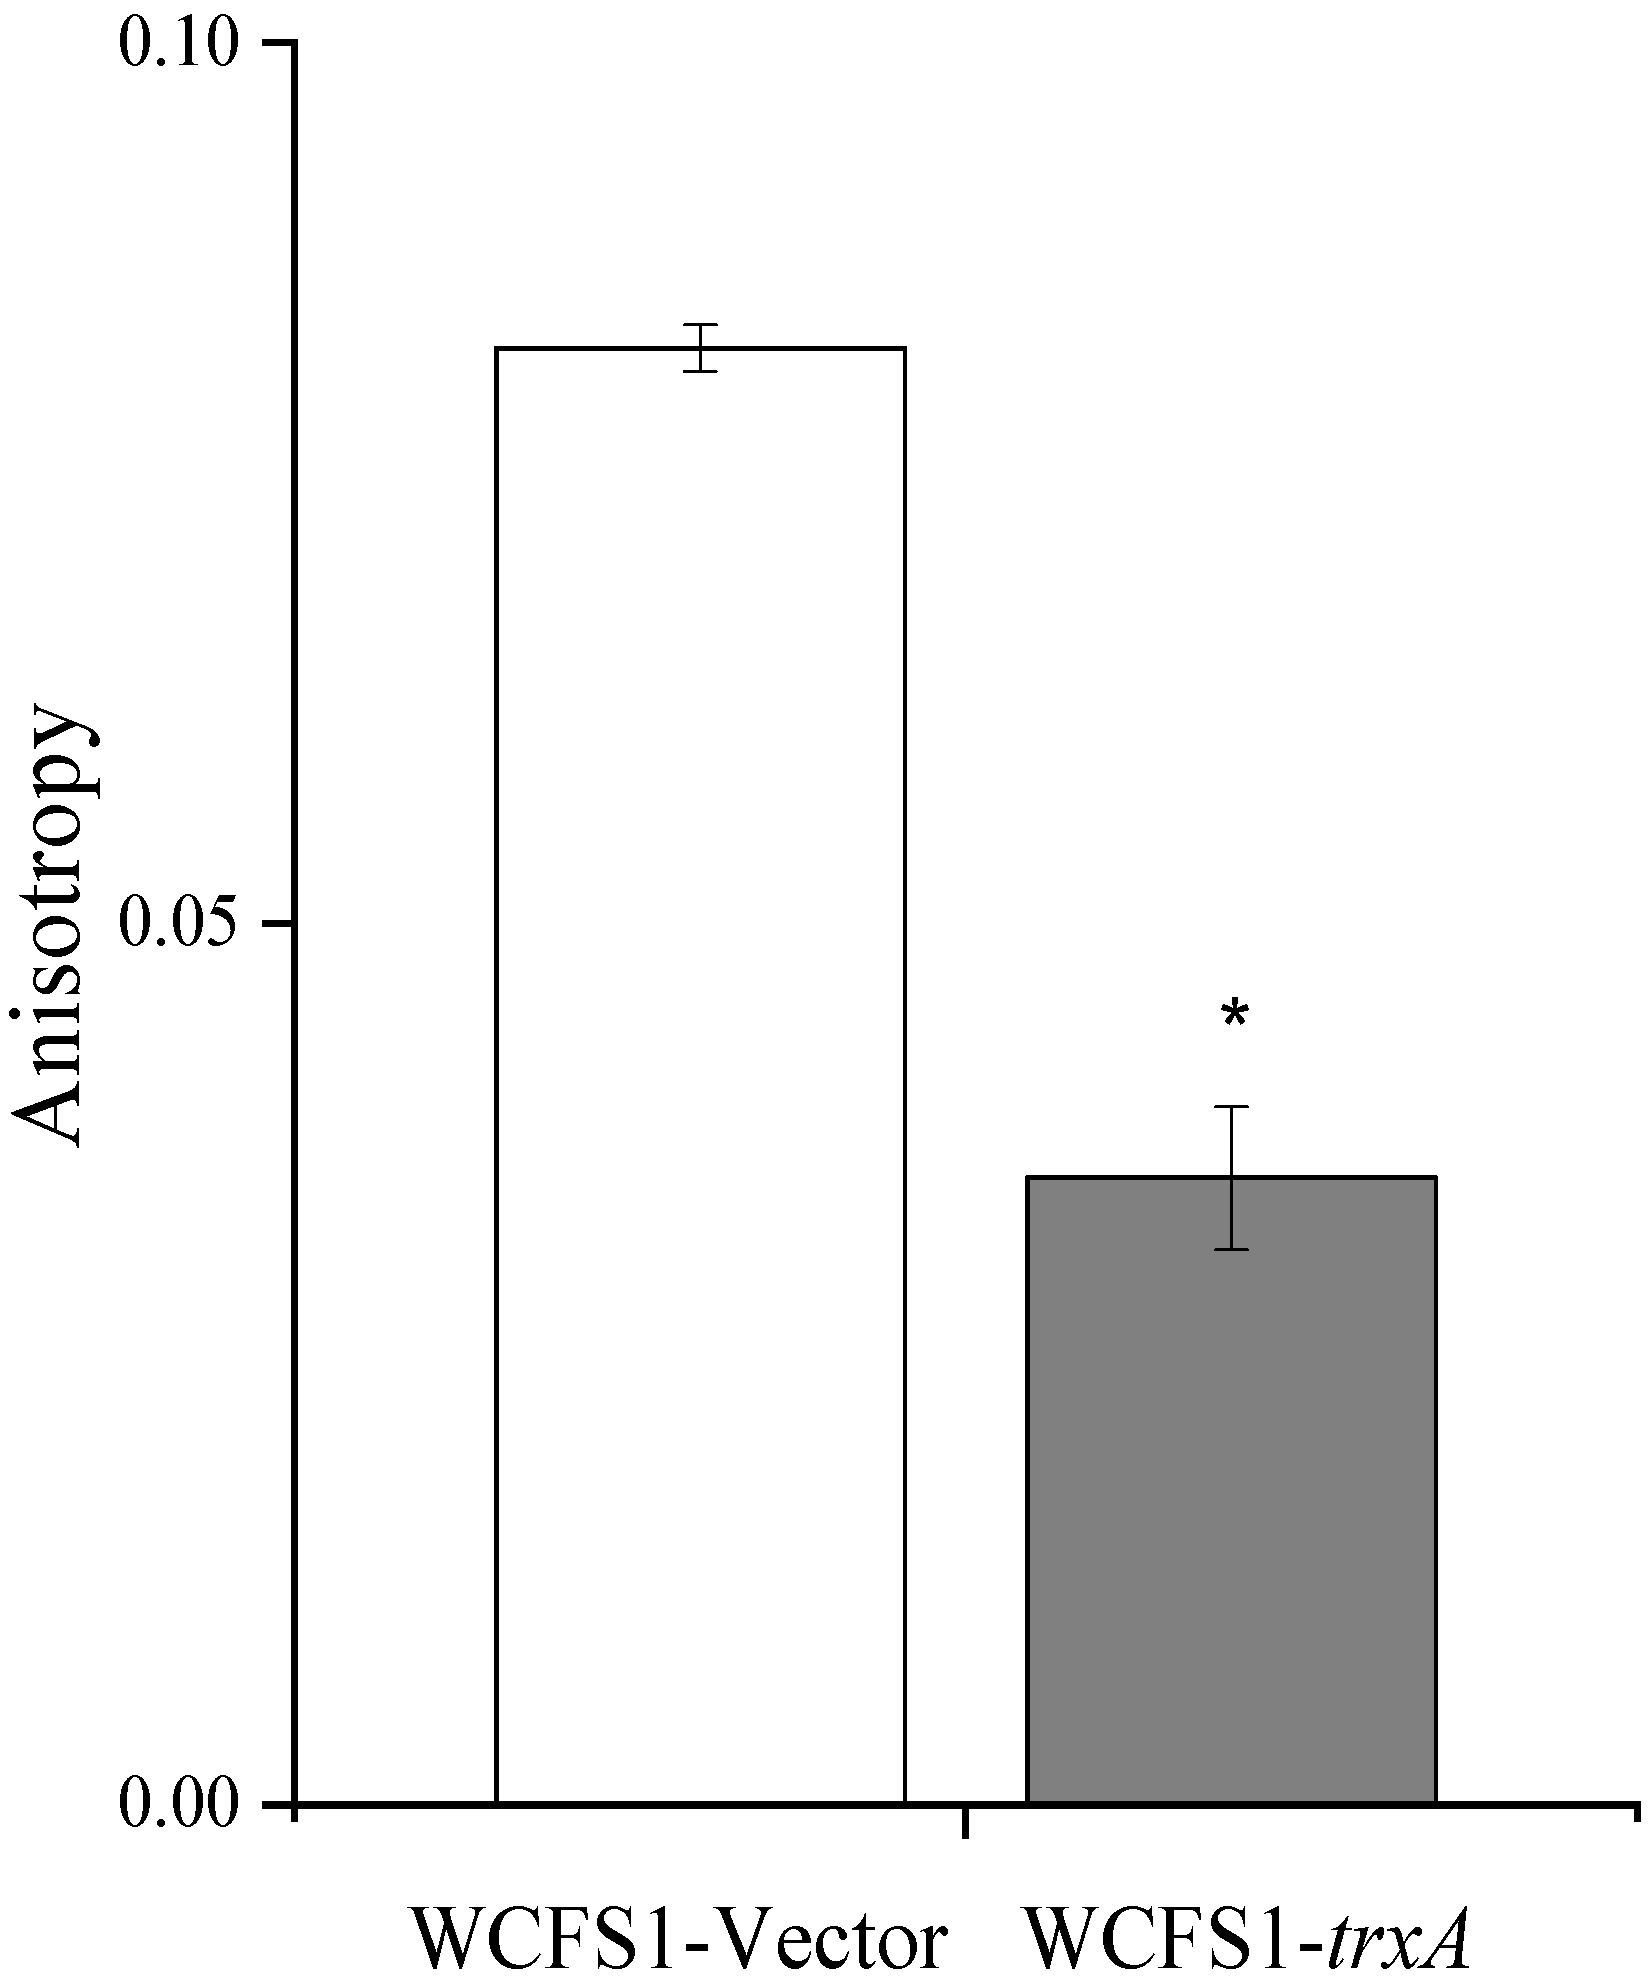
3.4. Heterologous Expression of trxA Decreased ATP Content and Increased Cell Membrane Fluidity in L. plantarum WCFS1

As the most important energy source of organisms, ATP plays a vital role in maintaining cell growth, reproduction, and metabolism [27]. It was also reported that cells consume more ATP to maintain growth under stress conditions [28]. As shown in Figure 4, compared with the WCFS1-Vector, the intracellular ATP content of the WCFS1-trxA was significantly reduced under the acid stress environment, indicating that trxA did not improve the acid stress tolerance of the WCFS1-trxA by activating the energy production pathway but accelerated the energy expending response. The extra energy consumed by WCFS1-trxA may partially offset the damage caused by acid stress.
The first barrier of the cell in resisting the external stress environment is the cell membrane [29], and changing the cell membrane fluidity is an essential response of O. oeni to external stress [30]. Previous studies have shown that acid stress could reduce the fluidity of cell membranes and cause sclerosis [29,31]. In Figure 5, compared with the control strain, the fluorescence anisotropy of the recombinant strain was significantly lower, and the lower the fluorescence anisotropy, the higher the rotational diffusion rate of the cell membrane. Therefore, the overexpression of the trxA gene can increase the rotational diffusion rate of the cell membrane of L. plantarum WCFS1 and accelerate the exchange of substances and energy inside and outside the cell.

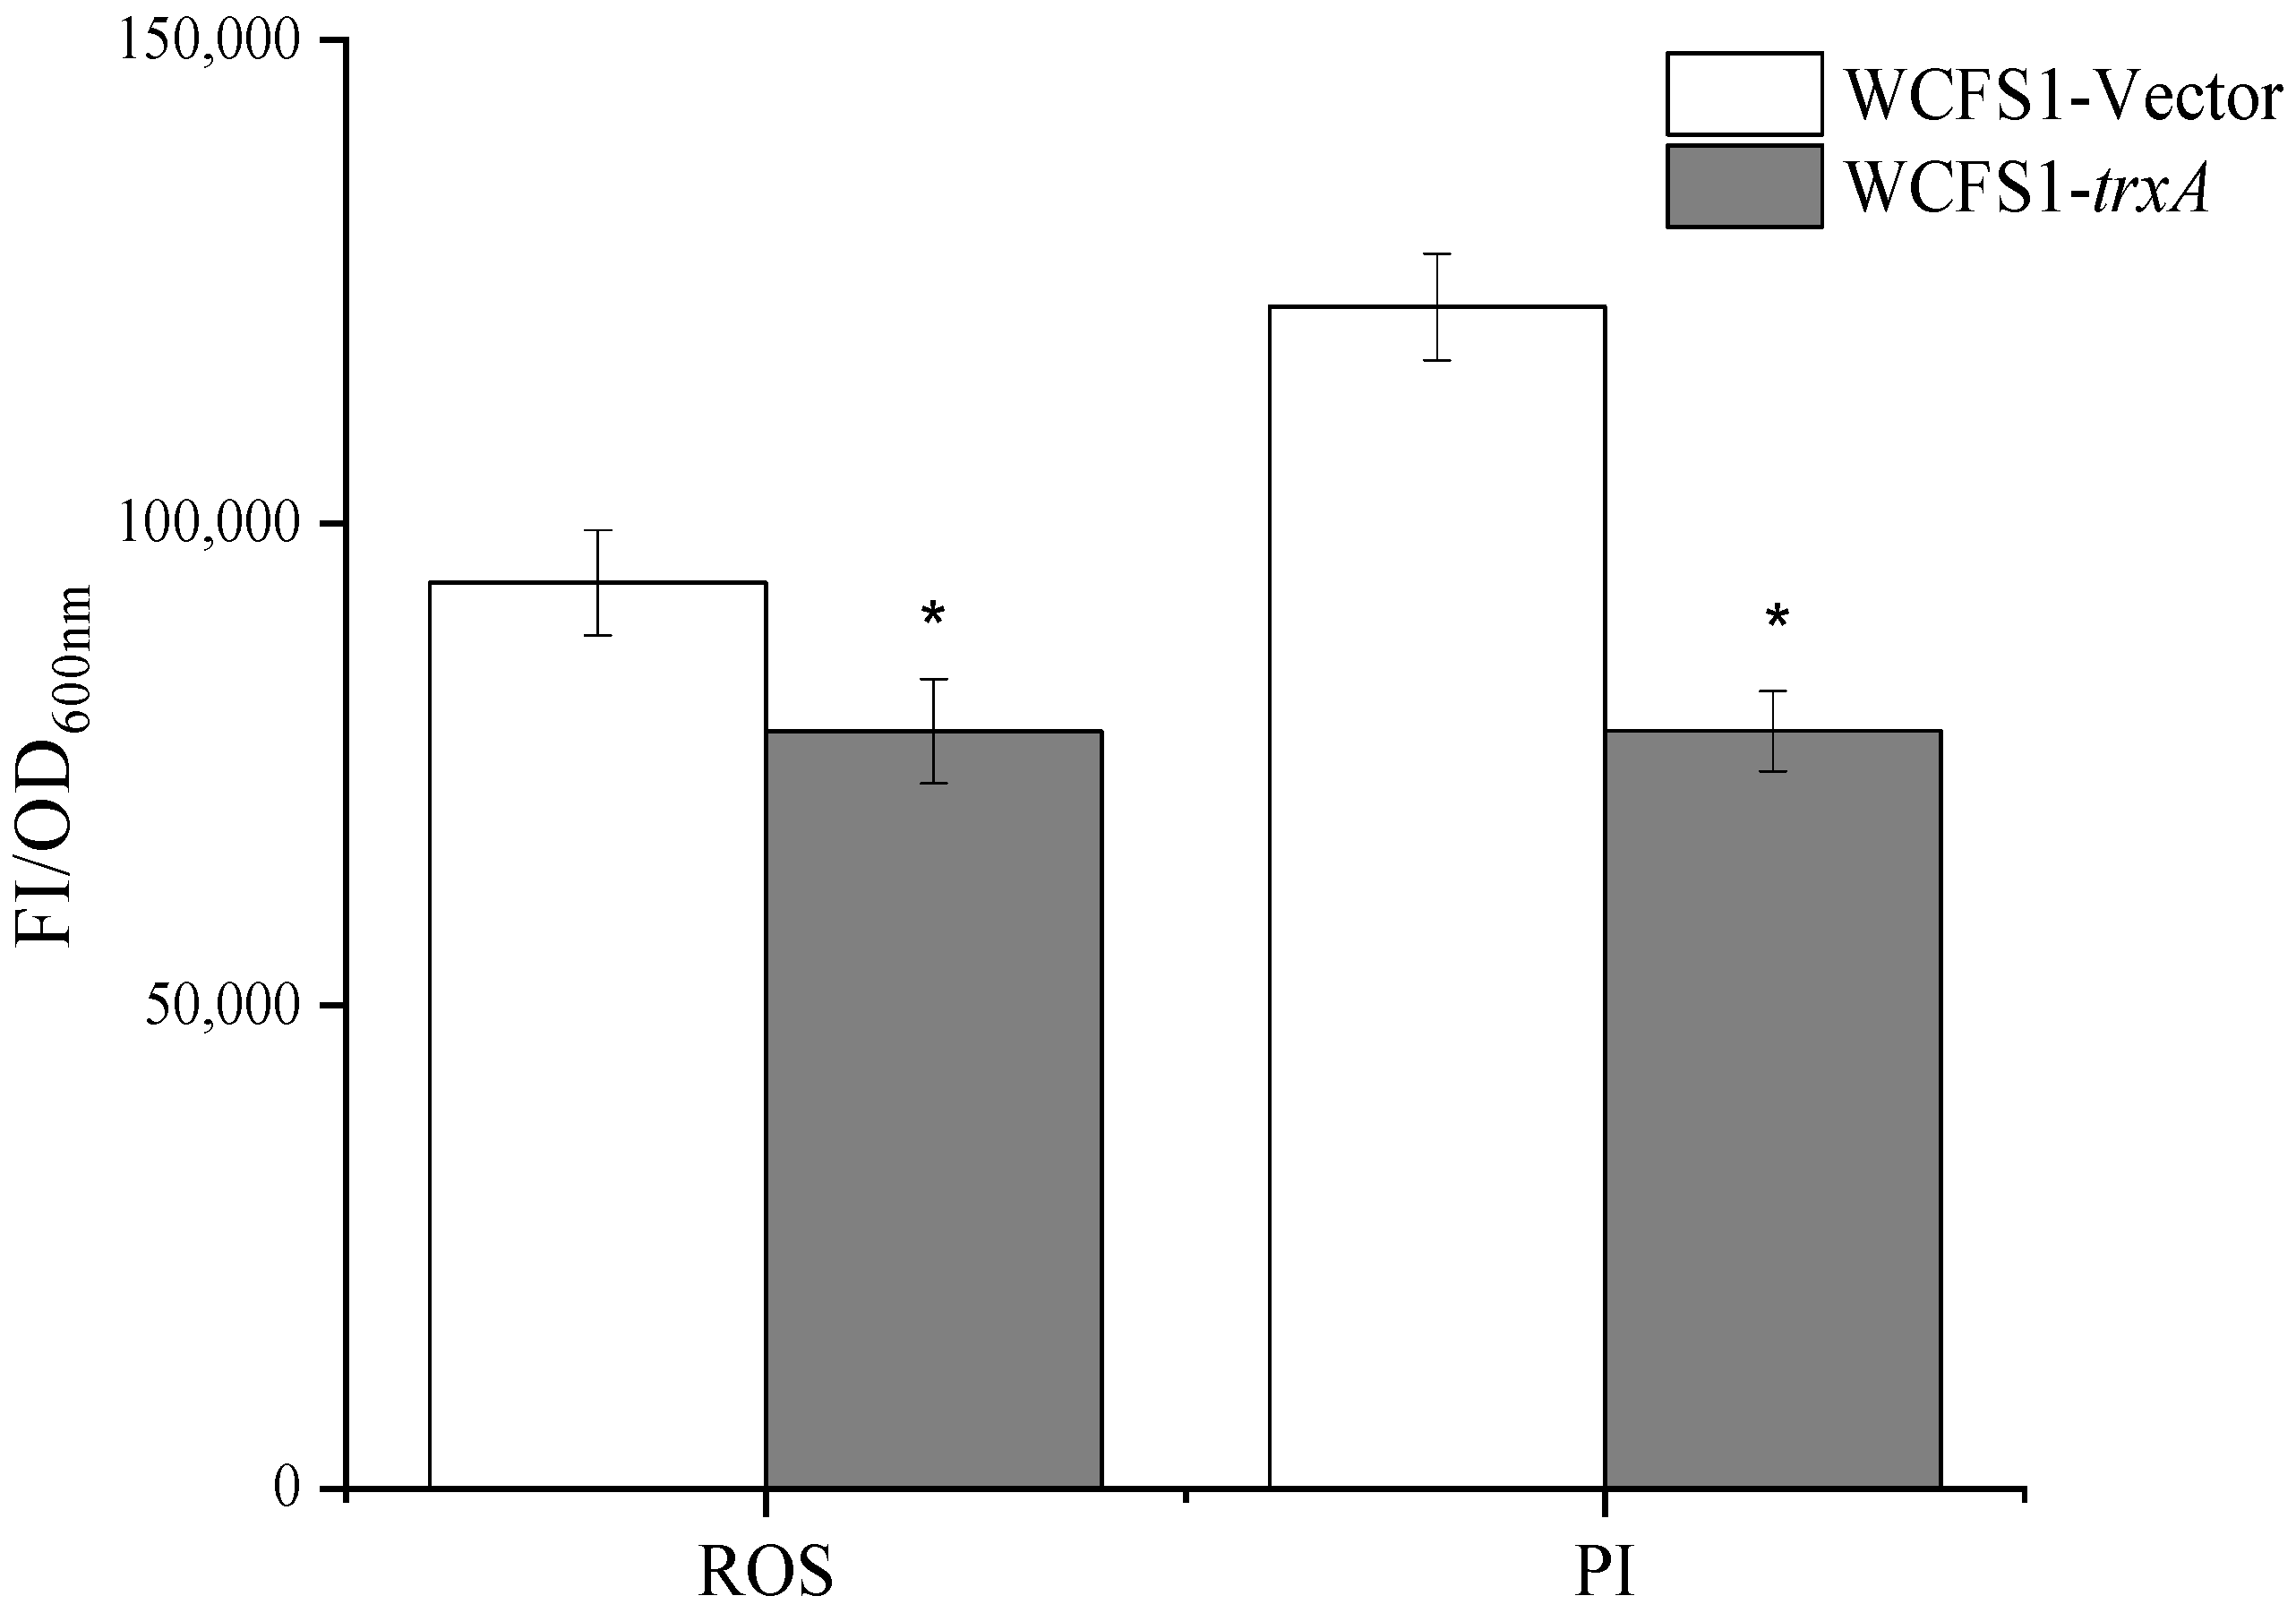
3.5. Heterologous Expression of trxA Results in Decreased ROS Accumulation and Enhanced Cell Membrane Integrity of L. plantarum WCFS1

Acid stress affects the accumulation of intracellular ROS content, causing damage to intracellular components [32] and affecting the integrity of cell membranes [30,31]. In Figure 6, compared with the control strain, the accumulation of ROS in the recombinant strain was significantly lower. The accumulation of ROS would increase the oxidative damage of microorganisms. Therefore, the overexpression of the trxA gene can reduce the oxidative damage caused by acid stress to L. plantarum WCFS1. The cell membrane integrity assay needs to use a PI probe. The PI probe can stain cells with damaged cell membranes to evaluate the cell membrane integrity of the strain by measuring the fluorescence intensity (FI). The higher the fluorescence value, the worse the cell membrane integrity. Compared with the control strain, the fluorescence value of PI dye in the recombinant strain was significantly lower, indicating that the cell membrane integrity of the recombinant strain was better. Therefore, overexpression of the trxA gene can reduce the damage to the cell membrane of L. plantarum WCFS1 caused by acid stress and maintain the integrity of the cell membrane.

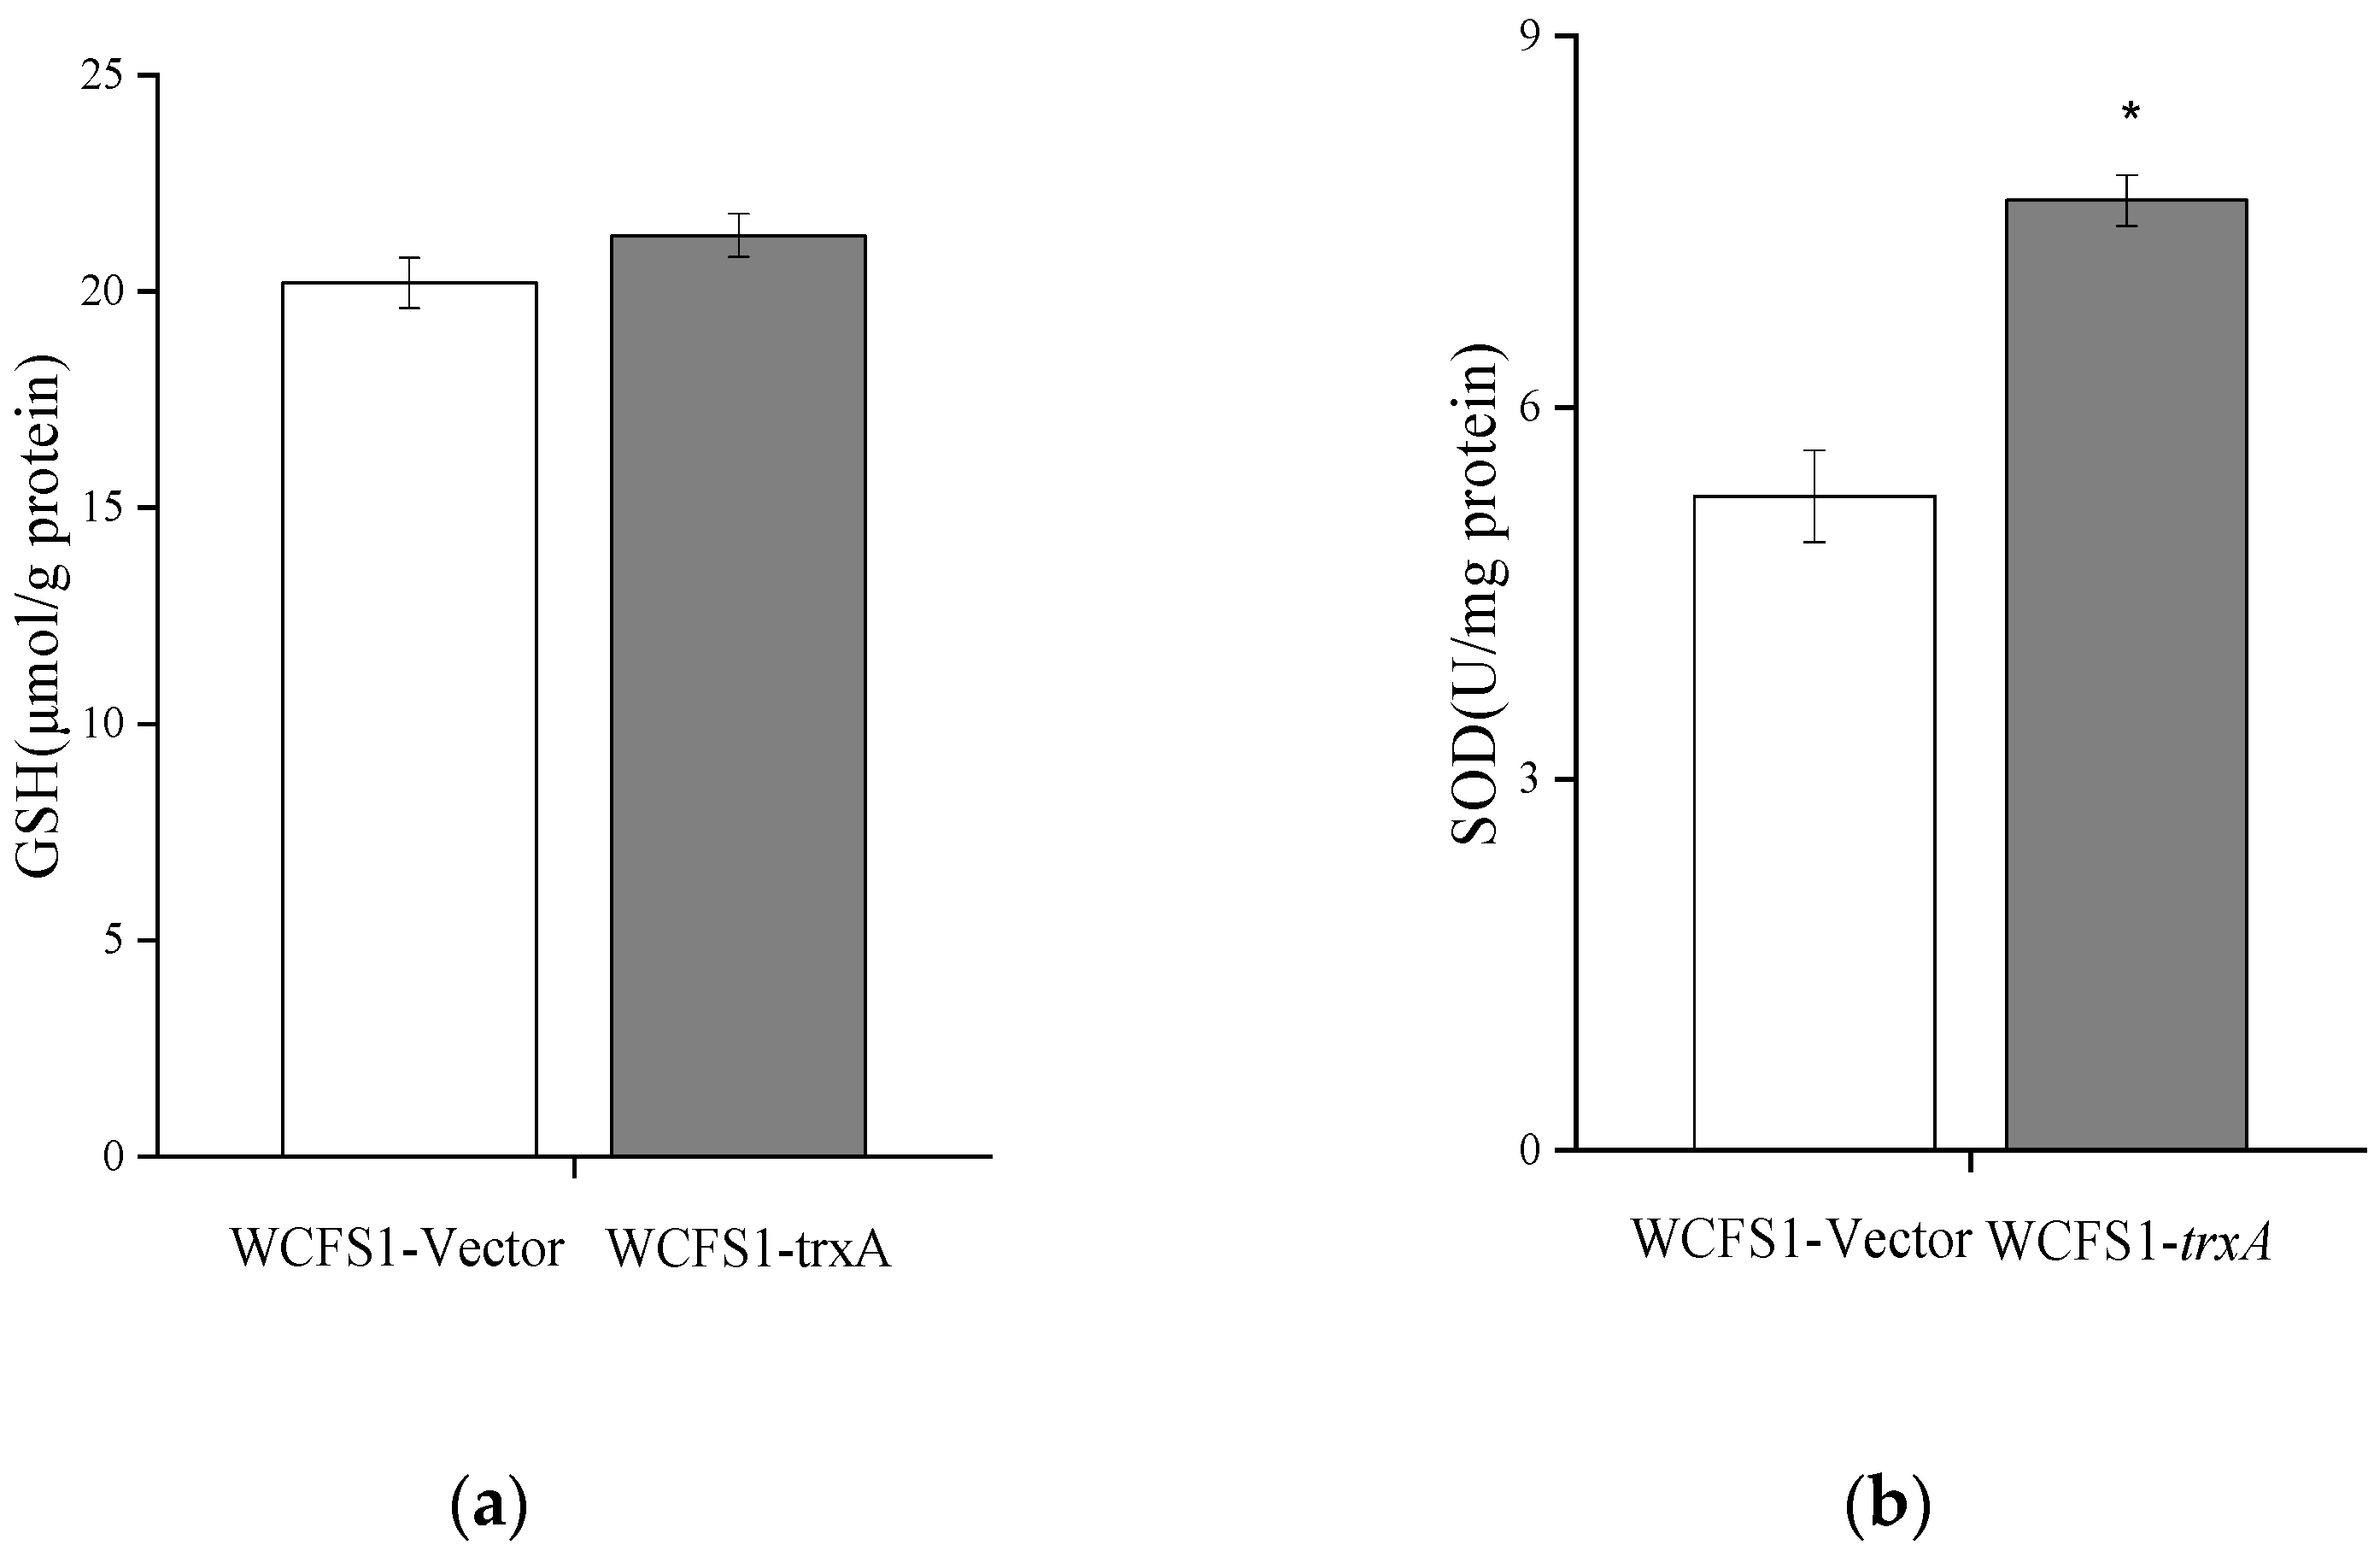
3.6. Heterologous Expression of trxA Decreased ROS Accumulation through Improving SOD Activity

There are two mechanisms (the enzymatic pathway and non-enzymatic pathway) that protect the cells of lactic acid bacteria to reduce the cell damage caused by ROS [19,33]. It can be seen from Figure 6 that the intracellular ROS accumulation of the recombinant strain was lower compared with the control strain. To explore the reasons for the relatively low ROS content in the recombinant strain, the enzymatic factor SOD activity and the non-enzymatic factor intracellular GSH content were determined. SOD is an important antioxidant that can resist the effect of ROS by eliminating superoxides, while GSH is a non-enzymatic antioxidant with functions such as scavenging free radicals, detoxifying, enhancing immunity, and eliminating the stress produced by ROS. As shown in Figure 7, compared with the control strain, the SOD activity of the recombinant strain was significantly higher. SOD is an essential member of the antioxidant enzyme system in cells, which can help the organism resist oxidative damage. Compared with the control strain, the GSH content of the recombinant strain did not have a significant difference. Therefore, the overexpression of the trxA gene mainly removed the accumulated ROS through SOD, thus reducing the oxidative damage caused by acid stress to L. plantarum WCFS1.

4. Conclusions

The experimental results indicated that the WCFS1-trxA showed better growth performance than the WCFS1-Vector under acid stress (pH 3.2, pH 3.4, and pH 3.6). Moreover, the recombinant strain WCFS1-trxA showed higher expression of Trx system genes than the control strain under acid stress (pH 3.6), which confirmed that the trxA gene indeed regulated the expression of these genes. The trxA gene improves acid stress tolerance mainly by improving the SOD activity of L. plantarum WCFS1, reducing bacterial ROS, increasing cell membrane fluidity and integrity, and enhancing the acid stress tolerance of L. plantarum WCFS1.

Supplementary Materials

The following supporting information can be downloaded at: https://www.mdpi.com/article/10.3390/fermentation8090452/s1, Figure S1: The results of agarose gel electrophoresis. Table S1: Primers used for real-Time quantitative PCR.

Author Contributions

Conceptualization, L.L., S.P. and W.S.; methodology, L.L., X.Y., M.W. and K.Z.; data curation. S.S.; writing—original draft preparation, L.L. and W.S.; writing—review and editing, L.L., S.S., S.P. and W.S.; funding acquisition, L.L., S.S. and W.S. All authors have read and agreed to the published version of the manuscript.

Funding

This research was funded by the National Natural Science Foundation of China (No. 32001659, 32071954), the Shandong Natural Science Foundation of Youth project (ZR2020QC224, ZR2021QD082), the Science and Technology Support Plan for Youth Innovation of Colleges and Universities in Shandong Province (2020KJD005), and the Doctor Start-up Funds of Binzhou University (2020Y05).

Institutional Review Board Statement

Not applicable.

Informed Consent Statement

Not applicable.

Data Availability Statement

Not applicable.

Conflicts of Interest

The authors do not report any financial or personal connections with other persons or organizations that might negatively affect the contents of this publication and/or claim authorship rights to this publication.

References

  1. Zhao, H.; Li, Y.; Liu, L.; Zheng, M.; Feng, Z.; Hu, K.; Tao, Y. Effects of inoculation timing and mixed fermentation with Pichia fermentans on Oenococcus oeni viability, fermentation duration and aroma production during wine malolactic fermentation. Food Res. Int. 2022, 159, 111604. [Google Scholar] [CrossRef] [PubMed]
  2. Liu, L.; Peng, S.; Song, W.; Zhao, H.; Li, H.; Wang, H. Genomic analysis of an excellent wine-making strain Oenococcus oeni SD-2a. Pol. J. Microbiol. 2022, 71, 279–292. [Google Scholar] [CrossRef]
  3. Balmaseda, A.; Rozes, N.; Bordons, A.; Reguant, C. Molecular adaptation response of Oenococcus oeni in non-Saccharomyces fermented wines: A comparative multi-omics approach. Int. J. Food Microbiol. 2022, 362, 109490. [Google Scholar] [CrossRef] [PubMed]
  4. Diez-Ozaeta, I.; Lavilla, M.; Amarita, F. Effect of inoculation strategy with autochthonous Oenococcus oeni strains on aroma development in Rioja Alavesa Tempranillo wines. LWT–Food Sci. Technol. 2022, 162, 113399. [Google Scholar] [CrossRef]
  5. Noemi, B.; Giorgia, P.; Carlo, P.; Giuseppe, A.; Camillo, Z.; Alessio, P.R.; Rosanna, T. Characterization of natural Oenococcus oeni strains for Montepulciano d’Abruzzo organic wine production. Eur. Food Res. Technol. 2020, 246, 1031–1039. [Google Scholar]
  6. Maret, D.T.; Lynn, E.; Elda, L.; Sibylle, K. Lactobacillus: The next generation of malolactic fermentation starter cultures—An overview. Food Bioproc. Technol. 2011, 4, 876–906. [Google Scholar]
  7. Jin, G.; Jiranek, V.; Hayes, A.M.; Grbin, P.R. Isolation and characterization of high-ethanol-tolerance lactic acid bacteria from Australian Wine. Foods 2022, 11, 1231. [Google Scholar] [CrossRef] [PubMed]
  8. Olguin, N.; Champomier-Verges, M.; Anglade, P.; Baraige, F.; Cordero-Otero, R.; Bordons, A.; Zagorec, M.; Reguant, C. Transcriptomic and proteomic analysis of Oenococcus oeni PSU-1 response to ethanol shock. Food Microbiol. 2015, 51, 87–95. [Google Scholar] [CrossRef] [PubMed]
  9. Darsonval, M.; Msadek, T.; Alexandre, H.; Grandvalet, C. The antisense RNA approach: A new application for in vivo investigation of the stress response of Oenococcus oeni, a wine-associated lactic acid bacterium. Appl. Environ. Microbiol. 2016, 82, 18–26. [Google Scholar] [CrossRef]
  10. Darsonval, M.; Julliat, F.; Msadek, T.; Alexandre, H.; Grandvalet, C. CtsR, the master regulator of stress-response in Oenococcus oeni, is a heat sensor interacting with ClpL1. Front. Microbiol. 2018, 9, 3135. [Google Scholar] [CrossRef]
  11. Darsonval, M.; Alexandre, H.; Grandvalet, C. Genetically engineered Oenococcus oeni strains to highlight the impact of estA2 and estA7 esterase genes on wine ester profile. Food Microbiol. 2016, 60, 21–28. [Google Scholar] [CrossRef] [PubMed]
  12. Zhao, H.; Liu, L.; Peng, S.; Yuan, L.; Li, H.; Wang, H. Heterologous expression of argininosuccinate synthase from Oenococcus oeni enhances the acid resistance of Lactobacillus plantarum. Front. Microbiol. 2019, 10, 1393. [Google Scholar] [CrossRef] [PubMed]
  13. Yuan, L.; Zhao, H.; Liu, L.; Peng, S.; Li, H.; Wang, H. Heterologous expression of the puuE from Oenococcus oeni SD-2a in Lactobacillus plantarum WCFS1 improves ethanol tolerance. J. Basic Microbiol. 2019, 59, 1134–1142. [Google Scholar] [CrossRef] [PubMed]
  14. Zhao, H.; Yuan, L.; Hu, K.; Liu, L.; Peng, S.; Li, H.; Wang, H. Heterologous expression of ctsR from Oenococcus oeni enhances the acid-ethanol resistance of Lactobacillus plantarum. FEMS Microbiol. Lett. 2019, 366, fnz192. [Google Scholar] [CrossRef]
  15. Schumann, C.; Michlmayr, H.; Eder, R.; Del, H.A.; Kulbe, K.D.; Mathiesen, G.; Nguyen, T.H. Heterologous expression of Oenococcus oeni malolactic enzyme in Lactobacillus plantarum for improved malolactic fermentation. AMB Express 2012, 2, 19. [Google Scholar] [CrossRef]
  16. Weidmann, S.; Maitre, M.; Laurent, J.; Coucheney, F.; Rieu, A.; Guzzo, J. Production of the small heat shock protein Lo18 from Oenococcus oeni in Lactococcus lactis improves its stress tolerance. Int. J. Food Microbiol. 2017, 247, 18–23. [Google Scholar] [CrossRef]
  17. Costantini, A.; Rantsiou, K.; Majumder, A.; Jacobsen, S.; Pessione, E.; Svensson, B.; Garcia-Moruno, E.; Cocolin, L. Complementing DIGE proteomics and DNA subarray analyses to shed light on Oenococcus oeni adaptation to ethanol in wine-simulated conditions. J. Proteom. 2015, 123, 114–127. [Google Scholar] [CrossRef]
  18. Guzzo, J.; Jobin, M.P.; Delmas, F.; Fortier, L.C.; Garmyn, D.; Tourdot-Marechal, R.; Lee, B.; Divies, C. Regulation of stress response in Oenococcus oeni as a function of environmental changes and growth phase. Int. J. Food Microbiol. 2000, 55, 27–31. [Google Scholar] [CrossRef]
  19. Margalef-Catala, M.; Stefanelli, E.; Araque, I.; Wagner, K.; Felis, G.E.; Bordons, A.; Torriani, S.; Reguant, C. Variability in gene content and expression of the thioredoxin system in Oenococcus oeni. Food Microbiol. 2017, 61, 23–32. [Google Scholar] [CrossRef]
  20. Yang, K.; Dai, X.; Fan, M.; Zhang, G. Influences of acid and ethanol stresses on Oenococcus oeni SD-2a and its proteomic and transcriptional responses. J. Sci. Food Agric. 2021, 101, 2892–2900. [Google Scholar] [CrossRef]
  21. Liu, L.; Zhao, H.; Peng, S.; Wang, T.; Su, J.; Liang, Y.; Li, H.; Wang, H. Transcriptomic analysis of Oenococcus oeni SD-2a response to acid shock by RNA-Seq. Front. Microbiol. 2017, 8, 1586. [Google Scholar] [CrossRef] [PubMed]
  22. De Man, J.C.; Rogosa, M.; Sharpe, M.E. A medium for the cultivation of Lactobacilli. J. Appl. Bacteriol. 1960, 23, 130–135. [Google Scholar] [CrossRef]
  23. Zhang, M.M.; Zhao, X.Q.; Cheng, C.; Bai, F.W. Improved growth and ethanol fermentation of Saccharomyces cerevisiae in the presence of acetic acid by overexpression of SET5 and PPR1. Biotechnol. J. 2015, 10, 1903–1911. [Google Scholar] [CrossRef]
  24. Graca, D.S.M.; Vitoria, S.R.M.; Loureiro-Dias, M.C.; Rombouts, F.M.; Abee, T. Flow cytometric assessment of membrane integrity of ethanol-stressed Oenococcus oeni cells. Appl. Environ. Microbiol. 2002, 68, 6087–6093. [Google Scholar] [CrossRef] [PubMed]
  25. Wu, C.; Zhang, J.; Wang, M.; Du, G.; Chen, J. Lactobacillus casei combats acid stress by maintaining cell membrane functionality. J. Ind. Microbiol. Biotechnol. 2012, 39, 1031–1039. [Google Scholar] [CrossRef]
  26. Li, Y.; Hugenholtz, J.; Sybesma, W.; Abee, T.; Molenaar, D. Using Lactococcus lactis for glutathione overproduction. Appl. Microbiol. Biotechnol. 2005, 67, 83–90. [Google Scholar] [CrossRef]
  27. Liu, L.; Peng, S.; Zhao, H.; Yuan, L.; Li, H.; Wang, H. Acid stress response mechanism in Oenococcus oeni SD-2a analyzed by RNA sequencing. Food Sci. 2022, 43, 153–162. [Google Scholar]
  28. Mendoza, S.N.; Cañón, P.M.; Contreras, Á.; Ribbeck, M.; Agosín, E. Genome-scale reconstruction of the metabolic network in Oenococcus oeni to assess wine malolactic fermentation. Front. Microbiol. 2017, 8, 534. [Google Scholar] [CrossRef]
  29. Chu-Ky, S.; Tourdot-Marechal, R.; Marechal, P.A.; Guzzo, J. Combined cold, acid, ethanol shocks in Oenococcus oeni: Effects on membrane fluidity and cell viability. Biochim. Biophys. Acta 2005, 1717, 118–124. [Google Scholar] [CrossRef]
  30. Matsumoto, S.; Breniaux, M.; Claisse, O.; Gotti, C.; Bourassa, S.; Droit, A.; Deleris-Bou, M.; Krieger, S.; Weidmann, S.; Rudolf, J.; et al. The production of preconditioned freeze-dried Oenococcus oeni primes its metabolism to withstand environmental stresses encountered upon inoculation into wine. Int. J. Food Microbiol. 2022, 369, 109617. [Google Scholar] [CrossRef]
  31. Zhao, H.; Li, H.; Liu, L.; Peng, S.; Wang, H. The research progress of stress adaptation mechanism of Oenococcus oeni. J. Chin. Inst. Food Sci. Technol. 2019, 19, 292–299. [Google Scholar]
  32. Hu, S.; Yu, Y.; Lv, Z.; Shen, J.; Ke, Y.; Xiao, X. Proteomics study unveils ROS balance in acid-adapted Salmonella enteritidis. Food Microbiol. 2020, 92, 103585. [Google Scholar] [CrossRef] [PubMed]
  33. Zhang, J.; Fu, R.Y.; Hugenholtz, J.; Li, Y.; Chen, J. Glutathione protects Lactococcus lactis against acid stress. Appl. Environ. Microbiol. 2007, 73, 5268–5275. [Google Scholar] [CrossRef] [PubMed] [Green Version]
Figure 1. Construction of recombinant expression vector pMG36etrxA. Emr, erythromycin resistance marker; P32, promoter; repA, replication determinant.
Fermentation 08 00452 g001
Figure 2. Evaluation of the growth performance with strains WCFS1-pMG36e (WCFS1-Vector) and WCFS1-pMG36etrxA (WCFS1-trxA). The strains were cultured in MRS media with pH 6.3 (a), pH 4.0 (b), pH 3.8 (c), pH 3.6 (d), pH 3.4 (e), and pH 3.2 (f). The number on the x axis indicates culture hours. The results are the average of three independent experiments. The T-test of p value < 0.05.
Fermentation 08 00452 g002aFermentation 08 00452 g002b
Figure 3. The effects of the heterologously expressing trxA gene on the transcription of Trx system genes in L. plantarum WCFS1. trxA1, trxA2, trxA3, trxH, and trxA encode thioredoxin A1, thioredoxin A2, thioredoxin A3, thioredoxin H, and thioredoxin A, respectively. trxB encodes a thioredoxin reductase. fdr is a ferredoxin NAD (P) reductase encoding gene. The difference was significant at a 95% confidence level.
Fermentation 08 00452 g003
Figure 4. The ATP content in the WCFS1-trxA and WCFS1-Vector cells cultured in MRS medium (pH 3.6). The ATP content is significantly lower in the WCFS1-trxA strain compared with the WCFS1-Vector strain. * means T-test of p value < 0.05.
Fermentation 08 00452 g004
Figure 5. The fluorescence anisotropy value of the WCFS1-trxA and WCFS1-Vector cells cultured in an MRS medium (pH 3.6). The fluorescence anisotropy value is significantly lower in the WCFS1-trxA strain compared with the WCFS1-Vector strain. * means T-test of p value < 0.05.
Fermentation 08 00452 g005
Figure 6. The ROS and PI value of the WCFS1-trxA and WCFS1-Vector cells cultured in an MRS medium (pH 3.6). The ROS and PI values are significantly lower in the WCFS1-trxA strain compared with the WCFS1-Vector strain. * means T-test of p value < 0.05.
Fermentation 08 00452 g006
Figure 7. The GSH level (a) and SOD activity (b) of the WCFS1-trxA and WCFS1-Vector cells cultured in an MRS medium (pH 3.6). The GSH level is similar in the WCFS1-trxA strain compared with the WCFS1-Vector strain, while the SOD activity is significantly higher in the WCFS1-trxA strain compared with the WCFS1-Vector strain. * means T-test of p value < 0.05.
Fermentation 08 00452 g007
Table 1. Bacterial strains and plasmids used in this study (The superscript lowercase letter ‘r’ means resistance).
Strains and PlasmidsRelevant PropertyReference/Source
E.coli DH5αCloning hostTakara
O. oeni SD-2aDonor bacteriaOur lab
L. plantarum WCFS1Plasmid-free bacteriaOur lab
WCFS1(pMG36e)L. plantarum harboring pMG36e, Em rOur lab
WCFS1(pMG36etrxA)L. plantarum harboring pMG36etrxA, Em rThis study
Plasmids
pMG36eE. coli-L. lactis shuttle vector (3,6 kb), Em rOur lab
pMG36etrxApMG36e-derivative vector containing the 552 bp region with the ctsR gene, Em rThis study
Publisher’s Note: MDPI stays neutral with regard to jurisdictional claims in published maps and institutional affiliations.

