Article

Dynamic Variations in Rumen Fermentation Characteristics and Bacterial Community Composition during In Vitro Fermentation

Jiangxi Province Key Laboratory of Animal Nutrition, Animal Nutrition and Feed Safety Innovation Team, College of Animal Science and Technology, Jiangxi Agricultural University, Nanchang 330045, China
*
Author to whom correspondence should be addressed.
These authors have contributed equally to this work.
Fermentation 2022, 8(6), 276; https://doi.org/10.3390/fermentation8060276
Submission received: 25 April 2022 / Revised: 31 May 2022 / Accepted: 9 June 2022 / Published: 14 June 2022
(This article belongs to the Special Issue In Vitro Fermentation)

Abstract

:
This study aimed to explore the dynamic variations of rumen fermentation characteristics and bacterial community composition during a 24 h in vitro fermentation. A total of twenty-three samples were collected from original rumen fluid (ORF, n = 3), fermentation at 12 h (R12, n = 10), and fermentation at 24 h (R24, n = 10). Results showed that gas production, concentrations of microbial crude protein, ammonia nitrogen, and individual volatile fatty acids (VFA), as well as total VFA and branched-chain VFA concentrations, were higher in R24 when compared with R12 (p < 0.05). However, no significant differences were observed in acetate to propionate ratio and fermentation efficiency between R12 and R24 (p > 0.05). Bacterial diversity analysis found that Shannon index and Simpson index were higher in R24 (p < 0.05), and obvious clusters were observed in rumen bacterial community between R12 and R24. Taxonomic analysis at the phylum level showed that the abundances of Proteobacteria and Fibrobacteres were higher in R12 than that in R24, and inverse results were observed in Bacteroidetes, Firmicutes, Cyanobacteria, Verrucomicrobia, Lentisphaerae, and Synergistetes abundances. Taxonomic analysis at the genus level revealed that the abundances of Rikenellaceae RC9 gut group, Succiniclasticum, Prevotellaceae UCG-003, Christensenellaceae R-7 group, Ruminococcaceae UCG-002, Veillonellaceae UCG-001, and Ruminococcaceae NK4A214 group were higher in R24, whereas higher abundances of Succinivibrionaceae UCG-002, Ruminobacter, and Fibrobacter, were found in R12. Correlation analysis revealed the negative associations between gas production and abundances of Proteobacteria, Succinivibrionaceae UCG-002, and Ruminobacter. Moreover, the abundances of Firmicutes, Rikenellaceae RC9 gut group, Christensenellaceae R-7 group, and Ruminococcaceae UCG-002 positively correlated with VFA production. These results indicate that both rumen fermentation characteristics and bacterial community composition were dynamic during in vitro fermentation, whereas the fermentation pattern, efficiency, and bacterial richness remained similar. This study provide insight into the dynamics of rumen fermentation characteristics and bacterial composition during in vitro fermentation. This study may also provide a reference for decision-making for the sampling time point when conducting an in vitro fermentation for bacterial community investigation.

1. Introduction

In vitro fermentation is a vital methodology to evaluate nutritional value of a certain feedstuff or complex feeds, as well as to monitor fermentation state and to explore the nutrient metabolism mechanism [1,2,3]. The technology is labor-saving and avoids large variations between individual animals when compared with in vivo animal feeding experiment [4], allowing for its popularization over the past decades in the field of animal nutrition [2,5,6,7]. Several variables have been documented to influence the fermentation progress when using in vitro fermentation technique, including the diet of donor animals, origin of inoculum, inoculum freshness, collection time of inoculum, substrate to inoculum ratio, pH adjustment, particle size of substrate, temperature, the stability of rumen community, and anaerobic environment [8,9,10,11,12,13,14,15]. The most commonly used inocula are rumen fluid and fresh feces, however, the latter was observed to produce lower gas volume, methane emission, and volatile fatty acids (VFA) concentrations probably due to less microbial activity [12,16]. Therefore, it is better to prepare the inoculum with rumen fluid, and a representative rumen fluid sample appears to be another factor that affects the fermentation progress. Collection of rumen fluid through a rumen cannula provides a representative rumen sample, whereas the invasiveness and its high cost for the surgical procedure and daily nursing care have limited its widespread application [17,18]. Sampling the rumen contents of animals at slaughter may be an alternative to reduce cost and to increase the number of animals for rumen fluid collection. However, reduced microbial activity has been reported in rumen samples collected at slaughter [16]. Therefore, it is still necessary to collect rumen fluid from a live ruminant while considering cost, animal welfare, and representativeness. The method of esophageal tubing provides representative rumen sample similar to the sample collected via the rumen cannula [17], meanwhile balancing both the cost and representativeness for a rumen fluid acquirement. It is important to collect rumen fluid from animals that are acclimated to a fermentation substrate fed consistently. Mlambo et al. [19] found that adapted rumen fluid produced more gas production when compared with rumen fluid not adapted to the fermentation substrate. These results suggest that the inoculum collected from the animals fed the same diet with fermentation substrate and collected by esophageal tubing offers a practical approach for in vitro fermentation studies.
A typical in vitro fermentation process involves incremental gas production and total VFA concentration due to continuous fermentation of carbohydrates, whilst other rumen fermentation characteristics, such as ammonia nitrogen (NH3-N), microbial crude protein (MCP), pH value, individual volatile fatty acids (VFA), have not shown consistent trends as the in vitro fermentation progressed [20,21,22]. Despite various data reporting that rumen in vitro fermentation characteristics may differ according to ending time points [4,22,23,24]. Statistical comparisons of in vitro rumen fermentation parameters at various end points are not well established, limiting perspectives on determining ideal sampling times in capturing the process of fermentation as it progresses over time. Onime et al. [11] investigated the in vitro dynamic rumen fermentation characteristics using substrate with concentrate to forage ratio of 25:75 and 75:25, they found that total VFA, acetate, and butyrate concentrations were higher in sampling at 24 h than that in sampling at 0 h, and opposite result was emerged in pH value in both substrates. They also reported that the absolute abundances of Ruminococcus albus and Streptococcus bovis were higher in sampling at 24 h when compared with the collection time of 0 h using the quantitative real time polymerase chain reaction (QPCR), and there were no differences in Butyrivibrio fibrisolvens and Megasphaera elsdenii abundances between these two sampling times [11]. The method of QPCR was also taken by Kang et al. [25] to quantify the cellulolytic bacteria changes at 6 h and 24 h fermentation. Ruiz et al. [26] detected the dynamics of cellulolytic bacteria and cellulolytic fungi as in vitro fermentation progressed using microbiological counting methods. However, QPCR or traditional microbiological visually counting could only quantify some of ruminal bacteria at a time, hence more advanced technology is needed to uncover the variations of rumen bacterial community composition during the in vitro fermentation process. The technology of 16S rRNA gene sequences paves the way for quantifying the bacteria or archaea abundances at different taxonomic classifications for both cultured microorganisms and environmental sequences, as well as diversity and similarity between groups [27]. This 16S rRNA based technique has been widely used to investigate the rumen microbial populations and metabolic activity [28,29,30,31]. Gilbert et al. [32] took the technology of 16S rRNA gene amplicon sequencing to track the day-to-day microbial populations over a 14 day in vitro fermentation period, and they reported time-related variations as the microorganisms adapted to the certain fermentation condition. The widely used and proven technology should also be adapted to the typically short-period ruminal in vitro fermentation, so that a more comprehensive profile of rumen bacteria community could be drawn as in vitro fermentation advances.
In this study, we conducted an in vitro fermentation experiment to explore: (1) whether the rumen fermentation characteristics and bacterial community composition varied during a 24 h in vitro fermentation, and (2) the necessity to collect both 12 h and 24 h samples for bacterial community analysis of in vitro fermentation test. We hypothesized that rumen fermentation characteristics would vary during fermentation process but not the response for fermentation pattern and efficiency, and most of the rumen bacterial community composition would remain similar.

2. Materials and Methods

2.1. Composition of Fermentation Substrate

The fermentation substrate was the total mixed ration for high-yielding Chinese Holstein cows; the ingredients and nutrient composition of the diet are listed in Table 1.

2.2. Rumen Fluid Collection and Experimental Design

The animal care and welfare involved in this experiment were permitted by the Committee for the Care and Use of Experimental Animals at Jiangxi Agricultural University (JXAULL-20190017). Five Holstein cows (41.0 ± 6.36 months; parity = 3.44 ± 0.53; milk yield = 35.2 ± 1.04 kg/d; mean ± SD) were taken as the rumen fluid donors and were fed the same diet as fermentation substrate (Table 1) for two months before rumen content collection. The rumen content was collected 1 h before morning feeding using esophageal tube as described by Paz et al. [17], wherein both fluid and solid fractions were obtained. Rumen content was firstly mixed for 3 min using a handmixer to remove cellulolytic bacteria which are attached to fibre particles, and then was separated by filtering with four layers of gauze to obtain the rumen fluid. The pH value was determined immediately after rumen content was taken out using a pH meter (Rex PHBJ-260, Shanghai INESA Scientific Instrument Co., Ltd., Shanghai, China) and the pH value was 6.74, 6.87, 6.89, 6.92, and 6.78 for the sampled cows, respectively. All five rumen fluid samples were mixed in equal proportions in a 5 L-glass bottle and was finally used as the rumen fluid for the subsequent in vitro test. Three samples from the mixed rumen fluid were collected randomly for the detection of basal characteristics of original rumen fluid (designated as ORF), and two fermentation time points: 12 h (designated as R12) and 24 h (designated as R24), with ten replications in each time point, were designed to carry out an in vitro incubation.

2.3. In Vitro Incubation

The composition of in vitro cultivation medium was the same as described in Zheng et al. [33]. Briefly, distilled water, artificial saliva, constant element solution, trace element solution, reducing agent solution, and resazurin solution were evenly mixed at the ratio of 47.56%, 23.78%, 23.78%, 0.01%, 4.76% and 0.11% according to volume, respectively. The detailed composition of each solution was described in Zheng et al. [33], as well as showed in Table S1. For each replication, 0.40 g of fermentation substrate was added to the 60 mL inoculum, which was composed of above prepared cultivation medium and rumen fluid at the volume ratio of 2:1. The CO2 was injected to remove oxygen in the 125-mL vessel and the vessel was then promptly sealed with rubber plug to set to the incubator, which was conducted under the steady temperature of 39 °C and fluctuating frequency of 120 r/min. Gas production (in volume, mL) was recorded directly from a tube marked with scale value at the time point of 3 h, 6 h, 9 h, 12 h, 18 h, and 24 h. Fermented product was collected at 12 h and 24 h (both were from ten different vessels), which was terminated with ice. The pH value was determined immediately after the fermented product was collected and the subsequent samples were obtained by filtering through four layers of gauze. The filtered samples were used for DNA extraction and rumen fermentation characteristics determination, including NH3-N, MCP, lactate, and VFA.

2.4. Rumen Fermentation Characteristics Determination

The NH3-N concentration was determined using the method of phenol-hypochlorite reaction as described in Broderick and Kang [34]. The Folin phenol method based on Lowry’s assay was taken to determine the concentration of MCP, as described by Makkar et al. [35]. The concentration of lactate was measured using the corresponding assay kit purchasing from Jiancheng Bioengineering institute (Nanjing, China). VFA measurement was performed according to our previous study [36], where a gas chromatograph (GC-2014 Shimadzu Corporation, Kyoto, Japan) equipped with a 30 m capillary column (Rtx-Wax, 0.25 mm ID × 0.25 µm film, Restek, Evry, France) was taken. Individual VFA measured included acetate, propionate, isobutyrate, butyrate, isovalerate, and valerate, with the sum of isobutyrate, valerate, and isovalerate defined as branched-chain volatile fatty acids (BCVFA). The production of methane (CH4) was estimated as described by Moss et al. [37], with the calculation in Equation (1):
CH4 = 0.45 × C2 − 0.275 × C3 + 0.40 × C4
where C2 indicates the concentration of acetate, C3 and C4 indicate propionate and butyrate concentrations, respectively. The non-glucogenic to glucogenic acids ratio (NGR) was calculated as Equation (2):
NGR = (C2 + 2 × C4 + C5)/(C3 + C5)
and fermentation efficiency (FE) was calculated as Equation (3):
FE = (0.622 × C2 + 1.092 × C3 + 1.56 × C4)/(C2 + C3 + 2 × C4)
where C2, C3, C4, and C5 indicate acetate, propionate, butyrate, and valerate, respectively; both were carried out according to Wang et al. [4].

2.5. Bacterial Community Analysis

Twenty-three DNA samples (10, 10, and 3 for R12, R24, and ORF, respectively) were extracted using a DNA Kit (OMEGA, Omega Bio-Tek, Norcross, GA, USA), and the method of two-step of bead-beating was taken as described in Paz et al. [17]. The purity and quality of the extracted DNA were checked on a 1% agarose gel, and the concentration of extracted DNA was determined by a Qubit 2.0 Fluorometer (Life Technologies Corporation, Carlsbad, CA, USA). The DNA concentration was diluted to 1 ng/μL according to the previous quantitation, and the diluted DNA was used for subsequent sequencing analysis.
A total of twenty-three high-purity and high-quality DNA were transported to the Allwegene Gene Technology Co., LTD (Nanjing, China) for PCR amplification and MiSeq sequencing. The V3 to V4 hypervariable region was selected as the target gene fragment, with the barcoded primers as follows: 338F (5′-ACTCCTACGGGAGGCAGCAG-3′) and 806R (5′-GGACTACHVGGGTWTCTAAT-3′). The amplification reaction system and program were the same as our previous report [38]. Each sample was amplified with three replications, and PCR products were evaluated on 2% agarose gels and purified by an AxyPrep DNA Gel Extraction kit (Axygen Biosciences, Union City, CA, USA). The qualified libraries were sequenced on an Illumina MiSeq platform (San Diego, CA, USA) following the manufacturer’s instructions, wherein 300 bp paired-end reads were generated.
The raw data were analyzed using the quantitative insights into microbial ecology (QIIME, version 1.9.1). Paired end reads were merged by the Fast Length Adjustment of Short reads (FLASH, version 1.2.11). The length of the sequences was set between 250 bp and 500 bp. Sequences were filtered if they met one of the below criteria: containing ambiguous base or chimera, the evaluated quality score less than 20, or a mismatch to primer sequences or barcode tags. The filtered high-quality sequences were clustered into operational taxonomic units (OTUs) at the similarity of 97% by means of UPARSE method (USEARCH v11.0.667, [39]). OTUs across samples were rarefied to the lowest sample depth (41,988 reads), with an average OTUs of 2164. Alpha diversity metrics were calculated using the Mothur software package (version 1.43.0, Patrick Schloss, Ann Arbor, MI, USA) [40]. Taxonomic classifications were performed by assigning against the SILVA database release 128 (https://www.arb-silva.de/, accessed on 29 September 2016, [41]) using Ribosomal Database Project (RDP) classifier (http://sourceforge.net/projects/rdp-classifier/, accessed on 30 September 2016) with a confidence threshold of 70% [42]. The principal component analysis (PCA) and non-metric multidimensional scaling (NMDS) were adopted to show the differences between R12 and R24, which were finished in R software basing on Euclidean distances and Bray–Curtis distances, respectively. Analysis of similarity (ANOSIM) was performed to assess the similarities between R12 and R24 using the vegan community ecology package. Correlations between gas production, rumen fermentation characteristics, and rumen bacterial community were presented with a heat map, which was performed using GraphPad Prism (version 8.0.2, GraphPad Software, Inc., San Diego, CA, USA). The Spearman correlation coefficients (r) and FDR corrected values (q) were calculated by the Psych packages (version 1.8.12) to show their correlations.

2.6. Statistical Analysis

All data in this study were confirmed to be normally distributed after normality test. A two-tailed Student’s t-test was then performed for comparisons between R12 and R24 using SPSS (version 21, IBM Corporation, Armonk, NY, USA). The significance was declared at 0.05 (p < 0.05).

3. Results

3.1. Total Gas Production and Methane Production

The production of total gas and methane as fermentation process advanced is shown in Figure 1. Both the total gas production and methane production in R24 were higher than that in R12 (both were p < 0.001), increased by 39.03% and 13.04% for total gas and methane production, respectively.

3.2. Rumen Fermentation Characteristics

The rumen fermentation characteristics as the fermentation process advanced are shown in Table 2. The pH value in R24 was lower than that in R12 (p = 0.001). Individual volatile fatty acids, as well as BCVFA and total VFA, were observed to be higher in R24 than that in R12 (p < 0.01). Both microbial crude protein and ammonia nitrogen were higher in R24 when compared with R12 (p < 0.001). However, no significant differences were observed in lactate concentration, acetate to propionate ratio, NGR, and FE between R12 and R24 (p > 0.05).

3.3. Alpha Diversity Metrics

As shown in Table 3, phylogenetic diversity (PD) whole tree, Shannon index, and Simpson index were higher in R24 than that in R12 (p < 0.05), whereas no significant differences were observed in Chao 1 and observed species between R12 and R24 (p > 0.05).

3.4. Rumen Bacterial Community
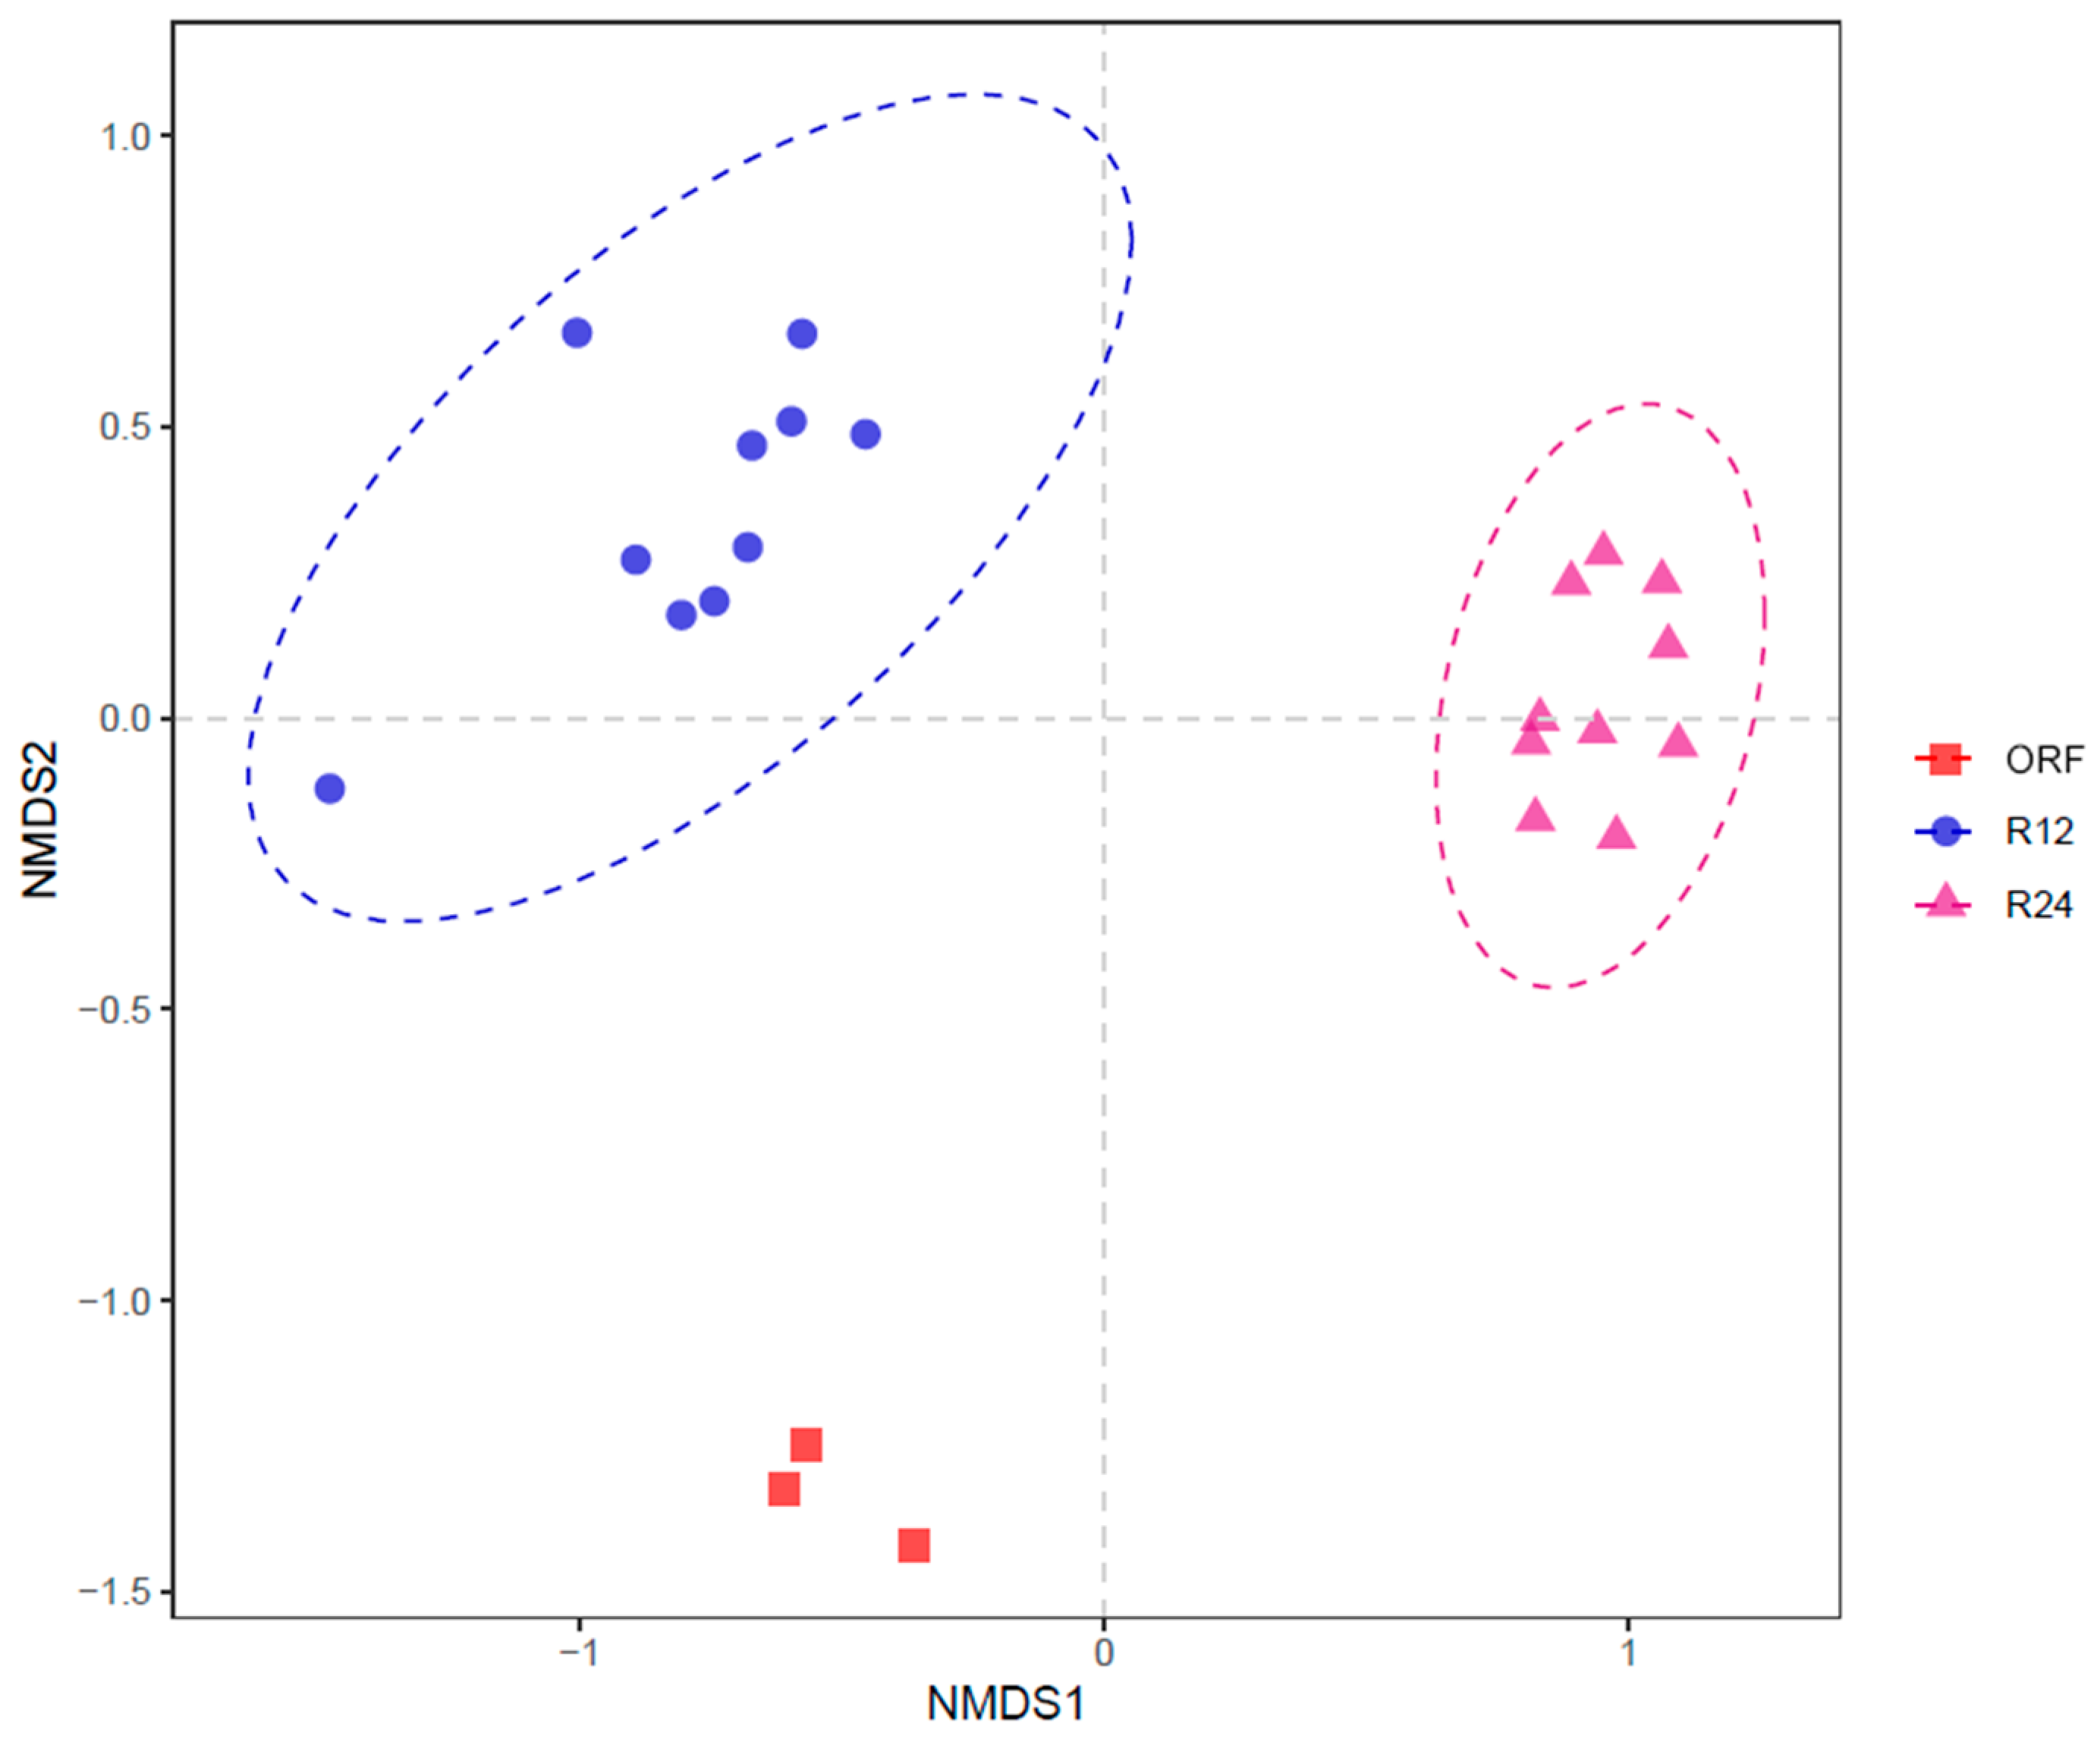
The taxonomic analysis at the level of phylum (relative abundance > 0.1%) is reported in Table 4. The relative abundances of Bacteroidetes, Firmicutes, Cyanobacteria, Verrucomicrobia, Lentisphaerae, and Synergistetes were higher in R24 than that in R12, whereas the relative abundances of Proteobacteria and Fibrobacteres were found to be higher in R12 than that in R24 (p < 0.05).
The taxonomic analysis at the genus level is shown in Table 5. A total of fifteen genera were observed with an average relative abundance greater than 0.5%, and ten of them were found with differences between R12 and R24. The abundances of Rikenellaceae RC9 gut group, Succiniclasticum, Prevotellaceae UCG-003, Christensenellaceae R-7 group, Ruminococcaceae UCG-002, Veillonellaceae UCG-001, and Ruminococcaceae NK4A214 group were higher in R24, whereas Succinivibrionaceae UCG-002, Ruminobacter, and Fibrobacter abundances were observed to be higher in R12 (p < 0.05).

3.5. Beta Diversity

As shown in Figure 2 and Figure 3, both PCA and NMDS showed obvious clusters between R12 and R24. ANOSIM analysis also showed significant differences in rumen bacterial community between R12 and R24 (R = 0.9659, p = 0.001).

3.6. Correlation Analysis

Correlations between gas production, rumen fermentation characteristics, and rumen bacterial community are shown in Figure 4. Gas production was negatively correlated with the abundances of Proteobacteria, Succinivibrionaceae UCG-002, and Ruminobacter (r < −0.70 and q < 0.05), the latter two genera were associated positively with pH value (r > 0.70 and q < 0.05). The Simpson index negatively correlated with pH value (r = −0.768 and q < 0.05). The methane production and NH3-N concentration correlated positively with Firmicutes, Rikenellaceae RC9 gut group, and Christensenellaceae R-7 group (r > 0.70 and q < 0.05). The Firmicutes, Rikenellaceae RC9 gut group, and Ruminococcaceae UCG-002 positively correlated with acetate, isobutyrate, isovalerate, total VFA, and BCVFA (r > 0.70 and q < 0.05), whereas Proteobacteria, Succinivibrionaceae UCG-002, and Ruminobacter were found to have negative associations with these rumen fermentation characteristics (r < −0.70 and q < 0.05).

4. Discussion

Fermentation gas is derived from the digestion of carbohydrate during the fermentation process, and is associated with rumen degradability of the organic matter [4]. Many reports have found the increased degradability of dry matter in going from 12 h to 24 h of in vitro fermentation [4,20,33]; therefore, it is easy to expect the higher gas production in R24. VFA is known as the main end product of substrate, and its composition, concentration, as well as acetate to propionate ratio are important indicators of fermentation characteristics [20]. Structural carbohydrates and nonstructural carbohydrates continue to degrade as the fermentation process advances, producing acetate and propionate, respectively [43]. Similar increased degradability and availability were also applied in other substrates, such as protein and starch, which are vital for the production of BCVFA and propionate, respectively [43].These well-stablished theories explained the higher concentrations of individual VFAs, total VFAs, and BCVFA in R24. However, fermentation time did not alter the fermentation pattern and efficiency, which could be seen from the non-significances in acetate to propionate ratio, NGR, and FE. More production of VFA would decrease the pH value, despite the increment in NH3-N concentration due to continuous degradation of protein [33]. Higher utilization of degraded protein yields more MCP, and the utilization is affected by the microbial composition and activity [33]. The higher MCP here could be explained by the higher bacterial diversity (Table 3) and varied bacterial community (Figure 2 and Figure 3). These results indicated that the yield of fermentation products developed in a time-dependent manner, whereas the fermentation pattern and efficiency were stable during in vitro fermentation.
Bacterial alpha diversity includes species richness and evenness, which are primarily described as Chao 1 and observed species, Shannon index and Simpson index, respectively. In this study, differences were found in evenness rather than richness between R12 and R24, which could be partly explained by the report that the number of some bacteria tended to be similar during the fermentation process from 12 to 24 h [44]. However, certain species at the level of phylum and genus experienced dynamic changes due to their adaptability of the microenvironment to fermentation substrate. Bacteroidetes and Firmicutes were regarded as the two phyla with the most abundances in ruminal bacteria [45], and the latter was found to be positively associated with VFA production [38], as well as correlated negatively with ruminal pH value [46]. Therefore, the incremental abundance of Firmicutes was expected because of the increased VFA concentration and lower pH value as fermentation progressed. The phyla of Fibrobacteres and Proteobacteria involve in fibre digestion [38], and previous report has found that cellulolytic and hemicellulolytic bacteria increased rapidly at the initial stage and declined gradually from 2 h to 24 h incubation [44], which explains the higher abundances of Fibrobacteres and Proteobacteria in R12. Qiu et al. [45] found that the abundance of Cyanobacteria increased during the adaptation to a new diet, and an incremental increase was observed in Cyanobacteria abundance in R24, indicating that this phylum may play vital roles in acclimation to shifted microenvironment. As an extremely acidophilic bacterium, Verrucomicrobia showed higher abundance in R24, probably due to its tolerance to low-pH and participation in methane metabolism [47]. Succinivibrionaceae UCG-002 and Ruminobacter belong to the family of Succinivibrionaceae, which is the principal producer of succinate and a competitor with methanogens for methanogenesis [48,49]. Therefore, it is reasonable to see these two genera with lower abundances in R24 due to the increased methane production. Rikenellaceae RC9 gut group was previously reported to play vital roles in carbohydrates degradation [50]. Moreover, Succiniclasticum, Prevotellaceae, and Ruminococcaceae were found to be more abundant in starch-rich diet and involved in the degradation of non-structure carbohydrate [38]. Therefore, it is expected the higher abundances of these genera itself or collateral to above families, namely Prevotellaceae UCG-003, Ruminococcaceae UCG-002, and Ruminococcaceae NK4A214 group, because amylolytic and lipolytic bacteria grew quickly during the incubation from 2 h to 24 h [44]. The abundance of Veillonellaceae UCG-001 was higher in R24, this could be partly explained by the fact that the family Veillonellaceae was able to degrade glycerol and was more active in acidic environment [51]. More evidence from obvious clusters between R12 and R24 in PCA and NMDS, as well as significance in ANOSIM, confirmed the varied bacterial community as incubation time advanced.
The correlation analysis revealed the relationships between gas production, rumen fermentation characteristics, rumen bacterial diversity and composition. The family Succinivibrionaceae competes with methanogens for hydrogen as a substrate for producing succinate instead of methane [48], which may explain the negative correlations between the abundances of two genera in this family, Succinivibrionaceae UCG-002 and Ruminobacter, and gas production. The phylum Firmicutes was reported with high hydrolytic potential to degrade organic compounds, such as protein and polysaccharides [52], providing evidence for the positive associations between Firmicutes and VFA production, as well as NH3-N concentration. Another evidence for their correlations would come from Hook et al. [46], who found that the proportion of Firmicutes was higher when cows were suffered from subacute ruminal acidosis, a common syndrome characterized by long-time duration of low pH value due to high VFA concentrations. Moreover, the relationship of Firmicutes and methanogens was hypothesized to contribute to methane synthesis in a similar manner [52], which was indirectly confirmed by Gonzalez-Fernandez et al. [53] with the findings that high abundance of Firmicutes yielded more methane. In this study, positive correlation was observed between Firmicutes and methane production, further verifying the aforementioned hypothesis. It is widely accepted that low pH value is not favorable for the growth of ruminal bacteria, especially the cellulolytic bacteria, and many studies have found the decreased bacteria diversity when ruminal pH declined [38,46]. As an indicator of bacterial diversity, the Simpson index showed negative associations with ruminal pH value due to above theories. The phylum Proteobacteria is mainly involved in degrading structural carbohydrates [38], whereas nonstructural carbohydrates are commonly regarded as rapidly fermentable organic compounds to yield abundant VFA and gas production [36,43,46]. Therefore, it is expected to observe the negative associations between Proteobacteria and VFA production, as well as gas production, which is in line with the report of Jin et al. [54]. The genus Rikenellaceae RC9 gut group was found to be involved in degrading fiber [38], and structural carbohydrates, such as fiber, would yield more acetate [43]; hence, it is obvious to expect a positive association between Rikenellaceae RC9 gut group abundance and acetate concentration. The abundance of Ruminococcaceae was reported to be higher in cattle fed high-density diet when compared with less-concentrate diet [38], indicating that this family may involve in nonfibrous material digestion. Ruminococcaceae UCG-002, a genus belonging to the family Ruminococcaceae, showed positive associations with VFA, partly due to the fact that more rapidly fermentable carbohydrates produce more VFA [43,55]. As a member of Christensenellaceae, Christensenellaceae R-7 group play important roles in degrading carbohydrates and amino acids into acetate and ammonia, respectively [56], which demonstrated well the positive correlations between Christensenellaceae R-7 group and acetate, as well as between Christensenellaceae R-7 group and NH3-N. A recent study revealed that better growth performance and meat quality could be achieved by increasing the abundance of Christensenellaceae R-7 group [57]; therefore, it is tempting to explore whether Christensenellaceae R-7 group could improve rumen fermentation both in vitro and in vivo.

5. Conclusions

Taken together, the yield of fermentation products increased as in vitro fermentation progressed. The bacterial evenness and part of bacteria at the level of phylum or genus varied during a 24 h in vitro incubation. Correlation analysis revealed associations between gas production and bacteria abundances, as well as correlations between rumen fermentation characteristics and bacteria abundances. This study provide insight into the dynamics of rumen fermentation characteristics and bacterial community composition during a 24 h in vitro fermentation and may provide a reference for decision making for the sampling time point.

Supplementary Materials

The following supporting information can be downloaded at: https://www.mdpi.com/article/10.3390/fermentation8060276/s1, Table S1: Ingredients and contents of each component in in vitro cultivation.

Author Contributions

Conceptualization, Q.Q.; methodology, Q.Q. and X.W.; validation, X.W., T.L. and Z.L.; formal analysis, Q.Q., T.L. and Y.L.; investigation, Q.Q., X.W., T.L., Z.L. and Y.L.; resources, Q.Q. and K.O.; data curation, Q.Q. and X.W.; writing—original draft preparation, Q.Q.; writing—review and editing, Q.Q., X.W. and K.O.; visualization, Q.Q.; supervision, Q.Q.; project administration, K.O.; funding acquisition, Q.Q. All authors have read and agreed to the published version of the manuscript.

Funding

This research was funded by the National Natural Science Foundation of China, 32160807; the Science and Technology Project of Education Department of Jiangxi Province, GJJ200451 and GJJ210405; Major Discipline Academic and Technical Leaders Training Program of Jiangxi Province, 20213BCJL22043; Jiangxi Agriculture Research System, JXARS-13.

Institutional Review Board Statement

The animal study protocol was approved by the Committee for the Care and Use of Experimental Animals at Jiangxi Agricultural University (JXAULL-20190017).

Informed Consent Statement

Not applicable.

Data Availability Statement

The raw sequences used in this study were deposited in the Sequence Read Archive (SRA) of NCBI, and the accession number is PRJNA848286.

Acknowledgments

We would like to express our thanks to laboratory members of Jiangxi Province Key Laboratory of Animal Nutrition for their assistance in sampling.

Conflicts of Interest

The authors declare no conflict of interest.

References

  1. Kim, E.T.; Hwang, H.S.; Lee, S.M.; Lee, S.J.; Lee, I.D.; Lee, S.K.; Oh, D.S.; Lim, J.H.; Yoon, H.B.; Jeong, H.Y.; et al. Effects of medicinal herb extracts on in vitro ruminal methanogenesis, microbe diversity and fermentation system. Asian-Australas. J. Anim. Sci. 2016, 29, 1280–1286. [Google Scholar] [CrossRef] [PubMed] [Green Version]
  2. Swift, R.W.; Hershberger, T.V.; Hartsook, E.W. Use of the artificial rumen technique to estimate the nutritive value of forages. J. Anim. Sci. 1959, 18, 1189. [Google Scholar]
  3. Pigden, W.J.; Bell, J.M. The artificial rumen as a procedure for evaluating forage quality. J. Anim. Sci. 1955, 14, 1239–1240. [Google Scholar]
  4. Wang, W.; Wu, Q.; Li, W.; Wang, Y.; Zhang, F.; Lv, L.; Li, S.; Yang, H. High-gossypol whole cottonseed exhibited mediocre rumen degradability and less microbial fermentation efficiency than cottonseed hull and cottonseed meal with an in vitro gas production technique. Fermentation 2022, 8, 103. [Google Scholar] [CrossRef]
  5. Keim, J.P.; Berthiaume, R.; Pacheco, D.; Muetzel, S. Comparison of rumen in vitro fermentation of temperate pastures using different batch culture systems. Anim. Prod. Sci. 2017, 57, 690–696. [Google Scholar] [CrossRef]
  6. Odenyo, A.A.; McSweeney, C.S.; Palmer, B.; Negassa, D.; Osuji, P.O. In vitro screening of rumen fluid samples from indigenous African ruminants provides evidence for rumen fluid with superior capacities to digest tannin-rich fodders. Aust. J. Agric. Res. 1999, 50, 1147–1157. [Google Scholar] [CrossRef]
  7. McSweeney, C.S.; Palmer, B.; Bunch, R.; Krause, D.O. In vitro quality assessment of tannin-containing tropical shrub legumes: Protein and fibre digestion. Anim. Feed Sci. Technol. 1999, 82, 227–241. [Google Scholar] [CrossRef]
  8. Remy, J.; Armstrong, S. Effect of substrate to inoculum ratio on outcomes of in vitro rumen fermentation. In Proceedings of the ADSA Annual Meeting, Cincinnati, OH, USA, 23–26 June 2019. [Google Scholar]
  9. Gülşen, N.; Arik, H.; Hayirli, A.; Alatas, M.; Aksoy, M. Utilization of cryopreserved ruminal liquor in in vitro gas production technique for evaluating nutritive value of some feedstuffs. Kafkas Univ. Vet. Fak. Derg. 2017, 23, 325–332. [Google Scholar]
  10. Broudiscou, L.P.; Offner, A.; Sauvant, D. Effects of inoculum source, pH, redox potential and headspace di-hydrogen on rumen in vitro fermentation yields. Animal 2014, 8, 931–937. [Google Scholar] [CrossRef]
  11. Onime, L.; Zanfi, C.; Agostinis, C.; Bulla, R.; Spanghero, M. The use of quantitative real time polymerase chain reaction to quantify some rumen bacterial strains in an in vitro rumen system. Ital. J. Anim. Sci. 2013, 12, e58. [Google Scholar] [CrossRef]
  12. Váradyová, Z.; Štyriaková, I.; Kišidayová, S. Effect of natural dolomites on the in vitro fermentation and rumen protozoan population using rumen fluid and fresh faeces inoculum from sheep. Small Rumin. Res. 2007, 73, 58–66. [Google Scholar] [CrossRef]
  13. Boguhn, J.; Kluth, H.; Rodehutscord, M. Effect of total mixed ration composition on fermentation and efficiency of ruminal microbial crude protein synthesis in vitro. J. Dairy Sci. 2006, 89, 1580–1591. [Google Scholar] [CrossRef] [Green Version]
  14. Dyne, G.M.V.; Haug, P.T. Variables Affecting In Vitro Rumen Fermentation Studies in Forage Evaluation: An Annotated Bibliography; Oak Ridge National Lab., Tenn.: Oak Ridge, TN, USA, 1968. [Google Scholar] [CrossRef] [Green Version]
  15. Church, D.C.; Petersen, R.G. Effect of several variables on in vitro rumen fermentation. J. Dairy Sci. 1960, 43, 81–92. [Google Scholar] [CrossRef]
  16. Cutrignelli, M.I.; Calabrò, S.; Tudisco, R.; Zicarelli, F.; Gazaneo, M.P.; Piccolo, V. Comparison of buffalo rumen liquor and buffalo faeces as inoculum for the in vitro gas production technique. Ital. J. Anim. Sci. 2005, 4, 319–321. [Google Scholar] [CrossRef]
  17. Paz, H.A.; Anderson, C.L.; Muller, M.J.; Kononoff, P.J.; Fernando, S.C. Rumen bacterial community composition in Holstein and Jersey cows is different under same dietary condition and is not affected by sampling method. Front. Microbiol. 2016, 7, 1206. [Google Scholar] [CrossRef] [PubMed]
  18. Ramos-Morales, E.; Arco-Pérez, A.; Martín-García, A.I.; Yáñez-Ruiz, D.R.; Frutos, P.; Hervás, G. Use of stomach tubing as an alternative to rumen cannulation to study ruminal fermentation and microbiota in sheep and goats. Anim. Feed Sci. Technol. 2014, 198, 57–66. [Google Scholar] [CrossRef] [Green Version]
  19. Mlambo, V.; Sikosana, J.L.N.; Mould, F.L.; Smith, T.; Owen, E.; Mueller-Harvey, I. The effectiveness of adapted rumen fluid versus PEG to ferment tannin-containing substrates in vitro. Anim. Feed Sci. Technol. 2007, 136, 128–136. [Google Scholar] [CrossRef]
  20. Zheng, Y.; He, T.; Xie, T.; Wang, J.; Yang, Z.; Sun, X.; Wang, W.; Li, S. Hydroxy-selenomethionine supplementation promotes the in vitro rumen fermentation of dairy cows by altering the relative abundance of rumen microorganisms. J. Appl. Microbiol. 2022, 132, 2583–2593. [Google Scholar] [CrossRef]
  21. Zhang, X.; Dong, X.; Wanapat, M.; Shah, A.M.; Luo, X.; Peng, Q.; Kang, K.; Hu, R.; Guan, J.; Wang, Z. Ruminal pH pattern, fermentation characteristics and related bacteria in response to dietary live yeast (Saccharomyces cerevisiae) supplementation in beef cattle. Anim. Biosci. 2022, 35, 184–195. [Google Scholar] [CrossRef]
  22. Kim, J.N.; Song, J.; Kim, E.J.; Chang, J.; Kim, C.-H.; Seo, S.; Chang, M.B.; Bae, G.-S. Effects of short-term fasting on in vivo rumen microbiota and in vitro rumen fermentation characteristics. Asian-Australas. J. Anim. Sci. 2019, 32, 776–782. [Google Scholar] [CrossRef] [Green Version]
  23. Ramos, S.C.; Jeong, C.-D.; Mamuad, L.L.; Kim, S.-H.; Son, A.R.; Miguel, M.A.; Islam, M.; Cho, Y.-I.; Lee, S.-S. Enhanced ruminal fermentation parameters and altered rumen bacterial community composition by formulated rumen buffer agents fed to dairy cows with a high-concentrate diet. Agriculture 2021, 11, 554. [Google Scholar] [CrossRef]
  24. Wang, Y.; Alexander, T.W.; McAllister, T.A. In vitro effects of phlorotannins from Ascophyllum nodosum (brown seaweed) on rumen bacterial populations and fermentation. J. Sci. Food Agric. 2009, 89, 2252–2260. [Google Scholar] [CrossRef]
  25. Kang, J.; Zeng, B.; Tang, S.; Wang, M.; Han, X.; Zhou, C.; Yan, Q.; Liu, J.; Tan, Z. Effects of Momordica charantia polysaccharide on in vitro ruminal fermentation and cellulolytic bacteria. Ital. J. Anim. Sci. 2017, 16, 226–233. [Google Scholar] [CrossRef] [Green Version]
  26. Ruiz, O.; Castillo, Y.; Arzola, C.; Burrola, E.; Salinas, J.; Corral, A.; Hume, M.E.; Murillo, M.; Itza, M. Effects of Candida norvegensis live cells on in vitro oat straw rumen fermentation. Asian-Australas. J. Anim. Sci. 2016, 29, 211–218. [Google Scholar] [CrossRef] [Green Version]
  27. Yarza, P.; Yilmaz, P.; Pruesse, E.; Glöckner, F.O.; Ludwig, W.; Schleifer, K.-H.; Whitman, W.B.; Euzéby, J.; Amann, R.; Rosselló-Móra, R. Uniting the classification of cultured and uncultured bacteria and archaea using 16S rRNA gene sequences. Nat. Rev. Microbiol. 2014, 12, 635–645. [Google Scholar] [CrossRef]
  28. Huang, X.; Mi, J.; Denman, S.E.; Basangwangdui; Pingcuozhandui; Zhang, Q.; Long, R.; McSweeney, C.S. Changes in rumen microbial community composition in yak in response to seasonal variations. J. Appl. Microbiol. 2022, 132, 1652–1665. [Google Scholar] [CrossRef]
  29. Denman, S.E.; Martinez Fernandez, G.; Shinkai, T.; Mitsumori, M.; McSweeney, C.S. Metagenomic analysis of the rumen microbial community following inhibition of methane formation by a halogenated methane analog. Front. Microbiol. 2015, 6, 1087. [Google Scholar] [CrossRef]
  30. Kang, S.H.; Evans, P.; Morrison, M.; McSweeney, C. Identification of metabolically active proteobacterial and archaeal communities in the rumen by DNA- and RNA-derived 16S rRNA gene. J. Appl. Microbiol. 2013, 115, 644–653. [Google Scholar] [CrossRef] [Green Version]
  31. Krause, D.O.; Smith, W.J.M.; Ryan, F.M.E.; Mackie, R.I.; McSweeney, C.S. Use of 16S-rRNA based techniques to investigate the ecological succession of microbial populations in the immature lamb rumen: Tracking of a specific strain of inoculated ruminococcus and interactions with other microbial populations in vivo. Microb. Ecol. 1999, 38, 365–376. [Google Scholar] [CrossRef]
  32. Gilbert, R.A.; Netzel, G.; Chandra, K.; Ouwerkerk, D.; Fletcher, M.T. Degradation of the indospicine toxin from Indigofera spicata by a mixed population of rumen bacteria. Toxins 2021, 13, 389. [Google Scholar] [CrossRef]
  33. Zheng, Y.H.; Zhao, Y.Y.; Xue, S.L.; Wang, W.; Wang, Y.J.; Cao, Z.J.; Yang, H.J.; Li, S.L. Feeding value assessment of substituting cassava (Manihot esculenta) residue for concentrate of dairy cows using an in vitro gas test. Animals 2021, 11, 307. [Google Scholar] [CrossRef] [PubMed]
  34. Broderick, G.A.; Kang, J.H. Automated simultaneous determination of ammonia and total amino acids in ruminal fluid and in vitro media. J. Dairy Sci. 1980, 63, 64–75. [Google Scholar] [CrossRef]
  35. Makkar, H.P.; Sharma, O.P.; Dawra, R.K.; Negi, S.S. Simple determination of microbial protein in rumen liquor. J. Dairy Sci. 1982, 65, 2170–2173. [Google Scholar] [CrossRef]
  36. Qiu, Q.; Wei, X.; Zhang, L.; Li, Y.; Qu, M.; Ouyang, K. Effect of dietary inclusion of tea residue and tea leaves on ruminal fermentation characteristics and methane production. Anim. Biotechnol. 2021; in press. [Google Scholar]
  37. Moss, A.R.; Jouany, J.P.; Newbold, J. Methane production by ruminants: Its contribution to global warming. Ann. Zootech. 2000, 49, 231–253. [Google Scholar] [CrossRef] [Green Version]
  38. Qiu, Q.; Gao, C.; Aziz ur Rahman, M.; Cao, B.; Su, H. Digestive ability, physiological characteristics, and rumen bacterial community of Holstein finishing steers in response to three nutrient density diets as fattening phases advanced. Microorganisms 2020, 8, 335. [Google Scholar] [CrossRef] [Green Version]
  39. Edgar, R.C. UPARSE: Highly accurate OTU sequences from microbial amplicon reads. Nat. Methods 2013, 10, 996–998. [Google Scholar] [CrossRef] [PubMed]
  40. Schloss, P.D.; Westcott, S.L.; Ryabin, T.; Hall, J.R.; Hartmann, M.; Hollister, E.B.; Lesniewski, R.A.; Oakley, B.B.; Parks, D.H.; Robinson, C.J.; et al. Introducing mothur: Open-source, platform-independent, community-supported software for describing and comparing microbial communities. Appl. Environ. Microbiol. 2009, 75, 7537–7541. [Google Scholar] [CrossRef] [Green Version]
  41. Quast, C.; Pruesse, E.; Yilmaz, P.; Gerken, J.; Schweer, T.; Yarza, P.; Peplies, J.; Glockner, F.O. The SILVA ribosomal RNA gene database project: Improved data processing and web-based tools. Nucleic Acids Res. 2013, 41, D590–D596. [Google Scholar] [CrossRef]
  42. Qiong, W.; Garrity, G.M.; Tiedje, J.M.; Cole, J.R. Naive Bayesian classifier for rapid assignment of rRNA sequences into the new bacterial taxonomy. Appl. Environ. Microbiol. 2007, 73, 5261–5267. [Google Scholar]
  43. Dijkstra, J. Production and absorption of volatile fatty-acids in the rumen. Livest. Prod. Sci. 1994, 39, 61–69. [Google Scholar] [CrossRef]
  44. Kozakai, K.; Nakamura, T.; Kobayashi, Y.; Tanigawa, T.; Osaka, I.; Kawamoto, S.; Hara, S. Effect of mechanical processing of corn silage on in vitro ruminal fermentation, and in situ bacterial colonization and dry matter degradation. Can. J. Anim. Sci. 2007, 87, 259–267. [Google Scholar] [CrossRef]
  45. Qiu, Q.; Gao, C.; Gao, Z.; Muhammad Aziz ur, R.; He, Y.; Cao, B.; Su, H. Temporal dynamics in rumen bacterial community composition of finishing steers during an adaptation period of three months. Microorganisms 2019, 7, 410. [Google Scholar] [CrossRef] [PubMed] [Green Version]
  46. Hook, S.E.; Steele, M.A.; Northwood, K.S.; Dijkstra, J.; France, J.; Wright, A.D.G.; McBride, B.W. Impact of subacute ruminal acidosis (SARA) adaptation and recovery on the density and diversity of bacteria in the rumen of dairy cows. FEMS Microbiol. Ecol. 2011, 78, 275–284. [Google Scholar] [CrossRef] [Green Version]
  47. Dunfield, P.F.; Yuryev, A.; Senin, P.; Smirnova, A.V.; Stott, M.B.; Hou, S.; Ly, B.; Saw, J.H.; Zhou, Z.; Ren, Y.; et al. Methane oxidation by an extremely acidophilic bacterium of the phylum Verrucomicrobia. Nature 2007, 450, 879–882. [Google Scholar] [CrossRef]
  48. McCabe, M.S.; Cormican, P.; Keogh, K.; O’Connor, A.; O’Hara, E.; Palladino, R.A.; Kenny, D.A.; Waters, S.M. Illumina MiSeq phylogenetic amplicon sequencing shows a large reduction of an uncharacterised succinivibrionaceae and an increase of the Methanobrevibacter gottschalkii clade in feed restricted cattle. PLoS ONE 2015, 10, e0133234. [Google Scholar] [CrossRef]
  49. Pope, P.B.; Smith, W.; Denman, S.E.; Tringe, S.G.; Barry, K.; Hugenholtz, P.; McSweeney, C.S.; McHardy, A.C.; Morrison, M. Isolation of Succinivibrionaceae implicated in low methane emissions from Tammar wallabies. Science 2011, 333, 646–648. [Google Scholar] [CrossRef] [PubMed]
  50. Pitta, D.W.; Pinchak, W.E.; Dowd, S.E.; Osterstock, J.; Gontcharova, V.; Youn, E.; Dorton, K.; Yoon, I.; Min, B.R.; Fulford, J.D.; et al. Rumen bacterial diversity dynamics associated with changing from bermudagrass hay to grazed winter wheat diets. Microb. Ecol. 2010, 59, 511–522. [Google Scholar] [CrossRef]
  51. Braz, G.H.R.; Fernandez-Gonzalez, N.; Lema, J.M.; Carballa, M. Organic overloading affects the microbial interactions during anaerobic digestion in sewage sludge reactors. Chemosphere 2019, 222, 323–332. [Google Scholar] [CrossRef]
  52. Greses, S.; Gaby, J.C.; Aguado, D.; Ferrer, J.; Seco, A.; Horn, S.J. Microbial community characterization during anaerobic digestion of Scenedesmus spp. under mesophilic and thermophilic conditions. Algal Res. 2017, 27, 121–130. [Google Scholar] [CrossRef]
  53. Gonzalez-Fernandez, C.; Barreiro-Vescovo, S.; de Godos, I.; Fernandez, M.; Zouhayr, A.; Ballesteros, M. Biochemical methane potential of microalgae biomass using different microbial inocula. Biotechnol. Biofuels 2018, 11, 184. [Google Scholar] [CrossRef]
  54. Jin, W.; Xue, C.; Liu, J.; Yin, Y.; Zhu, W.; Mao, S. Effects of disodium fumarate on in vitro rumen fermentation, the production of lipopolysaccharide and biogenic amines, and the rumen bacterial community. Curr. Microbiol. 2017, 74, 1337–1342. [Google Scholar] [CrossRef] [PubMed]
  55. Chen, X.B.; Feng, Y.L. A study on the relationship between VFA production and fermentable organic matter in the rumen. Acta Zoonutrimenta Sin. 1996, 8, 32–36. [Google Scholar]
  56. Chen, R.; Li, Z.; Feng, J.; Zhao, L.; Yu, J. Effects of digestate recirculation ratios on biogas production and methane yield of continuous dry anaerobic digestion. Bioresour. Technol. 2020, 316, 123963. [Google Scholar] [CrossRef] [PubMed]
  57. Xiong, Y.; Guo, C.; Wang, L.; Chen, F.; Dong, X.; Li, X.; Ni, K.; Yang, F. Effects of paper mulberry silage on the growth performance, rumen microbiota and muscle fatty acid composition in Hu lambs. Fermentation 2021, 7, 286. [Google Scholar] [CrossRef]
Figure 1. Total gas production (left) and methane production (right) at 12 h and 24 h incubation. R12, in vitro rumen fermentation at 12 h; R24, in vitro rumen fermentation at 24 h. a,b Different lower-case letters indicate significant differences between the R12 and R24.
Fermentation 08 00276 g001
Figure 2. Principal component analysis (PCA) of rumen bacterial communities based on Euclidean distances. ORF, original rumen fluid; R12, in vitro rumen fermentation at 12 h; R24, in vitro rumen fermentation at 24 h.
Fermentation 08 00276 g002
Figure 3. Non-metric multidimensional scaling (NMDS) of rumen bacterial communities based on Bray–Curtis distances. ORF, original rumen fluid; R12, in vitro rumen fermentation at 12 h; R24, in vitro rumen fermentation at 24 h.
Fermentation 08 00276 g003
Figure 4. Correlations between gas production, rumen fermentation characteristics, and rumen bacterial community. VFA, volatile fatty acids; BCVFA, branched-chain volatile fatty acids; NH3-N, ammonia nitrogen; only significant correlations (r > 0.70 or r < −0.70 and q < 0.05) and bacteria with average relative abundances > 0.5% are shown. The colors indicate positive (red, closer to 1) or negative (blue, closer to −1).
Fermentation 08 00276 g004
Table 1. Ingredients and nutrient composition of the fermentation substrate (Dry matter basis, DM %).
Fermentation SubstrateDM %
Ingredients
Corn silage23.87
Alfalfa hay18.56
Oat hay2.64
Corn25.69
Soybean meal3.01
wheat7.65
wheat bran2.67
Beet pulp1.81
Molasses2.54
Cottonseed8.53
Fat-energy powder1.29
Dicalcium phosphate0.62
Salt0.57
Premix 10.55
Total100.00
Nutrient composition
Crude protein (CP)16.90
Net energy for lactation (NEL), Mcal/kg1.75
Neutral detergent fiber (NDF)31.01
Acid detergent fiber (ADF)23.10
Non-fibrous carbohydrate (NFC)40.27
Crude fat5.56
Calcium0.85
Phosphorus0.42
1 Premix was formulated to provide (per kilogram of premix): 1,000,000 IU of vitamin A, 200,000 IU of vitamin D, 1250 IU of vitamin E, 14,000 mg of Zn, 100 mg of Se, 180 mg of I, 3000 mg of Fe, 40 mg of Co, 3000 mg of Mn, and 3000 mg of Cu.
Table 2. Rumen fermentation characteristics as in vitro rumen fermentation advanced.
Item 1ORF 2R12 2R24 2SEM 3p-Value 4
pH value6.847.60 a7.32 b0.0470.001
Acetate, mM37.829.7 b33.7 a0.516<0.001
Propionate, mM10.311.6 b13.3 a0.221<0.001
Isobutyrate, mM0.390.19 b0.27 a0.009<0.001
Butyrate, mM4.103.64 b4.10 a0.0830.003
Isovalerate, mM0.480.60 b0.85 a0.032<0.001
Valerate, mM0.570.95 b1.08 a0.0250.005
Branched-chain volatile fatty acids, mM1.431.73 b2.20 a0.063<0.001
Total volatile fatty acids, mM53.646.7 b53.2 a0.825<0.001
Microbial crude protein, mg/LND 5121.8 b209.4 a10.5<0.001
Ammonia nitrogen, mg/dL
Lactate, mg/L
ND 5
ND 5
2.32 b
8.25
7.21 a
8.79
0.675
0.432
<0.001
0.542
Acetate to propionate ratio3.662.562.540.0270.699
Non-glucogenic to glucogenic acids ratio4.273.033.000.0360.688
Fermentation efficiency0.730.760.760.00080.746
1 Branched-chain volatile fatty acids, the sum of isobutyrate, valerate, and isovalerate; Total volatile fatty acid, the sum of acetate, propionate, isobutyrate, butyrate, isovalerate, and valerate. 2 ORF, original rumen fluid; R12, in vitro rumen fermentation at 12 h; R24, in vitro rumen fermentation at 24 h. 3 SEM, standard error of means. 4 Comparisons were conducted between R12 and R24. 5 ND, values not determined. a,b Different lower-case letters within the same row indicate significant differences between the R12 and R24. The same for tables below.
Table 3. Alpha diversity metrics of ruminal bacteria as in vitro rumen fermentation advanced.
ItemORFR12R24SEMp-Value
Chao 131612849297258.50.305
Observed species23332052222552.20.099
PD whole tree 1163.8143.5 b154.8 a2.820.042
Shannon index8.417.78 b8.26 a0.075<0.001
Simpson index0.9900.980 b0.989 a0.001<0.001
1 PD whole tree, phylogenetic diversity whole tree.
Table 4. Rumen bacterial composition at the phylum level as in vitro fermentation advanced.
PhylumORFR12R24SEMp-Value
Bacteroidetes61.6359.78 b66.62 a1.2990.005
Firmicutes20.8613.61 b22.28 a1.216<0.001
Proteobacteria10.6621.34 a5.33 b1.920<0.001
Saccharibacteria1.790.981.040.0940.757
Tenericutes2.600.970.770.0790.220
Fibrobacteres0.951.16 a0.85 b0.0710.009
Cyanobacteria0.200.59 b0.87 a0.0670.028
Spirochaetae0.190.560.640.0620.521
Verrucomicrobia0.310.28 b0.62 a0.0860.042
SR1 Absconditabacteria0.400.340.310.0390.737
Lentisphaerae0.070.13 b0.25 a0.0260.010
Elusimicrobia0.040.130.170.0150.283
Synergistetes0.050.07 b0.14 a0.0170.028
Table 5. Rumen bacterial composition at the genus level as in vitro fermentation advanced.
GenusORFR12R24SEMp-Value
Prevotella 139.4041.9142.511.2440.817
Succinivibrionaceae UCG-0027.4910.65 a2.09 b1.005<0.001
Rikenellaceae RC9 gut group5.054.22 b6.53 a0.362<0.001
Succiniclasticum1.763.05 b5.65 a0.5470.013
Ruminobacter1.587.28 a0.37 b0.842<0.001
Prevotellaceae UCG-0033.792.27 b2.74 a0.1110.032
Christensenellaceae R-7 group3.401.42 b2.83 a0.210<0.001
Prevotellaceae UCG-0012.301.261.20.1140.987
Candidatus Saccharimonas1.790.981.040.0940.757
Fibrobacter0.951.16 a0.85 b0.0710.009
Ruminococcaceae UCG-0141.501.040.730.0980.119
Succinivibrio0.250.750.970.0710.129
Ruminococcaceae UCG-0020.090.38 b1.13 a0.095<0.001
Veillonellaceae UCG-0010.730.40 b0.84 a0.0890.010
Ruminococcaceae NK4A214 group0.710.42 b0.70 a0.0620.019
Publisher’s Note: MDPI stays neutral with regard to jurisdictional claims in published maps and institutional affiliations.

