Article

The Influence of Sugar Composition and pH Regulation in Batch and Continuous Acetone–Butanol–Ethanol Fermentation

by
Miguel Capilla
,
Carlos Silvestre
,
Alejo Valles
,
Francisco Javier Álvarez-Hornos
,
Pau San-Valero
* and
Carmen Gabaldón
Research Group in Environmental Engineering (GI2AM), Department of Chemical Engineering, University of Valencia, 46100 Burjassot, Spain
*
Author to whom correspondence should be addressed.
Fermentation 2022, 8(5), 226; https://doi.org/10.3390/fermentation8050226
Submission received: 8 April 2022 / Revised: 11 May 2022 / Accepted: 11 May 2022 / Published: 15 May 2022
(This article belongs to the Special Issue Organic Waste Valorization into Added-Value Products)

Abstract

:
Acetone–butanol–ethanol (ABE) fermentation is influenced by external conditions. This work aimed to study the influence of pH regulation on monosaccharide composition in batch and continuous fermentation processes to determine butanol production and productivity. Batch fermentations with ammonium acetate or calcium carbonate combined with minimum pH control (pH ≥ 4.8 or 5.1) were assessed with pure xylose and glucose/xylose mixtures (ratios of 1:1 and 3:1). Continuous two-stage fermentation was developed using plastic rings to retain the biomass. Although batch fermentations with pure xylose performed better without active minimum pH control with both buffers, minimum pH control was necessary to metabolize xylose in the presence of glucose. Xylose uptake was favored by the use of calcium carbonate and pH ≥ 5.1 at a ratio of 1:1, while ammonium acetate and a pH ≥ 4.8 was the best option for a 3:1 ratio. The best butanol production and productivity values with sugar mixtures in batch reactors were 8.8 g L−1 and 0.61 g L−1 h−1 with an ammonium acetate pH ≥ 4.8 (ratio 3:1). The glucose/xylose ratio combined with pH regulation thus modulated xylose metabolism and solvent production in batch modes. Immobilized cells combined with operating at D = 0.333 h−1 and pH regulation increased butanol productivity almost fourfold up to 2.4 ± 0.2 g L−1 h−1.

1. Introduction

Interest in the development of biofuels has greatly increased due to the rapid depletion of fossil fuels and the rising production of greenhouse gases [1]. Because of its better physicochemical properties than other biofuels such as ethanol, biobutanol is being widely investigated [2]. Biobutanol can be transported and delivered by the existing infrastructures, which would reduce the overall cost of implementation [1,3]. It can be produced by solventogenic Clostridium via acetone–butanol–ethanol (ABE) fermentation, which can use monosaccharides from lignocellulosic biomasses, mainly glucose and xylose, to obtain second generation biobutanol [4].
However, the microorganism is not efficiently capable of uptaking different sugars simultaneously due to carbon catabolite repression (CCR) [5]. This phenomenon can be a problem, as it may cause sequential sugar uptake and increase residence time and overall costs. To overcome this drawback, several measures have been considered, such as fermentation conditions or metabolic engineering [6]. The operational conditions may change the outcome of the ABE fermentation; parameters such as carbon source (cellobiose, lactose or glucose) [7,8,9], media formulation (buffer components, nitrogen source or metals) [10,11,12] or pH [13] play an important role in developing and producing bacteria.
The combination of acid overproduction and low pH can lead to acid crash due to an undissociated acid concentration boost. These undissociated acid species can permeate through the cell, preventing sugar uptake and solvent production [14]. To avoid this, pH can be controlled by buffering compounds such as calcium carbonate [15] or ammonium acetate [16]. Focused chemical control strategies can also be used to regulate the pH value with C. acetobutylicum. Batch fermentations are the easiest and most conventional configurations for ABE fermentation [1]. For example, batch modes with different levels of initial glucose (33, 66 and 100 g L−1) [17] and with a two-stage pH control strategy [18] or with lignin-derived inhibitors from lignocellulosic pretreatment [19] have been tested.
In contrast, although continuous fermentation requires close process control, it allows increased productivity and sophisticated capabilities in the fermentation process [20]. The recent implementation of cell immobilization, which is under investigation mainly using glucose systems [21,22], has certain advantages, such as prevention of microorganism washout, uncoupling the dilution rate and the maximum growth rate or minimizing the propagation cost. However, there are other disadvantages such as clogging or mass-transfer limitations [20].
In the present work, a study was made of the influence of pH regulation on monosaccharide composition to evaluate butanol production and productivity in ABE fermentation. To assess the shared effect of buffer formulation and active pH control with pure xylose and glucose/xylose ratios (1:1 and 3:1), a novel pH-controlled continuous cell retention ABE fermentation was carried out in the optimal conditions of batch fermentations to further increase butanol productivity.

2. Materials and Methods

2.1. Microorganism and Medium Fermentation

C. acetobutylicum DSM 792 was acquired from DSMZ (German Collection of Microorganisms and Cell Cultures, Braunschweig, Germany) and maintained in 20% glycerol at −80 °C. For seed inoculum, the bacteria were statically cultured at 37° in 19 g L−1 of Reinforced Clostridial Medium (RCM) supplemented with 10 g L−1 of glucose. The sterilized fermentation medium contained (g L−1): sugars, 60 (glucose, xylose or sugar mixture); yeast extract, 5; KH2PO4, 0.5; K2HPO4, 0.5; resazurin sodium salt, 0.001; antifoam 204, 0.01%; MgSO4·7H2O, 0.2; MnSO4·7H2O, 0.01; and FeSO4·7H2O, 0.05. Two buffers were studied in batch fermentations: ammonium acetate and calcium carbonate bases. The buffers tested were ammonium acetate, 2.2 g L−1 or calcium carbonate, 5 g L−1 combined with NH4Cl, 2 g L−1. The chemicals were purchased from VWR, except for CaCO3 (Merk, Darmstadt, Germany), antifoam 204 (Sigma-Aldrich, St. Louis, MO, USA) and yeast extract (Alfa Aesar, Haverhill, MA, USA).

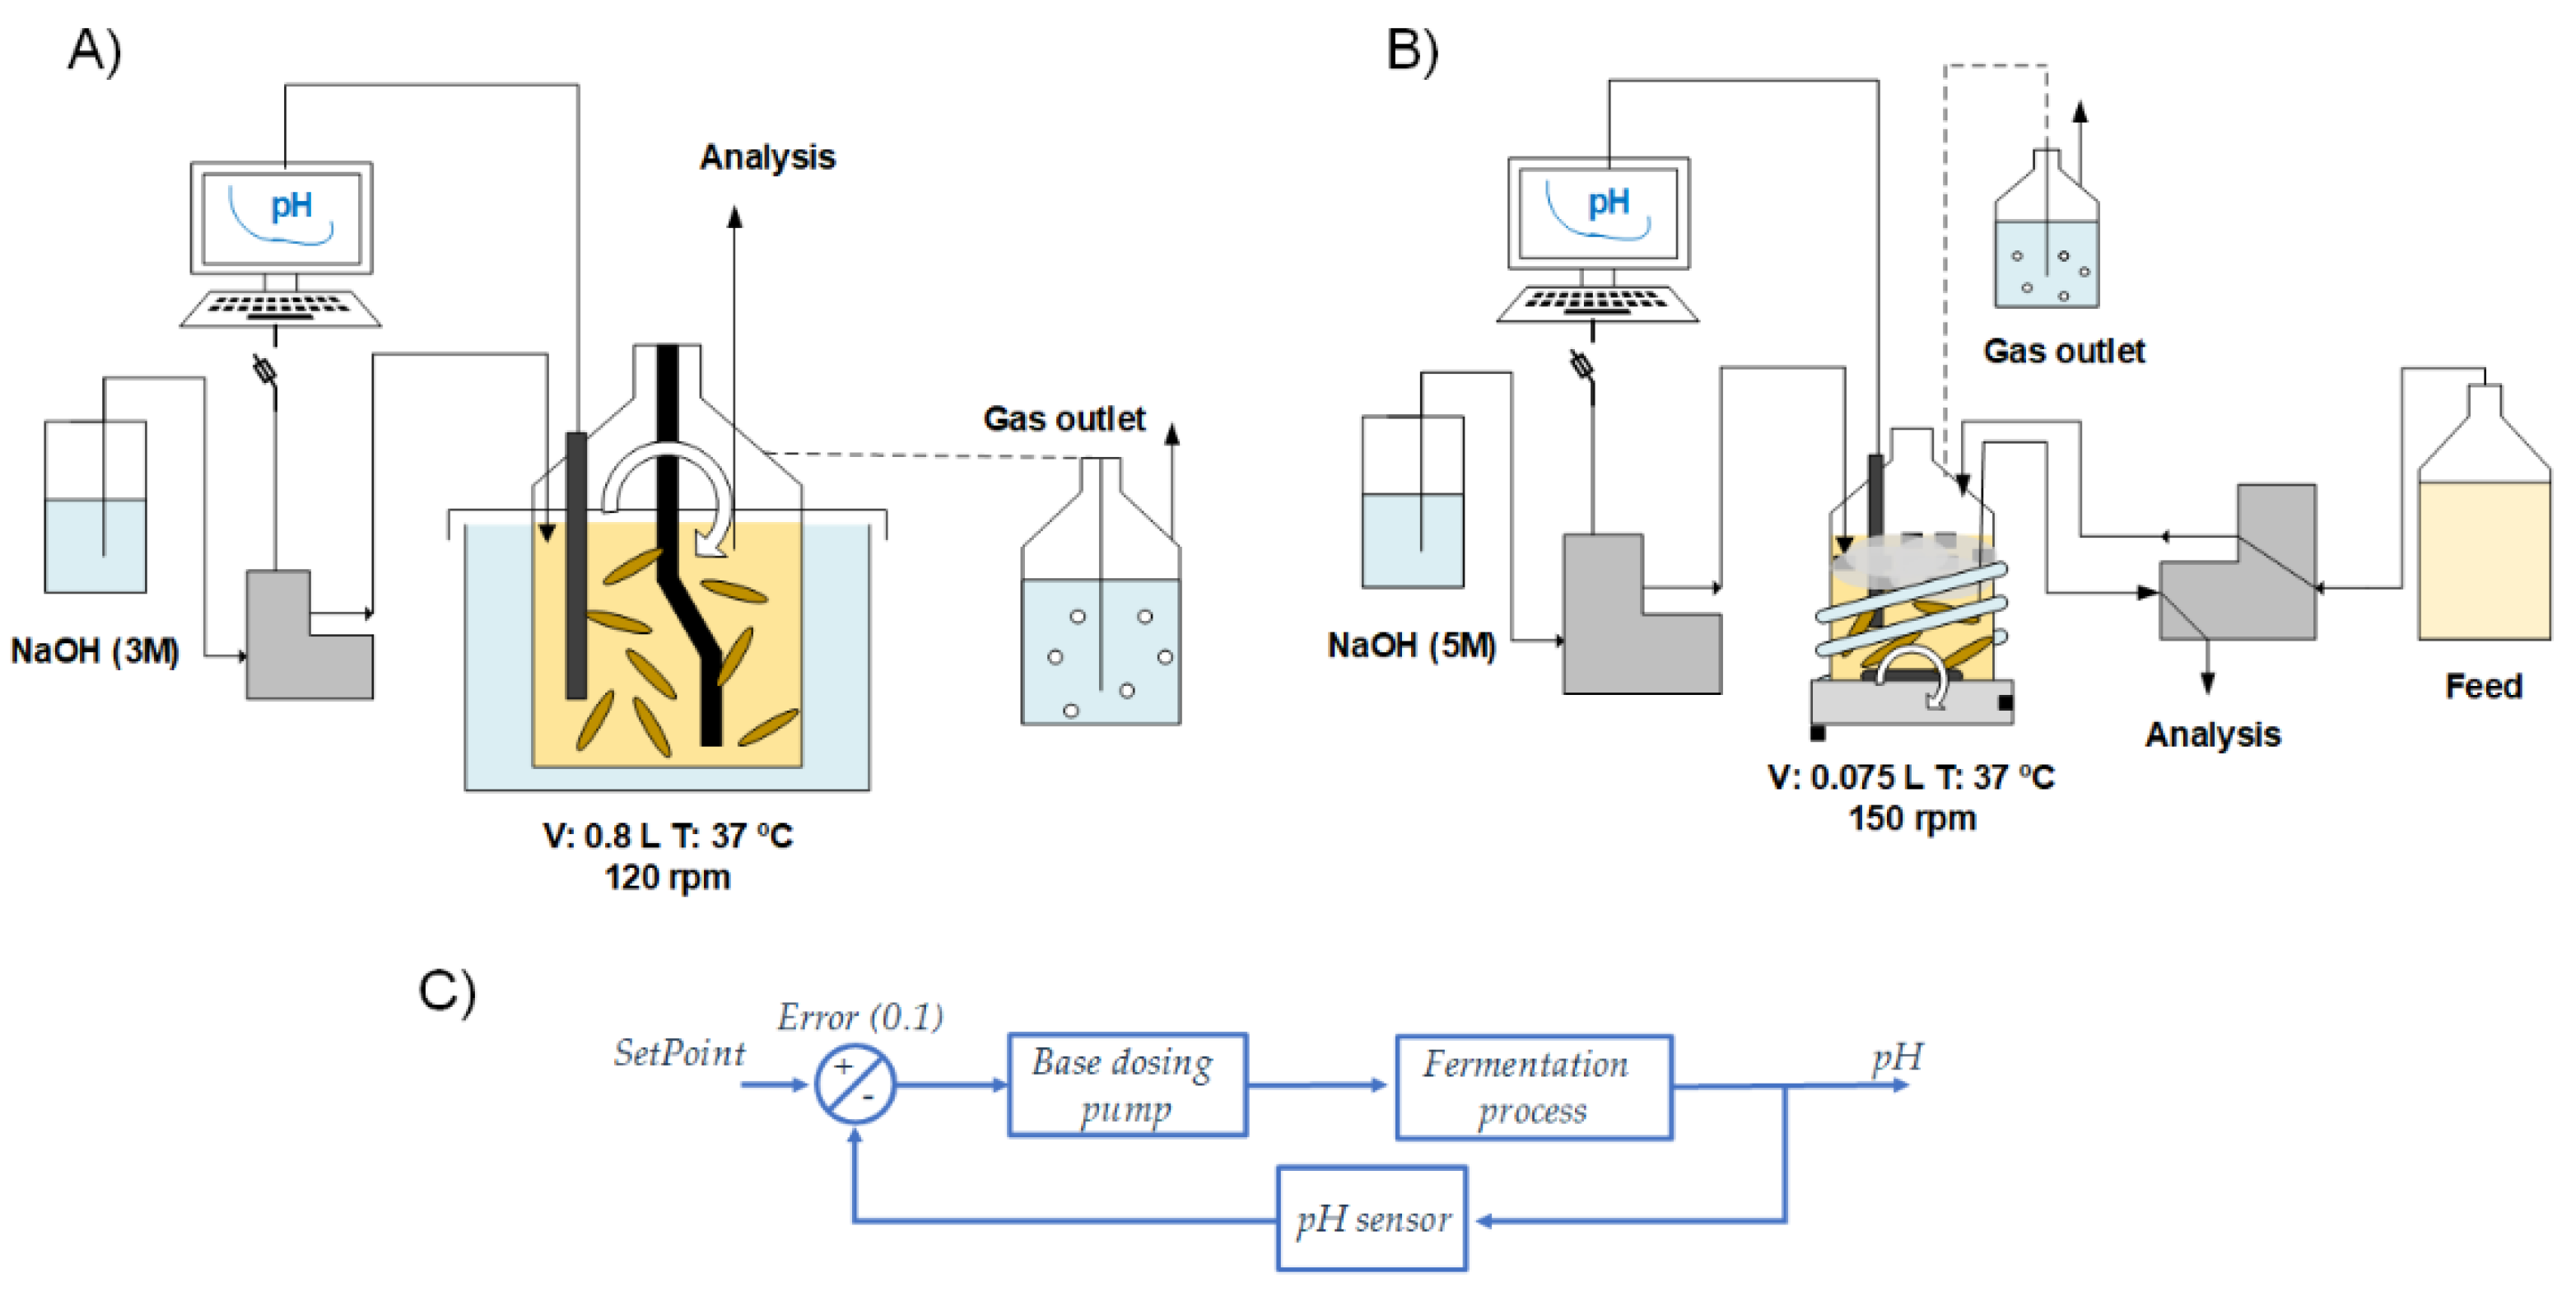
2.2. Experimental Setup

2.2.1. Batch Fermentations

Batch fermentations were carried out using 0.8 L of effective volume in a 1.1 L total volume reactor (Figure 1A). Anaerobic conditions were accomplished before inoculation by insufflating N2 for 30 min. The assays were carried out with an inoculum size of 5% at 120 rpm and 37 °C. The fermentations were monitored by a Tris-compatible flat pH sensor connected to LoggerPro software (Vernier, Beaverton, OR, USA). A feedback control strategy on/off was used to avoid the pH decreasing below a set point value (4.8 or 5.1 depending on the experiment). NaOH (3 M) was automatically added when the pH reached the lower limit (dead band 0.1) (Figure 1C). The upper limit was not controlled, allowing the recovery of the pH when possible. Samples were collected at specific time-points to analyze cell growth and metabolites.
The experimental plan is summarized in Table 1. The use of xylose was tested as it is the second main monosaccharide in lignocellulosic hydrolysates. The reduction of xylose concentration concomitant with incrementing the glucose was used to evaluate the effect of monosaccharide composition which would mimic a spectrum of lignocellulosic hydrolysates concentrations. In that sense, three different glucose/xylose mass ratios (0:1, 1:1, 3:1, final monosaccharide concentration: 60 g L−1) were tested in batch mode. For every sugar composition, the effect of buffer coupled or not with a strategy of limiting the minimum pH was evaluated. Both buffers were selected as they previously demonstrated good performance in ABE fermentation [10,17]. The set points were chosen from a previous work with glucose [17].

2.2.2. Continuous Fermentation

A stirred continuous fermentation was carried out using 0.075 L of effective medium in a 0.25 L reactor (Figure 1B). The medium was prepared as described previously with ammonium acetate as buffer. The configuration used a multichannel peristaltic pump (Reglo ICC, Ismatec, Wertheim, Germany) at the desired equal in-and-out flow rate. Plastic rings were used as packing material at 7.5% w/v. Before inoculation, anaerobic conditions were accomplished by insufflating N2 for 10 min. The fermentation was carried out with an inoculum size of 5% at 150 rpm and 37 °C. The temperature was maintained by a water heating coil while stirring with a magnetic stirrer. An identical pH monitoring protocol was used as in the batch fermentations based on the automatic limitation of minimum pH. A two-stage pH reactor was developed by chemically controlling the fermentation at two different minimum set points (6.0 and 4.8) using NaOH (5 M). The summary conditions of the experiment are shown in Table 2. Glucose was used as carbon source and pH ≥ 6.0 to favor acidogenesis conditions in the biomass growth phase, performing the batch mode in the first 30 h, after which the continuous mode started (dilution rate, D = 0.042 h−1). During the acidogenesis phase, the dilution rate was doubled every ~48 h up to at D = 0.166 h−1 to improve productivity. After that, at 144 h, the pH was allowed to drop to pH ≥ 4.8 to favor the solventogenesis phase.

2.3. Analytical Methods

Suspension cell density (gDW L−1) was quantified at 600 nm (OD600) using a UV–Vis spectrophotometer (SpectroFlex 6600, WTW, Weilheim in Oberbayern, Germany) as gDW L−1 = 0.2941·OD600 + 0.0331 (R2 = 0.9908). Samples were centrifuged (10,000 rpm, 5 min) and 0.22 μm filtered. Metabolites of interest were quantified using liquid chromatography (Agilent 1100 Series HPLC system, Agilent Technologies, Santa Clara, CA, USA) coupled with an Aminex® HPX-87H column (300 mm × 7.8 mm, Bio-Rad Laboratories Inc., Hercules, CA, USA) at 50 °C. A refractive index detector (RID) at 35 °C was utilized to detect monosaccharides, ethanol and butanol, while a diode array detector (DAD) was used at 210 nm to detect butyric and acetic acids and at 280 nm to detect acetone. Five mM of sulfuric acid was used as mobile phase at 0.6 mL min−1 for 40 min. The Henderson–Hasselbalch formula was used to quantify the undissociated acids (pKaacetic: 4.76; pKabutyric: 4.82). The maximum production rates in batch were estimated at the exponential phase of each compound by Equation (1):
r = S t 2 S t 1 t 2 t 1
where r is the production rate (g L−1 h−1). St1 and St2 are the species concentrations at the initial and final point of the exponential phase (g L−1), and t2 and t1 are the starting and ending times of the exponential phase (h). For continuous fermentations, productivity was estimated as follows:
P s = S · D
where S is the average species production (g L−1), and D is the dilution rate (h−1).

3. Results and Discussion

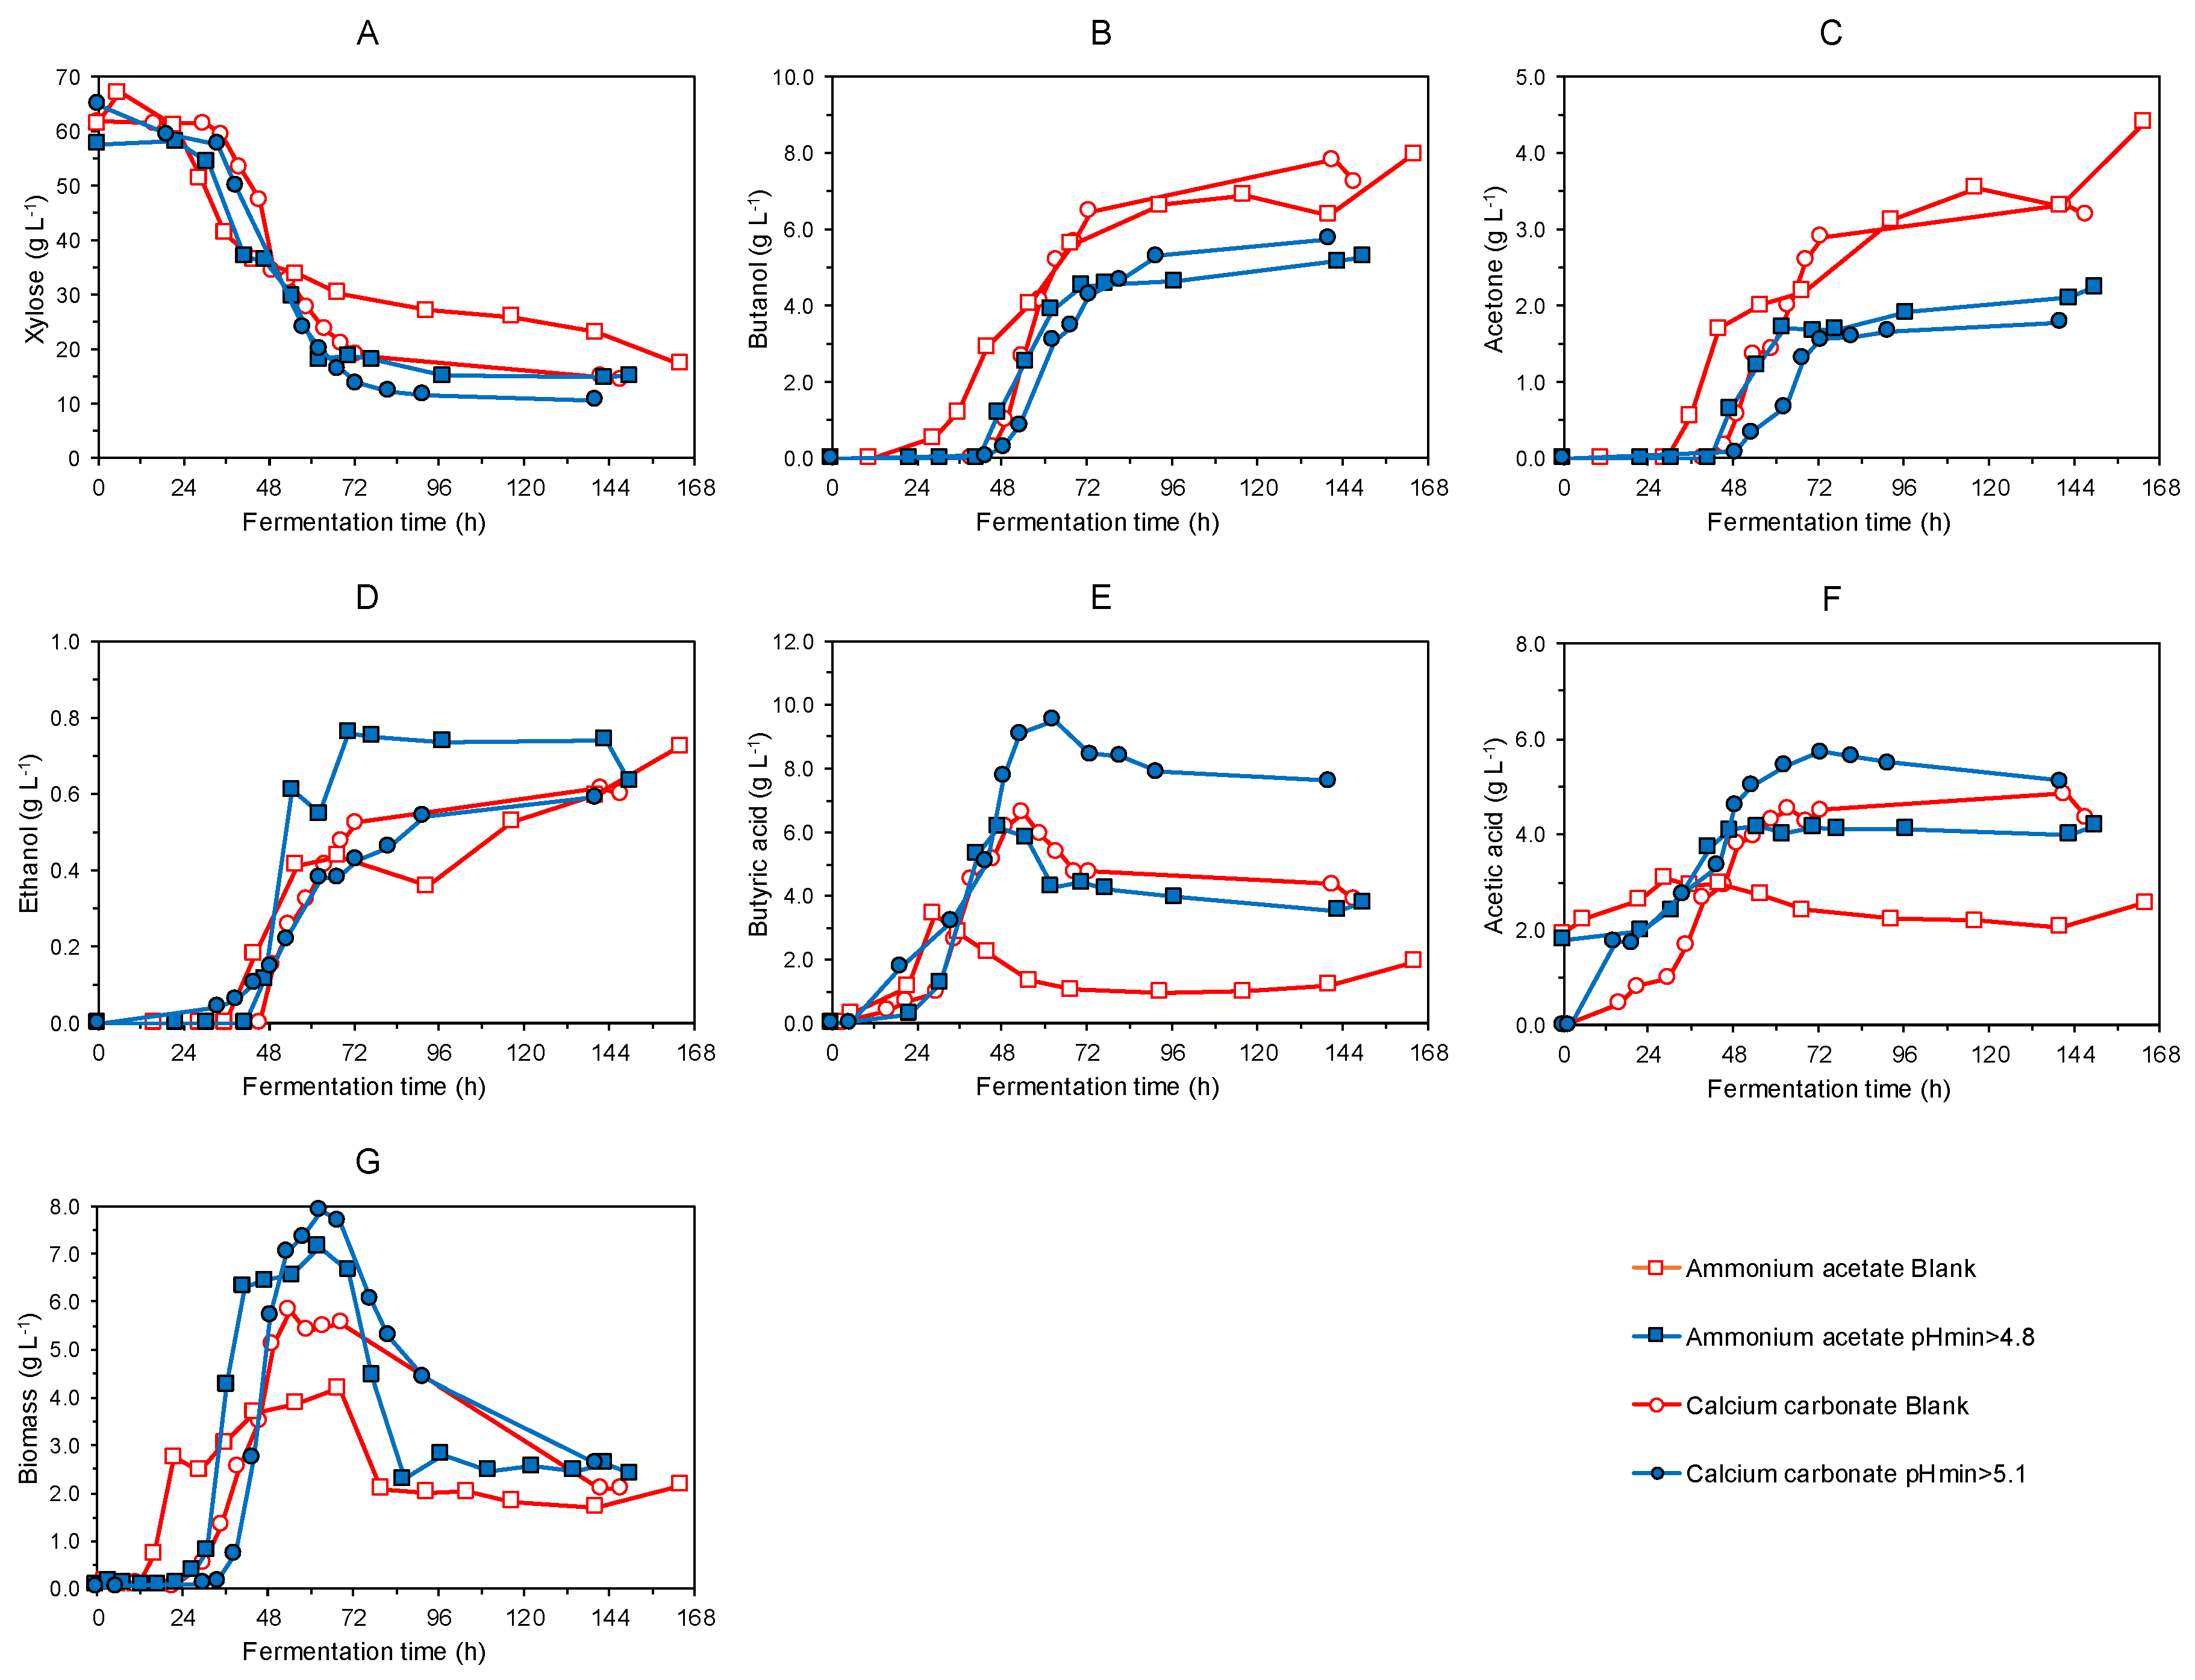
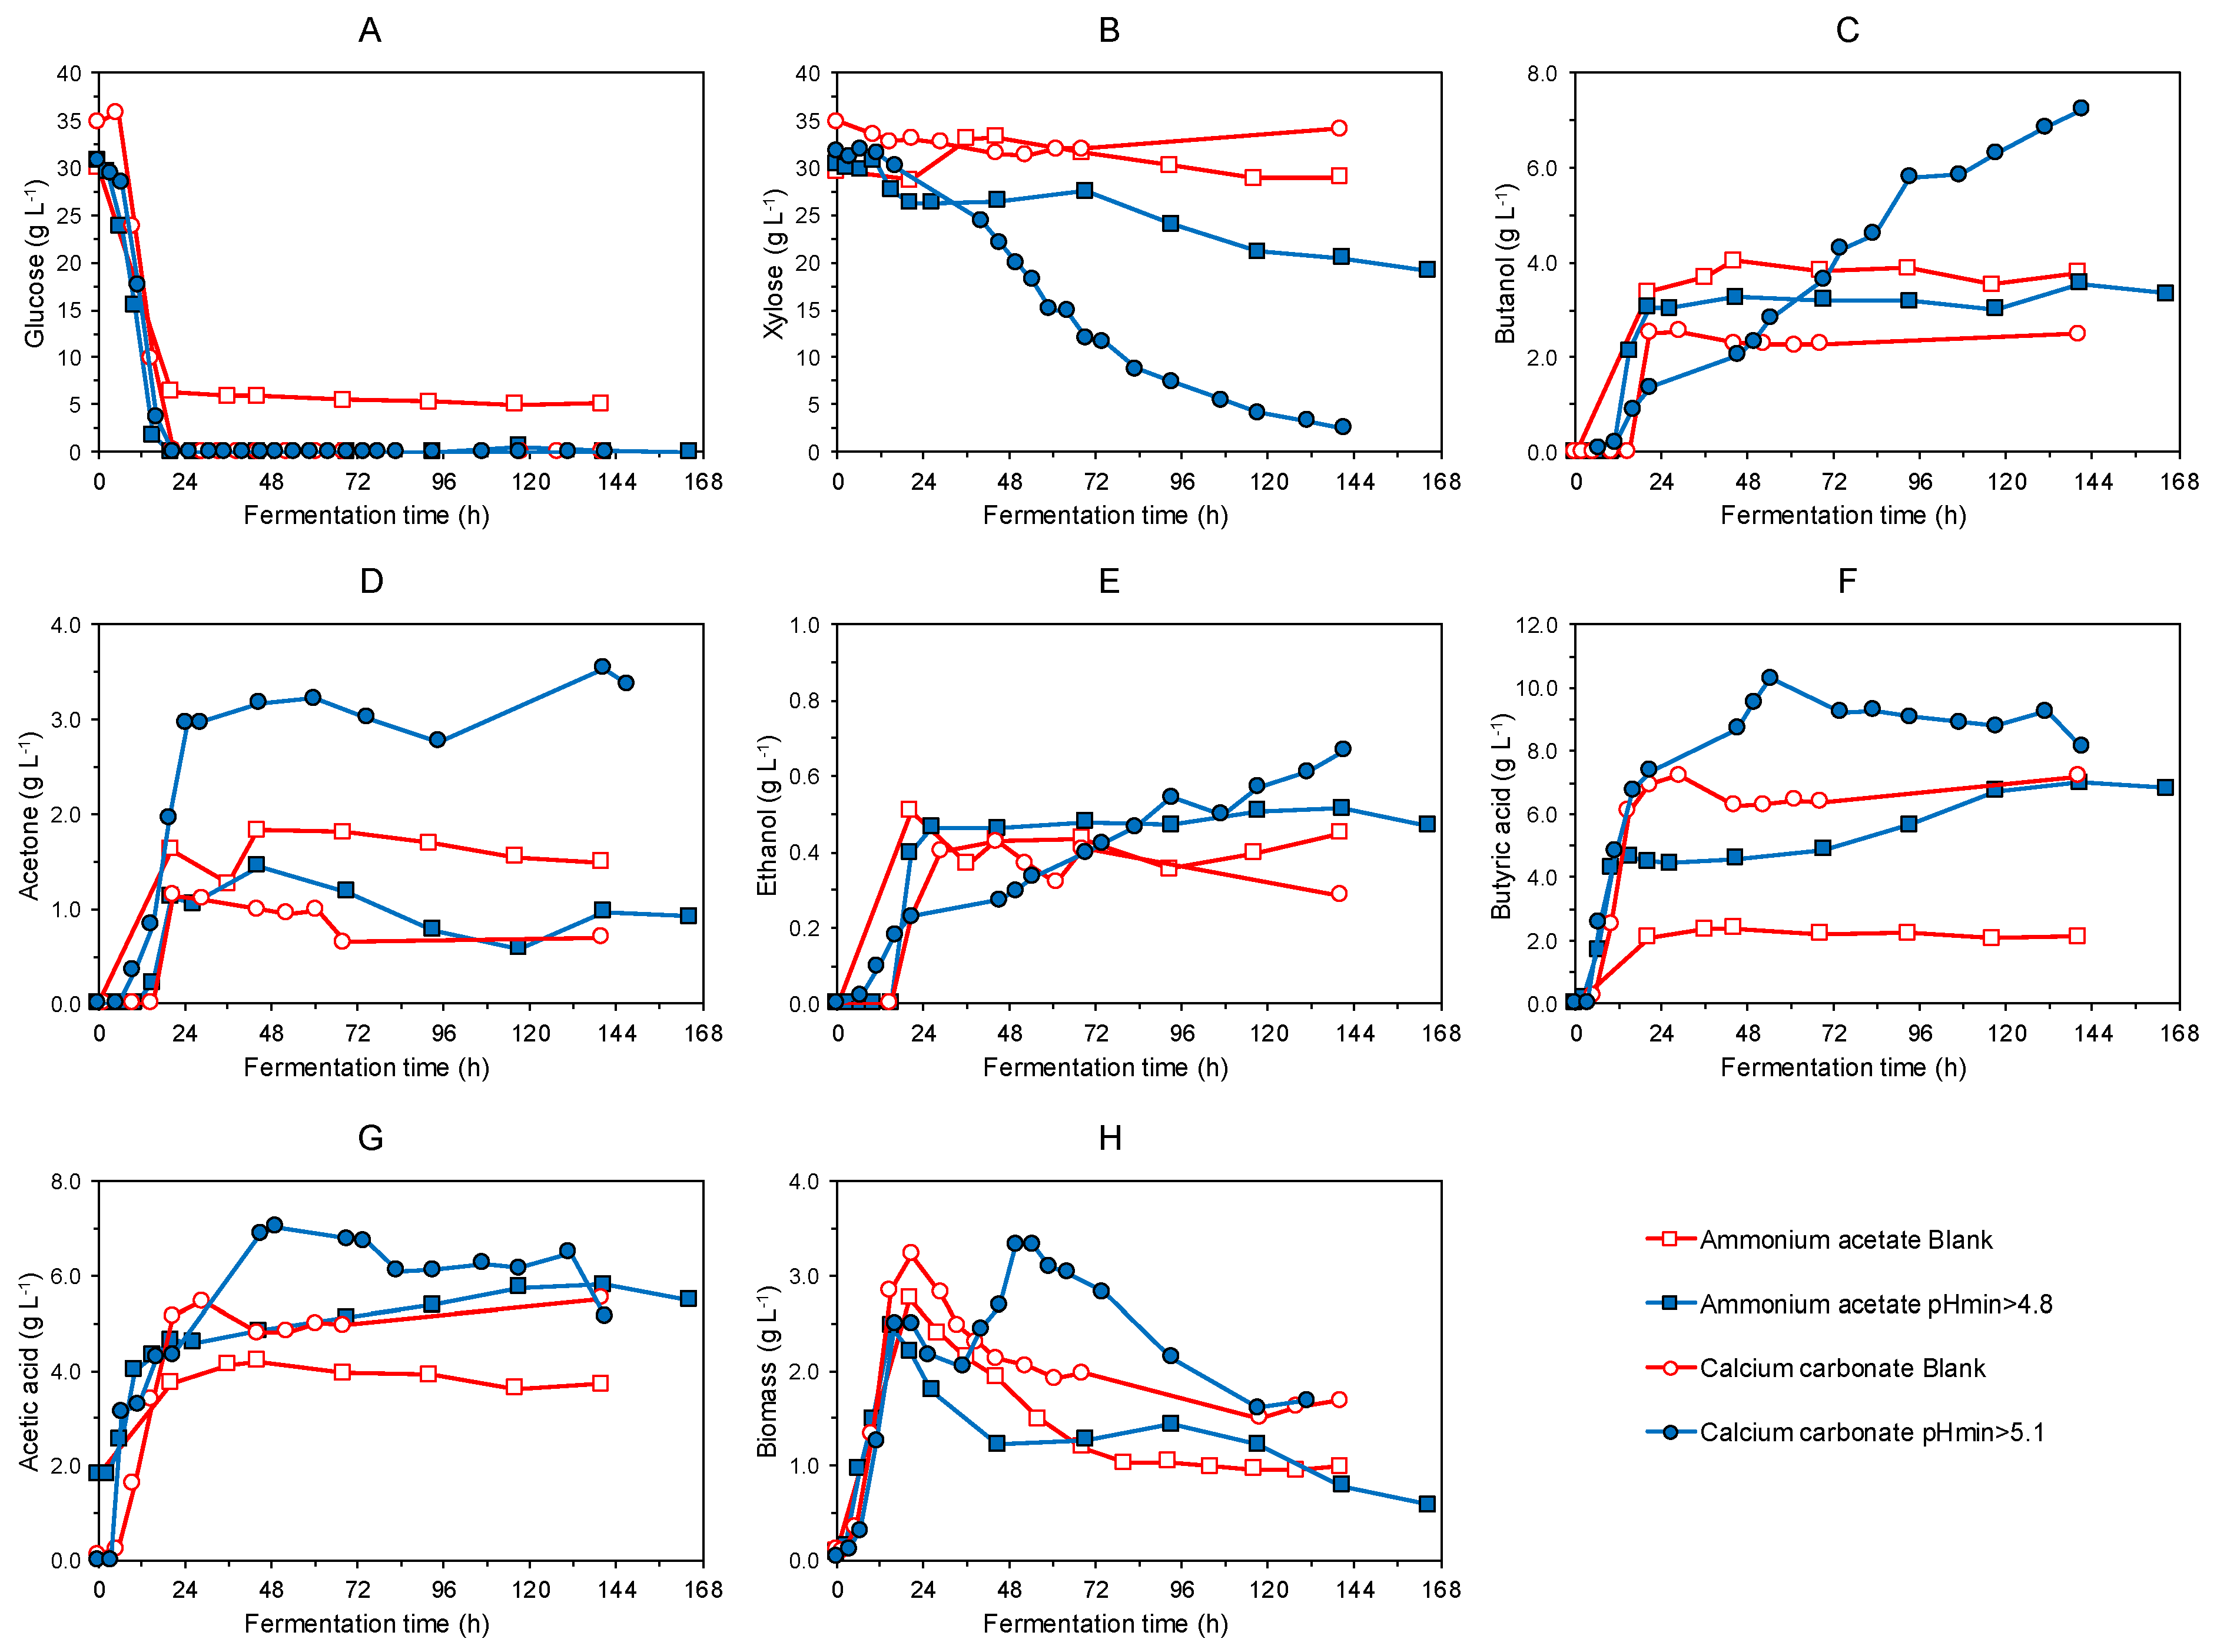
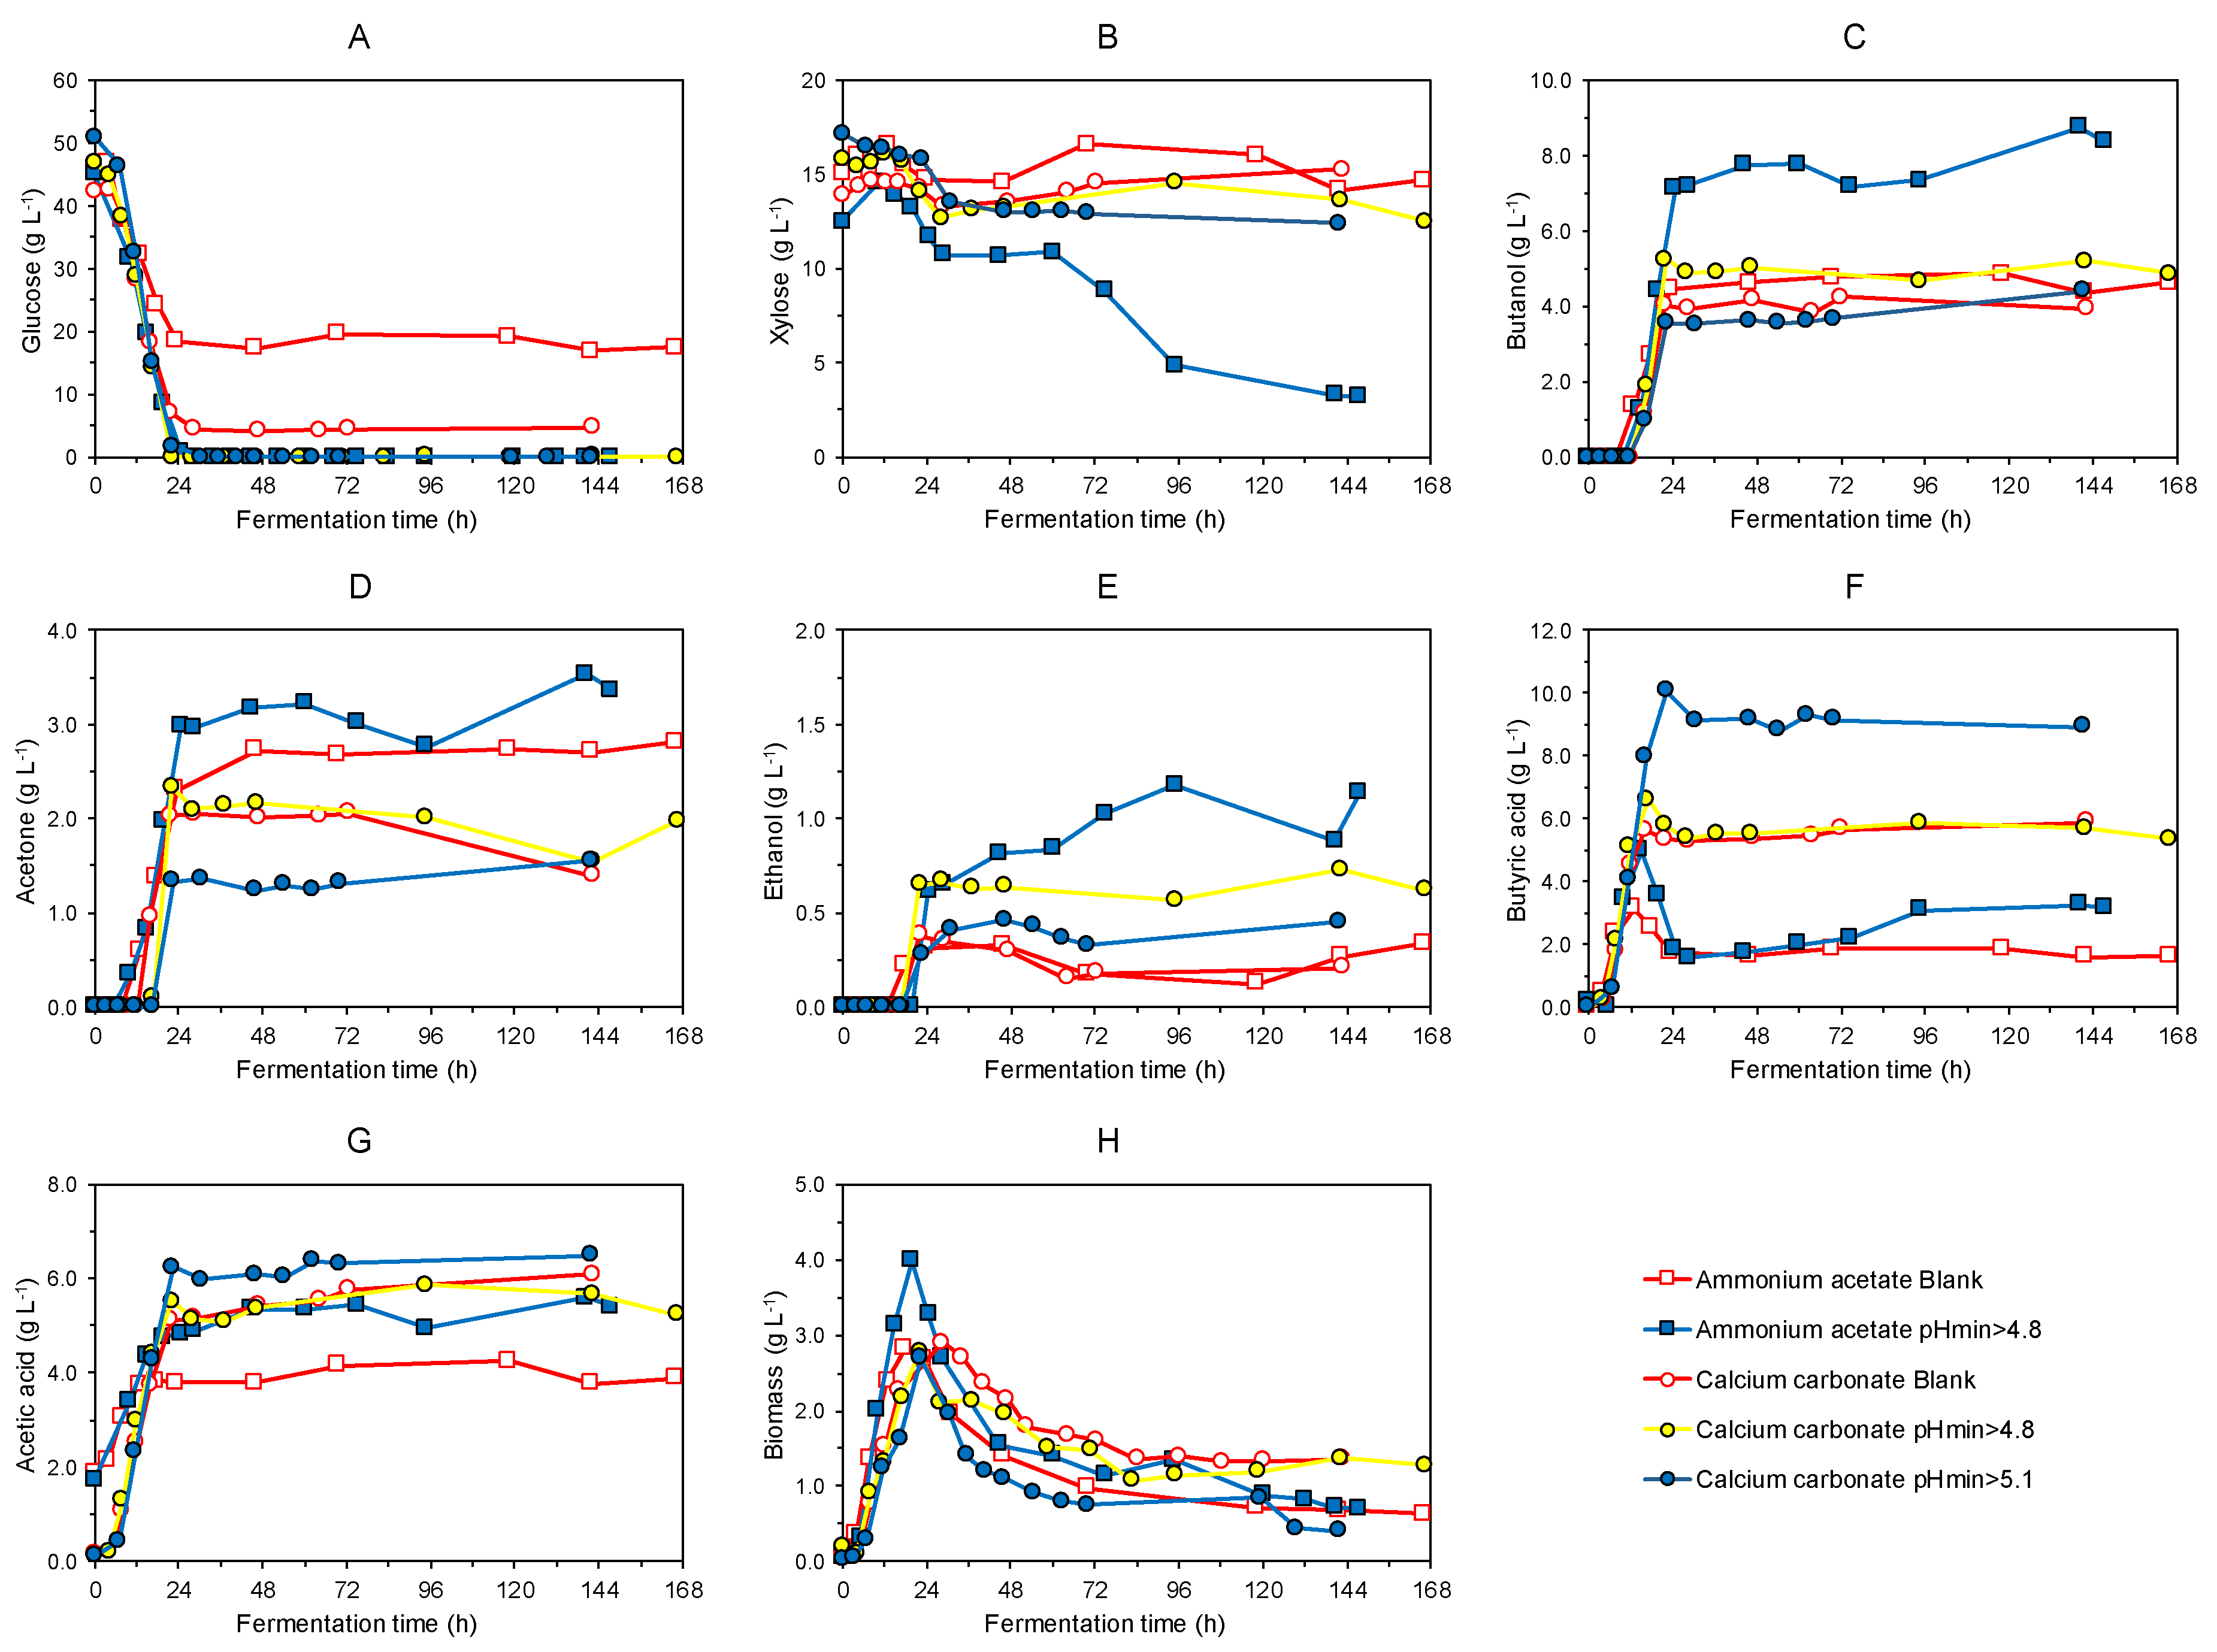
3.1. Batch Fermentation

Two buffer media (calcium carbonate/ammonium acetate) and their combination with an active pH control were compared for 60 g L−1 of xylose (Figure 2). The evolution of the pH is shown in Figure S1A. The growth of the bacteria using xylose was characterized by an initial lag phase of 12–24 h, after which the exponential growth started (Figure 2G). The use of calcium carbonate increased biomass concentration 1.4-fold over the ammonium acetate in spontaneous fermentation, indicating that calcium carbonate enhanced biomass production. The combination of buffer and pH control clearly changed the biomass pattern; the maximum biomasses increased from 4.2 to 7.2 g L−1 for the acetate reactors (blank and pH ≥ 4.8) and from 5.8 to 7.9 g L−1 for the carbonate reactor (blank and pH ≥ 5.1). This increase represented about ~1.7 and 1.4 times with ammonium acetate and calcium carbonate, respectively. Similar xylose consumptions were obtained whatever the buffer used and the pH set point employed, with no complete depletion of the monosaccharide (Figure 2A). This was because a butanol concentration of ~4.50 g L−1 would reduce the initial xylose uptake rate by 50%. A titer of ~8.0–8.5 g L−1 has been determined to be growth inhibitory for C. acetobutylicum on xylose as the carbon source [11,23]. The impact of the buffer can be seen in the butyric acid concentration (Figure 2E). Calcium carbonate almost doubled (6.6 over 3.4 g L−1) the maximum concentration of the acid against ammonium acetate with no pH control. Under the conditions tested with xylose as the sole carbon source, both buffers performed better with spontaneous fermentation without pH control. Butanol (ABE) productions were 8.0 (13.1) and 5.3 (8.1) g L−1 for the acetate reactor (blank and pH ≥ 4.8) while 7.8 (11.8) and 5.8 (8.1) g L−1 for the carbonate reactor (blank and pH ≥ 5.1). These results show that the minimum pH control was detrimental with either ammonium acetate or calcium carbonate buffers under these conditions. Previous results showed that when 60 g L−1 glucose was used as a sole carbon source, the strategy of limiting the minimum pH at 5.1 enhanced butanol (ABE) production from 7.47 (10.50) g L−1 to 11.22 (16.12) g L−1 [17]. As xylose uptake behaved differently to glucose, which is the major monosaccharide of lignocellulosic residues, the effect pH regulation (active pH control and/or buffer media) with its mixtures should be investigated.
Based on the xylose results, fermentation with mixtures of glucose/xylose (final monosaccharide concentration: 60 g L−1) were developed for two sugar compositions. A 1:1 sugar ratio was first used (Figure 3). The pH evolution can be found in Figure S1B. Biomass concentrations were about 60% lower than those obtained with pure xylose, resulting in values of 2.5–3.2 g L−1, attributed to the lower biomass yield linked to glucose consumption. Capilla et al. [17] estimated a maximum biomass concentration of about 3 g L−1 with 33 g L−1 of pure glucose. The case of using calcium carbonate and a pH control strategy had a notably different behavior. This exhibited diauxic growth linked with the xylose uptake from hour 48 onwards after 24 h of pure glucose depletion (Figure 3A,B). Butyric acid production linked to the consumption of both substrates also occurred using calcium carbonate and the pH minimum of 5.1, first at a rate of 0.52 g L−1 h−1 and then 0.18 g L−1 h−1 (Figure 3F).
This second butyric production resulted in a peak of 10.3 g L−1 of butyric acid, similar to the maximum concentration achieved with pure xylose (Figure 2E). As can be seen, this is the only operational condition in which xylose uptake was concomitant to butanol production (7.2 g L−1) (Figure 3B). The beneficial effect of calcium carbonate as a buffer regulator was also found by Kanouni et al. [24]. Otherwise, a pH of 4.8 does not produce good xylose uptake when ammonium acetate is the buffer, so that the buffer regulation itself has an impact on xylose uptake for a specific mixture of glucose and xylose. This highlights the importance of a tailor-made strategy not only for pH conditions but also the type of buffer. These results show the potential of C. acetobutylicum for biobutanol production when sugar mixtures of glucose and xylose are employed, which could be the case of lignocellulosic substrates, among others.
To mimic the conditions of lignocellulosic hydrolysates, a glucose/xylose ratio of 3:1 (final monosaccharide concentration: 60 g L−1) was also tested, and the same conditions as with previous experiments were evaluated. Calcium carbonate was tested at two pH levels of 4.8 and 5.1 to elucidate the impact of the control of different minimum pH levels. The pH profiles are shown in Figure S1C. A similar biomass production was obtained by comparing it with the 1:1 glucose/xylose mixture at a maximum concentration of about 2.7–2.9 g L−1 for the non-pH-controlled reactors and pH-controlled reactor with calcium carbonate. A higher biomass concentration was achieved with ammonium acetate and pH control (Figure 4H). Reducing the xylose level and increasing the glucose, no diauxic growth occurred in the pH-controlled reactor buffered with calcium carbonate at either pH 5.1 or 4.8. Glucose consumption stopped either by the end of the fermentation due to acid crash (blank) or glucose exhaustion (pH ≥ 4.8–5.1) with both buffers (Figure 4A). Unlike ratio 1:1, calcium carbonate fermentation with either active pH control (pH ≥ 4.8–5.1) did not show any xylose uptake after glucose depletion with a sugar ratio of 3:1. As the failure of xylose metabolisms with calcium carbonate as buffer reagent could be attributed to the low xylose concentration on the media (15 g L−1), it seems that a minimum concentration of xylose is required to modulate the pathway to xylose by C. acetobutylicum.
In contrast, the use of ammonium acetate instead of calcium carbonate promoted xylose depletion, although the xylose uptake started later (72 h and 48 h after glucose depletion) than in the previous experiment, which also shows that low xylose concentrations complicate the metabolic shift from glucose to xylose consumption. Indeed, there was no biomass growth associated with xylose consumption, as when using 30 g L−1 of xylose. The monosaccharide would therefore be used for cell maintenance rather than biomass production. The lower effectiveness of pH-controlling strategies on xylose uptake at higher ratios of glucose/xylose was also found by Jiang et al. [13]. For the experiments without noticeable xylose uptake, butanol (ABE) production ranged from 3.6–4.9 (5.2–8.2) g L−1, which is in agreement with the higher glucose from a prior experiment (2.6–4 g L−1 butanol production with 30 g L−1 of glucose). The ammonium acetate with pH ≥ 4.8 experiment successfully consumed nearly all the xylose, and maximum butanol (ABE) production was 8.8 (13.2) g L−1. This concentration was very similar regardless of sugar composition when 60 g L−1 of either xylose or xylose and glucose was used, although the type of buffer regulation and pH control parameters were different for each case. This was related to the butanol concentration, as 8–8.5 g L−1 has been shown to be inhibitory when C. acetobutylicum is grown with xylose [11,23]. The best condition at ratio 3:1 was a pH control at 4.8 and ammonium acetate as the buffer reagent. In these conditions, maximum butanol (ABE) productivity was 0.61 g L−1 h−1 (0.89 g L−1 h−1). Fermentation in continuous mode was also tested to improve butanol productivity.

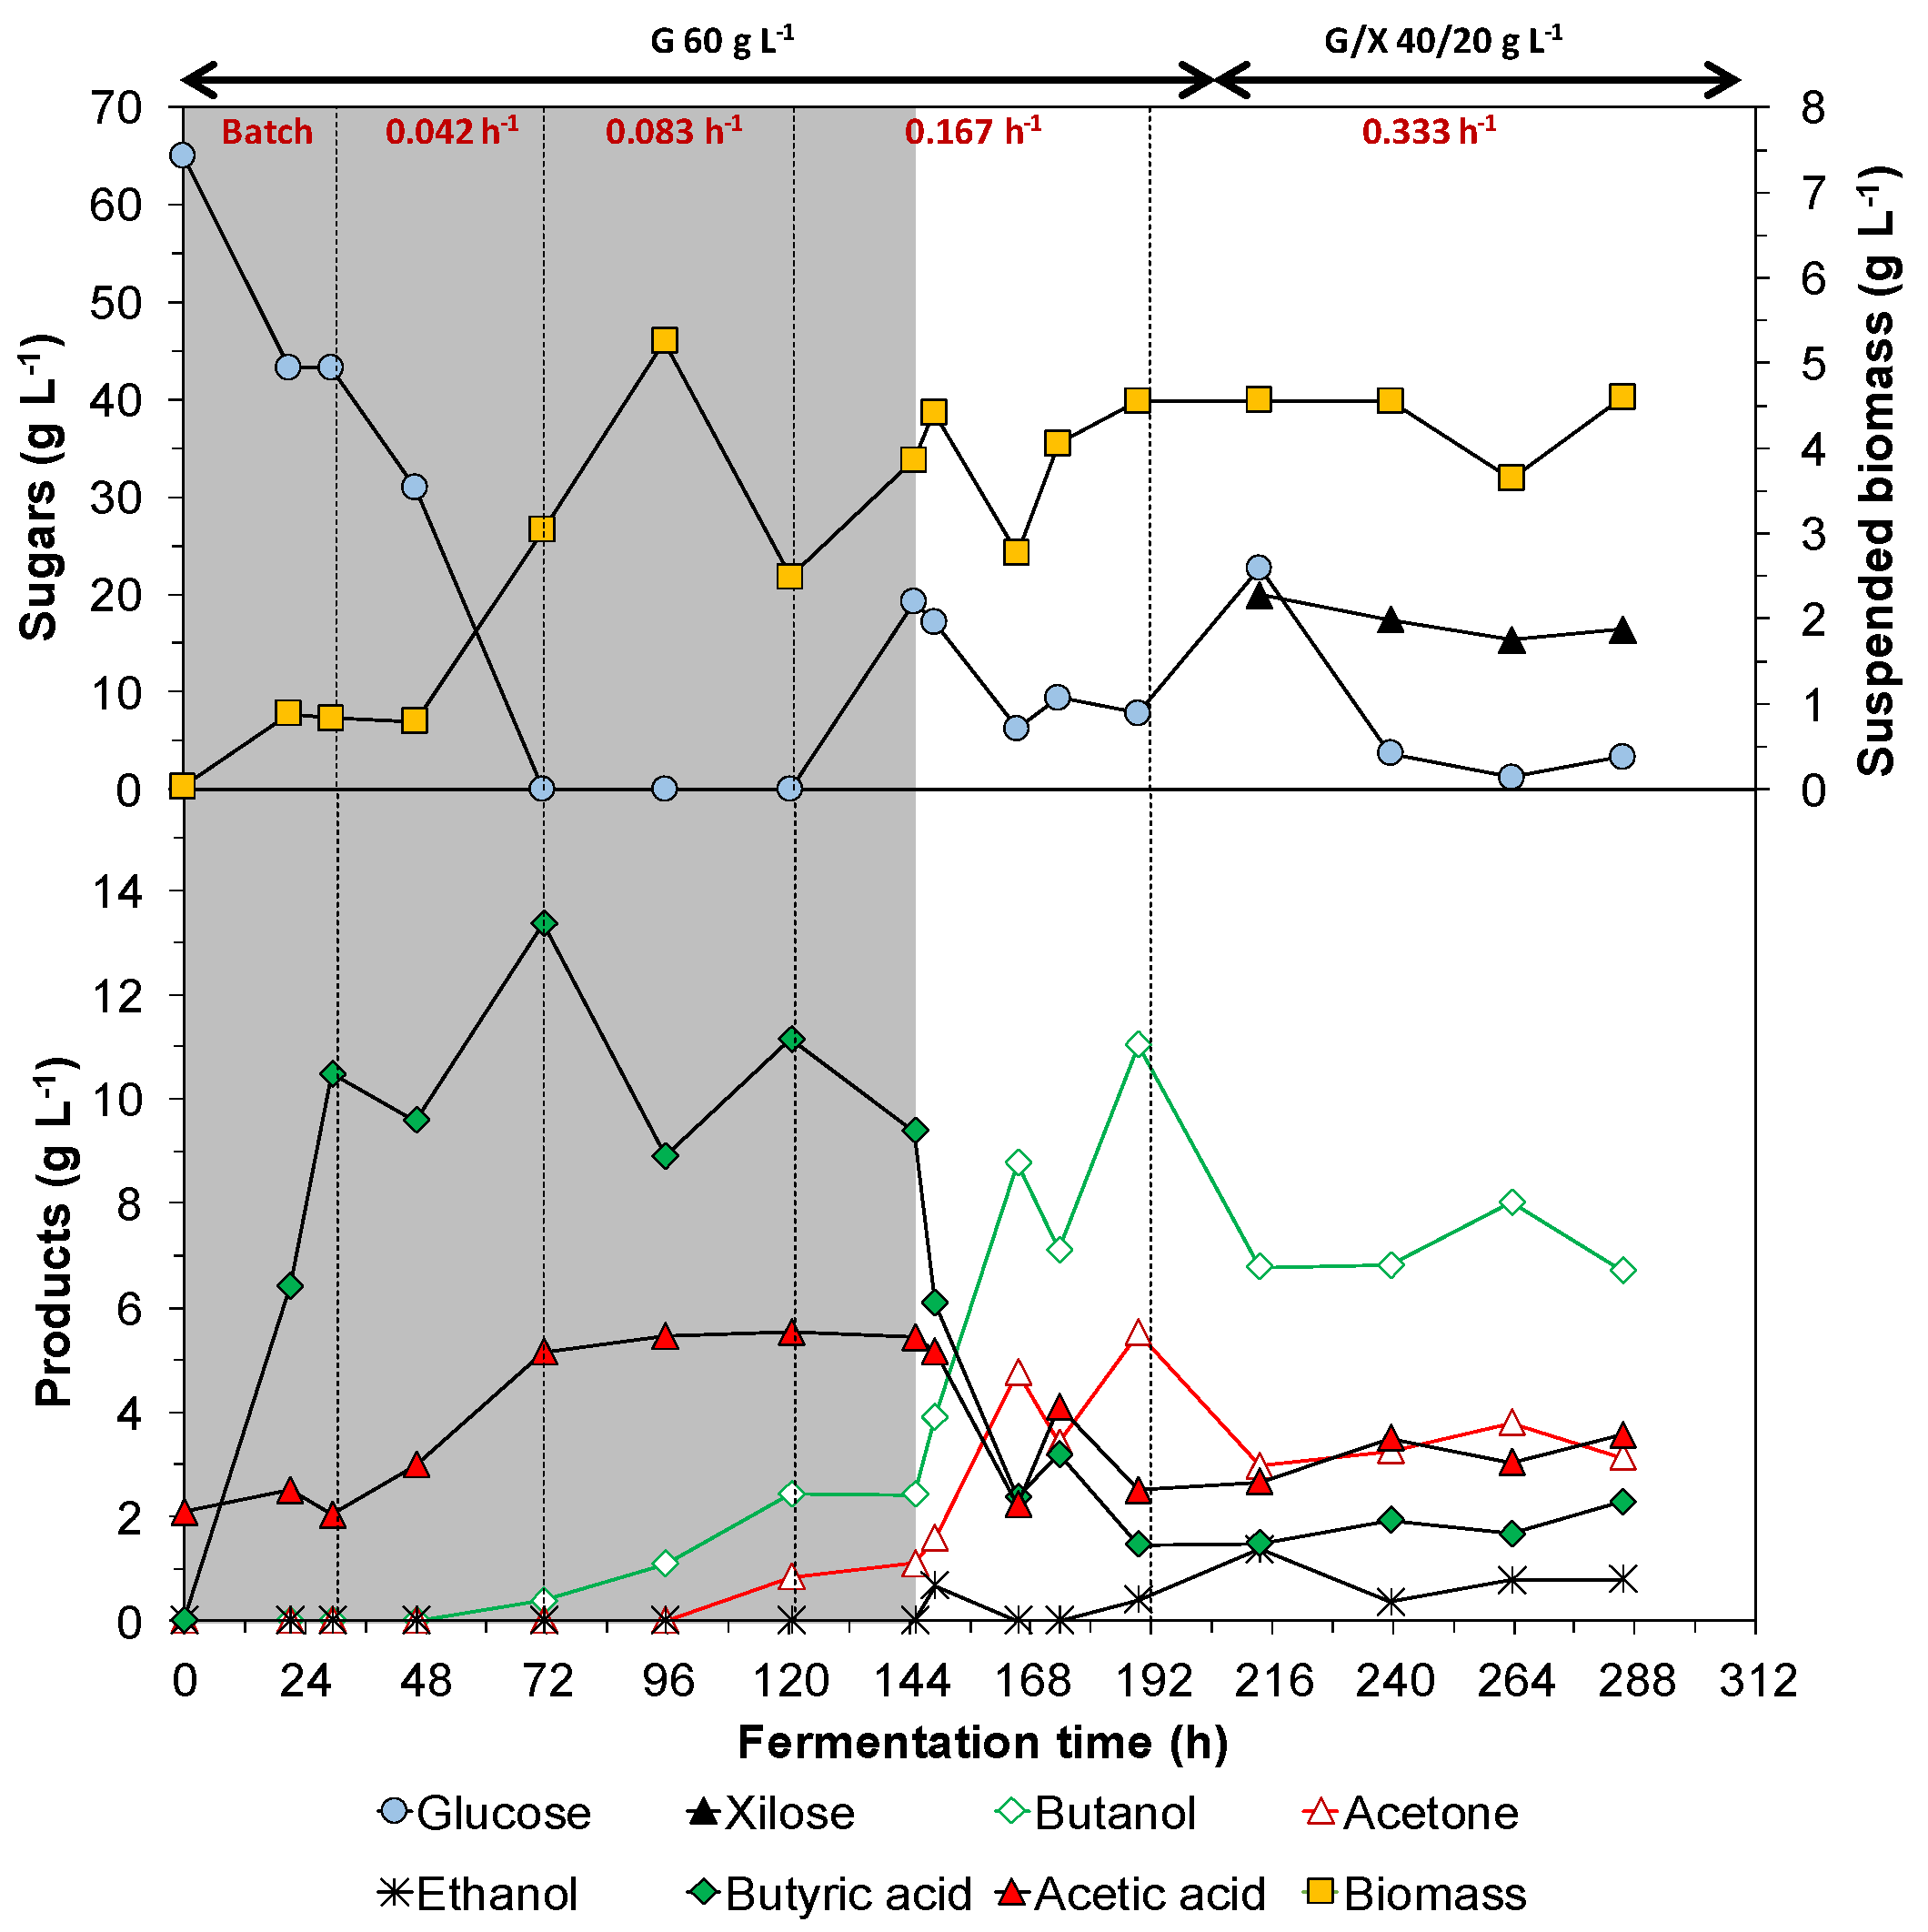
3.2. Continous Fermentation

The pH regulation strategy was evaluated in a continuous fermentation filled with plastic rings to operate at high D values while preventing biomass washout. To promote biofilm growth, the pH was first kept at 6.0, after which pH was shifted to the minimum of 4.8 to promote solvent production. During the biofilm formation stage, it was fed 60 g L−1 of glucose with a pH ≥ 6.0 (acidogenic optimum pH) at a dilution factor of 0.042 h−1 (Figure 5). The biomass was seen to grow on biofilm interlacing with the plastic rings. After 72 h (2 residence time (θ) from the start of continuous fermentation), the biomass concentration leaked less than 3 g L−1, indicating successful biomass retention. At this time, the dilution factor was doubled to 0.083 h−1, with a transitory biomass leak (96 h). Thereafter, the suspended biomass remained stable for the rest of the experiment at 3.9 ± 0.9 g L−1, indicating no washout on the duplication of the dilution factor until the end of the experiment (maximum dilution rate 0.333 h−1). This configuration allowed a fast start-up and high biomass retention. At 120 h, the dilution factor was again doubled to 0.167 h−1. As solventogenesis was inhibited in this pH, the conditions were very low solvent production and high acid concentrations. At 144 h (D = 0.167 h−1), pH was allowed to drop to the solventogenesis set point (pH ≥ 4.8). In less than 24 h, the acids were consumed while butanol (ABE) was produced. In steady state conditions, a butanol (ABE) concentration of 9.0 ± 2.0 (10.1 ± 1.1) g L−1 (productivity: 1.5 ± 0.3 (1.7 ± 0.2) g L−1 h−1) was achieved, indicating proper transition to solventogenesis.
The butanol (ABE) concentration achieved here was close to the maximum reported in batch reactors with the same glucose concentration and similar pH modulation strategy [17]. At 192 h, the dilution factor was again doubled to 0.333 h−1. After 8 θ, steady state butanol values (ABE) were 6.8 (11.1) g L−1 with a productivity of 2.3 (3.7) g L−1 h−1. At 216 h, glucose input was thus changed to a glucose/xylose mixture (2:1 ratio) to test the effect of varying the monosaccharide concentration, after which the butanol concentration was kept stable for at least 24 θ, with an average butanol (ABE) concentration of 7.1 ± 0.6 (11.2 ± 1.0) g L−1. This concentration led to a butanol (ABE) productivity of 2.4 ± 0.2 (3.7 ± 0.3) g L−1 h−1 with a 2:1 glucose/xylose mixture. Additionally, the mass balance analysis is presented in Table 3. As expected, the distribution of the products manifested opposite trends depending on the pH set point. Butyric acid was the main product at pH ≥ 6.0, while butanol was the major product at pH ≥ 4.8. Moreover, the unaccounted yield would be associated to biofilm formation and CO2 production. In this sense, previous authors reported that in ABE fermentation, the CO2 could be up to a third of the metabolites produced [25].
The productivity obtained with a 2:1 glucose/xylose mixture (D = 0.333 h−1) is almost four times more than that obtained in the batch reactor at a ratio of 3:1 with ammonium acetate and pH ≥ 4.8 (butanol (ABE) productivity of 0.61 (0.89) g L−1 h−1). Using sugarcane bagasse for biomass immobilization, solvent productivities in the range of 1.8–2.1 g L−1 h−1 at D ranging 0.3–0.6 h−1 have been obtained [26]. In continuous operation mode at dilution factors ≥ 0.167 h−1, glucose uptake was about 85% when 60 g L−1 was fed, while full consumption was at 40 g L−1 and xylose uptake was only 18 ± 8%. The lower xylose uptake than the batch reactor (74%) can be related to the continuous availability of glucose, which would mostly inhibit extending the shift of the metabolism to xylose. This shows the feasibility of developing an efficient continuous reactor configuration avoiding biomass washout and obtaining high stable productivities. However, further investigation is required to enhance the use of xylose in continuous operations.

4. Conclusions

The glucose/xylose ratio has a direct impact on the selection of the proper pH modulation strategy (pH control and/or buffer composition) in ABE fermentation using C. acetobutylicum DSM 792. Tailor-made pH modulation strategies should be developed for specific glucose/xylose mixtures to use the substrate. For a mixture of pure xylose (0:1), both buffers tested (calcium carbonate/ammonium acetate) led to similar results in terms of butanol production. However, minimum pH control worsened the solvent production. In the case of 1:1 glucose/xylose mixtures, calcium carbonate as a buffer reagent combined with the strategy of limiting minimum pH to 5.1 gave the best results, achieving nearly full consumption of xylose while producing close to 8 g L−1 of butanol. When the glucose/xylose ratio was raised to 3:1, the buffer ammonium acetate with pH ≥ 4.8 performed better, achieving a butanol concentration of 8.8 g L−1 and almost complete xylose uptake. The continuous reactor configuration filled with plastic rings for biomass retention successfully increased butanol (ABE) productivity while preventing biomass washout. This configuration led to a biobutanol productivity of 2.4 ± 0.2 g L−1 h−1 at D = 0.333 h−1 with a sugar mixture of 2:1, which is almost four times greater than that obtained in batch operations. However, in this configuration xylose consumption worsened to 18 ± 8%. Further studies should thus be carried out to improve substrate use in continuous mode.

Supplementary Materials

The following supporting information can be downloaded at: https://www.mdpi.com/article/10.3390/fermentation8050226/s1, Figure S1, The pH profiles of C. acetobutylicum under different carbon sources (A) pure xylose, (B) ratio 1:1 (C) ratio 3:1 in batch mode.

Author Contributions

Conceptualization, M.C., P.S.-V., F.J.Á.-H. and C.G.; methodology, P.S.-V., F.J.Á.-H., C.G., A.V., M.C. and C.S.; formal analysis, M.C., C.S. and P.S.-V.; investigation, M.C., C.S. and A.V.; resources, F.J.Á.-H. and C.G.; data curation, M.C., C.S. and P.S.-V.; writing—original draft preparation, M.C.; writing—review and editing, P.S.-V. and C.G.; visualization, M.C., C.S., P.S.-V. and C.G.; supervision, P.S.-V. and C.G.; project administration, F.J.Á.-H. and C.G.; funding acquisition, F.J.Á.-H. and C.G. All authors have read and agreed to the published version of the manuscript.

Funding

Grant CTM2017-88042-R funded by MCIN/AEI/10.13039/501100011033 and by “ERDF A way of making Europe”. This research also received funding from the Conselleria d’Innovacio, Universitats, Ciencia i Societat Digital, Generalitat Valenciana, Spain (AICO/2021/121). M. Capilla and A. Valles acknowledge Generalitat Valenciana (Spain) and the European Social Fund for their contracts (ACIF/2019/138 and ACIF/2017/390). The funding sources had no involvement in this work.

Institutional Review Board Statement

Not applicable.

Informed Consent Statement

Not applicable.

Data Availability Statement

Not applicable.

Conflicts of Interest

The authors declare no conflict of interest.

References

  1. Bharathiraja, B.; Jayamuthunagai, J.; Sudharsanaa, T.; Bharghavi, A.; Praveenkumar, R.; Chakravarthy, M.; Devarajan, Y. Biobutanol—An Impending Biofuel for Future: A Review on Upstream and Downstream Processing Tecniques. Renew. Sustain. Energy Rev. 2017, 68, 788–807. [Google Scholar] [CrossRef]
  2. Dürre, P. Biobutanol: An Attractive Biofuel. Biotechnol. J. 2007, 2, 1525–1534. [Google Scholar] [CrossRef] [PubMed]
  3. Ibrahim, M.F.; Ramli, N.; Kamal Bahrin, E.; Abd-Aziz, S. Cellulosic Biobutanol by Clostridia: Challenges and Improvements. Renew. Sustain. Energy Rev. 2017, 79, 1241–1254. [Google Scholar] [CrossRef]
  4. Narisetty, V.; Cox, R.; Bommareddy, R.; Agrawal, D.; Ahmad, E.; Pant, K.K.; Chandel, A.K.; Bhatia, S.K.; Kumar, D.; Binod, P.; et al. Valorisation of Xylose to Renewable Fuels and Chemicals, an Essential Step in Augmenting the Commercial Viability of Lignocellulosic Biorefineries. Sustain. Energy Fuels 2022, 6, 29–65. [Google Scholar] [CrossRef]
  5. Ren, C.; Gu, Y.; Hu, S.; Wu, Y.; Wang, P.; Yang, Y.; Yang, C.; Yang, S.; Jiang, W. Identification and Inactivation of Pleiotropic Regulator CcpA to Eliminate Glucose Repression of Xylose Utilization in Clostridium Acetobutylicum. Metab. Eng. 2010, 12, 446–454. [Google Scholar] [CrossRef]
  6. Birgen, C.; Dürre, P.; Preisig, H.A.; Wentzel, A. Butanol Production from Lignocellulosic Biomass: Revisiting Fermentation Performance Indicators with Exploratory Data Analysis. Biotechnol. Biofuels 2019, 12, 167. [Google Scholar] [CrossRef]
  7. Buendia-Kandia, F.; Rondags, E.; Framboisier, X.; Mauviel, G.; Dufour, A.; Guedon, E. Diauxic Growth of Clostridium Acetobutylicum ATCC 824 When Grown on Mixtures of Glucose and Cellobiose. AMB Express 2018, 8, 85. [Google Scholar] [CrossRef]
  8. Díez-antolínez, R.; Hijosa-valsero, M.; Paniagua-garcía, A.I. Effect of Nutrient Supplementation on Biobutanol Production from Cheese Whey by ABE (Acetone–Butanol–Ethanol) Fermentation. Chem. Eng. Trans. 2016, 49, 217–222. [Google Scholar] [CrossRef]
  9. Qureshi, N.; Blaschek, H.P. Production of Acetone Butanol Ethanol (ABE) by a Hyper-Producing Mutant Strain of Clostridium Beijerinckii BA101 and Recovery by Pervaporation. Biotechnol. Prog. 1999, 15, 594–602. [Google Scholar] [CrossRef]
  10. Monot, F.; Martin, J.R.; Petitdemange, H.; Gay, R. Acetone and Butanol Production by Clostridium Acetobutylicum in a Synthetic Medium. Appl. Environ. Microbiol. 1982, 44, 1318–1324. [Google Scholar] [CrossRef]
  11. Raganati, F.; Olivieri, G.; Götz, P.; Marzocchella, A.; Salatino, P. Butanol Production from Hexoses and Pentoses by Fermentation of Clostridium Acetobutylicum. Anaerobe 2015, 34, 146–155. [Google Scholar] [CrossRef] [PubMed]
  12. Valles, A.; Álvarez-Hornos, F.J.; Martínez-Soria, V.; Marzal, P.; Gabaldón, C. Comparison of Simultaneous Saccharification and Fermentation and Separate Hydrolysis and Fermentation Processes for Butanol Production from Rice Straw. Fuel 2020, 282, 118831. [Google Scholar] [CrossRef]
  13. Jiang, W.; Wen, Z.; Wu, M.; Li, H.; Yang, J.; Lin, J.; Lin, Y.; Yang, L.; Cen, P. The Effect of PH Control on Acetone-Butanol-Ethanol Fermentation by Clostridium Acetobutylicum ATCC 824 with Xylose and D-Glucose and D-Xylose Mixture. Chin. J. Chem. Eng. 2014, 22, 937–942. [Google Scholar] [CrossRef]
  14. Maddox, I.S.; Steiner, E.; Hirsch, S.; Wessner, S.; Gutierrez, N.A.; Gapes, J.R.; Schuster, K.C. The Cause of “Acid Crash” and “Acidogenic Fermentations” during the Batch Acetone-Butanol-Ethanol (ABE-) Fermentation Process. J. Mol. Microbiol. Biotechnol. 2000, 2, 95–100. [Google Scholar]
  15. Yang, X.; Tu, M.; Xie, R.; Adhikari, S.; Tong, Z. A Comparison of Three PH Control Methods for Revealing Effects of Undissociated Butyric Acid on Specific Butanol Production Rate in Batch Fermentation of Clostridium Acetobutylicum. AMB Express 2013, 3, 3. [Google Scholar] [CrossRef]
  16. Ezeji, T.C.; Qureshi, N.; Blaschek, H.P. Acetone Butanol Ethanol (ABE) Production from Concentrated Substrate: Reduction in Substrate Inhibition by Fed-Batch Technique and Product Inhibition by Gas Stripping. Appl. Microbiol. Biotechnol. 2004, 63, 653–658. [Google Scholar] [CrossRef]
  17. Capilla, M.; San-Valero, P.; Izquierdo, M.; Penya-roja, J.M.; Gabaldón, C. The Combined Effect on Initial Glucose Concentration and PH Control Strategies for Acetone-Butanol-Ethanol (ABE) Fermentation by Clostridium Acetobutylicum DSM 792. Biochem. Eng. J. 2021, 167, 107910. [Google Scholar] [CrossRef]
  18. Guo, T.; Sun, B.; Jiang, M.; Wu, H.; Du, T.; Tang, Y.; Wei, P.; Ouyang, P. Enhancement of Butanol Production and Reducing Power Using a Two-Stage Controlled-PH Strategy in Batch Culture of Clostridium Acetobutylicum XY16. World J. Microbiol. Biotechnol. 2012, 28, 2551–2558. [Google Scholar] [CrossRef]
  19. Luo, H.; Zheng, P.; Xie, F.; Yang, R.; Liu, L.; Han, S.; Zhao, Y.; Bilal, M. Co-Production of Solvents and Organic Acids in Butanol Fermentation by: Clostridium Acetobutylicum in the Presence of Lignin-Derived Phenolics. RSC Adv. 2019, 9, 6919–6927. [Google Scholar] [CrossRef]
  20. Vees, C.A.; Neuendorf, C.S.; Pflügl, S. Towards Continuous Industrial Bioprocessing with Solventogenic and Acetogenic Clostridia: Challenges, Progress and Perspectives. J. Ind. Microbiol. Biotechnol. 2020, 47, 753–787. [Google Scholar] [CrossRef]
  21. Dolejš, I.; Krasňan, V.; Stloukal, R.; Rosenberg, M.; Rebroš, M. Butanol Production by Immobilised Clostridium Acetobutylicum in Repeated Batch, Fed-Batch, and Continuous Modes of Fermentation. Bioresour. Technol. 2014, 169, 723–730. [Google Scholar] [CrossRef] [PubMed]
  22. Liu, D.; Chen, Y.; Ding, F.Y.; Zhao, T.; Wu, J.L.; Guo, T.; Ren, H.F.; Li, B.B.; Niu, H.Q.; Cao, Z.; et al. Biobutanol Production in a Clostridium Acetobutylicum Biofilm Reactor Integrated with Simultaneous Product Recovery by Adsorption. Biotechnol. Biofuels 2014, 7, 5. [Google Scholar] [CrossRef] [PubMed]
  23. Ounine, K.; Petitdemange, H.; Raval, G.; Gay, R. Regulation and Butanol Inhibition of D-Xylose and D-Glucose Uptake in Clostridium Acetobutylicum. Appl. Environ. Microbiol. 1985, 49, 874–878. [Google Scholar] [CrossRef] [PubMed]
  24. El Kanouni, A.; Zerdani, I.; Zaafa, S.; Znassni, M.; Loutfi, M.; Boudouma, M. The Improvement of Glucose/Xylose Fermentation by Clostridium Acetobutylicum Using Calcium Carbonate. World J. Microbiol. Biotechnol. 1998, 14, 431–435. [Google Scholar] [CrossRef]
  25. Darkwah, K.; Nokes, S.E.; Seay, J.R.; Knutson, B.L. Mechanistic Simulation of Batch Acetone–Butanol–Ethanol (ABE) Fermentation with in Situ Gas Stripping Using Aspen PlusTM. Bioprocess Biosyst. Eng. 2018, 41, 1283–1294. [Google Scholar] [CrossRef] [PubMed]
  26. Bankar, S.B.; Survase, S.A.; Singhal, R.S.; Granström, T. Continuous Two Stage Acetone-Butanol-Ethanol Fermentation with Integrated Solvent Removal Using Clostridium Acetobutylicum B 5313. Bioresour. Technol. 2012, 106, 110–116. [Google Scholar] [CrossRef]
Figure 1. Fermentations setup with C. acetobutylicum DSM 792. (A) Batch fermentations, (B) continuous fermentation and (C) block diagram for the pH.
Fermentation 08 00226 g001
Figure 2. Fermentation profiles of (A) xylose, (B) butanol, (C) acetone, (D) ethanol, (E) butyric acid, (F) acetic acid and (G) biomass in g L−1 with C. acetobutylicum with pure xylose in batch mode.
Fermentation 08 00226 g002
Figure 3. Fermentation profiles of (A) glucose, (B) xylose (C) butanol, (D) acetone, (E) ethanol, (F) butyric acid, (G) acetic acid and (H) biomass in g L−1 with C. acetobutylicum with 1:1 ratio of glucose/xylose in batch mode.
Fermentation 08 00226 g003
Figure 4. Fermentation profiles of (A) glucose, (B) xylose (C) butanol, (D) acetone, (E) ethanol, (F) butyric acid, (G) acetic acid and (H) biomass in g L−1 with C. acetobutylicum with 3:1 glucose/xylose ratio in batch mode.
Fermentation 08 00226 g004
Figure 5. Fermentation profile of C. acetobutylicum with plastic rings at different dilution rates (h−1) and monosaccharide feed. Grey area shows acidogenic phase (pH ≥ 6.0) while unshaded area is solventogenic phase (pH ≥ 4.8). G denotes glucose and X xylose.
Fermentation 08 00226 g005
Table 1. Experimental plan with batch mode. The value of pH control indicates the minimum pH reached.
Glucose/Xylose RatioAmmonium Acetate (2.2 g L−1)Calcium Carbonate (5 g L−1)
BlankpH ControlBlankpH Control
0:1Yes4.8Yes5.1
1:1Yes4.8Yes5.1
3:1Yes4.8Yes4.8 and 5.1
Table 2. Summary conditions of the continuous fermentation.
Time (h)Minimum pH Set PointSubstrateConcentration (g L−1)D (h−1)
0–306.0Glucose60Batch
30–726.0Glucose600.042
72–1216.0Glucose600.083
121–1446.0Glucose600.167
144–1924.8Glucose600.167
192–2164.8Glucose600.333
216–2884.8Glucose/Xylose40:200.333
Table 3. Mass balance analysis for the continuous experiment.
Time (h)Substrate
(g L−1)
pHD
(h−1)
g C g C of Monosaccharide Consumed−1
Acetic AcidButyric AcidButanolAcetoneEthanolSuspended
Biomass
YieldUnaccounted
0–30Glucose (60)6.0Batch0.000.660.000.000.000.050.700.30
30–72Glucose (60)6.00.0420.140.390.010.000.000.050.590.41
72–121Glucose (60)6.00.0830.090.210.060.020.000.090.470.53
121–144Glucose (60)6.00.1670.130.300.100.040.000.130.700.30
144–192Glucose (60)4.80.1670.070.050.280.130.010.110.650.35
192–216Glucose (60)4.80.3330.070.050.270.110.050.160.720.28
216–288Glucose/Xylose (40:20)4.80.3330.080.070.280.130.020.140.720.28
Publisher’s Note: MDPI stays neutral with regard to jurisdictional claims in published maps and institutional affiliations.

