Article

Enhanced Phenazine-1-Carboxamide Production in Pseudomonas chlororaphis H5△fleQrelA through Fermentation Optimization

1
State Key Laboratory of Microbial Metabolism, School of Life Sciences and Biotechnology, Shanghai Jiao Tong University, Shanghai 200240, China
2
National Experimental Teaching Center for Life Sciences and Biotechnology, Shanghai Jiao Tong University, Shanghai 200240, China
3
Shanghai Nong Le Biological Products Co., LTD., Shanghai 201419, China
*
Author to whom correspondence should be addressed.
Fermentation 2022, 8(4), 188; https://doi.org/10.3390/fermentation8040188
Submission received: 8 March 2022 / Revised: 6 April 2022 / Accepted: 10 April 2022 / Published: 18 April 2022
(This article belongs to the Topic Bioreactors: Control, Optimization and Applications)

Abstract

:
Phenazine-1-carboxamide (PCN) is effective to control many plant pathogens, and improving PCN production would be of great significance in promoting its development as a biopesticide. This study was conducted to improve the PCN production of Pseudomonas chlororaphis H5△fleQrelA through fermentation optimization in both shake flask and bioreactor. The PCN production of H5△fleQrelA was improved from 2.75 ± 0.23 g/L to 5.51 ± 0.17 g/L by medium optimization in shake flask using Plackett-Burman design, the path of steepest ascent experiment and central composite design. Then, PCN production reached 8.58 ± 0.25 g/L through optimizing pH in 1 L bioreactor. After pH optimization, the transcriptional levels of ccoO_2 and ccoQ_2 genes related to microbial aerobic respiration were significantly upregulated, and the relative abundance of 3-oxo-C14-HSL was significantly enhanced 15-fold, and these changes were vital for cell activity and metabolites production. Furthermore, the PCN production reached 9.58 ± 0.57 g/L after optimization of the fed-batch fermentation strategy in 1 L bioreactor. Finally, the fermentation scale-up of the optimal medium and optimal feeding strategy were conducted in 30 L bioreactor at the optimal pH, and their PCN production reached 9.17 g/L and 9.62 g/L respectively, which were comparable to that in 1 L bioreactor. In this study, the high PCN production was achieved from the shake-flask fermentation to 30 L bioreactor, and the optimal feeding strategy improved PCN production in bioreactor without increasing total glycerol compared with in shake flask. It provides promising pathways for the optimization of processes for the production of other phenazines.

1. Introduction

Food is the first necessity of people, however, annual food losses caused by the pests and diseases account for about 40% of total annual yield worldwide indicating the single most important constraint of global food production is biological factors [1]. The prevention and control of plant diseases and pests mainly relied on synthetic chemical pesticides in past decades. However, the long-term use of synthetic chemical pesticides has caused a series of environmental and safety concerns, which brings new opportunities for the development of microbial pesticides, and now it has become an important part of agricultural sustainable programs [2].
Phenazines are a class of nitrogen-containing heterocyclic secondary metabolites primarily excreted by Pseudomonas and Streptomyces that display excellent broad-spectrum antibacterial activity with potential interest for agricultural and pharmaceutical applications [3,4]. Phenazine-1-carboxylic acid (PCA) previously studied by our laboratory was registered as “Shenqinmycin” by the ministry of agriculture of China in 2011 to inhibit rice sheath blight and the wilt of watermelon [5,6]. Phenazine-1-carboxamide (PCN) is a derivative of PCA, which is modified by the biosynthetic gene phzH, and it can effectively control tomato foot and root rot caused by Fusarium oxysporum f. sp. radicislycopersici [7,8]. More importantly, the antibacterial activity of PCN against some plant pathogenic fungi, such as Fusarium oxysporum, Rhizoctonia solani Kühn and Xanthomonas oryzae pv. Oryzae, is superior to that of PCA, carbendazim and rifamycin, which may provide beneficial leads in the future research and manufacturing of agrochemicals [9,10,11].
In recent years, much effort has been made to improve PCN production by genetic engineering, such as deleting negative regulatory genes, reinforcing precursor pathways, weakening competitive metabolic pathways, and editing and swapping promoters [12,13,14,15]. In addition to the construction of high-yield strains, fermentation optimization is also very important for the large-scale commercialization production. The PCN production of Pseudomonas strain UP46 was significantly increased by optimizing the glutamine concentration in shake flask [15]. Van et al. [16] found the temperature, oxygen concentration and pH had great influence on PCN production in shake flask. The bioreactor scale of the optimization experiment is comparatively small and the optimization experiment is basically conducted at shake flask level. The process of fermentation optimization is not systematic enough, and the PCN production falls short of the standard of commercial application.
P. chlororaphis HT66 is a rhizosphere growth-promoting bacteria isolated from rice rhizosphere by our laboratory that can synthesize PCN efficiently [17,18]. H5△fleQrelA is a PCN high-yield producing strain, and it was constructed by deleting the lon, parS, psrA, ofa, pykA, fleQ, and relA genes that negatively regulate PCN production in P. chlororaphis HT66. The PCN production of H5△fleQrelA is about 6.4 times that of HT66, and the yield coefficient values of H5△fleQrelA are also significantly higher than that of HT66, hence we chose H5△fleQrelA as the target strain of our study. To improve the PCN production of H5△fleQrelA, we optimized the fermentation medium in shake flask, optimized pH and feeding strategies in 1 L bioreactor, and achieved the scaled up production of PCN in a 30 L bioreactor. Finally, the PCN production reached 9.58 ± 0.57 g/L under the optimal conditions, which was 2.5 times higher than before optimization. At the same time, the optimal feeding strategy achieved the improvement of PCN production without increasing total carbon source. It provides a better basis for the efficient production of other phenazine derivatives.

2. Materials and Methods

2.1. Microorganism, Medium and Cultural Conditions

The strain used in this study was P. chlororaphis H5△fleQrelA, a lon, parS, psrA, ofa, pykA, fleQ, relA-deficient mutant strain of HT66, which was preserved by our laboratory. KB medium containing glycerol 18.92 g/L, tryptone 20.00 g/L, MgSO4 0.73 g/L, and K2HPO4 0.51 g/L was used for seeding fermentation. The initial pH was adjusted to 7.2 with 1 mol/L NaOH and H2SO4.
The fermentation culture of H5△fleQrelA in this study was followed the procedures described by Li et al. [19]. For seeding cultures, the H5△fleQrelA strain preserved at −80 °C was activated twice on KB plate and cultured at 28 °C for 36 h. One colony from the KB plate was inoculated into 5 mL KB media at 28 °C and 200 rpm for 12 h to serve as a seed culture of shake flash fermentation, and then 1% seed culture was transferred to a 60 mL production media and cultured for 72 h at 28 °C and 200 rpm.
One percent seed culture of shake flash fermentation into a 250 mL baffled Erlenmeyer flask containing 60 mL KB medium at 28 °C and 200 rpm for 12 h as the seed culture of the bioreactor. About 1% seed cultures were transferred into 1 L bioreactor with a working volume of 0.6 L and 30 L bioreactor with a working volume of 18 L using the optimal medium at 28 °C.

2.2. Optimization of Nitrogen Sources for PCN Production

In order to screen the nitrogen sources, tryptone, soybean cake and soy peptone were individually evaluated at a concentration of 20 g/L, while the concentrations of other components in KB medium were unchanged.

2.3. Screening of Significant Factors for PCN Production by Plackett-Burman Design

Based on single-factor concentration gradient experiments, the independent variable factors such as glycerol (X1), soy peptone (X2), soybean cake (X3), MgSO4 (X4) and K2HPO4 (X5) were studied at two levels (−1,1), and their concentrations were set at glycerol (20, 40 g/L), soy peptone (10, 20 g/L), soybean cake (10, 20 g/L), MgSO4 (0, 0.3 g/L), and K2HPO4 (0, 0.6 g/L), respectively. The Plackett-Burman (PB) design of 12 runs with two levels for each factor and the PCN production of each run are shown in Table 1. According to the regression analysis, the corresponding factor was considered to be significant when p < 0.05.

2.4. Determined the Central Point of Central Composite Design by the Path of Steepest Ascent Experiment

According to PB design, three significant positive effect factors were selected and the path of steepest ascent experiment was used for optimization, including glycerol (X1), soy peptone (X2) and soybean cake (X3). The steepest ascent started from the central point of the PB design, and the step sizes of the significant positive factors were proportional to their coefficients obtained from the PB design which is 0.25 units of X1 and 1.29 units of X2 and 1.13 units of X3 whereas the concentrations of MgSO4 and K2HPO4 remained at the central point of the PB design.

2.5. Optimization of Significant Factors by Central Composite Design

The central composite design (CCD) was employed to further optimize the concentrations of the three significant positive factors The three factors of glycerol (X1), soy peptone (X2), and soybean cake (X3) were studied at five different coded levels (−1.682, −1, 0, 1, 1.682) (Table S1). The whole CCD design consisted of 20 experimental runs and PCN production was considered as the response variable. The second order polynomial coefficients were calculated and analyzed using Minitab 19. The optimal medium composition for PCN production was obtained by solving the regression equation using Minitab 19. The three-dimensional (3D) response surface was constructed by using the Design-Expert 8.0.

2.6. Fermentation Optimization of the Strain H5△fleQ△relA in Bioreactor

The stirring speed was controlled at 800 rpm in 1 L bioreactor (Shanghai T&J Bio-engineering Co., Ltd., Shanghai, China) by using a computer-controlled system. The optimal pH and feeding strategy were investigated in 1 L bioreactor. During the fermentation process, the pH was controlled at 6.7, 7.2 or 7.7 by automatically adding 1 mol/L NaOH and H2SO4. The glycerol concentration of 500 g/L was fed into the bioreactor at a constant speed of 1 g/h, 2 g/h, 3 g/h, 4 g/h or 5 g/h by using a computer-controlled feeding system.
The stirring speed was controlled at 380 rpm in a 30 L bioreactor (Shanghai Bailun Bio-Technology Co., Ltd., Shanghai, China) by using a computer-controlled system. The fermentation scale-up of the optimal medium and optimal feeding strategy was carried out in the 30 L bioreactor. In all bioreactors, a foam sensor was installed and antifoam added automatically whenever foam was detected, and the aeration rate of bioreactor was 1 vvm.

2.7. The Measurement of Bacterial Density

The bacterial density was measured using UV spectrometer as described by Yao et al. [13]. A volume of 1 mL fermentation broth was centrifuged at 12,000 rpm for 1 min. The bacteria pellet was suspended with 1 mL distilled water, and then bacterial suspension was measured by UV spectrometer (UV-7504, Shanghai Precision Instruments CO., Ltd., Shanghai, China) at 600 nm, the path-length of cuvettes was 1 cm.

2.8. The Extraction and Quantitative Analysis of PCN Content

The PCN concentration was analyzed using HPLC as described by Jin et al. [20]. Briefly, 400 μL fermentation broth was acidified to pH 2.0 with 20 μL 6 M hydrochloric acid, and then extracted with 3.6 mL of ethyl acetate and shaken vigorously for 5 min, and centrifuged at 8000 rpm for 2 min. A 400-μL supernatant was absorbed into a new 2 mL centrifuge tube and dried in fume cupboard. The completely dried residue was dissolved with 1 mL HPLC grade acetonitrile and filtered with 0.22 μm organic phase filter membrane before HPLC detection. The PCN was quantified by HPLC (Agilent Technologies 1260 series, Santa Clara, CA, USA), HPLC was performed using the wondasil-WR column (5 μm; 4.6 × 250 mm, Shimadzu, Japan) at 254 nm using 8% acetonitrile and 92% 5 mM ammonium acetate as the mobile phase at a flow rate of 1 mL/min.

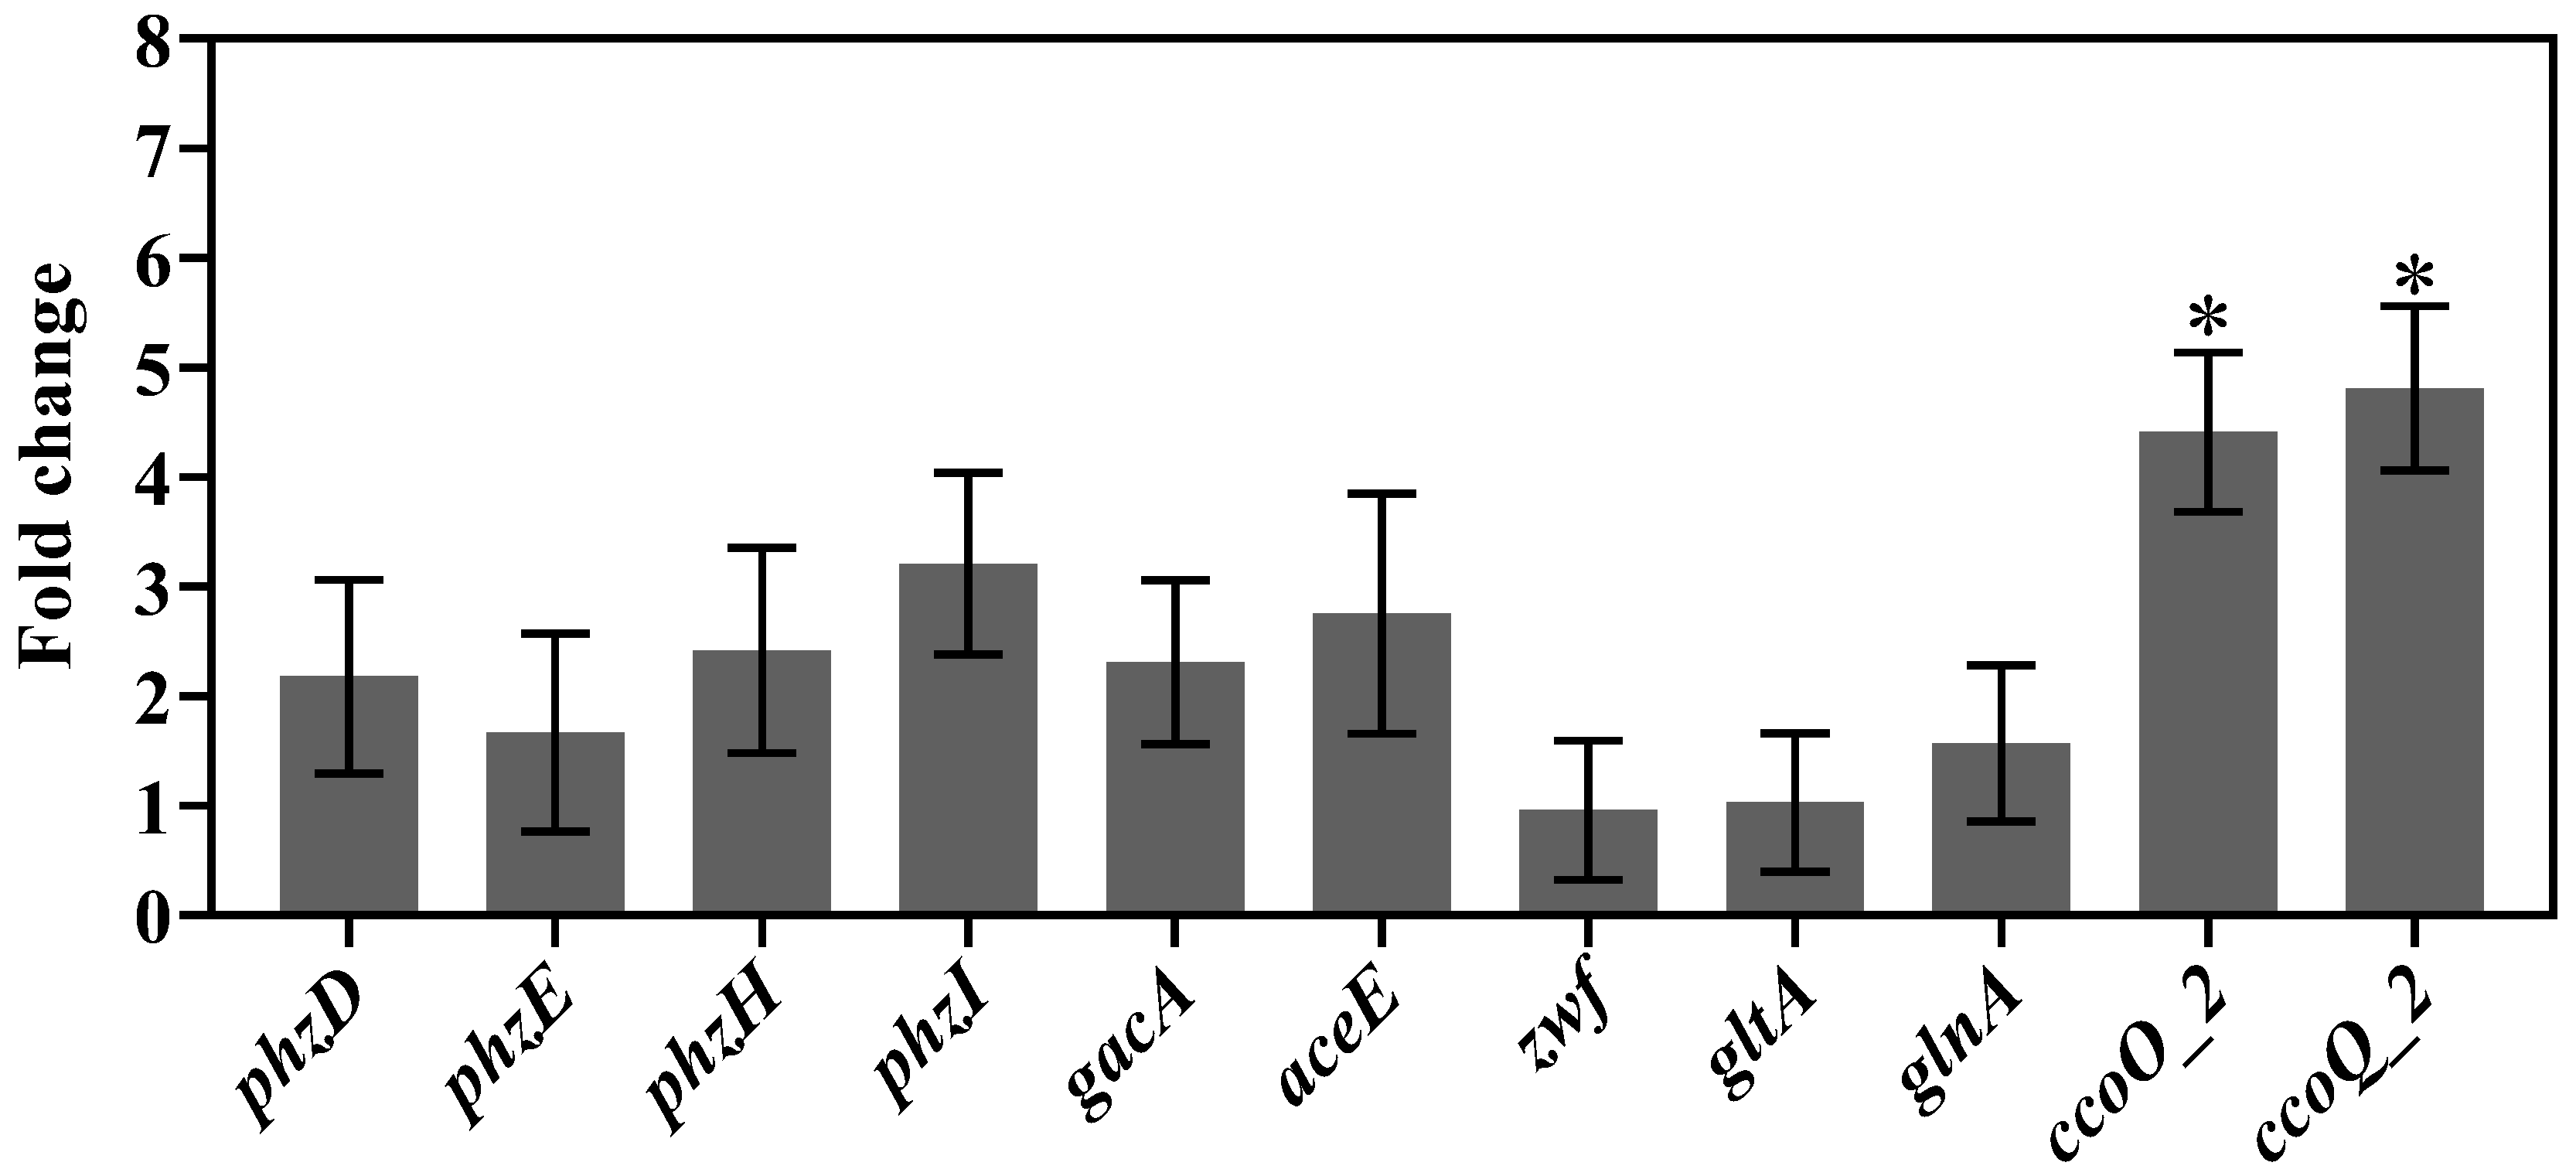
2.9. Quantitative Real-Time PCR

In this study, a total of 11 genes (phzD, phzE, phzH, phzI, gacA, aceE, zwf, gltA, glnA, ccoO_2, ccoQ_2) were selected for qRT-PCR analysis. After 12 h of fermentation, samples before and after pH optimization were collected for RNA extraction and qRT-PCR as described by Jin et al. [20]. The fold change for mRNAs was calculated by the 2△△CT method [21]. The primers used in the study are listed in Table S2, and the reference gene was 16S rRNA.

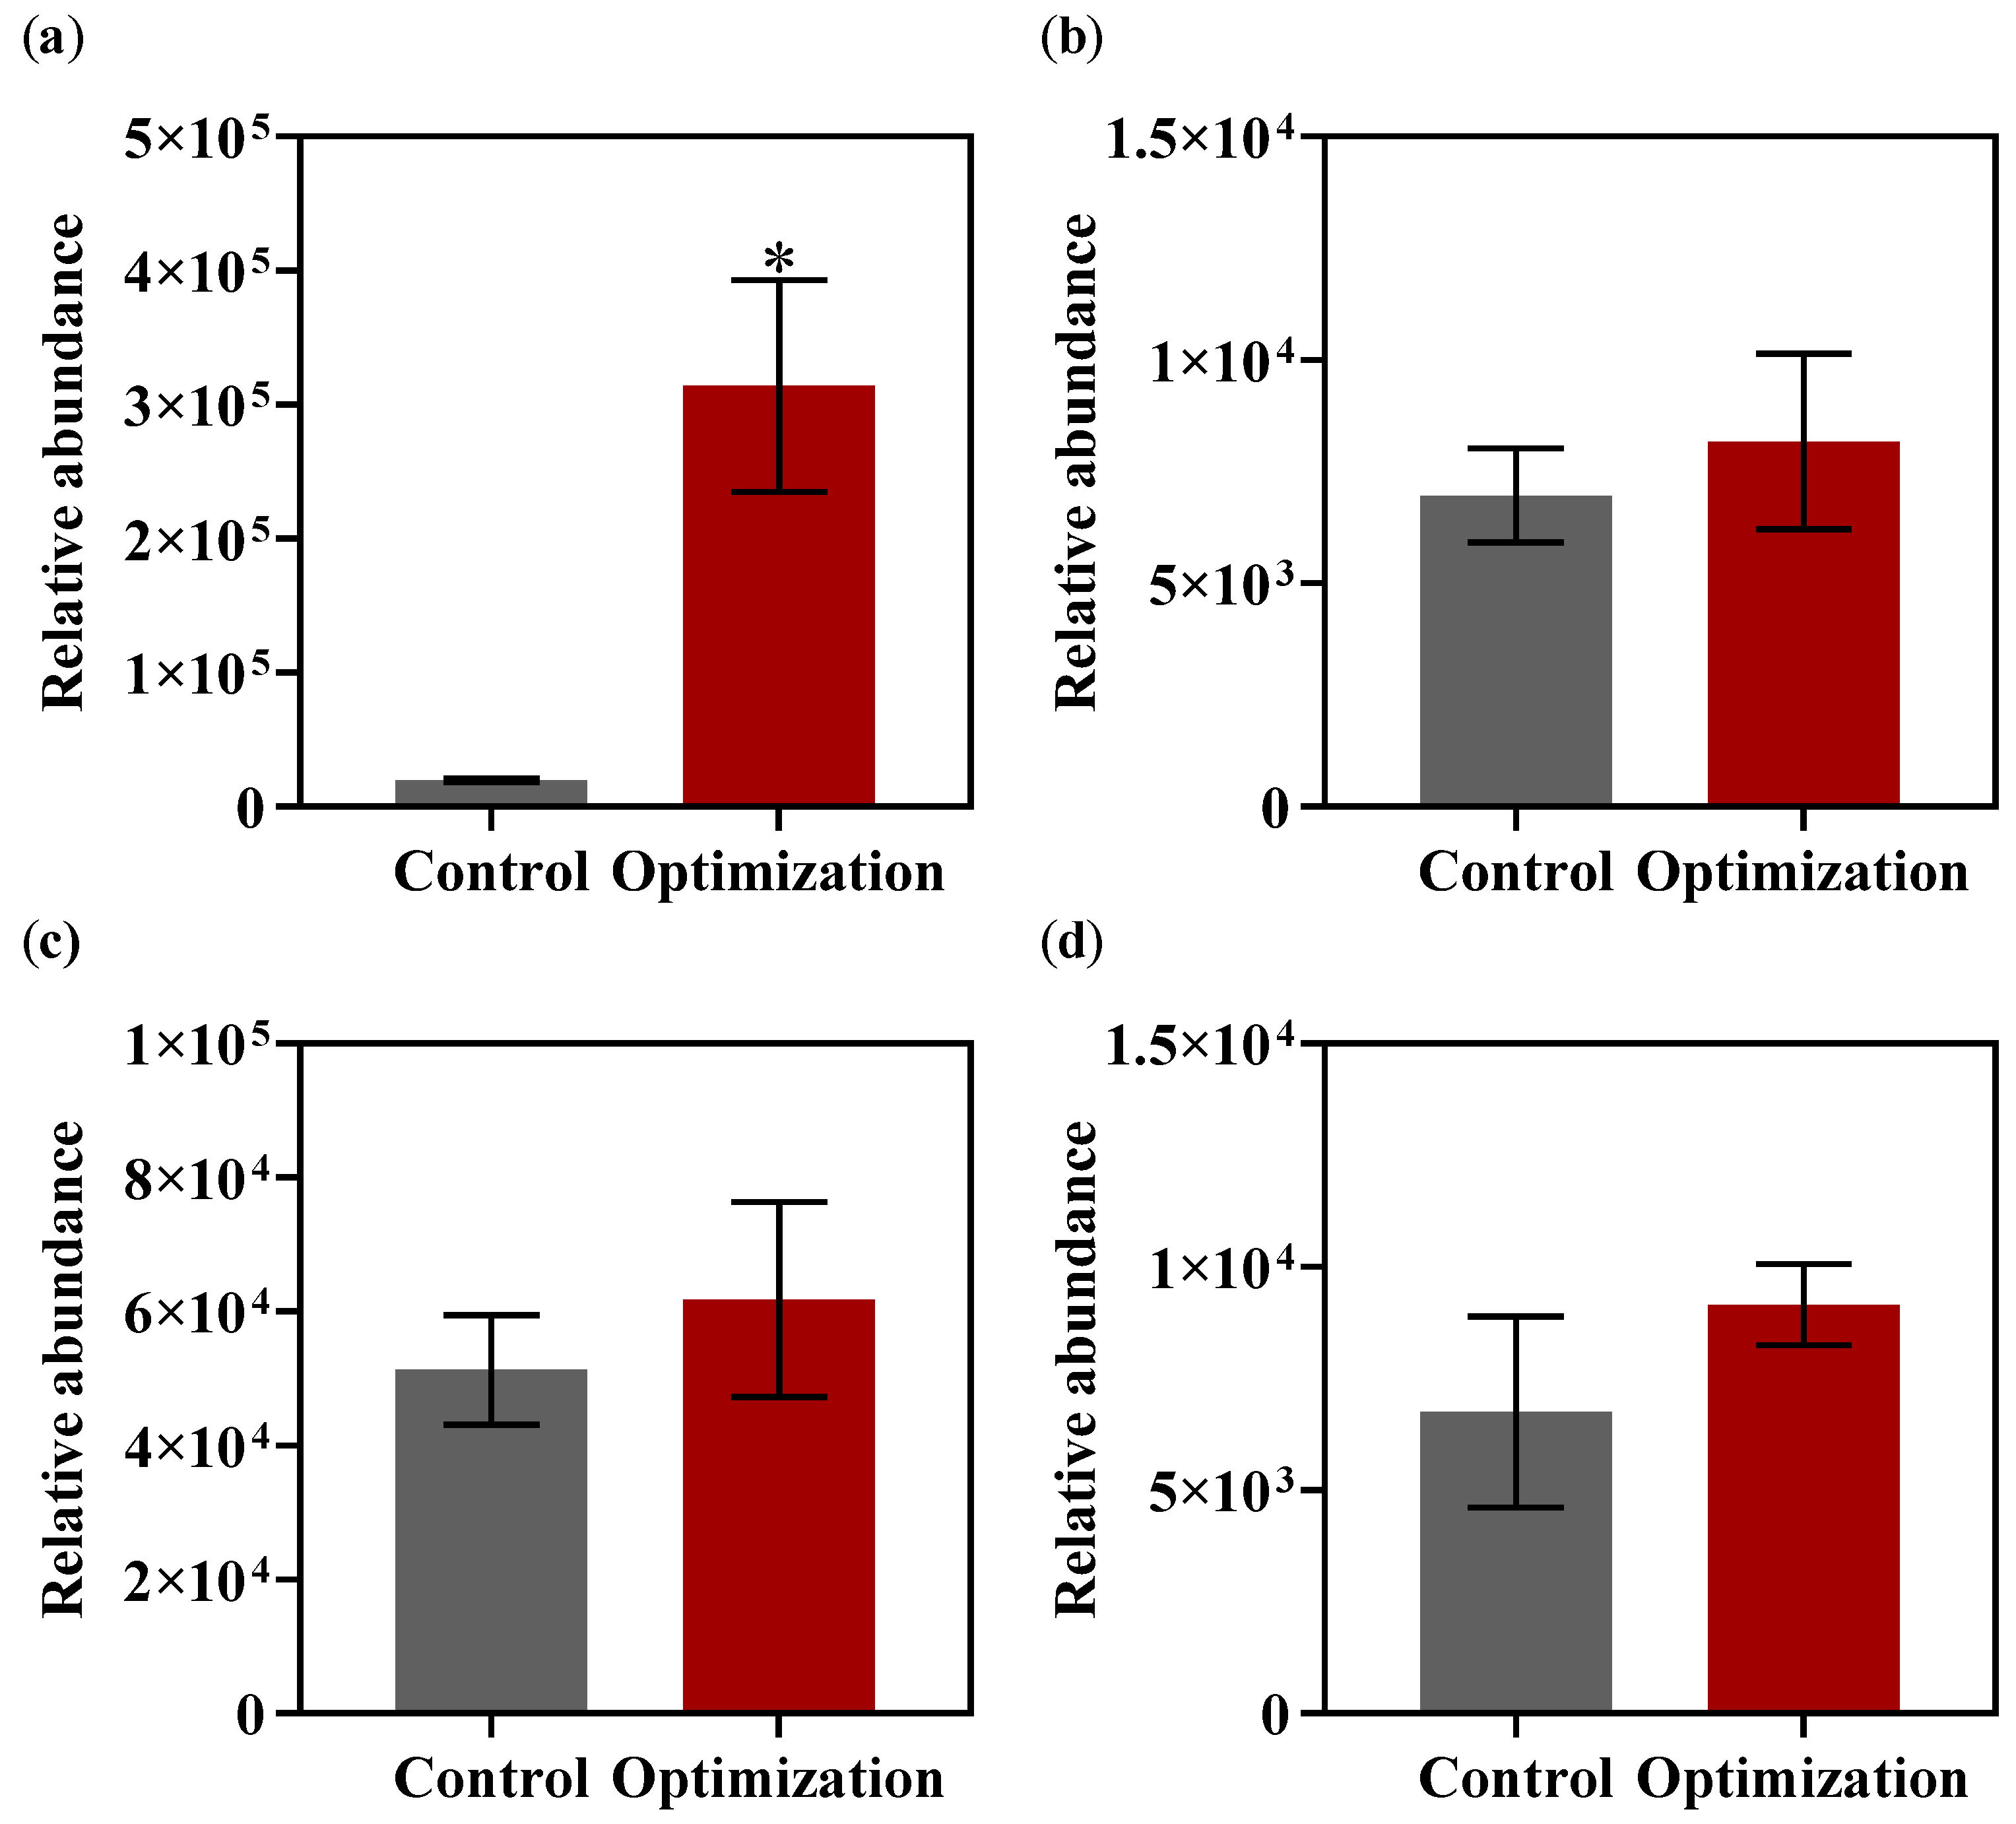
2.10. UPLC-TOF MS Analyses of AHL Signal Molecule

The N-acylated homoserine lactone (AHL) signal molecule was analyzed using UPLC-TOF MS as described by Peng et al. [17]. After 12 h of fermentation, samples before and after pH optimization were extracted with equal amounts of ethyl acetate and then concentrated to 2 mL. After steam drying, the concentrate was dissolved with 2 mL acetonitrile. Then, UPLC-TOF MS was used to detect culture extracts in positive electrospray ionization (ESI+). Diamonsil Plus C18 column (5 µm, 250 × 4.6 mm) was used for chromatography, the mobile phase A was 0.1% formic acid water, and the mobile phase B was acetonitrile. Metabolites were separated via gradient elution under the following conditions: 0–5 min, 20–50% B; 5–25 min, 50–90% B; 25–28 min, 90% B; 28–30 min, 20% B; and the gradient elution flow rate was 0.2 mL/min.

2.11. The Detection of Glycerol Concentration

The fermentation broth was centrifuged at 12,000 rpm for 2 min, and the upper layer was filtered by 0.22 μm water filter membrane for glycerol quantification. The concentration of glycerol was measured by HPLC (model 1260, Agilent, Santa Clara, CA, USA) with a cation-exchange column (HPX-87H, Bio-Rad, Hercules, CA, USA) and a differential refractive index detector (RID) [13]. The mobile phase was 5 mM H2SO4, the flow rate was 0.5 mL/min and the column temperature was 55 °C.

2.12. Statistical Analysis

All results were the averages of three parallel independent experiments, and the data were presented as the mean standard deviation.

3. Results

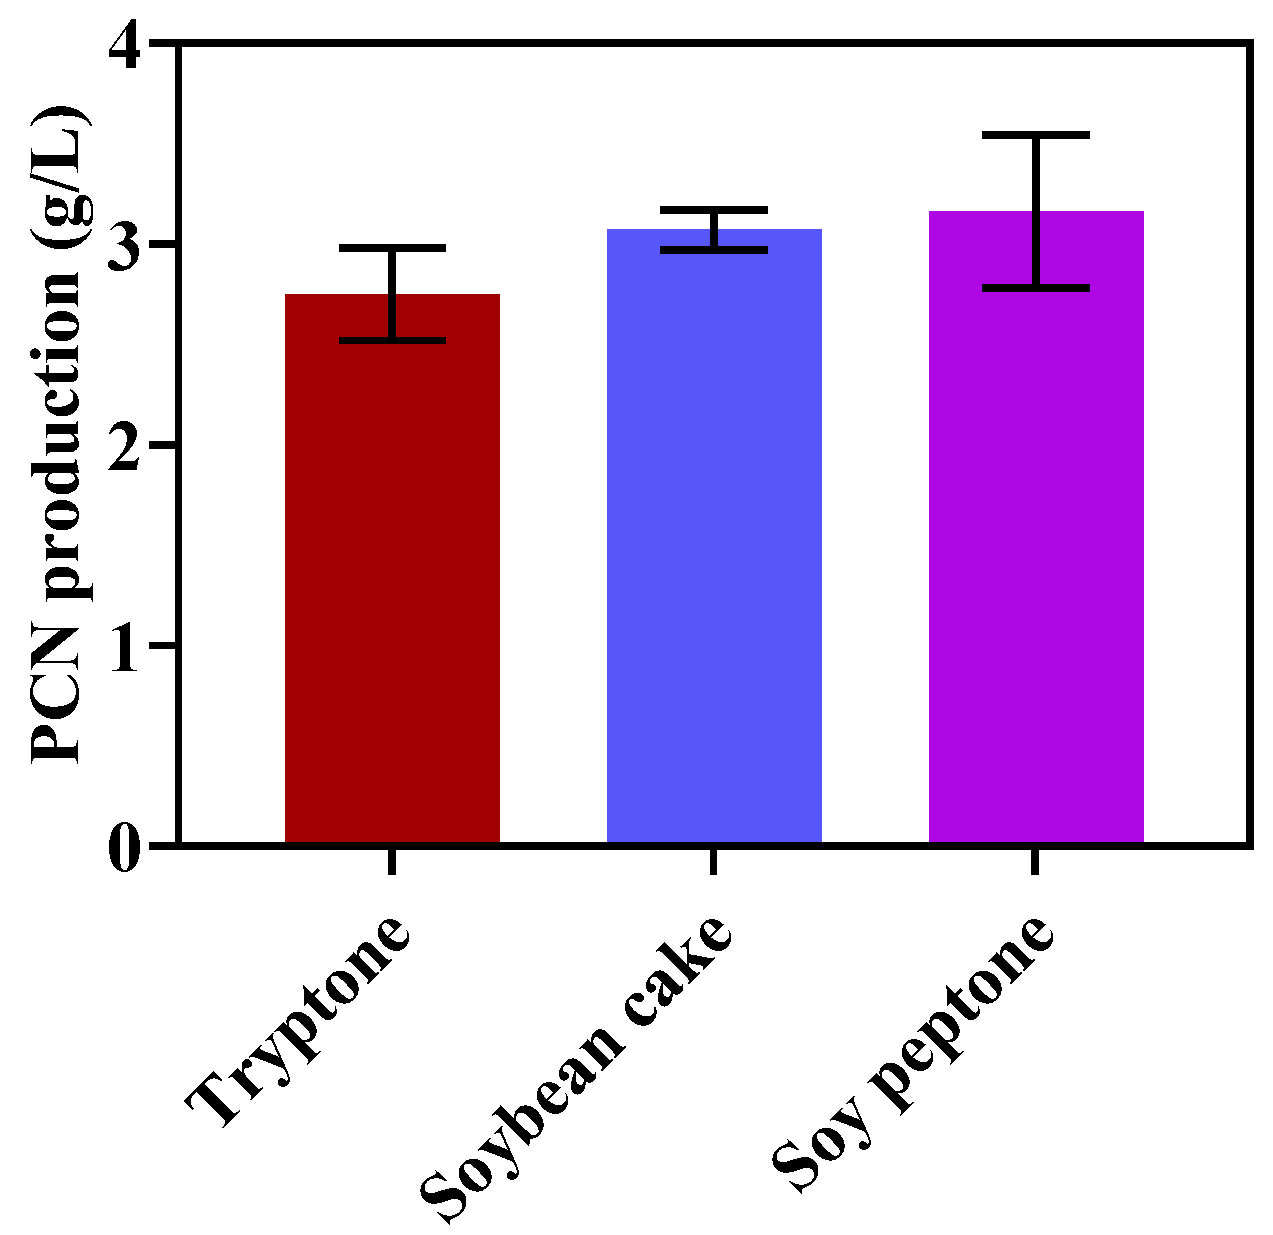
3.1. Optimization of Nitrogen Sources for PCN Production

Glutamine is an important metabolite in the biosynthesis of PCN, and it is the donor of two amino groups in two reactions of the PCN biosynthetic pathway [22]. Previous research had found that the use of inorganic nitrogen sources to form glutamine was not conducive to the biosynthesis of phenazines [23]. Thus, the influence of tryprone, soybean cake and soy peptone on PCN production in H5△fleQrelA was studied and the results were shown in Figure 1. Compared with the tryptone in KB medium, soybean cake and soy peptone had no significant effect on the PCN production. However, the price of tryptone is about 20-fold that of soybean cake, and 10-fold that of soy peptone. Therefore, considering the cost of fermentation and future commercial production, soybean cake and soy peptone were chosen as the nitrogen sources for further investigation.

3.2. Screening of Significant Factors for PCN Production by Plackett-Burman Design

The importance of glycerol, soy peptone, soybean cake, MgSO4 and K2HPO4 in the production of PCN was studied by PB design experiment. The PCN production of 12 groups of experiments was taken as the response value fitted by Minitab 19, and the analysis of variables for the PB design is presented in Table 2. The regression equation was obtained from the regression results of the PB design as Equation (1):
Y = 3.5984 + 0.1043X1 + 0.5379X2 + 0.4703X3 + 0.0155X4 − 0.3355X5
where Y is the corresponding response, X1, X2, X3, X4 and X5 represent the coded levels of glycerol, soy peptone, soybean cake, MgSO4 and K2HPO4, respectively and 0.1043, 0.5379, 0.4703, 0.0155 and −0.3355 represent the coefficients of X1, X2, X3, X4 and X5, respectively.
As shown in Table 2, glycerol (p = 0.03842), soy peptone (p = 0.00001) and soybean cake (p = 0.00002) had significant positive effects on PCN production. Therefore, glycerol, soy peptone and soybean cake were chosen as crucial factors for further optimization because of their significant positive impacts on the PCN production.

3.3. Determined the Central Point of Central Composite Design by the Path of Steepest Ascent Experiment

According to the results of the PB design, the concentrations of glycerol (X1), soy peptone (X2) and soybean cake (X3) were further optimized through the path of steepest ascent experiment. As shown in Table 3, the maximum PCN production was 5.27 g/L at run 5. This indicated that the concentrations of glycerol (X1), soy peptone (X2) and soybean cake (X3) in run 5 were close to the optimum point, and their concentrations were further optimized as the central point of CCD.

3.4. Optimization of Significant Factors by Central Composite Design

On the basis of the PB design and the path of steepest ascent experiment, a CCD strategy was applied to further optimize the concentrations of glycerol (X1), soy peptone (X2) and soybean cake (X3). The design of the experimental and response values is portrayed in Table 4, and the results of analysis of variance for the quadratic model are shown in Table 5. The second-order polynomial equation was obtained as Equation (2):
Y = 5.37 − 0.14X1 − 0.55X2 + 0.12X3 − 0.13X1X1 − 0.39X2X2 + 0.03X3X3 − 0.09X1X2 + 0.05X2X3 − 0.01X2X3
where Y is the predicted response, X1, X2 and X3 represent the coded values of glycerol, soy peptone and soybean cake, respectively.
In order to better understand the interaction among the concentrations of glycerol, soy peptone and soybean cake, 3D response surfaces were generated (Figure S1). Based on the second-order polynomial equation and analysis of variance, the optimal concentrations of glycerol, soy peptone and soybean cake were 39.04 g/L, 35.52 g/L, 26.70 g/L, respectively. The predicted maximum production of PCN was 5.87 g/L. Under these conditions, triplicated experiments were carried out to validate the optimal medium, as a result, the PCN production reached 5.51 ± 0.17 g/L, and this was well in agreement with the predicted value. The result indicated the significance of the model to a certain extent. Meanwhile, the PCN production in the optimal medium was about 1-fold higher than that of the KB medium.

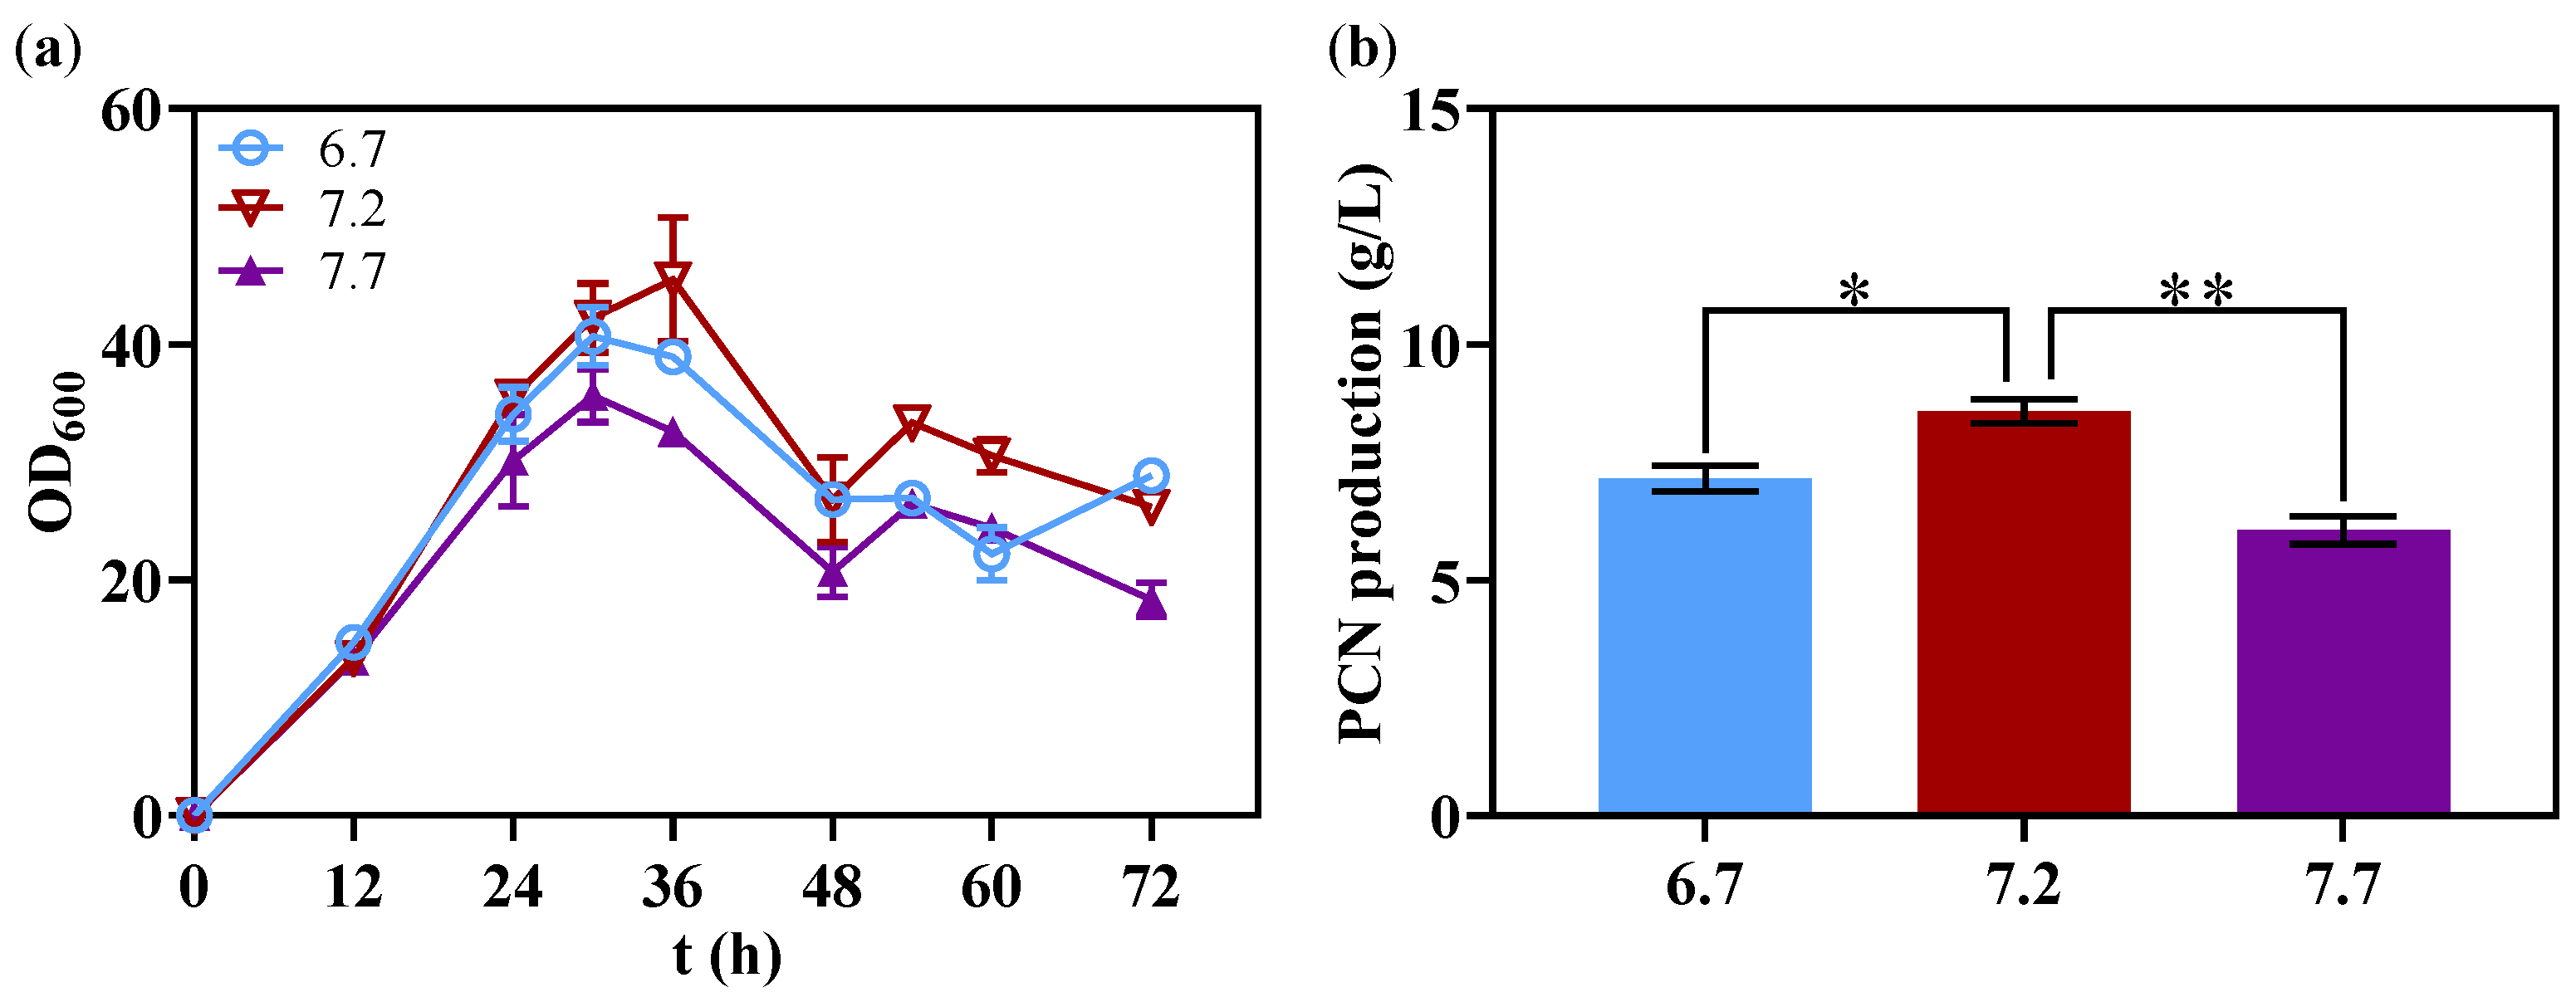
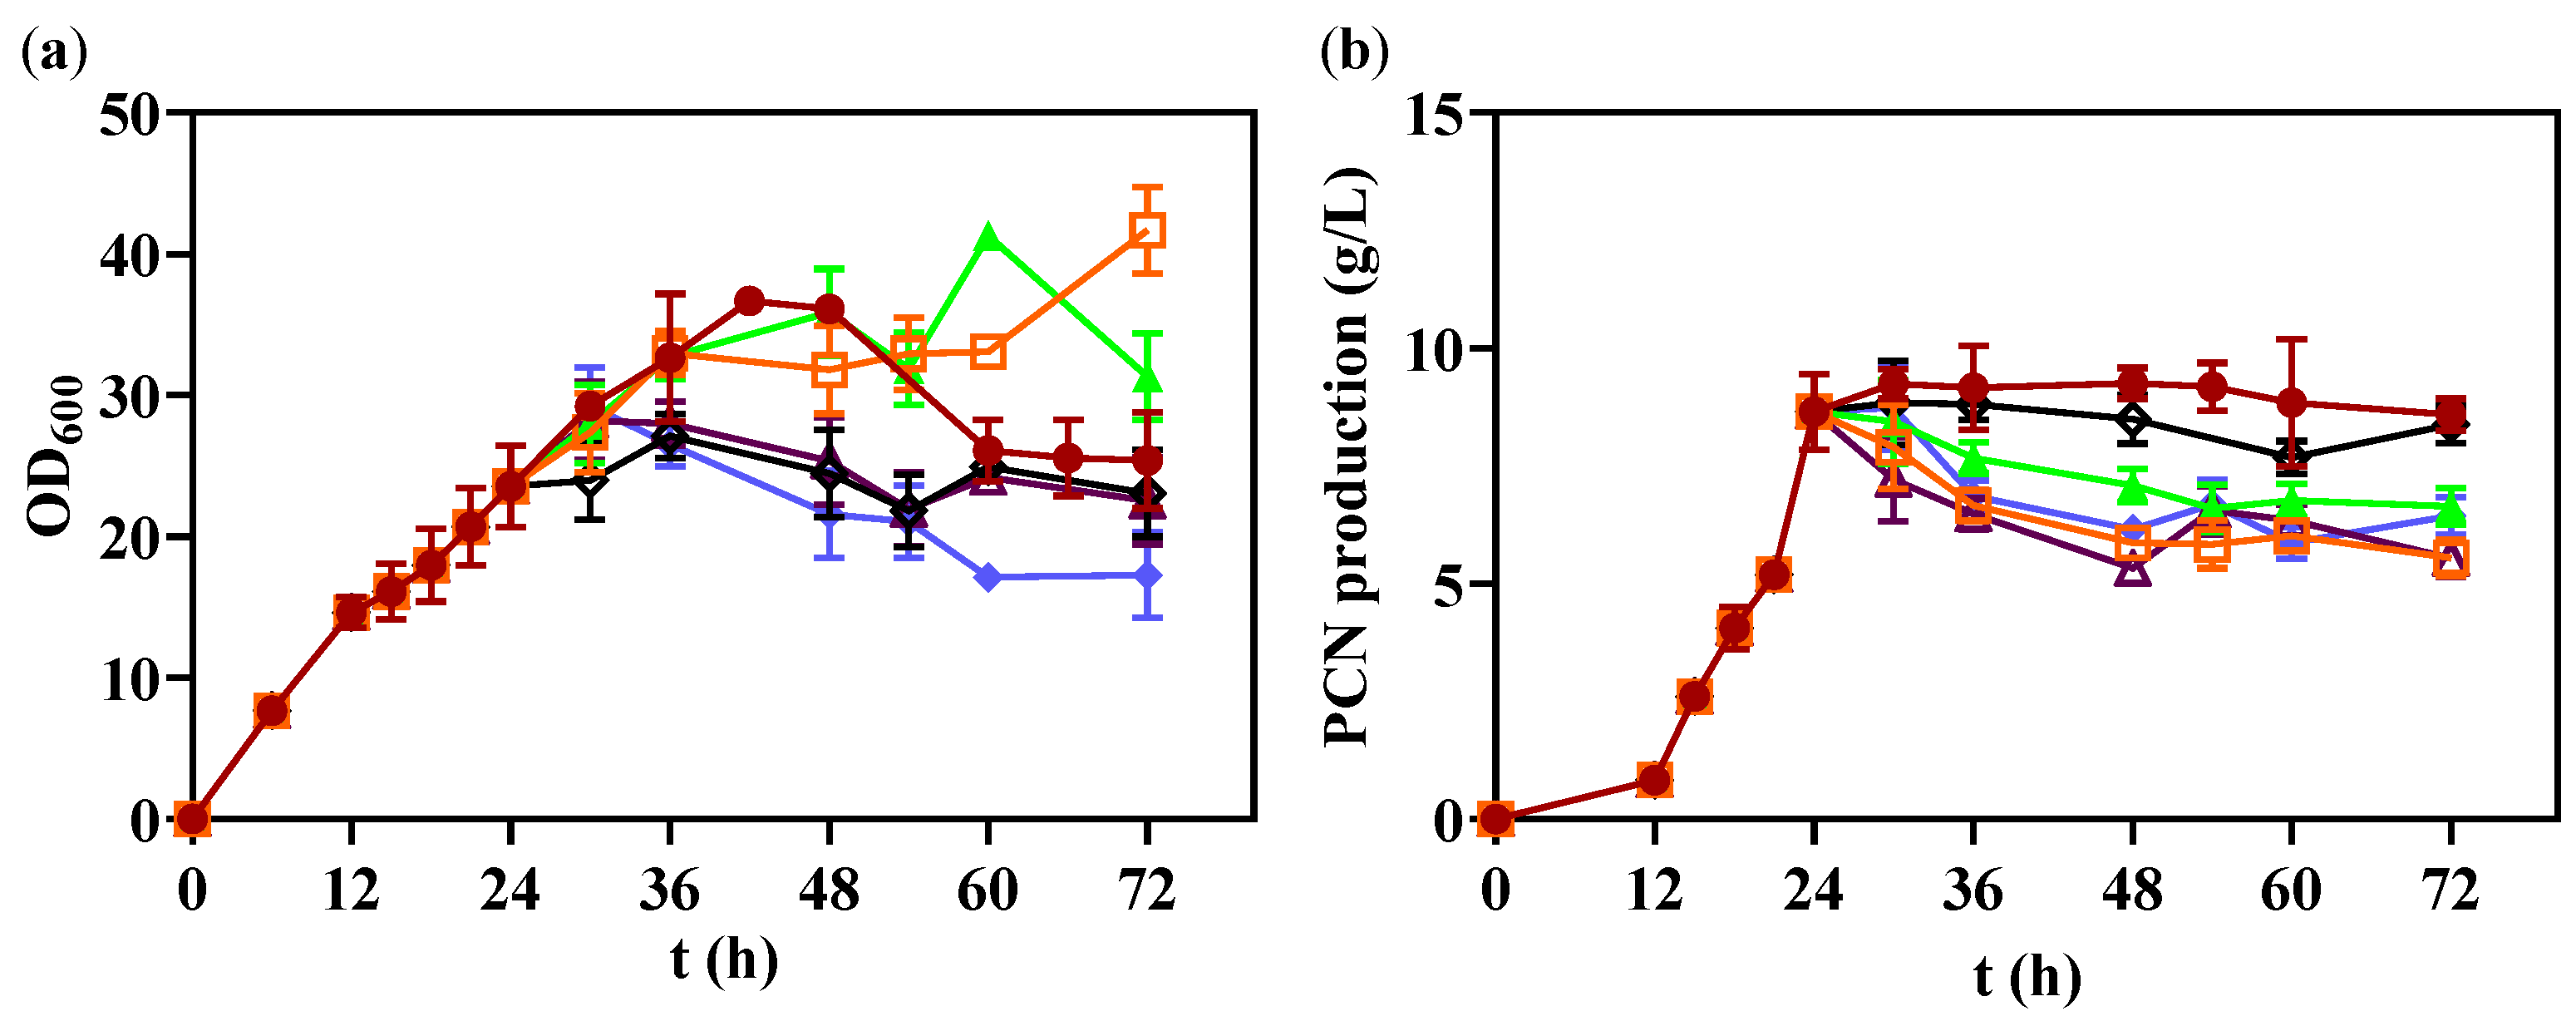
3.5. Optimization pH in 1 L Bioreactor

The fermentation pH can affect the biosynthesis of PCN, and therefore, to further improve PCN production, the influence of maintaining different stable pH on PCN production during fermentation process in 1 L bioreactor was explored. As shown in Figure 2, the OD600 and the PCN production reached 45.51 ± 5.26 and 8.58 ± 0.25 g/L when pH was maintained at 7.2 during fermentation, which were obviously higher than those at 6.7 and 7.7. Compared with not controlling the pH during fermentation, PCN production increased by 56% when pH was maintained at 7.2.
The next series of investigations were aimed at confirming the effect on PCN production of optimizing pH by analyzing the transcriptional levels of related genes and AHLs levels. First, eleven genes were selected for qRT-PCR to reveal the cause of the increase of PCN production from the transcriptional level: phzD, phzE, phzH, phzI and gacA, involved in the biosynthesis of PCN [20,24]; aceE, involved in the lower glycolytic pathway [25]; zwf, involved in pentose phosphate pathway; gltA, involved in TCA cycle; glnA, involved in the transformation of inorganic nitrogen sources; ccoO_2 and ccoQ_2, involved in aerobic respiration of microbes [26,27]. As shown in Figure 3, compared with before optimization of pH, the transcriptional levels of ccoO_2 and ccoQ_2 significantly increased 4.41-fold and 4.81-fold, respectively.
To explore the effect of pH on AHLs levels, supernatant extracts before and after pH optimization were analyzed. The results showed that the relative abundance of 3-oxo-C14-HSL had a significant increase, which was 15 times higher than that of the control group, and the relative abundance of 3-OH-C10-HSL, 3-OH-C8-HSL and C6-HSL did not change significantly (Figure 4).

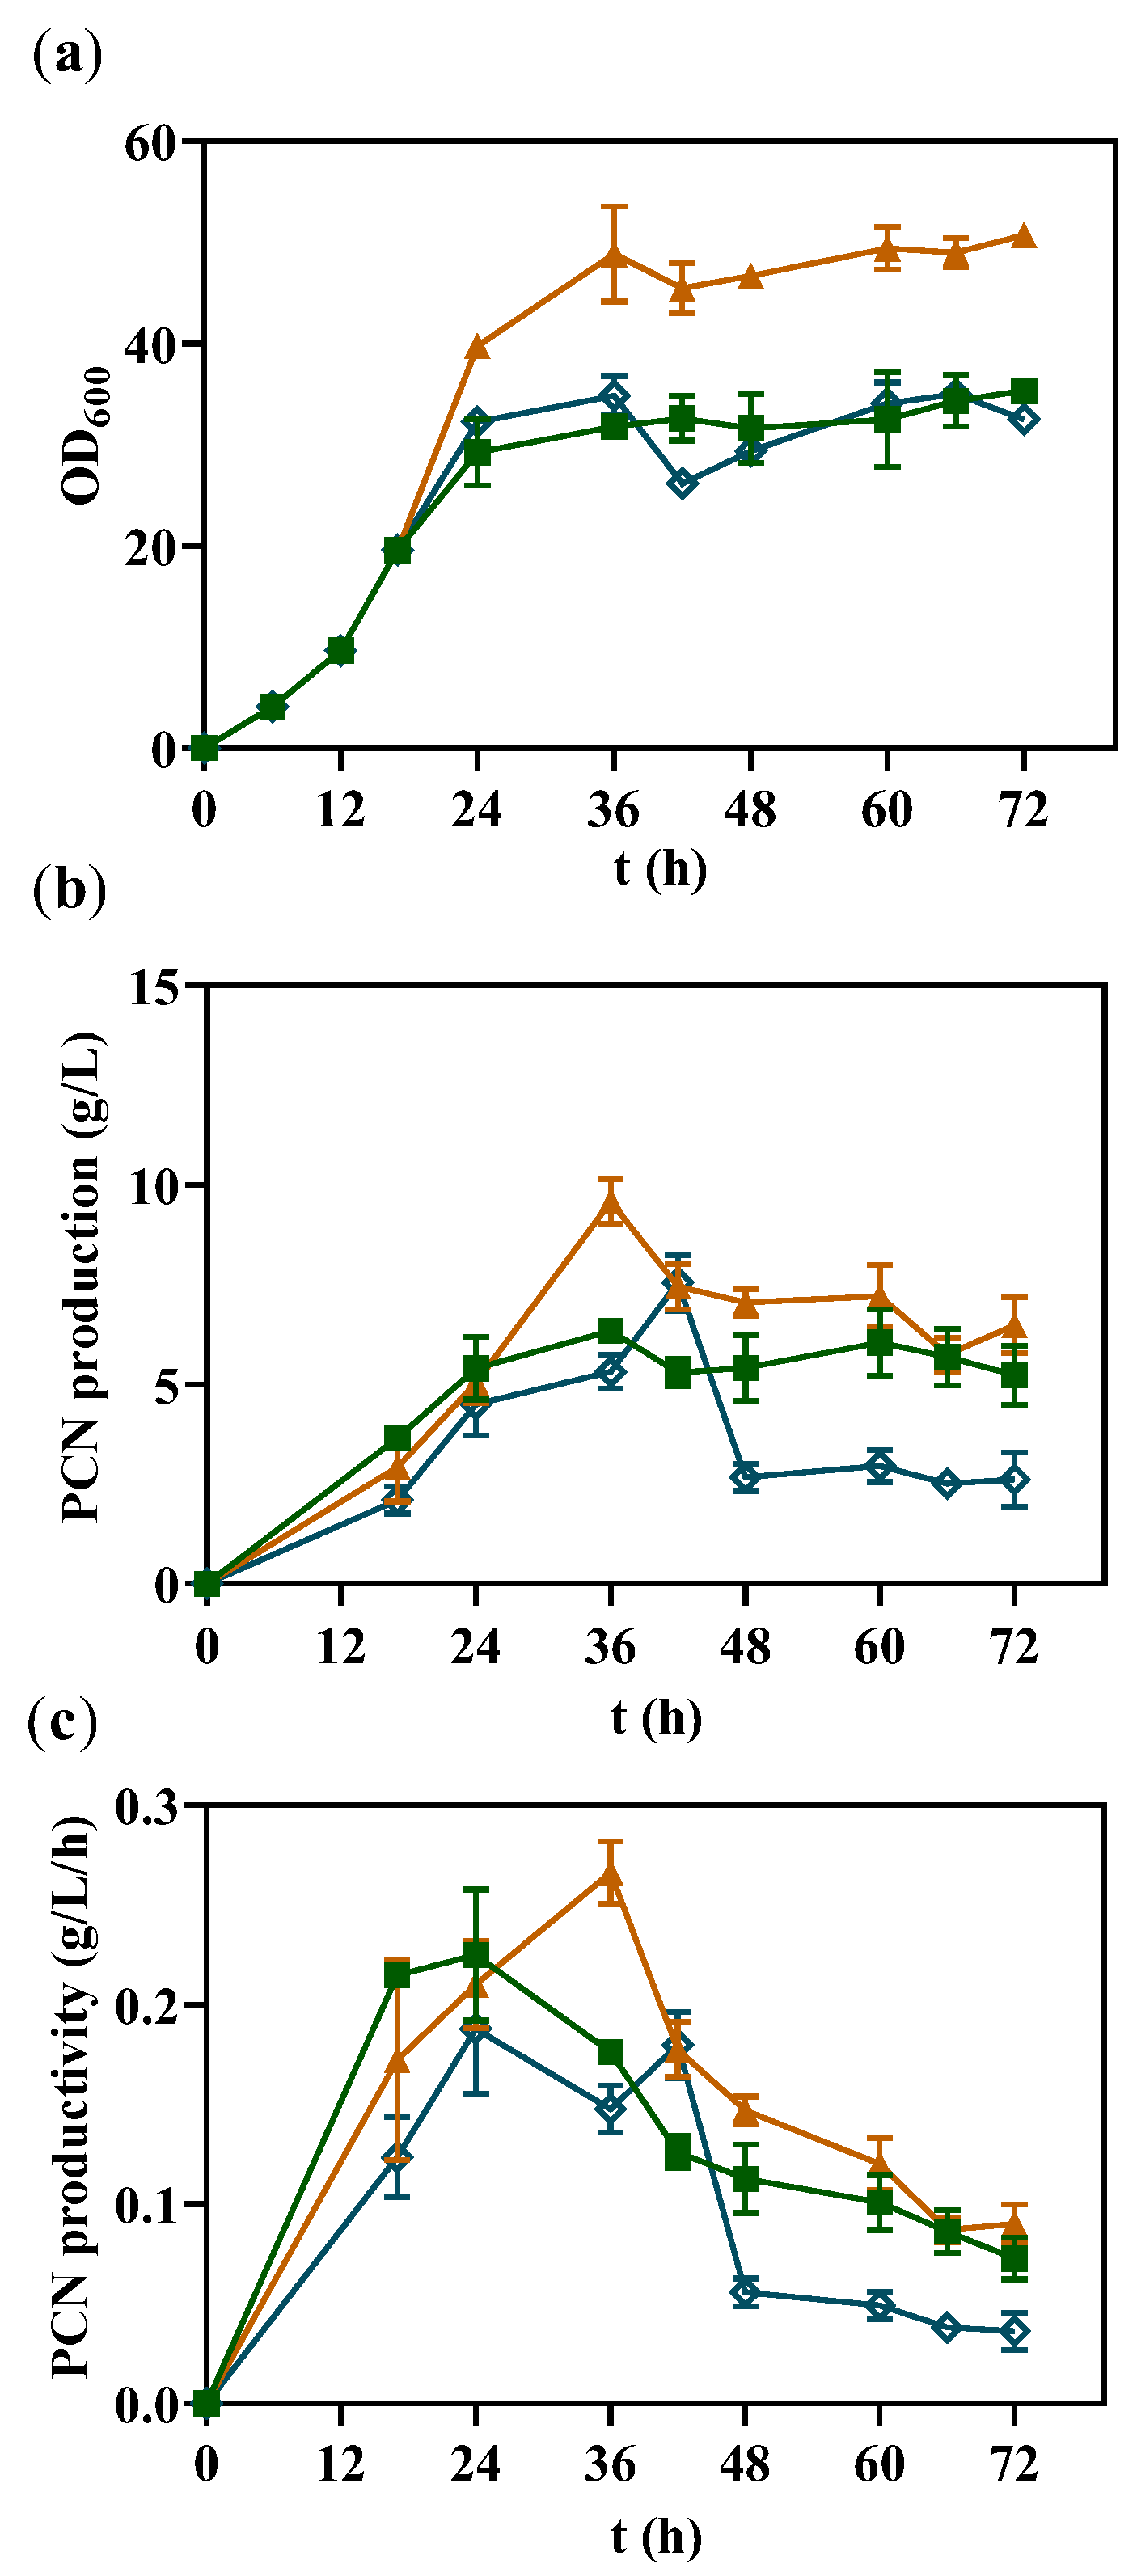
3.6. Fed-Batch Fermentation in 1 L Bioreactor

In order to further improve the PCN production, the influence of different feeding strategies on PCN production was investigated. According to the dynamic curves of the specific cell growth rate, PCN productivity and glycerol consumption rate (Figure S2), the influence of glycerol feeding speed on PCN production after 24 h was studied. After 24 h of fermentation, glycerol was fed at a different constant speed. As shown in Figure 5, the OD600 reached the maximum value of 41.69 ± 3.06 at 72 h when the feeding speed was 1 g/h, and the PCN production reached the maximum value at 30 h when the feeding speed was 3 g/h; however, the maximum PCN production decreased 5% compared with that of not feeding glycerol. As the glycerol feeding speed increased, the glycerol was not metabolized by the strain but accumulated in the fermentation medium (data not shown).
It might be that the high initial glycerol concentration limited the biosynthesis of PCN. Therefore, batch fermentation experiments with different initial glycerol concentrations were implemented to determine the appropriate initial concentration of fed-batch fermentation. With the increase of the initial glycerol concentration, the final biomass and PCN production increased (Figure S3a,b). When the initial glycerol concentration was 18 g/L, the maximum PCN production was 7.92 ± 0.34 g/L, which was only 8% lower than that of the optimal medium, and the maximum OD600 value was only 6% lower than that of the optimal medium. In addition, the maximum PCN productivity did not increase when the initial glycerol concentration was higher than 18 g/L (Figure S3c), which might be due to the inhibitory effect of excessive initial glycerol on the biosynthesis of PCN. Based on the above results, the initial glycerol concentration of the subsequent fed-batch fermentation was 18 g/L.
Glycerol was fed at different rates after the fermentation lasted for 17 h, since glycerol was almost used up after 17 h of fermentation when the initial glycerol concentration was 18 g/L (Figure S3d). As shown in Figure 6, feeding glycerol at the speed of 1 g/h achieved the maximum PCN production of 9.58 ± 0.57 g/L, which was 21% higher than without feeding glycerol, and feeding glycerol at the speed of 1 g/h also achieved the maximum OD600 of 49.39 ± 2.13 and the maximum PCN productivity of 0.27 ± 0.02 g/L/h.

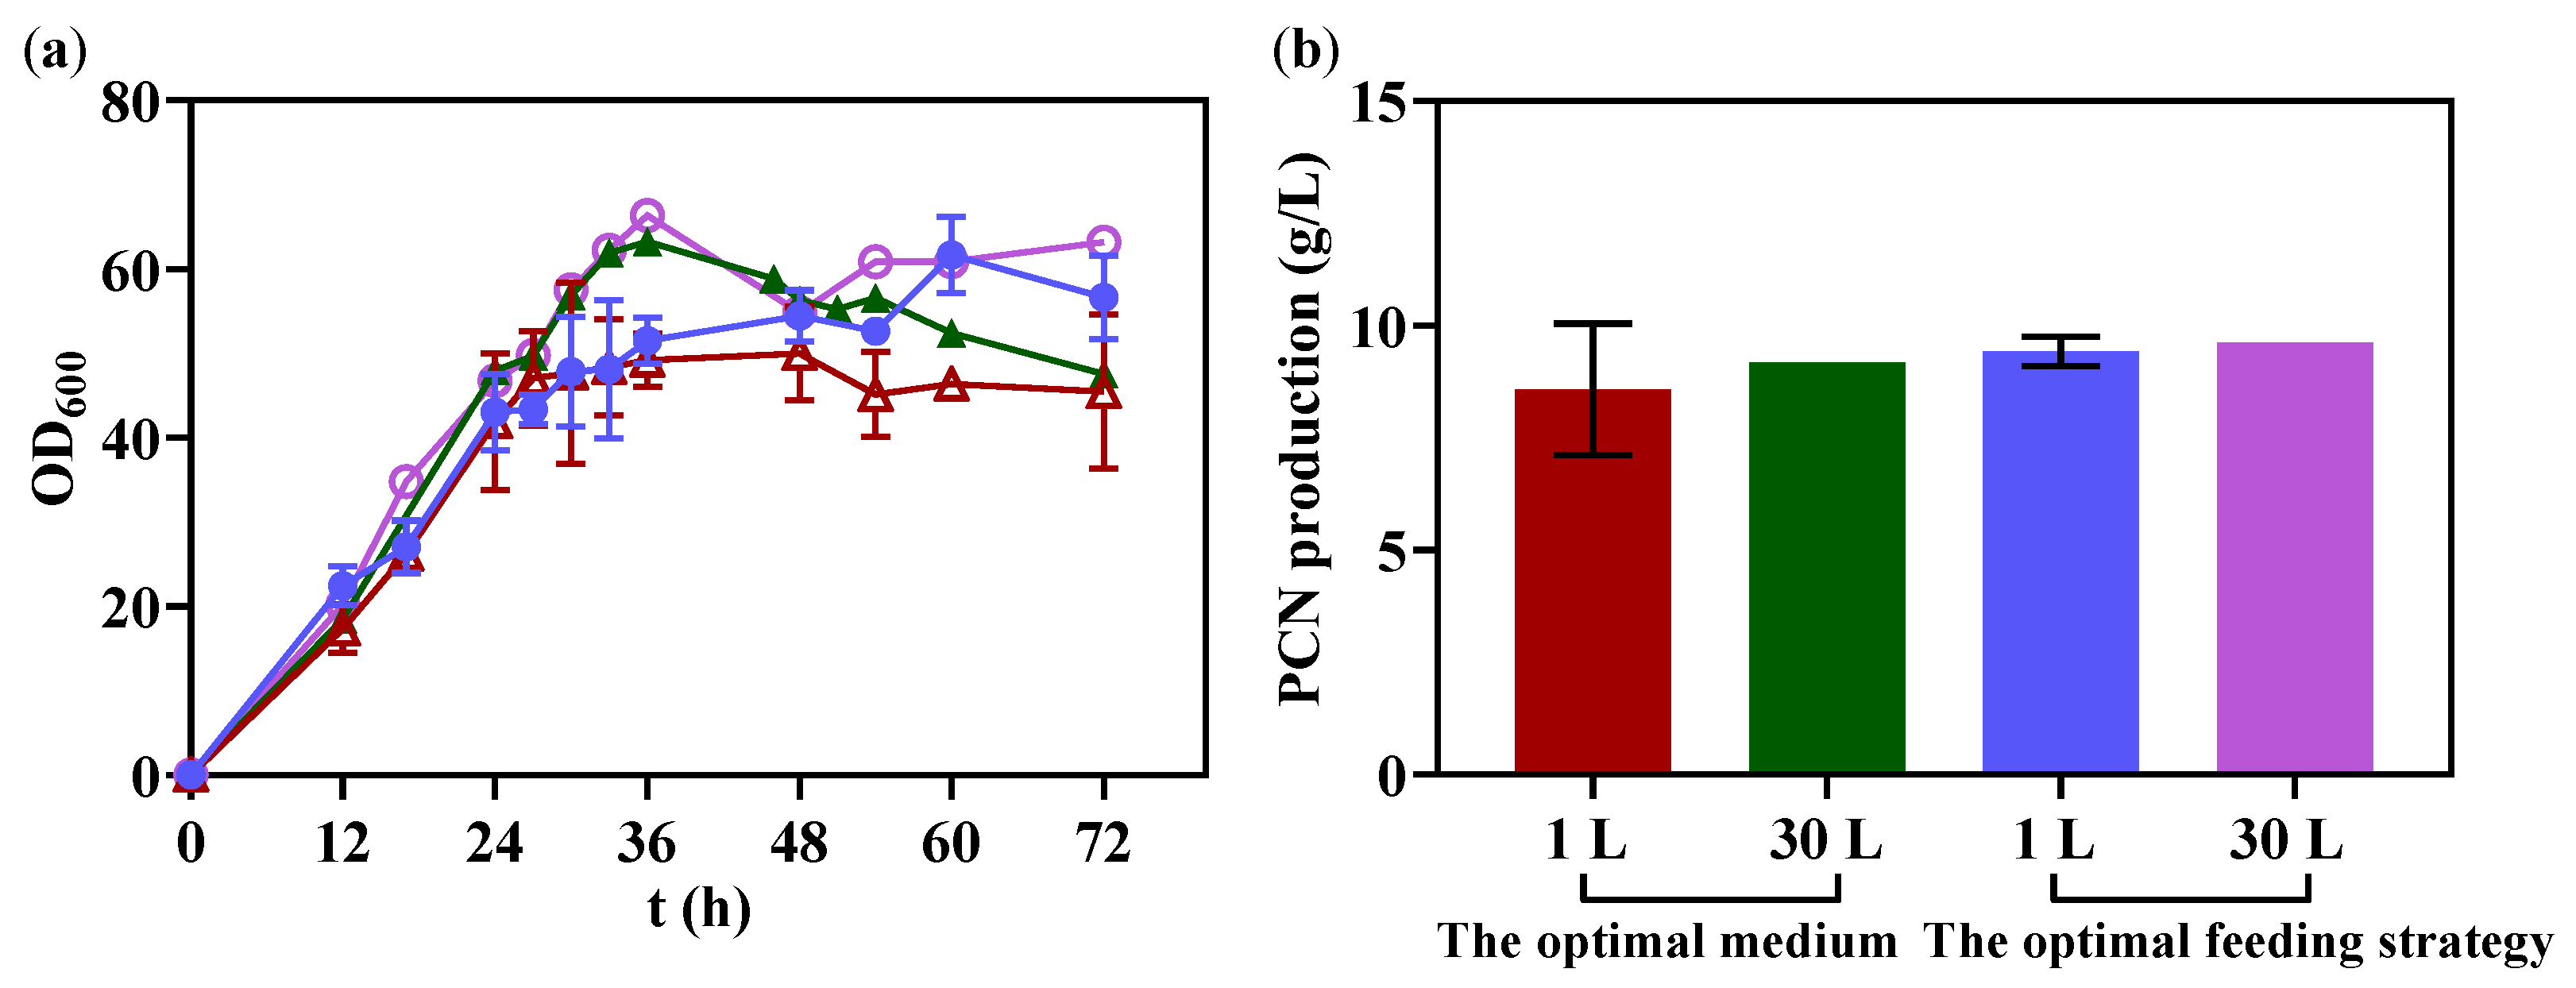
3.7. The Scale-up Production of PCN in 30 L Bioreactor

On the basis of fermentation optimization above, the optimal medium and optimal feeding strategy were investigated in the 30 L bioreactor and the pH was controlled at 7.2 during fermentation. As shown in Figure 7, the PCN production of the optimal medium in the 30 L bioreactor reached 9.17 g/L, which was 6.9% higher than that in the 1 L bioreactor; and the optimal feeding strategy (feeding glycerol at the speed of 1 g/h after fermentation for 17 h when the initial glycerol concentration was 18 g/L) in the 30 L bioreactor reached 9.62 g/L, which was 0.4% higher than that in the 1 L bioreactor. The results indicated the scale-up experiments of the optimal medium and optimal feeding strategy can be carried out efficiently.

4. Discussion

Most phenazines can be purified by organic solvent extraction combined with silica-gel column chromatography. Shanmugaiah et al. [11] purified PCN from the fermentation broth of P. aeruginosa MML2212 through ethyl acetate extraction and two-step silica column chromatography. In our laboratory, Peng et al. [28] harvested the crude extract of PCN through ethyl acetate extraction and evaporation concentration from the fermentation broth of P. chlororaphis HT66, and then PCN was purified by preparative HPLC.
PCN is a promising biopesticide, and improving PCN production will promote its application in agriculture. In addition to construction of the high-production strain, fermentation medium optimization is also very important to improve the PCN production. PCN is a nitrogen-containing heterocyclic compound and glutamine as the amino donor is required in its biosynthetic pathway [13,23]. It was found that phenazines were hardly synthesized when the pseudomonas strain was cultured in an inorganic salt medium supplemented with glycerol, while a large amount of phenazines were produced when the pseudomonas strain was cultured in tryptone-rich organic nitrogen medium such as KB medium [23]. Therefore, pseudomonas is usually cultivated in KB medium for the biosynthesis of PCN [15,17,20]. Both carbon and nitrogen sources could affect the biosynthesis of PCN. However, glycerol as a carbon source showed a better PCN yield than glucose, sucrose and fructose, and glycerol as an inexpensive substrate had been used for large-scale fermentation [13,29]. As for nitrogen sources, organic nitrogen sources are more favorable to synthesize phenazines in P. chlororaphis than inorganic nitrogen sources such as KNO3, NH4Cl and (NH4)2SO4 [23].
There was no significant difference on PCN production when tryptone, soybean cake and soy peptone were used as organic nitrogen sources, respectively. However, the prices of soybean cake and soy peptone were only 0.05 and 0.1 times those of tryptone, hence soybean cake and soy peptone were chosen as nitrogen sources. And then, PB design, the path of steepest ascent experiment and CCD were used to optimize the fermentation medium, and the PCN production increased by 1 time compared with the KB medium. The cost of the optimal media is lower, for the same volume of medium, the cost of KB medium is about twice that of the optimal medium. When KB medium was used as fermentation medium, the cost per gram of PCN was about 4 times that of the optimal medium. Using the optimal medium for PCN fermentation achieved higher production at lower cost, and it is more conducive to its industrial production.
The pH is necessary for the growth and metabolism of microorganisms, which can affect the absorption and utilization of nutrients, respiration, the synthesis of secondary metabolites and many other life activities [30]. Therefore, fermentation pH was optimized in 1 L bioreactor, and the PCN production increased by 56% through controlling the pH at 7.2 during fermentation. And interestingly, the transcriptional levels of ccoO_2 and ccoQ_2 genes significantly increased 4.41-fold and 4.81-fold after optimizing pH in the 1 L bioreactor. The ccoO_2 and ccoQ_2 genes encoded relevant cytochrome C oxidase in pseudomonas [26]. After pH shock, the expression of SHJG0557 encoded a cytochrome bd-type quinol oxidase and SHJG7814 encoded related iron sulfur oxidoreductases increased in Streptomyces hygroscopicus 5008 [31]. The up-regulated expression of the two genes resulted in the acceleration of electronic transfer and the enhancement of respiratory activity, which promoted the biosynthesis of validamycin [31]. The cytochrome oxidase and iron sulfur oxidoreductases are the basis components of the microbial aerobic respiratory chain. Hence, our result was in accordance with the result of Jiang et al. [31], the up-regulated expression of ccoO_2 and ccoQ_2 might accelerate the aerobic respiratory and oxygen transfer of H5△fleQrelA, which was more conducive to the improvement of PCN production, however, the specific mechanism remains to be further studied.
Meanwhile, the level of 3-oxo-C14-HSL remarkably increased 15-fold after optimizing pH, which was in accordance with P. chlororaphis PCL1391 in that environmental conditions can affect the AHLs levels [16]. AHLs are involved in the biosynthesis of phenazines in Pseudomonas [17], hence the increase of PCN production might be related to the significant increase of relative abundance of 3-oxo-C14-HSL in H5△felQrelA. However, the mode of function of 3-oxo-C14-HSL in H5△fleQrelA requires more detailed investigation.
Fed-batch fermentation has been proved to be an effective strategy in reducing growth inhibition caused by high substrate concentration and improving the production of many secondary metabolites [32]. However, the PCN production did not increase when fed glycerol at the constant speed after fermentation 24 h, it might be that the high initial glycerol concentration limited the biosynthesis of PCN. In consequence, the influence of initial glycerol concentration on fermentation was investigated in the 1 L bioreactor, and the PCN production and OD600 only increased by 8% and 7% when the initial glycerol concentration was higher than 18 g/L, however, the maximum productivity did not increase. The high glycerol concentration might inhibit the biosynthesis of PCN and the metabolism of energy source. Hence, the initial glycerol concentration of 18 g/L was more favorable for the fed-batch experiment. The result was similar as the high initial carbon concentration was not beneficial to the production improvement of docosahexaenoic acid [33].
PCN production increased by 21% compared with that without feeding glycerol when feeding glycerol at the speed of 1 g/h after fermentation for 17 h, and it should be noted that PCN production achieved its maximum value at 36 h. In this fermentation process, the total feeding volume of glycerol was 19 g at 36 h, and almost all the glycerol was consumed at 36 h (data not shown), so a total of 37 g glycerol was consumed at 36 h, which was lower than the glycerol concentration of the optimal medium. Hence, the optimal feeding strategy achieved the higher PCN production by consuming less glycerol. Finally, the optimal medium and optimal feeding strategy successfully achieved fermentation scale-up in the 30 L bioreactor, thus, the fermentation strategy is applicable to industry-scale fermentation production of PCN.

5. Conclusions

The PCN production of H5△fleQrelA increased 2.5-fold through a series of fermentation optimization strategies, including optimization of fermentation medium by using PB design, the path of steepest ascent experiment and CCD in shake flask, optimization of pH and feeding strategy in 1 L bioreactor. At the same time, the optimized fermentation schemes also achieved fermentation scale-up in the 30 L bioreactor, reaching the production level of the 1 L bioreactor. In this work, the optimal feeding strategy increased PCN production in bioreactor under the circumstance of reducing total glycerol compared with in shake flask, and high PCN production was also achieved in the 30 L bioreactor. However, to further improve PCN production and reduce its production cost, fermentation optimization can be conducted in a larger bioreactor. In addition, an in-depth study is required to explore whether PCN production can be further improved through feeding nitrogen sources. At the same time, metabolomics also can be conducted to analyze the metabolic response and complex mechanisms of PCN production improvement.

Supplementary Materials

The following supporting information can be downloaded at: https://www.mdpi.com/article/10.3390/fermentation8040188/s1, Figure S1: Three-dimensional response surface for the effects of independent variables on PCN production. (a) glycerol and soy peptone; (b) glycerol and soybean cake; (c) soy peptone and soybean cake; Figure S2: Time profiles of OD600 and specific cell growth rate (a), PCN production and PCN productivity (b), and glycerol concentration and glycerol consumption rate (c) with a constant fermentation pH of 7.2 in 1 L bioreactor; Figure S3: Influence of the initial glycerol concentration on cell growth (a), PCN production (b), PCN productivity (c) and glycerol consumption (d) during fermentation in 1 L bioreactor. The purple hollow circles represent that the initial glycerol concentration was 9 g/L; the green solid squares represent that the initial glycerol concentration was 18 g/L; the red solid triangles represent that the initial glycerol concentration was 39.04 g/L (the glycerol concentration of the optimal medium).; Table S1: Factors and levels of the central composite design; Table S2: Primers for qRT-PCR.

Author Contributions

Conceptualization, J.C. and X.Z.; methodology, J.C. and W.W.; software, J.C.; validation, J.C.; formal analysis, J.C.; investigation, J.C.; resources, H.H. and X.Z.; data curation, J.C.; writing—original draft preparation, J.C.; writing—review and editing, W.W., H.H. and X.Z.; visualization, W.W.; supervision, H.Z.; project administration, X.Z. and H.Z.; funding acquisition, W.W. and X.Z. All authors have read and agreed to the published version of the manuscript.

Funding

This research was financially supported by the National Key R&D Program of China: 2019YFA0904300 (2019YFA0904302) and the National Natural Science Foundation of China: 32070051.

Institutional Review Board Statement

Not applicable.

Informed Consent Statement

Not applicable.

Data Availability Statement

Not applicable.

Conflicts of Interest

The authors declare no conflict of interest.

References

  1. Chandler, D.; Bailey, A.S.; Tatchell, G.M.; Davidson, G.; Greaves, J.; Grant, W.P. The development, regulation and use of biopesticides for integrated pest management. Philos. Trans. R. Soc. Lond. B Biol. Sci. 2011, 366, 1987–1998. [Google Scholar] [CrossRef] [PubMed]
  2. Morán-Diez, M.E.; Glare, T.R. What are Microbial-based Biopesticides? Methods Mol. Biol. 2016, 1477, 1–10. [Google Scholar] [CrossRef] [PubMed]
  3. Dietrich, L.E.; Price-Whelan, A.; Petersen, A.; Whiteley, M.; Newman, D.K. The phenazine pyocyanin is a terminal signalling factor in the quorum sensing network of Pseudomonas aeruginosa. Mol. Microbiol. 2006, 61, 1308–1321. [Google Scholar] [CrossRef] [PubMed]
  4. Mavrodi, D.V.; Parejko, J.A.; Mavrodi, O.V.; Kwak, Y.S.; Weller, D.M.; Blankenfeldt, W.; Thomashow, L.S. Recent insights into the diversity, frequency and ecological roles of phenazines in fluorescent Pseudomonas spp. Environ. Microbiol. 2013, 15, 675–686. [Google Scholar] [CrossRef] [PubMed]
  5. Jin, K.; Zhou, L.; Jiang, H.; Sun, S.; Fang, Y.; Liu, J.; Zhang, X.; He, Y.W. Engineering the central biosynthetic and secondary metabolic pathways of Pseudomonas aeruginosa strain PA1201 to improve phenazine-1-carboxylic acid production. Metab. Eng. 2015, 32, 30–38. [Google Scholar] [CrossRef]
  6. Yuan, L.L.; Li, Y.Q.; Wang, Y.; Zhang, X.H.; Xu, Y.Q. Optimization of critical medium components using response surface methodology for phenazine-1-carboxylic acid production by Pseudomonas sp. M-18Q. J. Biosci. Bioeng. 2008, 105, 232–237. [Google Scholar] [CrossRef]
  7. Pierson, L.S., 3rd; Pierson, E.A. Metabolism and function of phenazines in bacteria: Impacts on the behavior of bacteria in the environment and biotechnological processes. Appl. Microbiol. Biotechnol. 2010, 86, 1659–1670. [Google Scholar] [CrossRef] [Green Version]
  8. Chin-A-Woeng, T.F.; Thomas-Oates, J.E.; Lugtenberg, B.J.; Bloemberg, G.V. Introduction of the phzH gene of Pseudomonas chlororaphis PCL1391 extends the range of biocontrol ability of phenazine-1-carboxylic acid-producing Pseudomonas spp. strains. Mol. Plant-Microbe Interact. 2001, 14, 1006–1015. [Google Scholar] [CrossRef] [Green Version]
  9. Zhou, L.; Jiang, H.X.; Sun, S.; Yang, D.D.; Jin, K.M.; Zhang, W.; He, Y.W. Biotechnological potential of a rhizosphere Pseudomonas aeruginosa strain producing phenazine-1-carboxylic acid and phenazine-1-carboxamide. World J. Microbiol. Biotechnol. 2016, 32, 50. [Google Scholar] [CrossRef]
  10. Chin-A-Woeng, T.F.; Bloemberg, G.V.; Mulders, I.H.; Dekkers, L.C.; Lugtenberg, B.J. Root colonization by phenazine-1-carboxamide-producing bacterium Pseudomonas chlororaphis PCL1391 is essential for biocontrol of tomato foot and root rot. Mol. Plant-Microbe Interact. 2000, 13, 1340–1345. [Google Scholar] [CrossRef] [Green Version]
  11. Shanmugaiah, V.; Mathivanan, N.; Varghese, B. Purification, crystal structure and antimicrobial activity of phenazine-1-carboxamide produced by a growth-promoting biocontrol bacterium, Pseudomonas aeruginosa MML2212. J. Appl. Microbiol. 2010, 108, 703–711. [Google Scholar] [CrossRef] [PubMed]
  12. Li, L.; Li, Z.; Yao, W.; Zhang, X.; Wang, R.; Li, P.; Yang, K.; Wang, T.; Liu, K. Metabolic Engineering of Pseudomonas chlororaphis Qlu-1 for the enhanced production of phenazine-1-carboxamide. J. Agric. Food Chem. 2020, 68, 14832–14840. [Google Scholar] [CrossRef] [PubMed]
  13. Yao, R.; Pan, K.; Peng, H.; Feng, L.; Hu, H.; Zhang, X. Engineering and systems-level analysis of Pseudomonas chlororaphis for production of phenazine-1-carboxamide using glycerol as the cost-effective carbon source. Biotechnol. Biofuels 2018, 11, 130. [Google Scholar] [CrossRef] [PubMed]
  14. Chin-A-Woeng, T.F.; van den Broek, D.; Lugtenberg, B.J.; Bloemberg, G.V. The Pseudomonas chlororaphis PCL1391 sigma regulator psrA represses the production of the antifungal metabolite phenazine-1-carboxamide. Mol. Plant-Microbe Interact. 2005, 18, 244–253. [Google Scholar] [CrossRef]
  15. Jin, Z.J.; Zhou, L.; Sun, S.; Cui, Y.; Song, K.; Zhang, X.; He, Y.W. Identification of a strong quorum sensing- and thermo-regulated promoter for the biosynthesis of a new metabolite pesticide phenazine-1-carboxamide in Pseudomonas strain PA1201. ACS Synth. Biol. 2020, 9, 1802–1812. [Google Scholar] [CrossRef]
  16. Van Rij, E.T.; Wesselink, M.; Chin-A-Woeng, T.F.; Bloemberg, G.V.; Lugtenberg, B.J. Influence of environmental conditions on the production of phenazine-1-carboxamide by Pseudomonas chlororaphis PCL1391. Mol. Plant-Microbe Interact. 2004, 17, 557–566. [Google Scholar] [CrossRef] [Green Version]
  17. Peng, H.; Ouyang, Y.; Bilal, M.; Wang, W.; Hu, H.; Zhang, X. Identification, synthesis and regulatory function of the N-acylated homoserine lactone signals produced by Pseudomonas chlororaphis HT66. Microb. Cell Fact. 2018, 17, 9. [Google Scholar] [CrossRef] [Green Version]
  18. Chen, Y.; Shen, X.; Peng, H.; Hu, H.; Wang, W.; Zhang, X. Comparative genomic analysis and phenazine production of Pseudomonas chlororaphis, a plant growth-promoting rhizobacterium. Genom. Data 2015, 4, 33–42. [Google Scholar] [CrossRef] [Green Version]
  19. Li, H.L.; Deng, R.X.; Wang, W.; Liu, K.Q.; Hu, H.B.; Huang, X.Q.; Zhang, X.H. Biosynthesis and characterization of medium-chain-length polyhydroxyalkanoate with an enriched 3-Hydroxydodecanoate monomer from a Pseudomonas chlororaphis cell factory. J. Agric. Food Chem. 2021, 69, 3895–3903. [Google Scholar] [CrossRef]
  20. Jin, X.J.; Peng, H.S.; Hu, H.B.; Huang, X.Q.; Wang, W.; Zhang, X.H. iTRAQ-based quantitative proteomic analysis reveals potential factors associated with the enhancement of phenazine-1-carboxamide production in Pseudomonas chlororaphis P3. Sci. Rep. 2016, 6, 27393. [Google Scholar] [CrossRef] [PubMed] [Green Version]
  21. Livak, K.J.; Schmittgen, T.D. Analysis of relative gene expression data using real-time quantitative PCR and the 2(-Delta Delta C(T)) Method. Methods 2001, 25, 402–408. [Google Scholar] [CrossRef] [PubMed]
  22. Li, Q.A.; Mavrodi, D.V.; Thomashow, L.S.; Roessle, M.; Blankenfeldt, W. Ligand binding induces an ammonia channel in 2-amino-2-desoxyisochorismate (ADIC) synthase PhzE. J. Biol. Chem. 2011, 286, 18213–18221. [Google Scholar] [CrossRef] [PubMed] [Green Version]
  23. Liu, W.H.; Yue, S.J.; Feng, T.T.; Li, S.; Huang, P.; Hu, H.B.; Wang, W.; Zhang, X.H. Characterization and engineering of Pseudomonas chlororaphis LX24 with high production of 2-Hydroxyphenazine. J. Agric. Food Chem. 2021, 69, 4778–4784. [Google Scholar] [CrossRef] [PubMed]
  24. Wang, D.; Lee, S.H.; Seeve, C.; Yu, J.M.; Pierson, L.S., 3rd; Pierson, E.A. Roles of the Gac-Rsm pathway in the regulation of phenazine biosynthesis in Pseudomonas chlororaphis 30-84. Microbiologyopen 2013, 2, 505–524. [Google Scholar] [CrossRef] [PubMed]
  25. Tran, K.T.; Maeda, T.; Wood, T.K. Metabolic engineering of Escherichia coli to enhance hydrogen production from glycerol. Appl. Microbiol. Biotechnol. 2014, 98, 4757–4770. [Google Scholar] [CrossRef] [PubMed]
  26. Kohlstaedt, M.; Buschmann, S.; Langer, J.D.; Xie, H.; Michel, H. Subunit CcoQ is involved in the assembly of the Cbb3-type cytochrome c oxidases from Pseudomonas stutzeri ZoBell but not required for their activity. Biochim. Biophys. Acta Bioenerg. 2017, 1858, 231–238. [Google Scholar] [CrossRef]
  27. Melin, F.; Xie, H.; Meyer, T.; Ahn, Y.O.; Gennis, R.B.; Michel, H.; Hellwig, P. The unusual redox properties of C-type oxidases. Biochim. Biophys. Acta 2016, 1857, 1892–1899. [Google Scholar] [CrossRef]
  28. Peng, H.; Zhang, P.; Bilal, M.; Wang, W.; Hu, H.; Zhang, X. Enhanced biosynthesis of phenazine-1-carboxamide by engineered Pseudomonas chlororaphis HT66. Microb. Cell Fact. 2018, 17, 117. [Google Scholar] [CrossRef]
  29. Moreno-Avitia, F.; Utrilla, J.; Bolívar, F.; Nogales, J.; Escalante, A. Metabolic reconstruction of Pseudomonas chlororaphis ATCC 9446 to understand its metabolic potential as a phenazine-1-carboxamide-producing strain. Appl. Microbiol. Biotechnol. 2020, 104, 10119–10132. [Google Scholar] [CrossRef]
  30. Cotter, P.D.; Gahan, C.G.; Hill, C. A glutamate decarboxylase system protects Listeria monocytogenes in gastric fluid. Mol. Microbiol. 2001, 40, 465–475. [Google Scholar] [CrossRef]
  31. Jiang, J.; Sun, Y.F.; Tang, X.; He, C.N.; Shao, Y.L.; Tang, Y.J.; Zhou, W.W. Alkaline pH shock enhanced production of validamycin A in fermentation of Streptomyces hygroscopicus. Bioresour. Technol. 2018, 249, 234–240. [Google Scholar] [CrossRef] [PubMed]
  32. Lee, J.; Lee, S.Y.; Park, S.; Middelberg, A.P. Control of fed-batch fermentations. Biotechnol. Adv. 1999, 17, 29–48. [Google Scholar] [CrossRef]
  33. Qu, L.; Ren, L.J.; Sun, G.N.; Ji, X.J.; Nie, Z.K.; Huang, H. Batch, fed-batch and repeated fed-batch fermentation processes of the marine thraustochytrid Schizochytrium sp. for producing docosahexaenoic acid. Bioprocess. Biosyst. Eng. 2013, 36, 1905–1912. [Google Scholar] [CrossRef] [PubMed]
Figure 1. Influence of different nitrogen sources on PCN production.
Fermentation 08 00188 g001
Figure 2. Cell growth (a) and PCN production (b) during cultivation at pH 6.7, 7.2, 7.7. The symbol “*” represents statistical significance at 0.01 < p < 0.05, the symbol “**” represents differences at p < 0.01.
Fermentation 08 00188 g002
Figure 3. Fold change of the transcription level of genes before and after optimization of pH. The symbol “*” represents statistical significance at p < 0.05.
Fermentation 08 00188 g003
Figure 4. The changes in relative abundance of 3-oxo-C14-HSL (a), 3-OH-C10-HSL (b), 3-OH-C8-HSL (c) and C6-HSL (d) before and after optimization of pH. The symbol “*” represents statistical significance at p < 0.05.
Fermentation 08 00188 g004
Figure 5. Influence of glycerol feeding speed on cell growth (a) and PCN production (b) in 1 L bioreactor. Red solid circles represent not feeding glycerol during fermentation; orange hollow squares, green solid triangles, black hollow diamonds, purple hollow triangles and blue solid diamonds represent feeding glycerol at the speed of 1 g/h, 2 g/h, 3 g/h, 4 g/h and 5 g/h after 24 h of fermentation, respectively.
Fermentation 08 00188 g005
Figure 6. Influence of glycerol feeding speed on cell growth (a), PCN production (b) and PCN productivity (c) when the initial glycerol concentration was 18 g/L in 1 L bioreactor. Green solid squares represent not feeding glycerol during fermentation; orange solid triangles and blue hollow diamonds represent feeding glycerol at the speed of 1 g/h and 2 g/h after 17 h of fermentation, respectively.
Fermentation 08 00188 g006
Figure 7. The growth profiles (a) and PCN production (b) of H5△fleQrelA under different conditions in 1 L bioreactor and 30 L bioreactor. The red hollow triangles and red bar represent using the optimal medium as the fermentation medium and not feeding glycerol during fermentation in 1 L bioreactor; the green solid triangles and green bar represent using the optimal medium as the fermentation medium and not feeding glycerol during fermentation in 30 L bioreactor; the blue solid circles and blue bar represent feeding glycerol at the speed of 1 g/h after fermentation for 17 h when the initial glycerol concentration was 18 g/L in 1 L bioreactor; the purple hollow circles and purple bar represent feeding glycerol at the speed of 1 g/h after fermentation for 17 h when the initial glycerol concentration was 18 g/L in 30 L bioreactor.
Fermentation 08 00188 g007
Table 1. The Plackett-Burman design with PCN production as a response.
RunX1 Glycerol (g/L)X2 Soy Peptone (g/L)X3 Soybean Cake (g/L)X4 MgSO4 (g/L)X5 K2HPO4 (g/L)PCN Production (g/L)
120202000.64.24
2401020004.04
3201010002.88
4202010003.85
52010200.30.63.17
640101000.62.15
72020200.304.66
84020100.30.63.52
940202000.64.34
104020100.304.20
114010200.303.97
122010100.30.62.16
Table 2. Analysis of variables for the Plackett-Burman design.
ParameterEffectCoefficientStandard ErrorT Valuep Value
Constant 3.58940.039591.2030.00000
X1-Glycerol0.20850.10430.03952.6420.03842
X2-Soy peptone1.07580.53790.039513.6330.00001
X3-Soybean cake0.94060.47030.039511.9200.00002
X4-MgSO40.03100.01550.03950.3930.70767
X5-K2HPO4−0.6710−0.33550.0395−8.5030.00015
R2 = 98.55%, R2 (adjust) = 97.34%, R2 (predicted) = 94.19%.
Table 3. The experimental design and corresponding results of the path of steepest ascent experiment.
RunX1 Glycerol (g/L)X2 Soy Peptone (g/L)X3 Soybean Cake (g/L)PCN Production (g/L)
130.015.015.04.28
232.521.520.64.45
335.027.926.34.30
437.534.331.94.71
540.040.837.55.27
642.547.243.24.23
745.053.748.83.27
Table 4. The experimental design and corresponding results of the central composite design.
RunX1 Glycerol (g/L)X2 Soy Peptone (g/L)X3 Soybean Cake (g/L)PCN Production (g/L)
ActualPredicted
13732.829.55.37 5.37
24332.829.55.22 5.27
33748.829.54.65 4.45
44348.829.53.98 3.98
53732.845.55.56 5.60
64332.845.55.46 5.51
73748.845.54.64 4.69
84348.845.54.30 4.21
93540.837.55.20 5.24
104540.837.54.78 4.76
114027.337.55.31 5.20
124054.337.53.22 3.34
134040.8245.20 5.27
144040.8515.70 5.66
154040.837.55.38 5.37
164040.837.55.34 5.37
174040.837.55.42 5.37
184040.837.55.40 5.37
194040.837.55.41 5.37
204040.837.55.30 5.37
Table 5. Analysis of variance for the central composite design model.
SourceDegrees of FreedomSum of SquaresMean SquareF Valuep Value
Model97.12570.7917596.49<0.0001
X1-Glycerol10.278170.2781733.900.0002
X2-Soy peptone14.179774.17977509.41<0.0001
X3-Soybean cake10.185010.1850122.550.0008
X1X110.142190.2459629.980.0003
X2X212.234392.17653265.27<0.0001
X3X310.014830.014831.810.2085
X1X210.070860.070868.640.0148
X1X310.018910.018912.310.1599
X2X310.001570.001570.190.6712
Residual100.082050.00821
Lack of fit50.070860.014176.330.032
Pure error50.011190.00224
Total197.20777
R2 = 98.86%, R2 (adjust) = 97.84%, R2 (predict) = 92.08%.
Publisher’s Note: MDPI stays neutral with regard to jurisdictional claims in published maps and institutional affiliations.

