Article

Wineinformatics: Comparing and Combining SVM Models Built by Wine Reviews from Robert Parker and Wine Spectator for 95 + Point Wine Prediction

Department of Computer Science and Engineering, University of Central Arkansas, Conway, AR 72034, USA
*
Author to whom correspondence should be addressed.
Fermentation 2022, 8(4), 164; https://doi.org/10.3390/fermentation8040164
Submission received: 3 March 2022 / Revised: 28 March 2022 / Accepted: 29 March 2022 / Published: 4 April 2022
(This article belongs to the Section Fermentation for Food and Beverages)

Abstract

:
Wineinformatics is among the new fields in data science that use wine as domain knowledge. To process large amounts of wine review data in human language format, the computational wine wheel is applied. In previous research, the computational wine wheel was created and applied to different datasets of wine reviews developed by Wine Spectator. The goal of this research is to explore the development and application of the computational wine wheel to reviews from a different reviewer, Robert Parker. For comparison, this research collects 513 elite Bordeaux wines that were reviewed by both Robert Parker and Wine Spectator. The full power of the computational wine wheel is utilized, including NORMALIZED, CATEGORY, and SUBCATEGORY attributes. The datasets are then used to predict whether the wine is a classic wine (95 + scores) or not (94 − scores) using the black-box classification algorithm support vector machine. The Wine Spectator’s dataset, with a combination of NORMALIZED, CATEGORY, and SUBCATEGORY attributes, achieves the best accuracy of 76.02%. Robert Parker’s dataset also achieves an accuracy of 75.63% out of all the attribute combinations, which demonstrates the usefulness of the computational wine wheel and that it can be effectively adopted in different wine reviewers’ systems. This paper also attempts to build a classification model using both Robert Parker’s and Wine Spectator’s reviews, resulting in comparable prediction power.

1. Introduction

In everyday life, humans notice data and associate them with memories or ideas in their heads. There are 2.5 quintillion bytes of data created each day, which is why finding a way to understand a mass amount of data is so important. Since there are so many complex phenomena, data science is a field of study used to obtain a sense of the large mass of data that humans process. Data science uses scientific methods, processes, algorithms, and systems to extract knowledge and insights from data that might be unstructured. One of the most important factors in data science research is the application domain, which defines the scope of knowledge that can be mined. In this research, wine served as the application domain.
Wine production as an ancient technology has a history more than thousands of years old. Over the years, humans’ passion for winemaking has only grown. According to the global wine production statistics maintained by the International Organization of Vine and Wine (OIV), more than 260 million hectoliters of wine was produced worldwide in 2020 [1]. Wine is produced by the fermentation of yeast, which involves the conversion of sugar to alcohol [2]. There are four traditional steps involved in ancient winemaking: picking the grapes, processing, fermentation, and aging the wine [3]. Subtle differences in each step can affect the taste, the smell, and all of the other qualities of wine. Hence, it has always been important to improve the level of winemaking in order to produce the desired quality of wine. The comments of professional sommeliers are among the valuable references. Some of the most influential wine experts in the world today, including Robert Parker and Jeb Dunnuck, and some of the influential wine magazines, including Wine Spectator and Wine Enthusiast, are producing unquantifiable reviews and rankings. Among all experts, Robert Parker, who developed a 100-point evaluation system to review wines, is one of the most influential wine critics according to the number of readers he has and the number of books and wine reviews he has wrote. Because of the innumerable wine reviews and the final evaluation score, using data science techniques might be the best choice to transfer wine reviews into usable knowledge.
Wineinformatics is a new data science method that uses wine as domain knowledge, and it incorporates data science and wine-related datasets, including physicochemical laboratory data and wine reviews [4]. Physicochemical laboratory data [5] are usually generated by carrying out physicochemical component analysis of a small group of wines [6,7,8,9,10], while a wine review dataset contains the human sensory perception of wine tasting by wine experts. In order to process and analyze the large amounts of human language format data from wine reviews, a technique named the computational wine wheel was developed to accurately capture keywords that appear in wine reviews [11].
The computational wine wheel was developed based on more than 1000 wine reviews from Wine Spectator [11]. After preprocessing using the computational wine wheel, datasets of Wine Spectator’s reviews were used in a variety of different topics [12,13], for example, to make predictions for three different targets, namely, price per 750mL bottles, quality based on a 100-point scale, and style derived from the region of origin [14]; to test if wine reviews can be used to predict whether a bottle of wine can be held for six years or more before it reaches the optimal conditions for drinking [15]; and to evaluate Wine Spectator and all of its major reviews using both white-box and black-box classification algorithms [16]. In this research, the computational wine wheel is applied to a carefully developed elite Bordeaux dataset, which contains more than 500 wines, with reviews from both Wine Spectator and Robert Parker.
Robert Parker’s wine reviews are described as “remarkably powerful contemporary rhetoric which has had an unprecedented impact in the world of prestigious wine for more than two decades” [17]; therefore, unlike Wine Spectator’s reviews, which are shorter and more precise, Robert parker’s reviews are more descriptive and colorful, and they provide greater challenges in natural language processing.
This paper aims to compare the SVM models built by wine reviews from Wine Spectator and Robert Parker in order to predict whether a wine receives 95 or more points. This paper also aims to combine reviews from both sources and build a model for the same prediction purpose. To the best of our knowledge, no other studies have applied natural language processing tools to Robert Parker’s reviews on this scale or compared them with those of other wine reviewers side by side. The questions of how different the computational wine wheel results from the completely new review dataset and how wine reviews from different sources can be compared (and merged) are expected to open up new avenues of research in Wineinformatics.

2. Methods and Materials
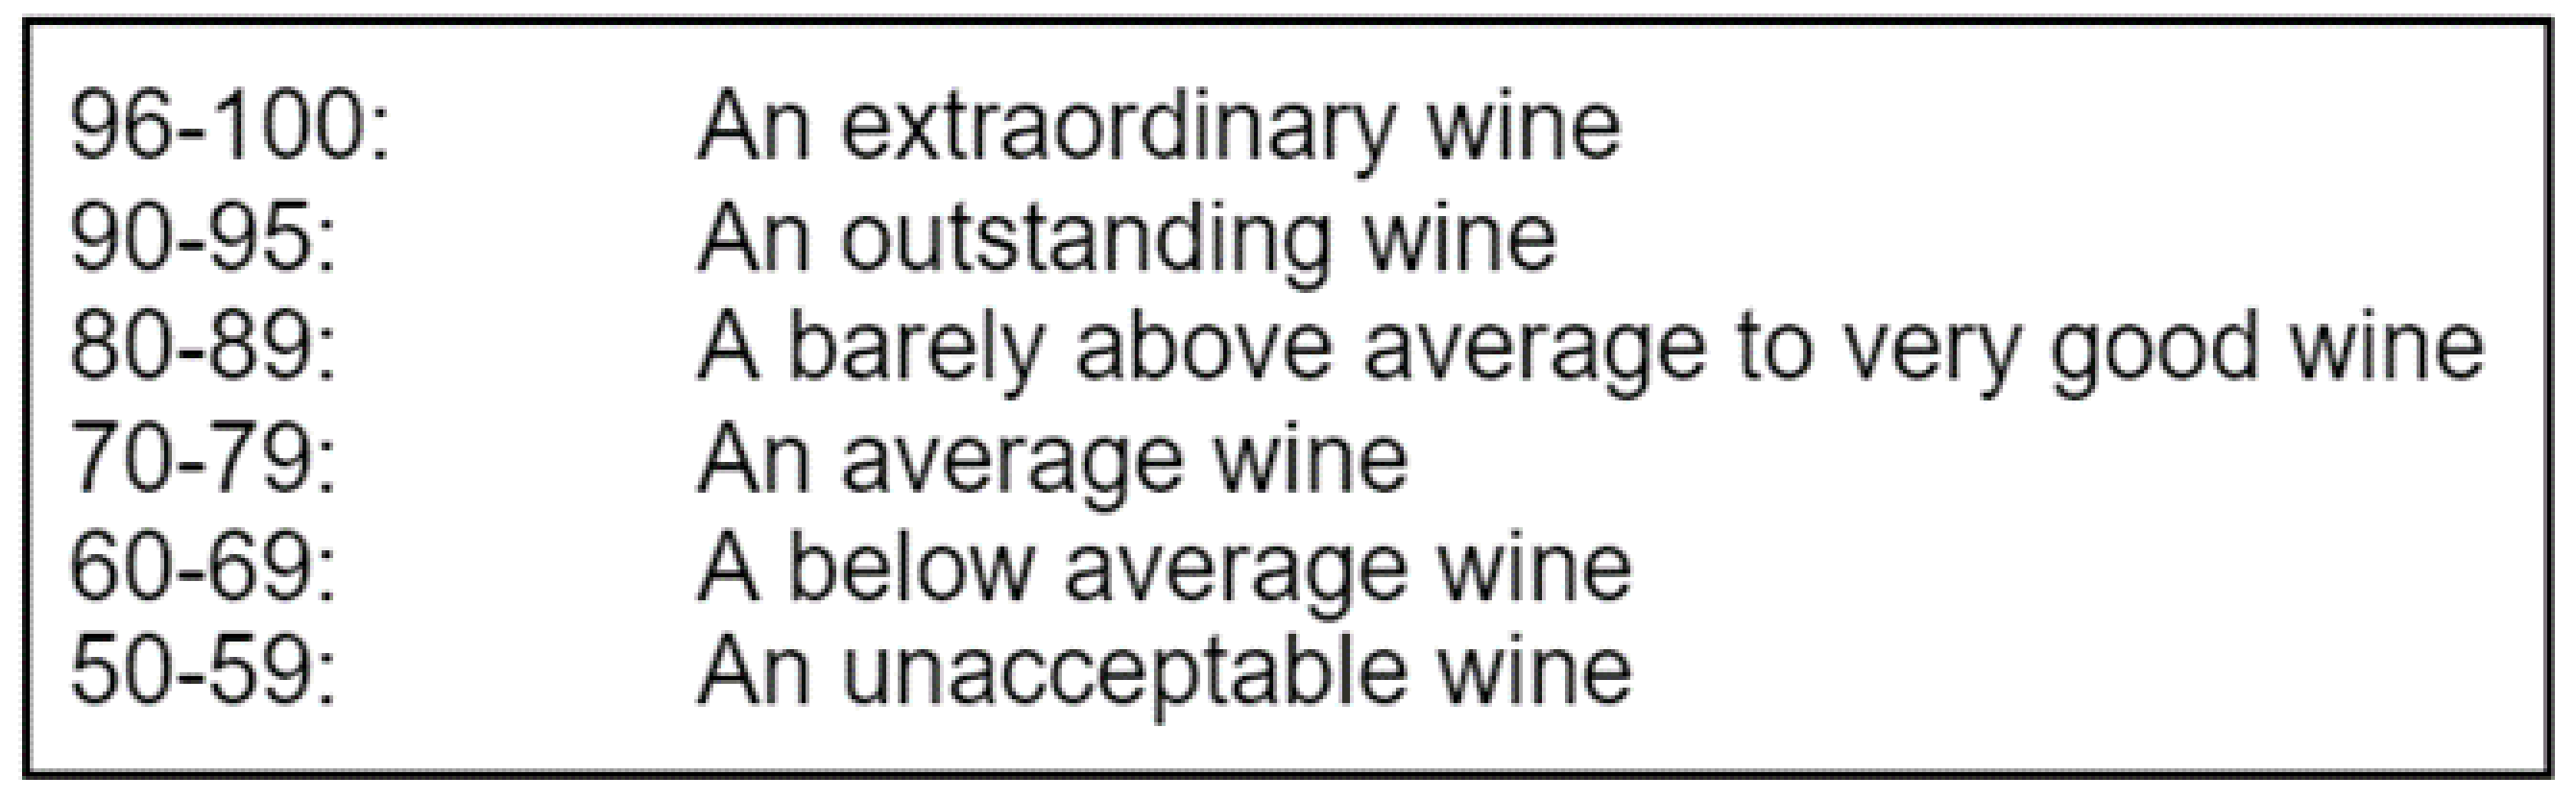
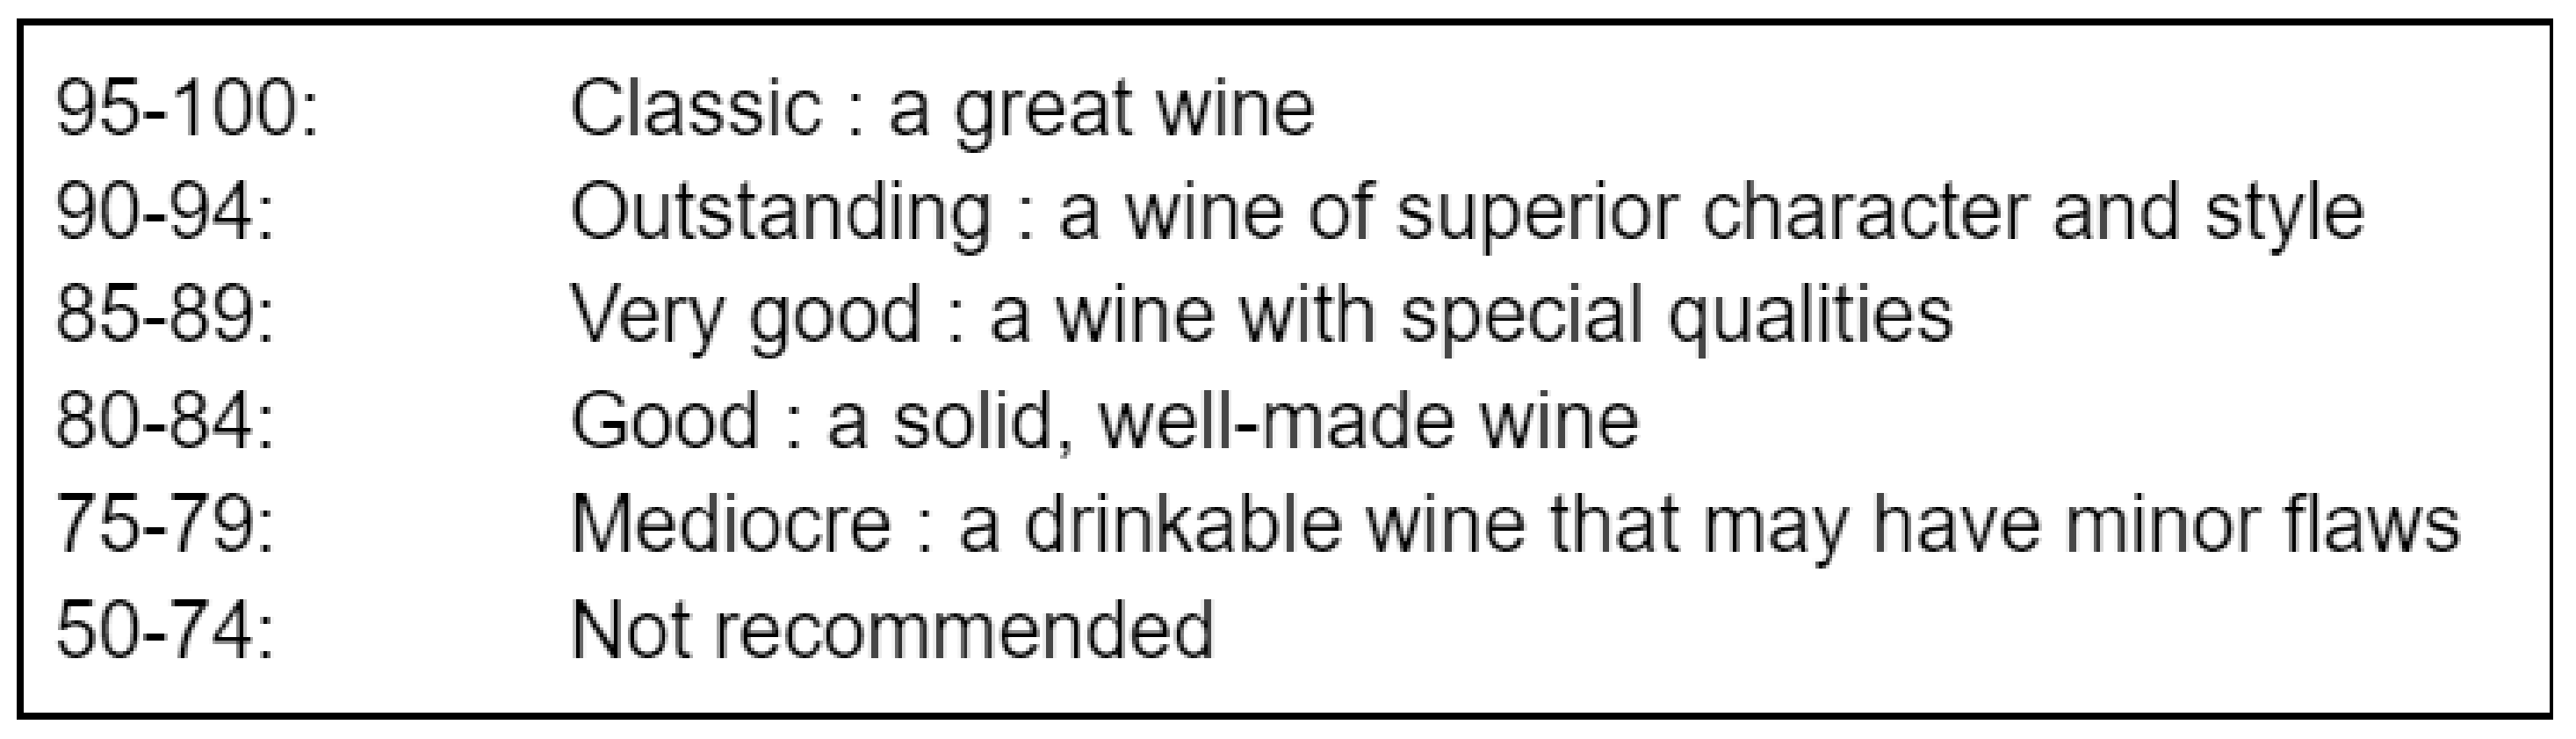
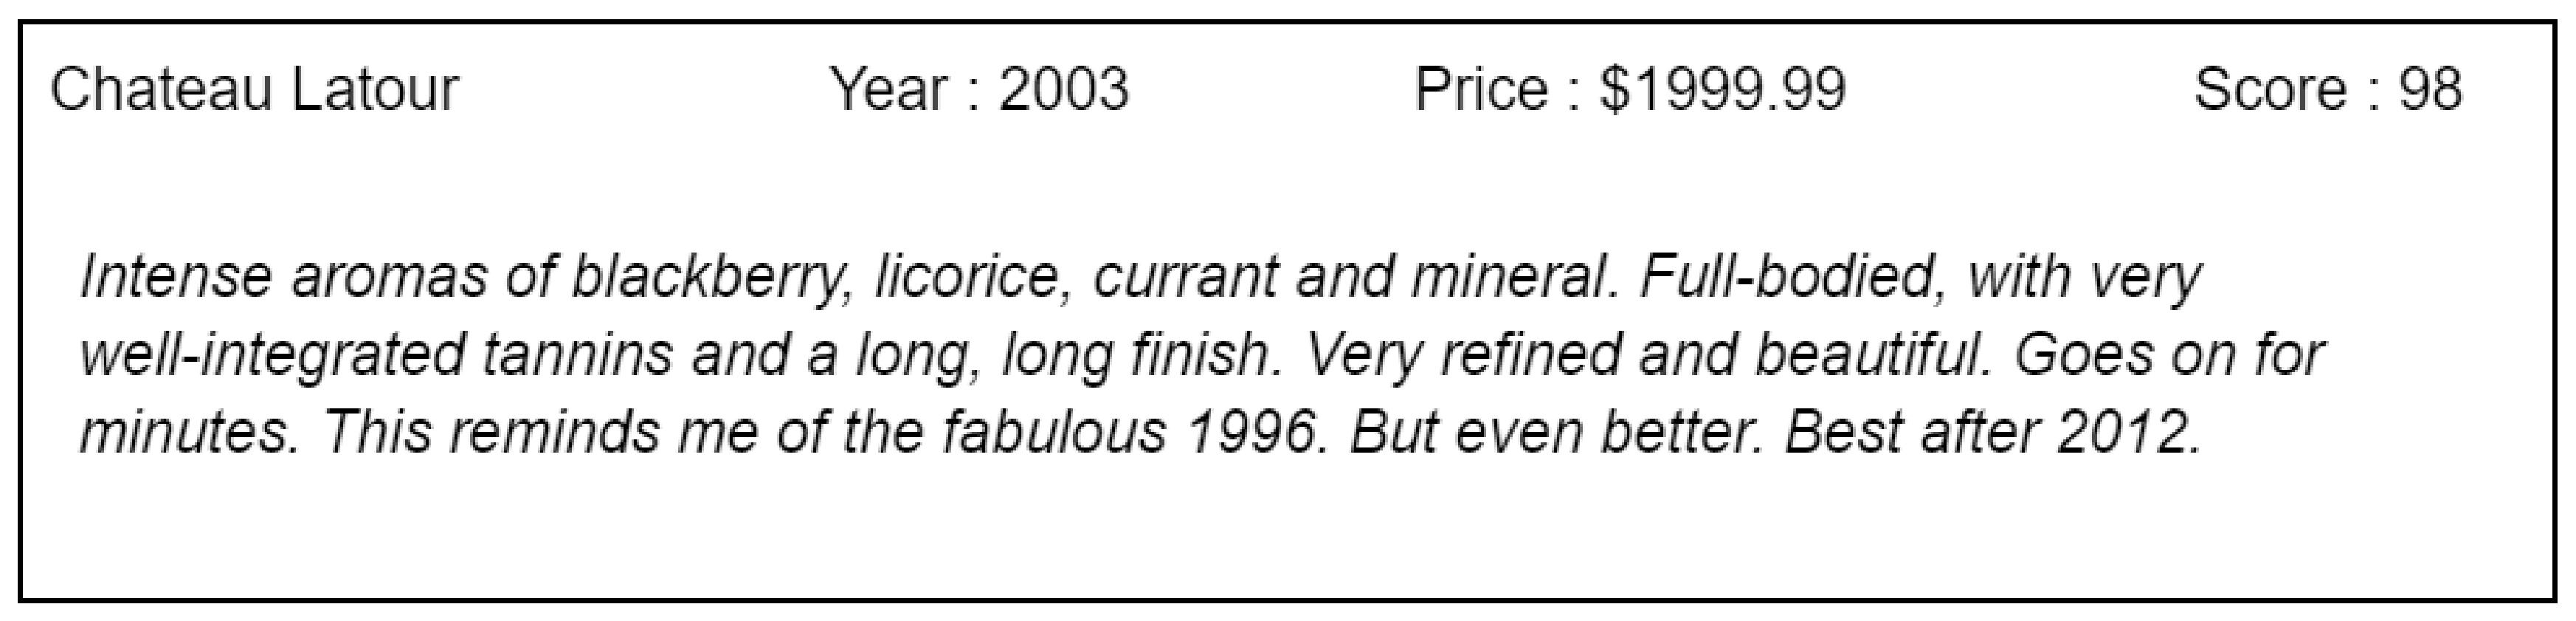
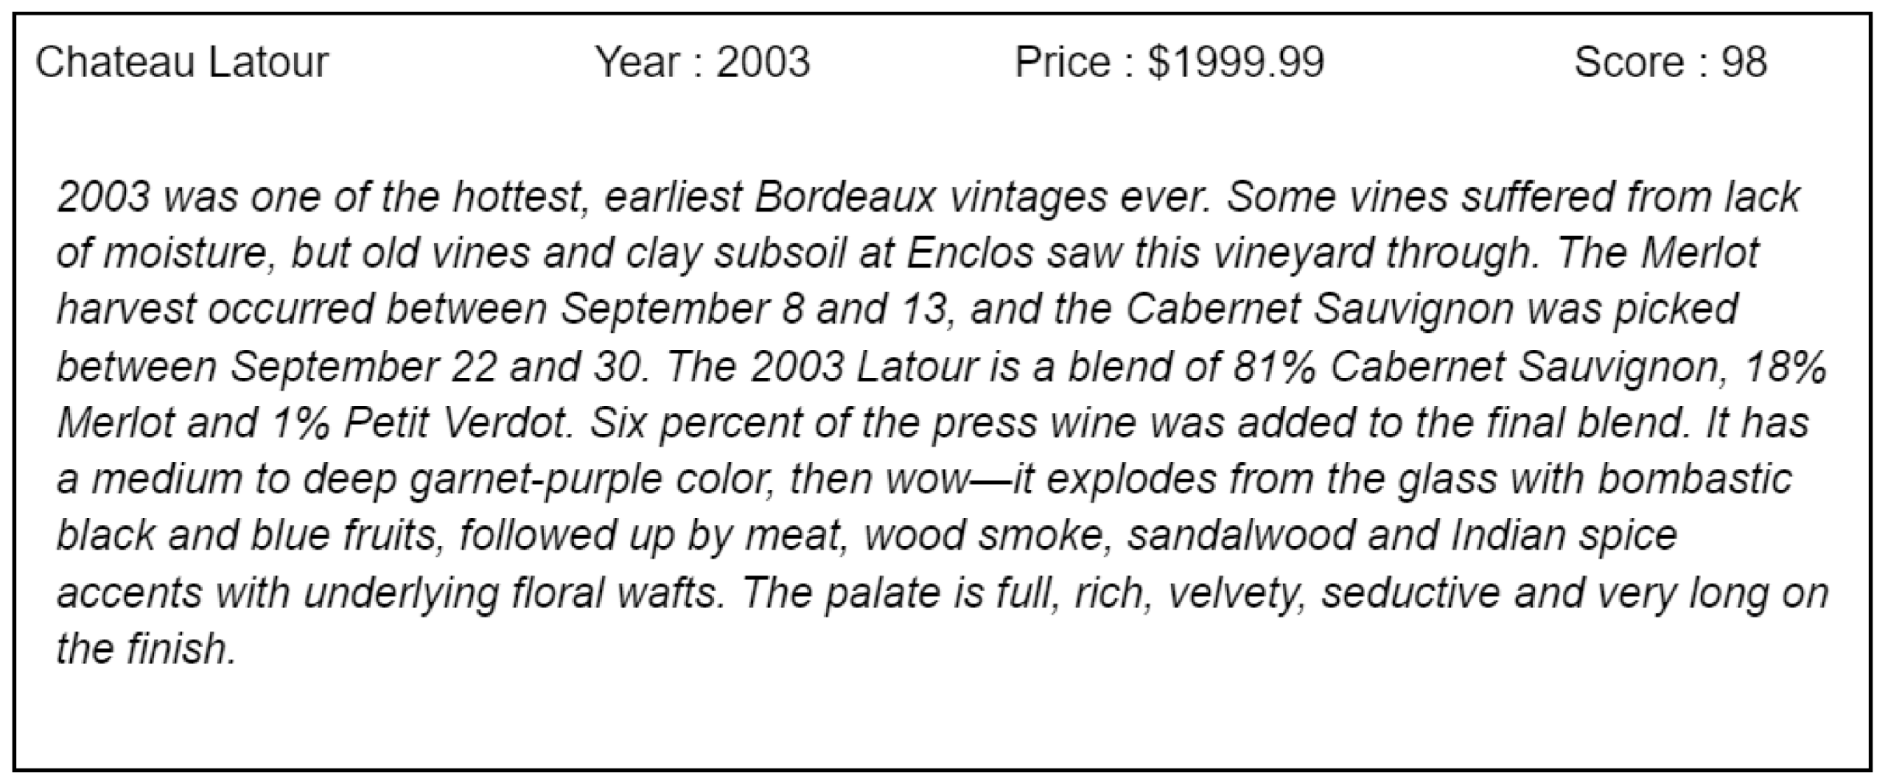
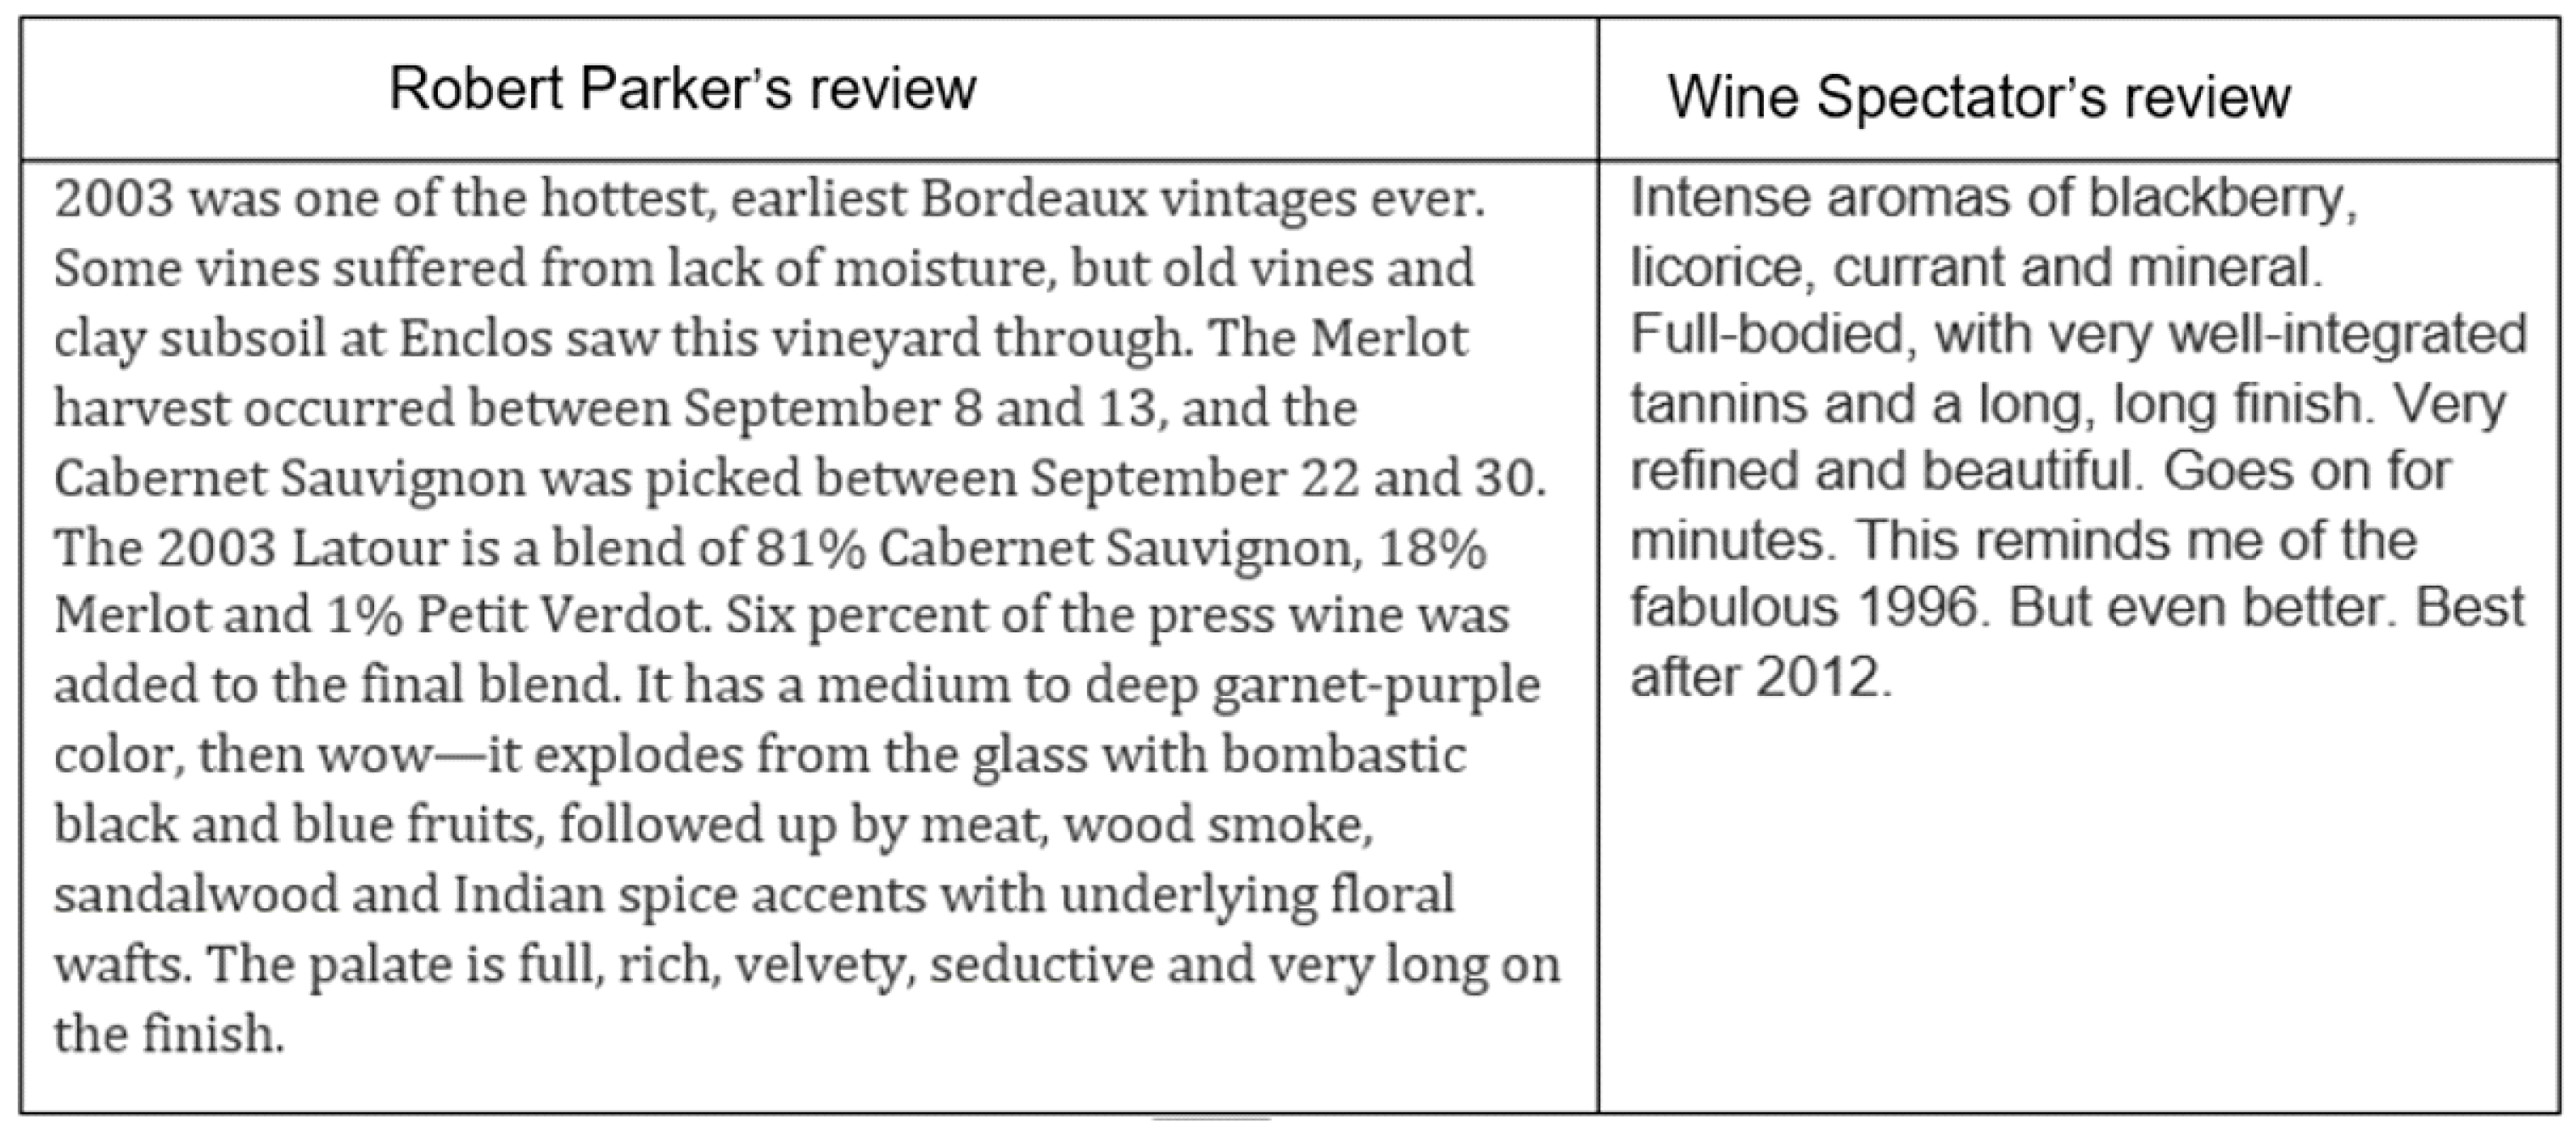
Data are the cornerstones of data science. The major factors of data include the source, the preprocessing, and the creation of the data [10]. In this paper, the source data are from the website wine.com, which is a wine e-commerce website that provides wine reviews from different sources for their products. Among all the trusted wine experts included on wine.com, we focus on Wine Spectator and Robert Parker in this research.

2.1. Wine Reviews

Wine Spectator is an American lifestyle magazine that focuses on wine and wine culture [18]. It has a significant influence on the culture of wine with its vast array of reviews [19], and it generates about 15,000 reviews each year. The magazine publishes 15 issues each year, and each issue includes 400–1000 wine reviews [18]. Based on the magazine’s policy, experts are required to conduct blind tasting in order to avoid bias [18]. Hence, Wine Spectator provides a trustworthy and effective source for data science projects. In our previous work, the datasets of all wines from 2006 to 2015 with 80 + scores [10] and the datasets of all Bordeaux wines from 2000 to 2016 [20] were collected from the reviews in Wine Spectator.
Robert Parker is a world-renowned wine critic. A high score from Robert Parker can rapidly grow a wine’s reputation, as well as its price [21]. He assigns grades to wines based on the aroma, taste, and all of the other characteristics on a scale of 50–100 [15]. Robert Parker’s 100-point rating system (Figure 1) is one of his most influential and controversial conceptions [22].
Robert Parker claims that “no scoring system is perfect, but a system that provides for flexibility in scores, if applied by the same taster without prejudice, can quantify different levels of wine quality and provide the reader with one professional’s judgement.” The 100-point scale system is widely imitated by American reviewers, such as Wine Spectator (Figure 2) [23].
The difference between the Wine Spectator’s and Robert Parker’s 100-point scales is the range setting. When we compare Figure 1 and Figure 2, the top tier wine range for Wine Spectator is 95–100 while that for Robert Parker is 96–100. They also differ in the range of 80–89; Wine Spectator separates this range into two ranges, while Robert Parker treats 80–89 as one range.
The reviews of Wine Spectator and Robert Parker also are quite different. Wine Spectator’s reviews tend to be a simpler and more formal expression, while Robert Parker’s reviews are much more descriptive and detailed. For example, Wine Spectator’s review of Chateau Latour of 2003 in Figure 3 has 39 words in total, while Robert Parker’s review of the same wine in Figure 4 has 125 words in total. In Figure 3, the review is mostly focused on describing the characteristics of the wine, such as “intense aromas, full-bodied”; in Figure 4, the review provides information regarding not only wine characteristics but also wine-related features, such as “some vines suffered from lack of moisture”. Wine Spectator’s review is more similar to a wine specification, while Robert Parker’s review is more similar to an encyclopedia.

2.2. 1855 Elite Bordeaux RP + WS Dataset

Bordeaux is one of the most famous wine-making regions in the world. Wines from Bordeaux are considered typical old-world style, and some of them have exceptional aging capabilities. In 1855, a list of wines was formed on the request of Emperor Napoleon III to be displayed for visitors from around the world. The wines were ranked in importance from first to fifth growths. Most of the wines listed in the Bordeaux Wine Official Classification of 1855 are still very popular today; therefore, most of these wines are constantly reviewed by wine critics. The data collected in this research are based on the Bordeaux Wine Official Classification of 1855. On wine.com, we searched for all wines listed in the 1855 Bordeaux Wine Official Classification that were produced in the 21st century (2000–2020), and we included the wine into the dataset set if the wine had reviews by both Robert Parker and Wine Spectator. As a result, the 1855 Elite Bordeaux RP + WS dataset contains 513 wines with a total of 1026 wine reviews.
The vintage, score, and the wine reviews of each wine were collected. The wine name and the production year were combined together as “wine name” in the dataset; for example, a Chateau Latour wine that was produced in 2003 was assigned as “Chateau Latour 2003”. The wine score was converted to the class label based on classification problems. Most previous Wineinformatics studies [10,16,24] targeted the classification problem regarding the prediction of whether a wine can receive 90 points or above; thus, if the wine received a score equal to or above 90 points out of 100, the label of the wine was marked as a positive (+) class. Otherwise, the label was marked as a negative (−) class. However, the wines collected in this research were elite Bordeaux wines, and 99.6% of them received more than 90 points. Therefore, the targeted classification problem in this work was whether an elite Bordeaux wine can receive 95 points or more; thus, if the wine received a score equal to or above 95 points out of 100, the label of the wine was marked as a positive (+) class. Otherwise, the label was marked as a negative (−) class. This 95-point cutting threshold is very unique in Wineinformatics research since less than 5% of wines receive this honor. If a 95-point cutting threshold was used in other studies, the dataset would create a very unbalanced situation, making a classification model very difficult to build [23]. Since this research targets “elite” Bordeaux, which includes Chateau Latour, Margaux, Lafite, Mouton, and Haut-Brion, this research may build a more balanced computational model to understand how to achieve “classic” wines. The wine reviews, which are in human language format, were processed by the computational wine wheel so that the computers could understand and process them.

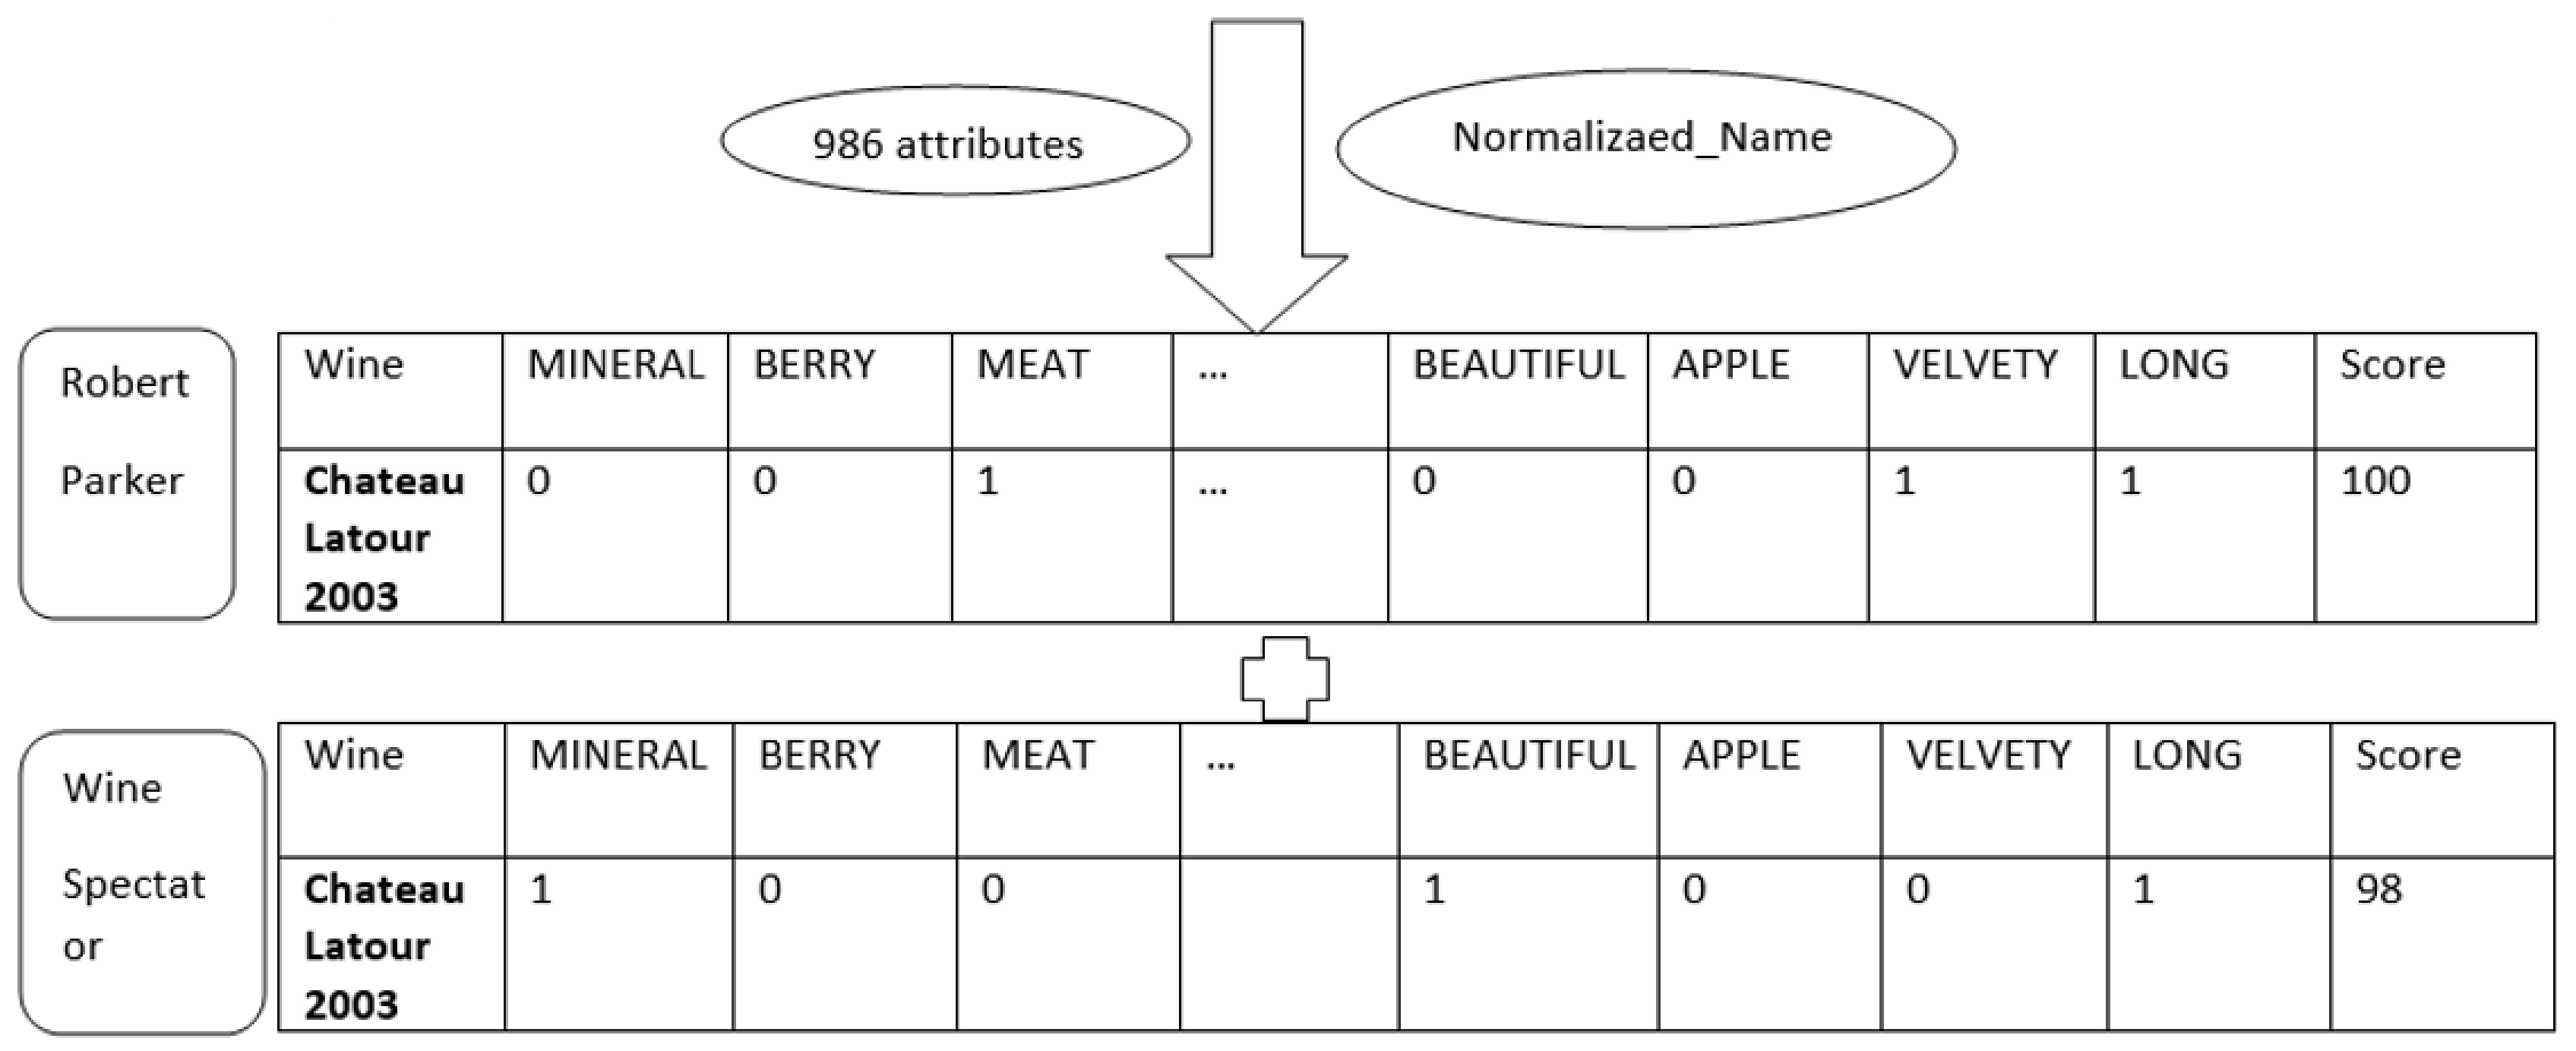
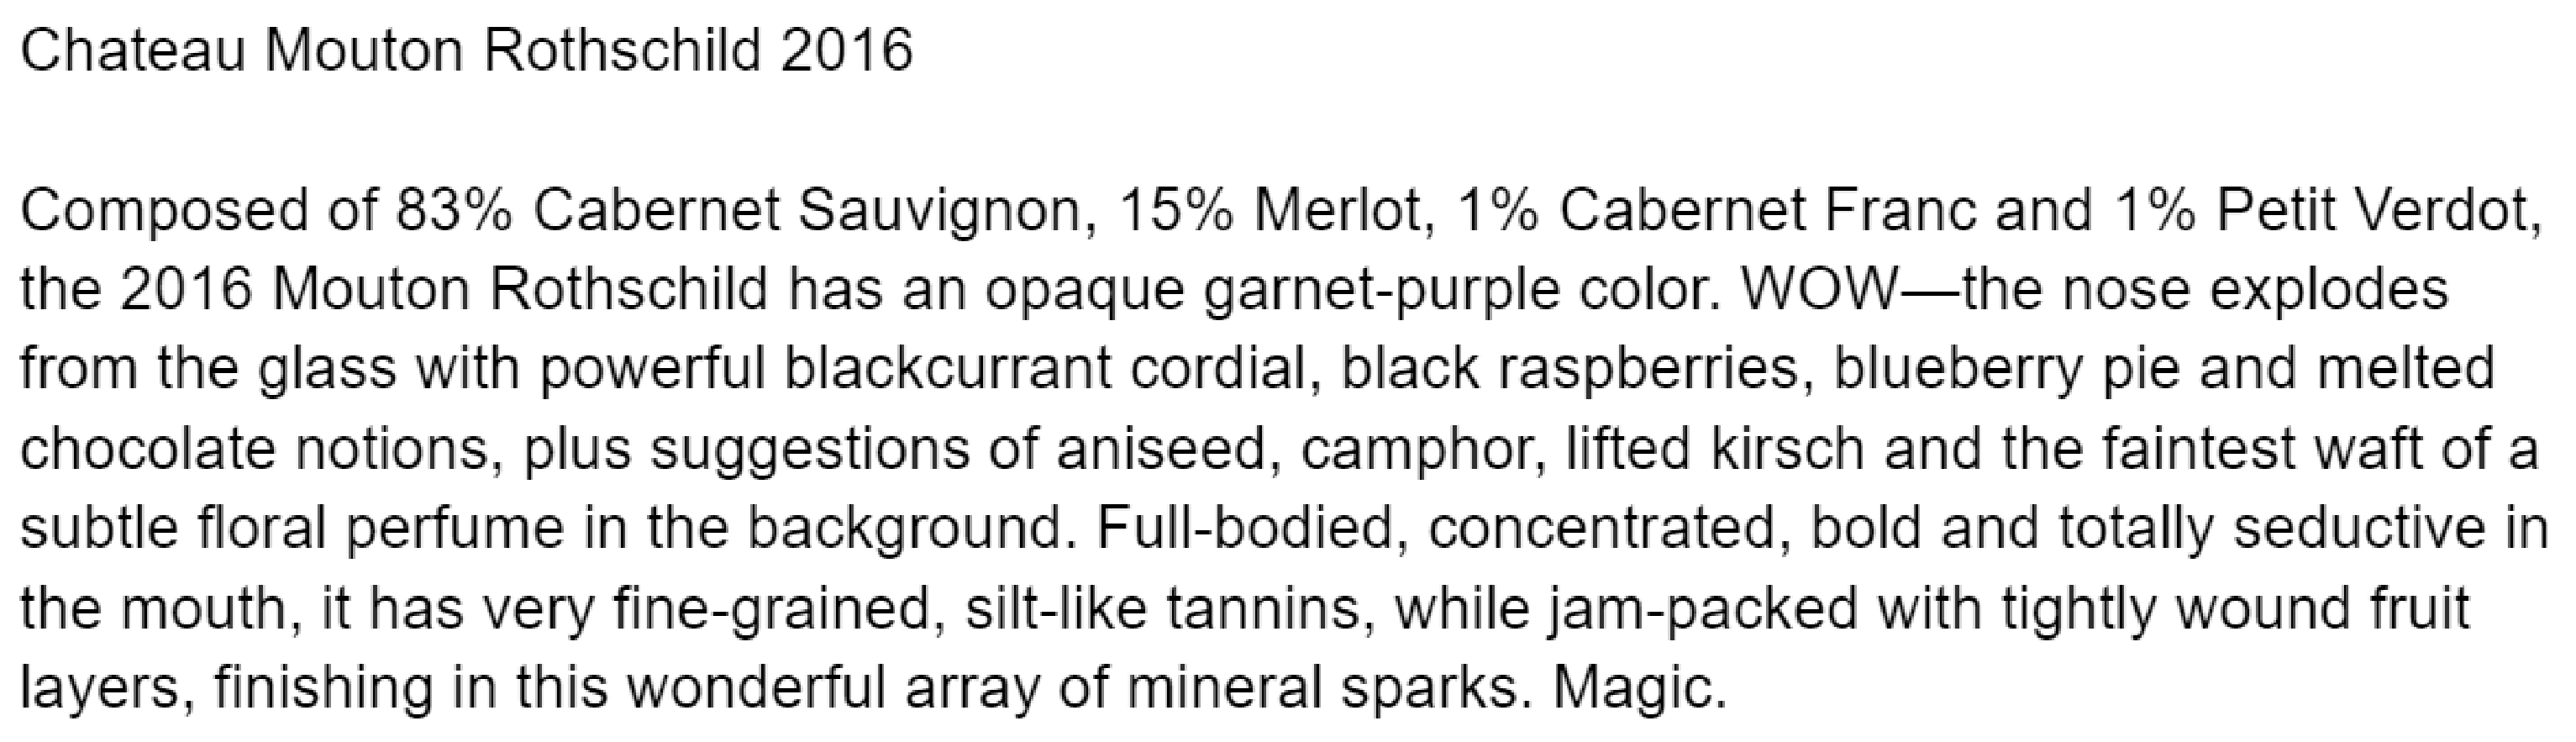
2.3. The Computational Wine Wheel

In order to be able to program computers to analyze and process huge amounts of natural language data, the computational wine wheel, a natural language processing [25] application, is used. The computational wine wheel is used to extract attributes from the descriptions of wine reviews [5]. The attributes include fruit flavors (berry, apple, etc.), the body of the wine (tannin, acidity, etc.), descriptive adjectives (balance, beautifully, etc.), etc.
The wheel uses multiple levels and branches to separate broad categories of attributes into more specific subcategories [12]. There are 14 “CATEGORY” attributes, 34 “SUBCATEGORY” attributes, 1932 “SPECIFIC_NAME” attributes, and 986 “NORMALIZED_NAME” attributes. The wheel works as a dictionary, one-hot encoding to convert words into vectors [24]. If the words in the wine review match the attributes under “SPECIFIC_NAME” in the wine wheel, the corresponding name under “NORMALIZED_NAME” is assigned 1; otherwise, it is assigned 0. The corresponding “SUBCATEGORY” and “CATEGORY” attributes are continuously implemented. The list of “SUBCATEGORY” and “CATEGORY” is included in the Supplementary Materials as Tables S1 and S2.
In Figure 5, there are two wine reviews: the left one is Robert Parker’s review, and the right one is Wine Spectator’s review. The first step is to extract the “SPECIFIC_NAME” attributes in the wine review and then assign the corresponding “NORMALIZED_NAME” attributes to 1. The lower portion of Figure 5 is the outcome of the first step. A total of 16 attributes were extracted from Robert Parker’s review, while a total of 14 attributes were extracted from Wine Spectator’s review.
The second and third steps are to count the corresponding “SUBCATEGORY” and “CATEGORY” attributes based on the first step where “NORMALIZED_NAME” attributes map to. These steps were developed to provide additional information other than the pure binary values given by “NORMALIZED_NAME” attributes [16]. The additional non-binary information gives data mining algorithms a better source to form clusters and classification models. As Figure 6 displays, in both Robert Parker’s and Wine Spectator’s reviews, the “SUBCATEGORY” attribute “flavor/descriptor” is assigned as 8, which means they both have 8 “NORMALIZED_NAME” attributes corresponding to the “flavor/descriptor” subcategory. Since there are 34 “SUBCATEGORY” attributes existing in the computational wine wheel, there were 34 corresponding non-binary attributes created in this step. The third step maps from “SUBCATEGORY” to “CATEGORY” with an additional 12 non-binary attributes. In Figure 7, the “CATEGORY” attribute “overall” for Robert Parker’s review was counted 10 times, and it was counted 11 times in Wine Spectator’s review.
While “NORMALIZED_NAME” is a purely binary dataset, the corresponding attributes under “SUBCATEGORY” and “CATEGORY” are continuous attributes. Applying the normalization algorithm to the continuous attributes can rescale their values to avoid an imbalanced weighting of features. Normalization can also help with understanding the data in an easier way, and it also helps computers to process more efficiently [26]. Min-Max Normalization [27] was used in this project to rescale the values of continuous attributes to 0–1. The formula is as follows:
z = x min x max x min x

2.4. Supervised Learning Algorithm: SVM

Supervised learning builds a model through a dataset that is labeled in order to make predictions. This research aimed to determine what attributes lead to a wine with a grade of 95 +, and the class label was set to 1 if the wine achieved 95 points or higher and 0 if the wine scored 94 points or below; this makes the classification problem a bi-class classification.
A support vector machine (SVM) is a classification method for both linear and non-linear data. It is a supervised learning model that analyzes data, and it is used for classification and regression analysis [28]. It uses nonlinear mapping to transform the original training data into a higher dimension, and this then allows the method to search for the linear optimal separating hyperplane or the decision boundary. This means that, if the mapping is correctly carried out, data from the two different classes can always be separated by the decision boundary. A support vector machine finds this decision boundary by using support vectors and margins. When we are creating a decision boundary, the space between the boundary and the points themselves (the margin) should be at its maximum [29]. For example, if we have data that are a collection of points, we can try to create a boundary or a physical line in the data to show the differences between the classes. There are several advantages to using SVM: the prediction accuracy is generally high, it is robust and works with many different types of data, and it can evaluate data very quickly.

2.5. Evaluation of the Classification Results

All experiments in this research were carried out with five-fold cross-validation [30,31]. Cross-validation is a statistical method used to estimate the skill of machine learning models. This means that the data were randomized or shuffled and then split into fifths. Once this split was carried out, we were able to create testing and training sets. The training set contained 80% of the data, and the testing set contained 20% of the data. This was then used with SVM to test the accuracy of our model on 20% of the training data. To evaluate five-fold validation, we used four different statistical measures: true positive (TP), false positive (FP), true negative (TN), and false negative (FN).
In this research, A true positive prediction means that the prediction of the model was correct, so the wine was predicted to be a classic wine, and it matched the actual value of the review as a classic wine. A false positive prediction means that the prediction of the model was incorrect, and it predicted that the wine was classic when it was not. A true negative value means that the model was correct and that it predicted that the wine was not a classic wine, and it matched the actual value of the review as not a classic wine. A false negative means that the model was incorrect once again, and it predicted that the wine was not a classic wine when it was actually a classic wine. This explains the image below, which shows a confusion matrix. Table 1 provides the meaning of the confusion matrix used in this paper.
To make the classification results easier to understand, there are four metrics of measurements that were used to evaluate them: accuracy, sensitivity, specificity, and precision.
Accuracy is the percentage of wines that were correctly classified across all the wines. Essentially, it tells us how many wines were correctly predicted as 95 + and 94 −.
A c u r r a c y = T P + T N T P + T N + F P + F N
Sensitivity is the proportion of the 95 + wines that were predicted correctly. This can tell us how well the model that we created could correctly predict wines that were 95 +.
S e n s i t i v i t y = T P T P + F N
Specificity is the complement to sensitivity, or the true negative rate, and summarizes how well the 94 − class was predicted.
S p e c i f i t y = T N F P + T N  
Precision is the number of wines that were predicted as 95 + and were correct. This helps us by telling us which wines were predicted as higher end, 95 +, and were actually 95 + in the review.
P r e c i s i o n = T P T P + F P

3. Results

3.1. CWW Conversion Rate

The attribute vocabulary of the computational wine wheel was collected from the reviews in Wine Spectator. To observe the application of the computational wine wheel to a new source, Robert Parker’s reviews, checking the efficiency of the attribute extraction is essential. This step was conducted to compare the differences between the attributes extracted from the CWW and by hand. Figure 7 shows a concrete example of a wine review of the 2016 Mouton Rothschild wine from Robert Parker used in the analysis.
The first step was to hand extract the attributes that would be important in determining the quality of the wine and list them as shown in Table 2 under the column “Hand-Extracted Attributes”. The second column named “Program-Extracted Attributes” in Figure 7 shows the attributes extracted by the program. The third column named “Common Attributes” displays the attributes extracted both by hand and by the program. The efficiency of the attribute extraction was examined to determine how many important attributes the program actually extracted. The hand-extracted attributes are the important attributes. Therefore, the extraction rate equals the total number of attributes extracted both by hand and by the program divided by the total number of hand-extracted attributes. As shown in Figure 7, the common attributes’ total is 20, divided by the hand-extracted attributes’ total of 26, so the extraction rate is 20/26 = 77%.
After applying the hand extraction process to all 513 of Robert Parker’s reviews, the average extraction rate was 73.33%, which means that about 27% of important key words were not extracted. For comparison purposes, 85 reviews from Wine Spectator were also processed using hand extraction and resulted in a high rate of 98%, which was expected since the CWW was created based on Wine Spectator reviews. The difference in hand extraction proves that Robert Parker has much more descriptive reviews, which fits the notion of how different the CWW applies to various reviews.

3.2. Prediction Results

The results of applying the SVM to the five-fold data are presented in this section. Since there are three different sets of attributes, namely, normalized values, category values, and subcategory values, the input data were prepared differently for four different experiments based on the methodology used in [16] to maximize the power of the computational wine wheel. The first experiment used wine reviews with only “NORMALIZED_NAME” attributes, resulting in a binary dataset with 985 attributes, which is similar to that used in most previous studies [10,11,12]. The second experiment used reviews with only “CATEGORY” attributes, resulting in a continuous dataset with 14 attributes. The third experiment used reviews with both “NORMALIZED_NAME” and “CATEGORY” attributes, resulting in a mixed dataset with 999 attributes, and it gave the best results in [16]. The fourth experiment used reviews with “NORMALIZED_NAME”, “CATEGORY”, and “SUBCATEGORY” attributes, resulting in a mixed dataset with 1034 attributes, which provide all information that can be extracted from the computational wine wheel. Figure 8 shows a breakdown of what is contained in each dataset, with a class label at the end. The following subsections use different combinations of attributes to build SVM models for classification evaluation using five-fold cross-validation.

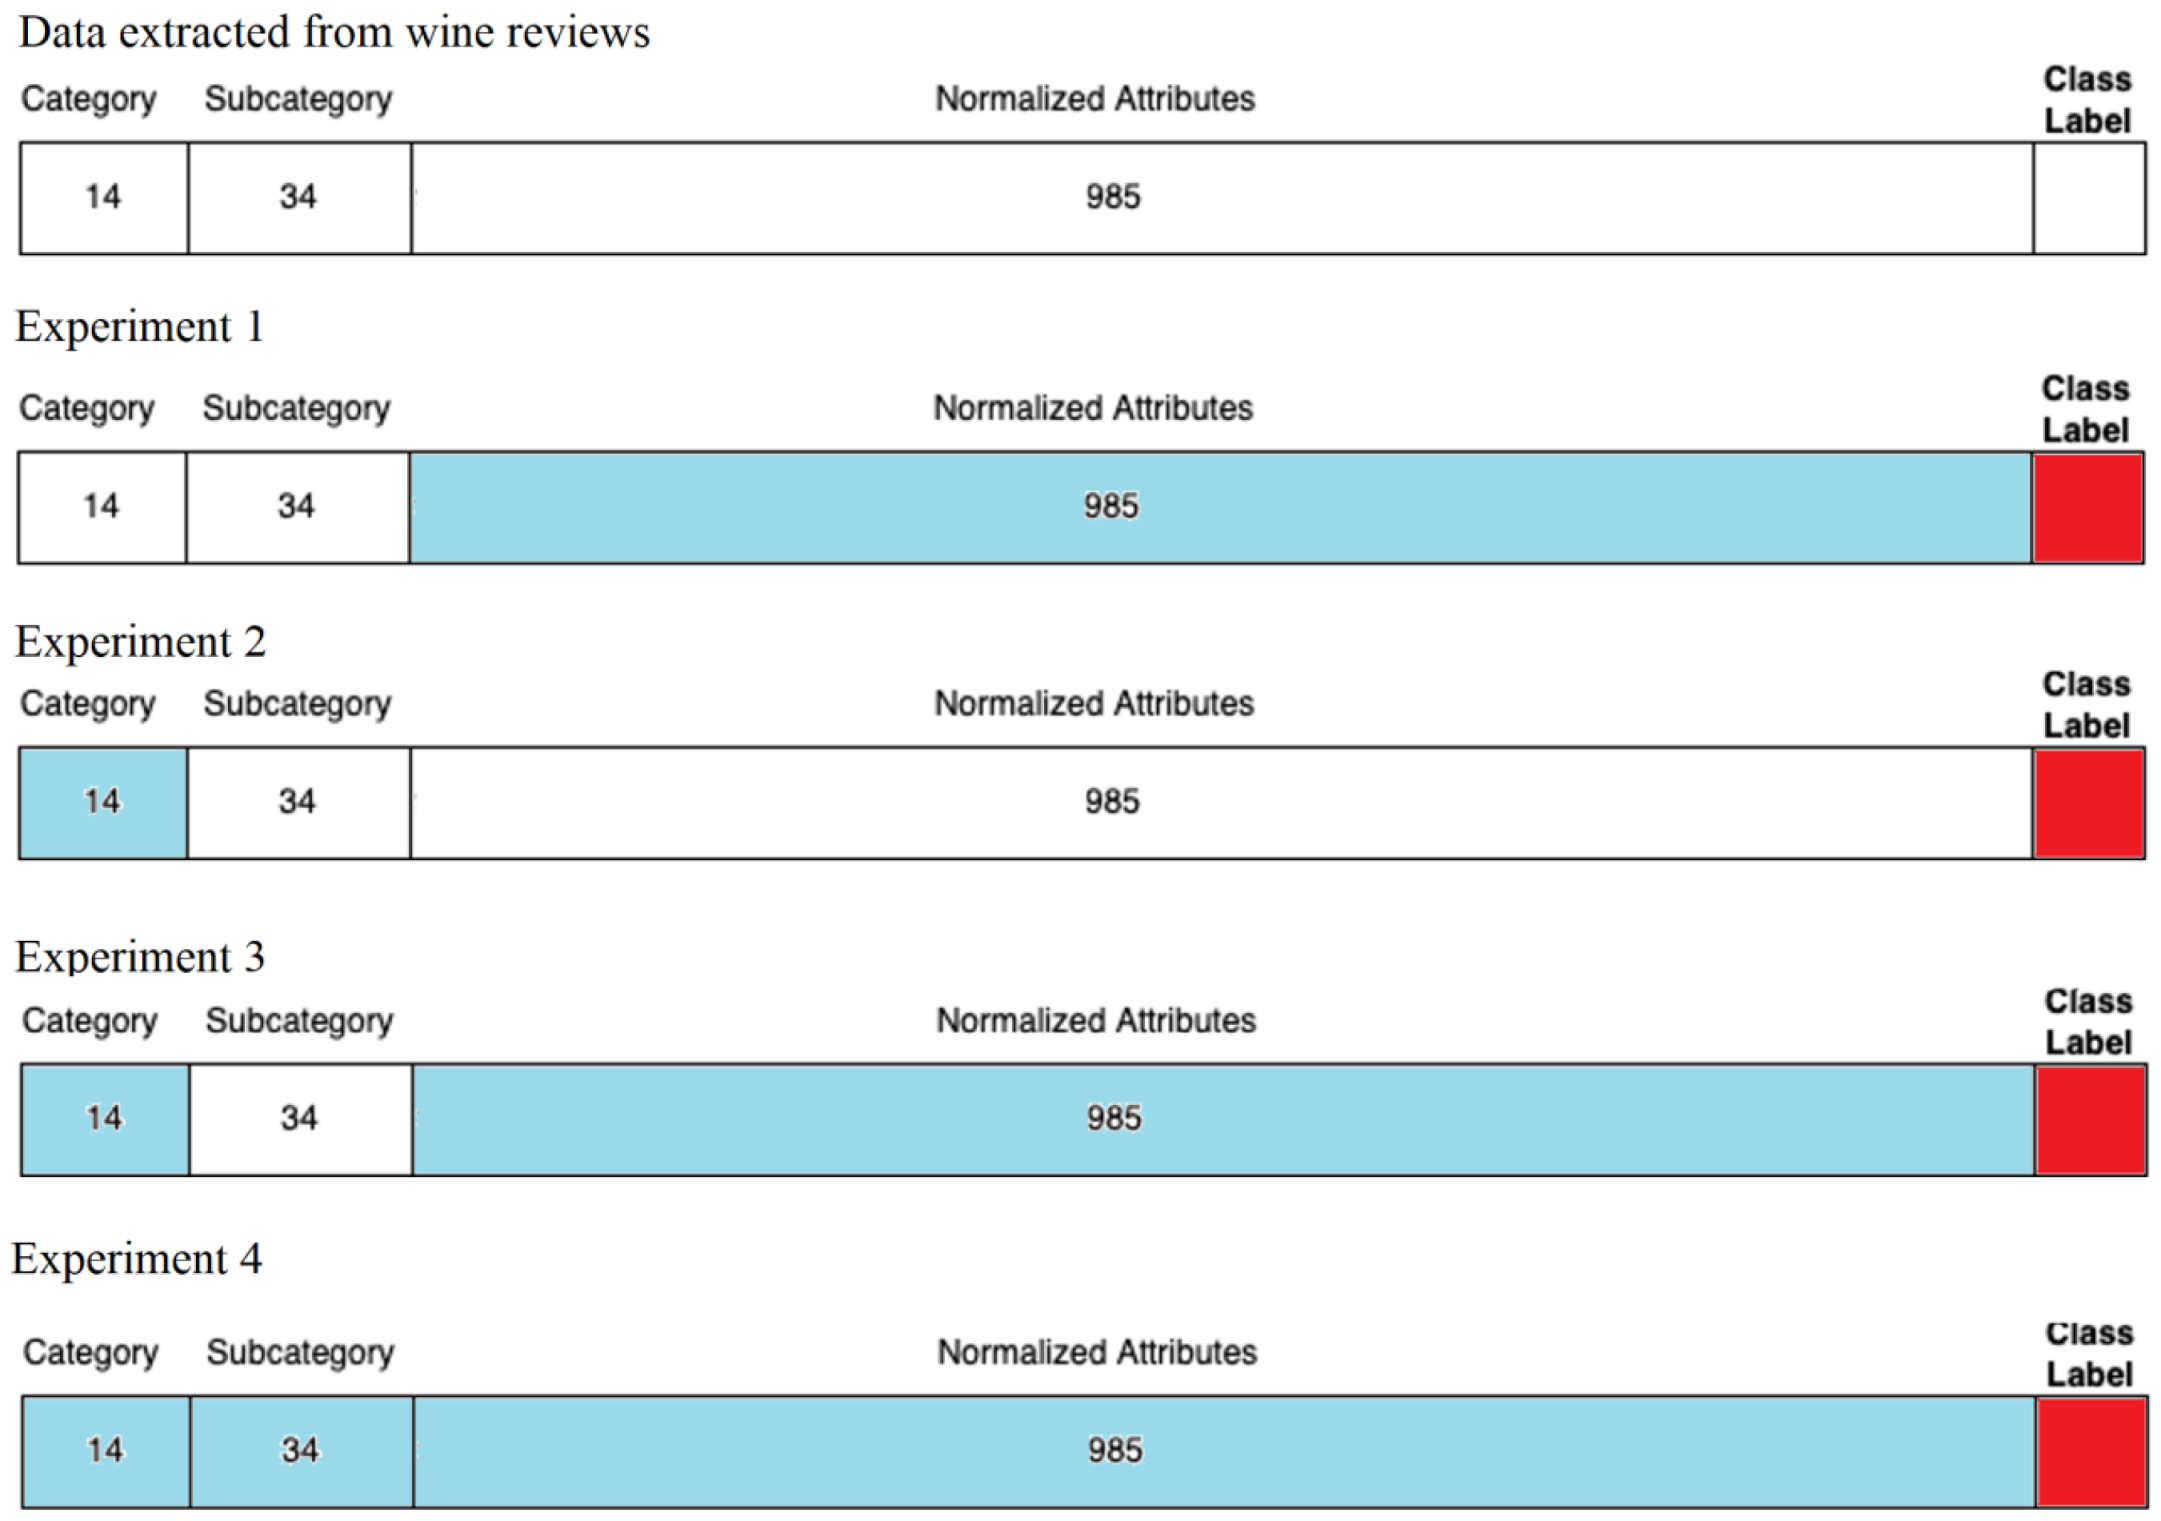
3.2.1. Experiments on Normalized Attributes

The first experiment investigated whether the reviewer caused a significant difference in the statistics. Table 2 shows the ability of the model to predict whether the grade of the wine is higher than 95 points based on the 985 binary attributes extracted from the NORMALIZED attributes in the computational wine wheel. In this experiment, Robert Parker’s reviews and Wine Spectator’s reviews were compared side by side to evaluate which reviewer’s model has a higher classifying capability. Furthermore, we merged Robert Parker’s and Wine Spectator’s reviews into one dataset, which contains 1026 (513 wines reviews from Robert Parker and 513 wines reviews from Wine Spectator) Bordeaux elite wines, and used the same training and prediction process to determine if the model has even better prediction power. The evaluations, including accuracy, sensitivity, specificity, and precision, used in the figures were the equations mentioned in Section 2.5.
In Table 3, the highest values are highlighted in red. It can be seen that Wine Spectator has the highest accuracy. This was to be expected since the computational wine wheel was developed based on Wine Spectator’s reviews. The accuracy of Robert Parker is not too different from the accuracy of Wine Spectator, which was not expected, since their review styles are quite different. The assumption is that Robert Parker’s reviews are very descriptive and detailed, and they provide enough information for the computational wine wheel to generate meaningful attributes for SVM. However, the accuracy of Robert Parker and Wine Spectator combined is not as good as that of Wine Spectator, even though the dataset is two times bigger than that of Wine Spectator. This could be because the reviews by Robert Parker and Wine Spectator are not always in agreement with each other.

3.2.2. Experiments on Category Attributes

The data tested in this experiment only used 14 attributes from CATEGORIES. In Table 4, it can be seen that the combination of both datasets had the highest accuracy. Compared to the others, Wine Spectator’s accuracy was the lowest in the experiment. This could be due to the fact that the categories might be too broad of a description for Wine Spectator’s reviews. The reviews contain less normalized data, which can lead to fewer categorical attributes. The results presented in this table are high considering that it only used 14 attributes. These results suggest that the method can capture logistics from both Robert Parker’s and Wine Spectator’s reviews.

3.2.3. Experiments on Category + Normalized Attributes

The next experiment explored how using the 14 attributes from CATEGORIES and the 985 attributes from NORMALIZED attributes affects the results. In Table 5, it can be seen that Robert Parker’s dataset outperformed Wine Spectator’s dataset in accuracy and precision measurements by more than 1% and 6%, respectively. The combined dataset achieved the highest sensitivity and specificity, demonstrating the possibility of gathering more information by merging reviewers’ comments.

3.2.4. Experiments on Category + Subcategory + Normalized Attributes

The final experiment used all attributes extracted from the computational wine wheel. This experiment was used to evaluate if having more details can lead to better results. In Table 6, it can be seen that almost all of the results are better than or compatible with those of other experiments. Wine Spectator’s dataset achieved the highest accuracy; this is the only accuracy that is higher than 76%, which means that having more details leads to a more accurate result. Both the results of Robert Parker and those of the combination increased by about 2%, which means that improving Robert Parker’s accuracy could affect the combination’s accuracy.

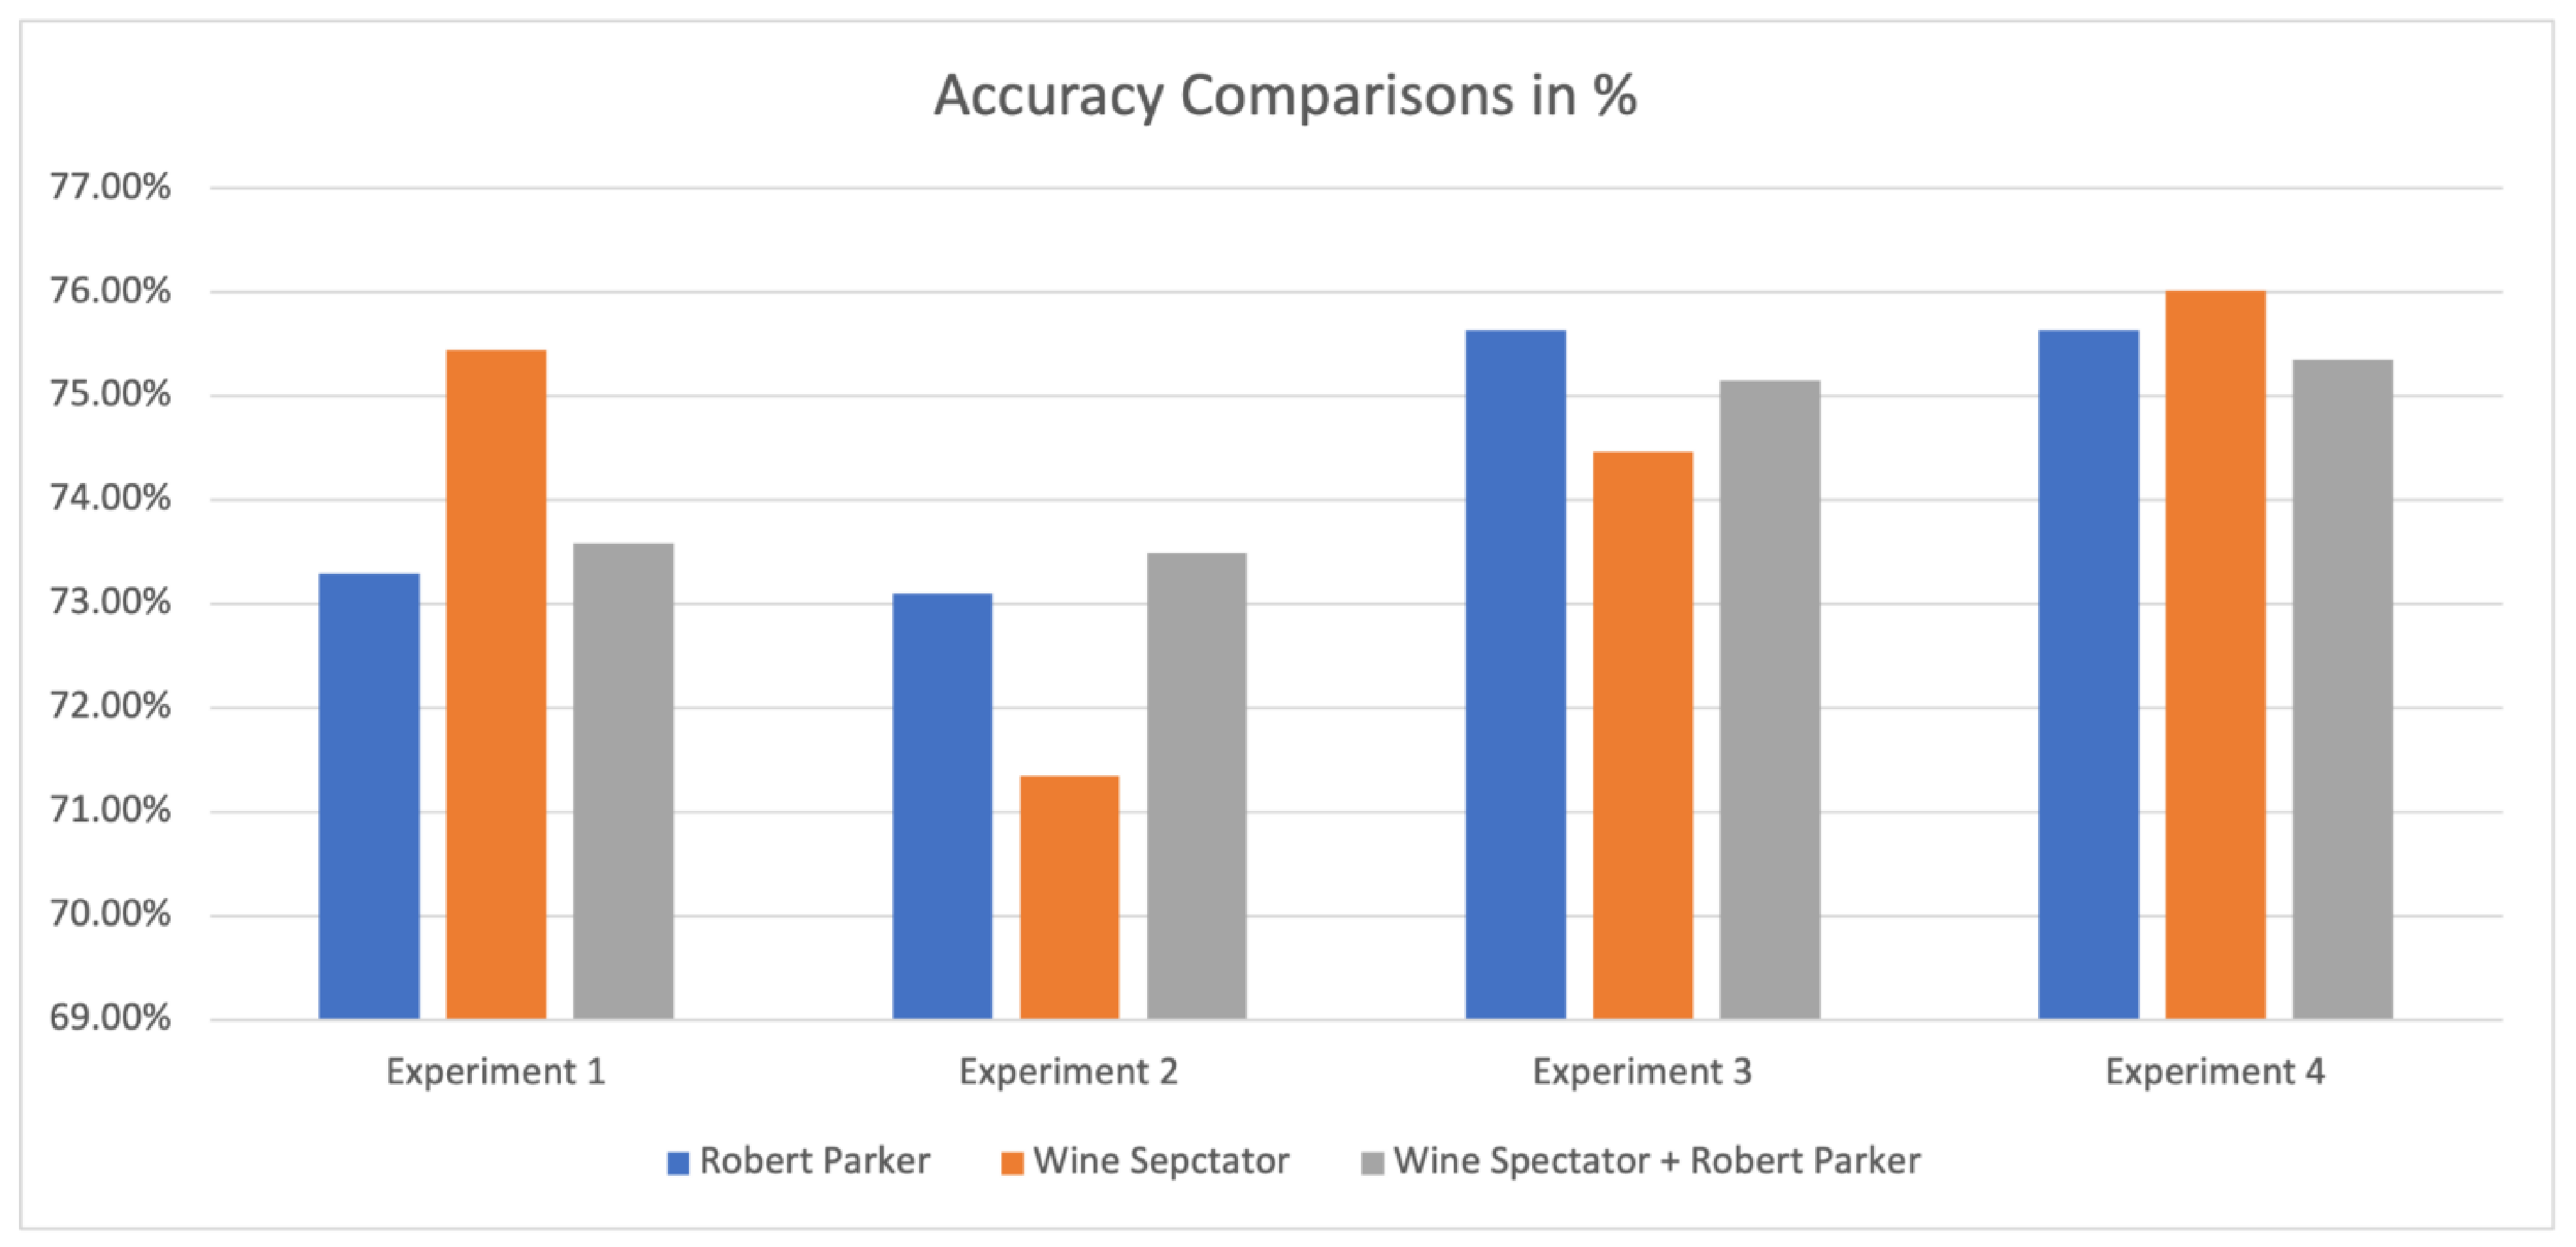
3.2.5. Comparison of All Experiments

Overall, experiment 4 had the highest accuracy out of all the phases in Figure 9. This means that the model that used normalized values, categorical values, and sub-categorical values, predicted the class of the wine the best. Experiment 4 also had the most consistent values compared to the other experiments, as it can be seen across all of the datasets that the bars are almost level. In experiment 1, Wine Spectator performed much better than the other datasets; this shows that Wine Spectator adapts best to the normalized values and attributes through the computational wine wheel.
Receiving scores above 95 points from professional wine reviewers can be considered a great achievement for wines; normally, only less than 5% of wines in a wine region achieve this honor [32]. A dataset collected in this situation will have the majority of wines categorized in the 94 − category and a minority categorized in the 95 + category; this is known as the imbalanced dataset problem, as a classification model built from a highly imbalanced dataset will categorize all testing datasets into the minority class. In this case, the accuracy is very high (close to 100%), but the sensitivity and precision are very low (close to 0%). However, since the datasets collected in this research are from elite Bordeaux, this research did not encounter the imbalanced problem. To the best of our knowledge, no other similar research uses 95 + points as the positive class label; therefore, no fair comparison can be made with the latest research results.

4. Conclusions

Wineinformatics is a new field in data science that gleans useful wine information by using data science techniques. One of the important tools in Wineinformatics is the computational wine wheel, which was used to study wine reviews in Wine Spectator in our previous research. In this research, the computational wine wheel was applied to a completely new data source, that is, Robert Parker’s wine reviews, which were compared with Wine Spectator’s wine reviews side by side. The reviews of wines classified in the 1855 Bordeaux Wine Official Classification that were produced in the 21st century (2000–2020) were collected if the wine had reviews by both Robert Parker and Wine Spectator on wine.com. The black-box algorithm support vector machine (SVM) was utilized to build a model for the prediction of whether a wine is a classic wine (95 + scores) or not (94 − scores). To use the full power of the computational wine wheel, NORMALIZED, CATEGORY, and SUBCATEGORY attributes were extracted from the wheel and used in the SVM algorithm.
The best performance out of the four different attribute combinations was the combination using NORMALIZED, CATEGORY, and SUBCATEGORY attributes, which means that all of the attributes together provide the most information. The best performance out of the three different datasets was 76.02% from the dataset of Wine Spectator, which was expected because the computational wine wheel was developed based on Wine Spectator’s reviews. However, all of the differences between the accuracies of Robert Parker and Wine Spectator were smaller than 2.15%, which means that the application of the computational wine wheel to Robert Parker’s reviews is reasonable. To the best of our knowledge, this paper is the first research to make the following three major contributions: (1) digitization of Robert Parker’s wine reviews through the computational wine wheel; (2) comparison of Wine Spectator’s and Robert Parker’s wine reviews side by side; and (3) building of a computational model that merges different sources of wine reviews to achieve the fusion of multiple expert decisions. This paper opens a new direction in Wineinformatics multi-expert learning [33] since more complicated computational models can be built through neural networks or more sophisticated classification algorithms. The conversion rate obtained in this research also suggests that a newer version of the computational wine wheel might be needed, with the inclusion of Robert Parker’s and other prestigious reviewer’s reviews. The first classification algorithm used in multi-expert Wineinformatics research, SVM, which is the classification algorithm also used in this research, is considered a black-box approach, which means that the model’s logic cannot be interpreted. White-box classification algorithms might be a natural next step to explore in multi-expert Wineinformatics research to understand why Robert Parker and Wine Spectator agree or disagree in their wine reviews and in what category, subcategory, or attributes. Generally speaking, more useful knowledge about wine can be gathered through white-box classification algorithms.

Supplementary Materials

The following supporting information can be downloaded at: https://www.mdpi.com/article/10.3390/fermentation8040164/s1, Table S1. List of Category attributes, Table S2. List of Subcategory attributes.

Author Contributions

Conceptualization, B.C.; Data curation, Q.T. and B.W.; Formal analysis, Q.T., B.W. and B.C.; Project administration, B.C.; Resources, B.C.; Software, Q.T.; Supervision, B.C.; Writing—original draft, Q.T., B.W. and B.C.; Writing—review & editing, B.C. All authors have read and agreed to the published version of the manuscript.

Funding

We would like to thank the Department of Computer of UCA for the support of the new research application domain development and the sabbatical support for B.C. in Spring 2022 from UCA.

Institutional Review Board Statement

Not applicable.

Informed Consent Statement

Not applicable.

Data Availability Statement

Not applicable.

Conflicts of Interest

The authors declare no conflict of interest.

References

  1. Roca, P. State of the Vitiviniculture World in 2020; International Organization of Vine and Wine: Paris, France, 2021. [Google Scholar]
  2. Nandagopal, G.; Nair, P.S. Production of Wine from Ginger and Indian Gooseberry and A Comparative Study of Them over Commercial Wine. Am. J. Eng. Res. 2013, 3, 19–38. [Google Scholar]
  3. Chambers, P.J.; Pretorius, I.S. Fermenting knowledge: The history of winemaking, science and yeast research. EMBO Rep. 2010, 11, 914–920. [Google Scholar] [CrossRef] [PubMed] [Green Version]
  4. Schuring, R. RoboSomm Chapter 3: Wine Embeddings and a Wine Recommender. Available online: https://towardsdatascience.com/robosomm-chapter-3-wine-embeddings-and-a-wine-recommender-9fc678f1041e (accessed on 12 November 2020).
  5. Cortez, P.; Cerdeira, A.; Almeida, F.; Matos, T.; Reis, J.L. Modeling wine preferences by data mining from physicochemical properties. Decis. Support Syst. 2009, 47, 547–553. [Google Scholar] [CrossRef] [Green Version]
  6. Er, Y.; Atasoy, A. The Classification of White Wine and Red Wine According to Their Physicochemical Qualities. Int. J. Intell. Syst. Appl. Eng. 2016, 4, 23–26. [Google Scholar] [CrossRef]
  7. Quandt, R.E. A note on a test for the sum of ranksums. J. Wine Econ. 2007, 2, 98–102. [Google Scholar] [CrossRef] [Green Version]
  8. Ashton, R.H. Improving experts’ wine quality judgments: Two heads are better than one. J. Wine Econ. 2011, 6, 135–159. [Google Scholar] [CrossRef]
  9. Ashton, R.H. Reliability and consensus of experienced wine judges: Expertise within and between? J. Wine Econ. 2012, 7, 70–87. [Google Scholar] [CrossRef]
  10. Bodington, J.C. Evaluating wine-tasting results and randomness with a mixture of rank preference models. J. Wine Econ. 2015, 10, 31–46. [Google Scholar] [CrossRef]
  11. Chen, B.; Velchev, V.; Palmer, J.; Atkison, T. Wineinformatics: A Quantitative Analysis of Wine Reviewers. Fermentation 2018, 4, 82. [Google Scholar] [CrossRef] [Green Version]
  12. Chen, B.; Rhodes, C.; Crawford, A.; Hambuchen, L. Wineinformatics: Applying data mining on wine sensory reviews processed by the computational wine wheel. In Proceedings of the 2014 IEEE International Conference on Data Mining Workshop, Shenzhen, China, 14 December 2014; pp. 142–149. [Google Scholar]
  13. Chen, B.; Rhodes, C.; Yu, A.; Velchev, V. The Computational Wine Wheel 2.0 and the TriMax Triclustering in Wineinformatics. In Industrial Conference on Data Mining; Springer: Cham, Switzerland, 2016; pp. 223–238. [Google Scholar]
  14. McCune, J.; Riley, A.; Chen, B. Clustering in Wineinformatics with Attribute Selection to Increase Uniqueness of Clusters. Fermentation 2021, 7, 27. [Google Scholar] [CrossRef]
  15. Kwabla, W.; Coulibaly, F.; Zhenis, Y.; Chen, B. Wineinformatics: Can Wine Reviews in Bordeaux Reveal Wine Aging Capability? Fermentation 2021, 7, 236. [Google Scholar] [CrossRef]
  16. Dong, Z.; Atkison, T.; Chen, B. Wineinformatics: Using the Full Power of the Computational Wine Wheel to Understand 21st Century Bordeaux Wines from the Reviews. Beverages 2021, 7, 3. [Google Scholar] [CrossRef]
  17. Hommerberg, C. Persuasiveness in the Discourse of Wine: The Rhetoric of Robert Parker. Ph.D. Thesis, Linnaeus University Press, Kalmar, Sweden, 2011. [Google Scholar]
  18. Wine Spectator. Available online: https://www.winespectator.com (accessed on 1 December 2021).
  19. Valentin, D.V. Wineinformatics: A Quantitative Analysis of Wine Reviewers. Master’s Thesis, University of Central Arkansas, Conway, AR, USA, 2017. [Google Scholar]
  20. Chen, B. Wineinformatics: 21st Century Bordeaux Wines Dataset. IEEE Dataport. Available online: https://ieee-dataport.org/open-access/wineinformatics-21st-century-bordeaux-wines-dataset (accessed on 28 March 2022).
  21. Robert Parker’s 100-Point Wines. Available online: Wine-Searcher.com (accessed on 1 December 2021).
  22. Marter, G. Robert Parker’s Wine Advocate and the Consequential Pricing of Provençal Wines. Bachelor’s Thesis, Scripps College, Claremont, CA, USA, 2017; p. 973. [Google Scholar]
  23. 100-Point Wines|Wine Spectator. Available online: https://www.winespectator.com/articles/scoring-scale (accessed on 1 December 2021).
  24. Dong, Z.; Guo, X.; Rajana, S.; Chen, B. Understanding 21st Century Bordeaux Wines from Wine Reviews Using Naïve Bayes Classifier. Beverages 2020, 6, 5. [Google Scholar] [CrossRef] [Green Version]
  25. Patten, T.; Jacobs, P. Natural-language processing. IEEE Expert 1994, 9, 35. [Google Scholar] [CrossRef] [Green Version]
  26. Li, W.; Liu, Z. A method of SVM with Normalization in Intrusion Detection. Procedia Environ. Sci. 2011, 11, 256–262. [Google Scholar] [CrossRef] [Green Version]
  27. Patro, S.G.K.; Sahu, K.K. Normalization: A Preprocessing Stage. arXiv 2015, arXiv:1503.06462. [Google Scholar] [CrossRef]
  28. Suykens, K.J.A.; Vandewalle, J. Least squares support vector machine classifiers. Neural Process. Lett. 1999, 9, 293–300. [Google Scholar] [CrossRef]
  29. RayI, S. SVM: Support Vector Machine Algorithm in Machine Learning. 23 November 2020. Available online: https://www.analyticsvidhya.com/blog/2017/09/understaing-support-vector-machine-example-code/ (accessed on 28 November 2020).
  30. Yu, Y.; Feng, Y. Modified Cross-Validation for Penalized High-Dimensional Linear Regression Models. J. Comput. Graph. Stat. 2014, 23, 1009–1027. [Google Scholar] [CrossRef] [Green Version]
  31. Picard, R.R.; Cook, R.D. Cross-Validation of Regression Models. J. Am. Stat. Assoc. 1984, 79, 575–583. [Google Scholar] [CrossRef]
  32. Palmer, J. Multi-Target Classification and Regression in Wineinformatics; University of Central Arkansas: Conway, AR, USA, 2018. [Google Scholar]
  33. Yang, C.; Yuan, K.; Zhu, Q.; Yu, W.; Li, Z. Multi-expert learning of adaptive legged locomotion. Sci. Robot. 2020, 5, eabb2174. [Google Scholar] [CrossRef] [PubMed]
Figure 1. Robert Parker’s 100-point rating system.
Fermentation 08 00164 g001
Figure 2. Wine Spectator’s 100-point rating system.
Fermentation 08 00164 g002
Figure 3. An example of Wine Spectator’s wine review on wine.com.
Fermentation 08 00164 g003
Figure 4. An example of Robert Parker’s wine review on wine.com.
Fermentation 08 00164 g004
Figure 5. The first step of extracting words with computational wine wheel.
Fermentation 08 00164 g005aFermentation 08 00164 g005b
Figure 6. The second and third steps of extracting words with computational wine wheel.
Fermentation 08 00164 g006
Figure 7. Wine review of Chateau Rothschile 2016 from Robert Parker.
Fermentation 08 00164 g007
Figure 8. Dataset splits.
Fermentation 08 00164 g008
Figure 9. Accuracy comparisons of all datasets across 4 different experiments.
Fermentation 08 00164 g009
Table 1. Confusion matrix used in this research.
Confusion MatrixPredicted: 95 +Predicted: 94 −
Actual: 95 +TPFN
Actual: 94 −FPTN
Table 2. Example of extraction rate progress.
Hand-Extracted AttributesProgram-Extracted AttributesCommon Attributes
powerful, blackcurrant,
black raspberries,
blueberry, pie, melted chocolate, aniseed, camphor, kirsch, subtle, floral, full-bodied, concentrated, bold, seductive, fine-grained, silt-like tannins, jam-packed, tightly wound, fruit, layers, finishing, wonderful, mineral, sparks, magic,
powerful,
black raspberries,
blueberry, pie, melted chocolate,
kirsch, subtle, floral, full-bodied,
concentrated, bold, seductive,
jam-packed, tightly wound, fruit,
layers, finishing, wonderful,
mineral, sparks,
purple color, tannins, explodes,
powerful, black raspberries,
blueberry, pie,
melted chocolate, kirsch,
subtle, floral, full-bodied,
concentrated, bold, seductive, jam-packed, tightly wound,
fruit, layers, finishing, wonderful, mineral, sparks,
Total count: 26Total count: 23Total count: 20
Table 3. The results of the first experiment, which used 985 binary attributes from NORMALIZED attributes.
Normalized AttributesRobert Parker
(513 Wines)
Wine Spectator
(513 Wines)
Robert Parker and Wine Spectator
(513 + 513 = 1026 Wines)
Accuracy73.29%75.44%73.59%
Sensitivity49.75%54.1%53.42%
Specificity73.74%77.42%75.72%
Precision72.06%70.21%68.35%
Table 4. The results of the second experiment, which used 14 attributes from CATEGORY attributes.
CategoriesRobert Parker
(513 Wines)
Wine Spectator
(513 Wines)
Robert Parker and Wine Spectator
(513 + 513 = 1026 Wines)
Accuracy73.1%71.35%73.49%
Sensitivity40.61%34.43%41.32%
Specificity71.6%71.63%72.8%
Precision79.21%70%76.21%
Table 5. The results of the third experiment, which used 999 attributes from CATEGORY and NORMALIZED attributes.
Normalized Attributes
Categories
Robert Parker
(513 Wines)
Wine Spectator
(513 Wines)
Robert Parker and Wine Spectator
(513 + 513 = 1026 Wines)
Accuracy75.63%74.46%75.15%
Sensitivity52.79%50.27%55%
Specificity75.33%76.12%76.67%
Precision76.47%69.7%71.33%
Table 6. The results of the fourth experiment, which used all attributes from CATEGORY, SUBCATEGORY, and NORMALIZED attributes.
Normalized Attributes.
Categories and Subcategories
Robert Parker
(513 Wines)
Wine Spectator
(513 Wines)
Robert Parker and Wine Spectator
(513 + 513 = 1026 Wines)
Accuracy75.63%76.02%75.35%
Sensitivity59.76%51.91%55%
Specificity74.81%77.02%76.73%
Precision78.12%73.08%71.82%
Publisher’s Note: MDPI stays neutral with regard to jurisdictional claims in published maps and institutional affiliations.

