Article

Fermentation Characteristics of Rye and Sorghum Depending on Water:Feed Ratio

by
Ahmed Osman
1,
Clara Berenike Hartung
1,
Jan Berend Lingens
1,
Kerstin Rohn
2,
Tom Schreiner
2,
Marwa Fawzy Elmetwaly Ahmed
3,
Julia Hankel
1,
Amr Abd El-Wahab
1,4,† and
Christian Visscher
1,*,†
1
Institute for Animal Nutrition, University of Veterinary Medicine Hannover, Foundation, Bischofsholer Damm 15, 30173 Hannover, Germany
2
Department of Pathology, University of Veterinary Medicine Hannover, Foundation, Bünteweg 17, 30559 Hannover, Germany
3
Department of Hygiene and Zoonoses, Faculty of Veterinary Medicine, Mansoura University, Mansoura 35516, Egypt
4
Department of Nutrition and Nutritional Deficiency Diseases, Faculty of Veterinary Medicine, Mansoura University, Mansoura 35516, Egypt
*
Author to whom correspondence should be addressed.
These authors contributed equally to this work.
Fermentation 2022, 8(4), 155; https://doi.org/10.3390/fermentation8040155
Submission received: 3 March 2022 / Revised: 26 March 2022 / Accepted: 29 March 2022 / Published: 1 April 2022
(This article belongs to the Special Issue Value-Added Co-products from Industrial Fermentation)

Abstract

:
This study was conducted to determine the fermentation characteristics of rye or sorghum mixed with different ratios of water (25%, 37.5%, 50%, 62.5%, and 75% in dry matter (DM)), incubated up to 48 h. The pH of the fermented rye at a DM content of 25% after 24 h had the lowest values (3.57) compared to that at a DM content of 75% (6.42). In fermented sorghum, pH values were lower than 4 already after incubation at 25% DM for 12 h (3.93) in comparison to that at DM content 75% (6.51). The L-lactic acid concentration in the fermented rye with 25% DM content after 24 h was significantly the highest (18.7 g/kg DM), as was that of sorghum with 25% DM content after 24 h (22.2 g/kg DM). Moreover, the acetic acid level in the fermented rye with 25% DM content after 24 h was significantly the highest (3.02 g/kg DM) compared to the other DM contents of fermented rye. Also, in fermented sorghum (25% DM), the acetic acid content was significantly the greatest (1.49 g/kg DM) in comparison to the other DM contents of fermented sorghum. Overall, fermented rye and sorghum containing 25 or 37.5% DM for 24 h and 12 h for rye and sorghum, respectively are sufficient for fermentation to be optimized based on the values of pH and lactic acid content, except for acetic acid content, which may negatively affect the palatability in animals.

1. Introduction

Protein sources are the second-most important component in monogastric diets [1]. Due to the continuous increase in price of soybean meal, nutritionists have been searching for alternative protein sources. Nevertheless, the use of alternative protein sources is limited to low inclusion due to the presence of anti-nutritional factors known to impair animal performance, nutrient digestibility, and feed utilization [2]. A promising method that can be applied to improve the nutritive quality of these alternative protein sources is the fermentation process, resulting in digestibility improvement [1,2]. For optimal fermentation, carbohydrate rich feedstuffs such as cereal grains are also necessary as the glucose generated is a preferred substrate for fermentative microbes [3]. Therefore, fermentation of alternative protein sources requires co-fermentation with grains, and hence can lead to overcoming negative properties through the action of fermentation itself (for example in rye: complex carbohydrates, phytic acid; sorghum: tannins, [4]). As a whole, through fermentation, the usability and/or digestibility of proteins from alternative protein sources can be improved and the antinutritional factors of carbohydrate sources can be eliminated [5,6]. This should be taken into account not only because of the potential for better nutritional properties, but also because fermented feeds can have beneficial effects on animal health and well-being as well as food safety [7].
Apart from improved nutritional properties, fermentation is often associated with a high concentration of organic acids and a low pH [3,8]. Van Winsen et al. [9] described the desirable characteristics for fermented liquid feed as having a pH below 4.5, lactic acid concentrations above 150 mmol/L, and acetic acid and ethanol concentrations below 40 and 0.8 mmol/L, respectively. Thus, measuring different parameters of fermented substrates such as pH and concentration of acids are necessary to determine the efficiency of the fermentation process.
Different factors such as moisture, starter, and substrate, play a role in determining the fermentation characteristics as well as the nutrient profile of fermented substrates. The availability of water/moisture determines the fermentation quality, as it has an impact on microorganisms and their metabolic activity [7]. Studies over the past years have strongly demonstrated that the moisture content of fermentation substrates should be adjusted according to many factors, such as substrate properties (granularity, hydraulics) [10]. The starting culture, such as lactic acid bacteria (LAB), is considered another important factor to improve the fermentation process and act as the primary fermenting agent or aid in the growth and activity of other microorganisms required for the fermentation to take place [11,12]. Additionally, one of the most important factors affecting the quality/efficiency of fermentation is the type of carbohydrates, including starch and sugar, in the substrates. Starch in most cereals is the most abundant component within the grain, but the amount and composition vary depending upon grain type as well as variety [13]. Starch is a complex branched glucose polymer that is composed of amylose and amylopectin [14]. During fermentation, the glucose generated is a preferred substrate for fermentative microbes in feed, which may help to explain why the total carbohydrate content of feed decreases after fermentation [12]. As a result, the protein supplements’ low starch and sugar content could be a concern which could be mitigated by utilizing cereals (co-fermentation), for example. Rye and sorghum, for example, are considered sustainable ingredients which may be good carbohydrate sources for fermentation and/or co-fermentation with alternative protein sources.
Rye is characterized by high tolerance to adverse environmental conditions (especially to low temperatures or drought) and high yield, even on less fertile soils of irregular pH [15]. However, rye contains arabinoxylans, which are complex cell wall polysaccharides amounting to about 85 g/kg dry matter (DM) [16]. It is well known that arabinoxylans enhance digesta viscosity [17] due to a lack of endogenous enzymes that degrade dietary fiber, including soluble non-starch polysaccharides (NSP).
Sorghum is the fifth-most important cereal in the world, with high potential applications in feed production, such as replacement of corn in monogastric diets as well as high resistance to drought and limited water [18]. The primary component of the sorghum kernel is starch that can amount to up to 80% of DM [19]. Additionally, Knudsen [20] found that the NSP content in the sorghum was about 54 g/kg DM.
Therefore, the objective of the present study was to improve some nutritional as well as physicochemical parameters of rye and sorghum (for example, as sustainable grains of different starch structures) by means of the fermentation process to be used as a co-fermentation for different alternative protein sources. Accordingly, in vitro experiments were carried out to elucidate the fermentation of rye or sorghum mixed with different ratios of water in terms of fermentation efficiency, especially the pH, acid concentration and viscosity. This could be an interesting perspective to be used as substrates and/or co-fermentation for some protein supplements.

2. Materials and Methods

2.1. Samples and Grinding

Two different cereal grains were investigated, including one genotype of hybrid rye (Trebiano, KWS LOCHOW GmbH, Bergen, Germany) and sorghum (Sorghum bicolor, Lupus, KWS LOCHOW GmbH, Bergen, Germany). The average DM contents of hybrid rye and sorghum were 880 g/kg and 860 g/kg, respectively. A rotor mill/ultra-centrifugal mill (Retsch ZM 200 mill, Retsch GmbH, Haan, Germany) with 1 or 10 mm sieve size was used for the comminuting the samples (cereal grains) to mimic the particle size distribution that was produced from a hammer mill as well as to have a maximal capacity procedure of grinding. Sieve sizes of 1 and 10 mm diameter produced coarse meal of varying fineness, which was then mixed and sampled with the aid of a sample divider (Tyler sample divider type 1, Haver & Boecker OHG, Oelde, Germany) for analysis.

2.2. Fermentation

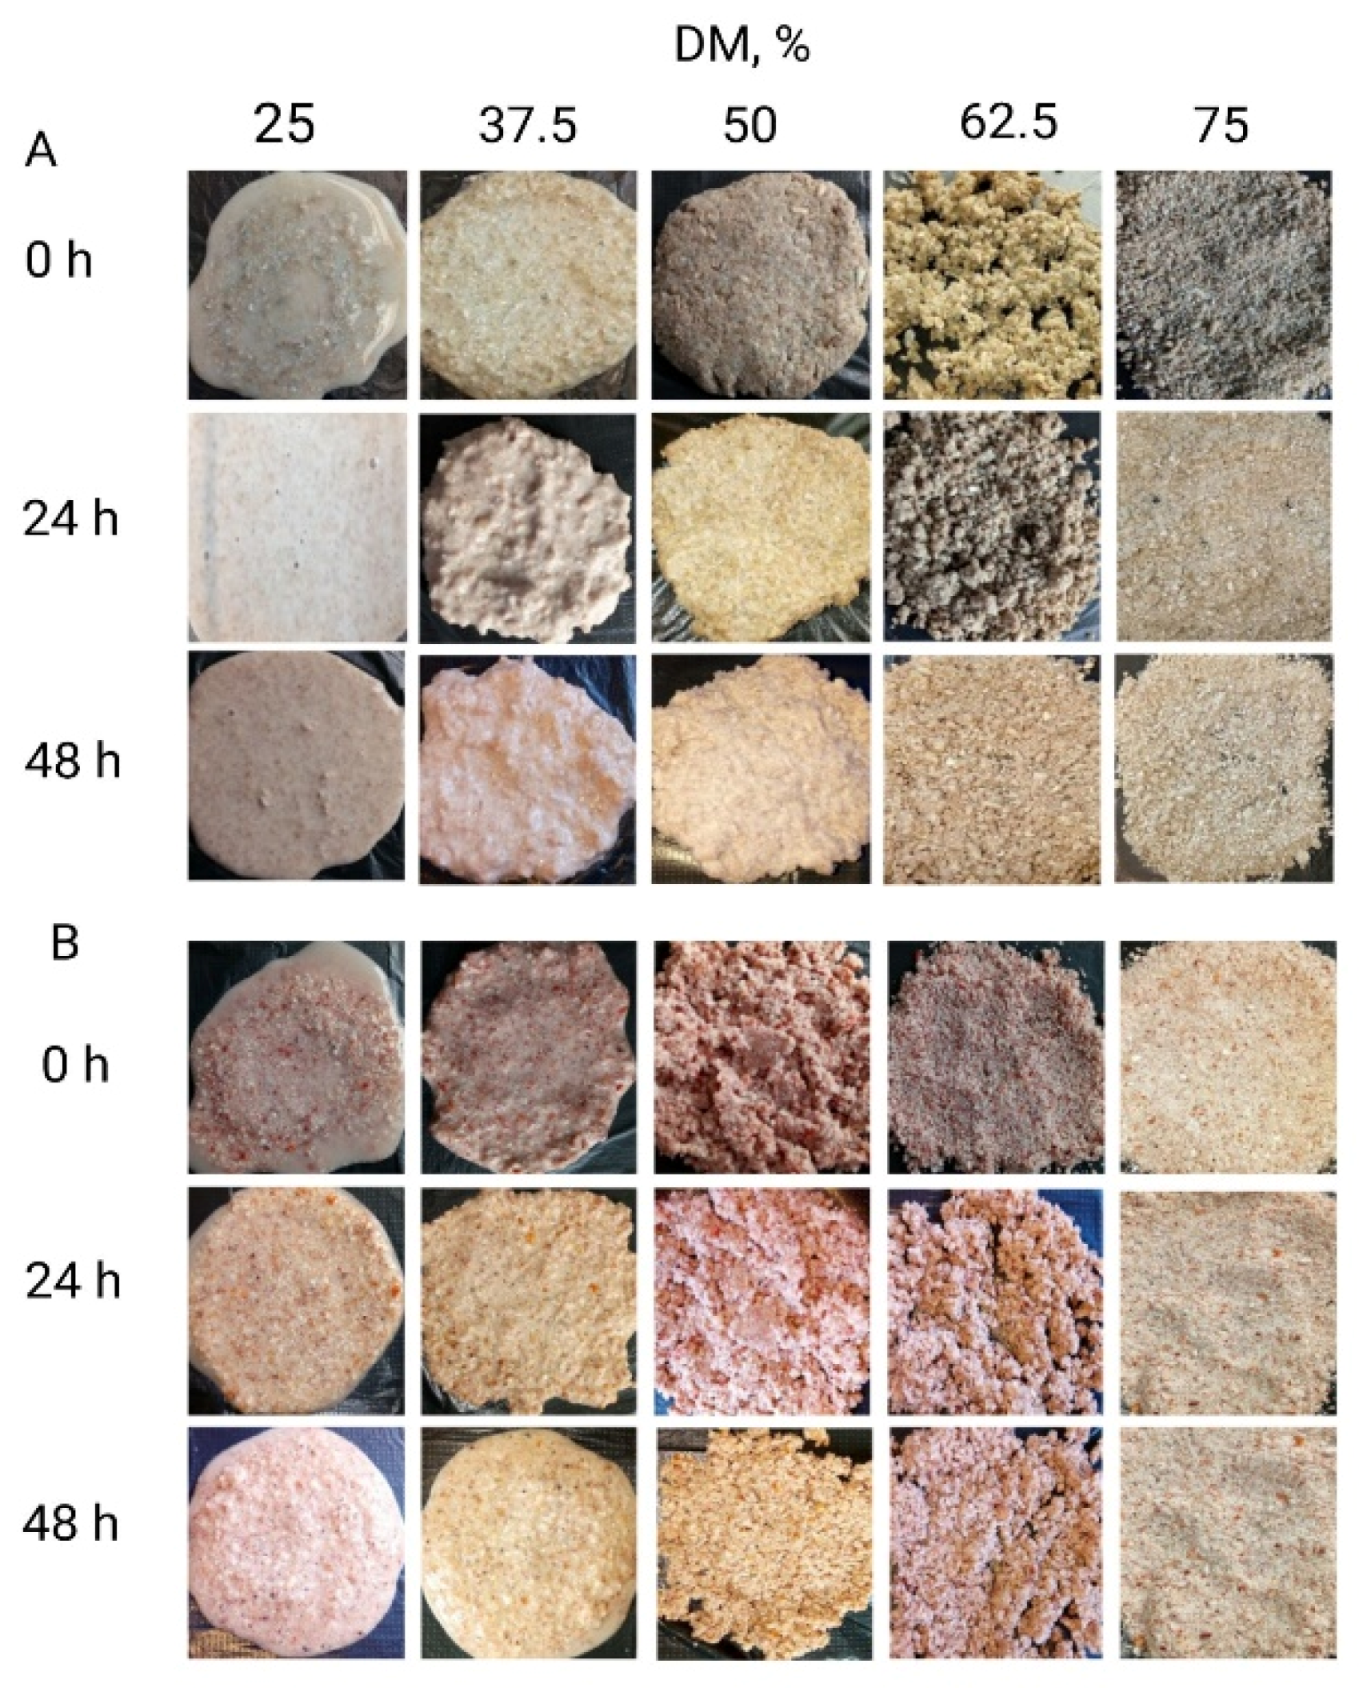
The ground grains (rye or sorghum) of both 1 and 10 mm (mixed) were fermented in vitro by using a 300 mL sterile beaker. Briefly, the sample-to-water ratio was adjusted to achieve the planned DM contents (25%, 37.5%, 50%, 62.5%, and 75%) in the mixture before fermentation. To avoid malfermentation, a freeze-dried, granulated starter culture (Schaumalac Feed Protect XP G, H. Wilhelm Schaumann GmbH, Pinneberg, Germany), consisting of 1k2079 Lactobacillus plantarum, 1k2103 Pediococcus pentosaceus, and 1k2082 Lactococcus lactis was added at the beginning of each fermentation process at a dose of 2 × 10⁷ CFU/g ingredient. The beakers were anaerobically (CO2 = 10.0%, O2 = 0.2%, N = 89.8% and temperature = 37.0 °C) incubated (Binder-Anaerobier Incubator, Fa. BINDER GmBH, Tuttlingen, Germany) for 6 h, 12 h, 24 h, and 48 h (Figure 1).
A temperature during fermentation of 37 °C was ensured for the entire fermentation period. Samples were taken during and after fermentation at 0, 6, 12, 24, and 48 h for further analysis (Figure 2).

2.3. Wet Sieve Analysis

Wet sieve analysis was carried out as described by Borgelt [21] using the same sieves as for the dry sieve analysis. The sieves were dried at 103 °C until constant weight was achieved and then cooled to room temperature in a desiccator. The individual sieves were then weighed, thus completing the preparation of the sieve tower. For sample preparation, about 50 g of the sample to be analyzed was filled into a beaker. Then 800 mL of distilled water was added, and the sample was mixed vigorously for 10 s. After soaking for 1 h, stirring was repeated. The suspension was then added to the top sieve (largest mesh size) of the already prepared sieve tower. A further 10 L of distilled water was used to rinse the sieve tower. The wet sieve tower including the sample material was placed in the drying oven (model 600, Memmert GmbH & Co. KG, Schwabach, Germany) overnight. On the following day, the sieves were placed in the desiccator to cool down and could then be weighed again. The dry fractions on the individual sieves were calculated as a percentage of the total amount of weighed DM. The percentage of particles <200 µm included those particles that had been dissolved or washed out. Accordingly, this fine fraction can be calculated by subtracting the total mass of weighed DM and the sum of the DM mass in the individual sieves. The wet sieve analysis tests were repeated as previously mentioned, but with a soaking phase of 24 h instead of 1 h.

2.4. Dry Matter and Protein Analysis

The DM content was calculated by weighing the samples before and after drying them at 103 °C. The Dumas incineration method was also used to determine the total nitrogen content by using about 0.3 g of the sample in a crucible at 1000 °C in Elementar analyser (Vario Max CNS, Elementar Analysensysteme GmbH, Langenfeld, Germany). The crude protein can then be determined by multiplying the nitrogen content by the factor 6.25.

2.5. Lactic Acid Bacteria Counts

Samples (25 g) were obtained in stomacher bag from each grain with different DM contents containing Schaumalac Feed Protect XP G at three time points: before fermentation starting (zero time), after 24 h and 48 h of fermentation. In each sample, Buffered Peptone Water (BPW, ThermoFisher scientific GmbH, Germany) was added in a stomacher bag in a ratio of 1:10 and mixed using Bagmixer (BagMixer®400, Interscience SARL, Saint-Nom-la-Bretèche, France) for 90 s at speed level 3. This mixture was the first dilution step after homogenization of the suspension. Then, 1 mL of the suspension was transferred to a deep well block (96 well MegaBlock.RTM. 2.2 mL, Sarstedt AG & Co, Nümbrecht) and thereafter, 10-fold serial dilution using Phosphate Buffer Saline (PBS, ThermoFisher scientific GmbH, Germany) was performed. Three concentrations of 100 µL were streaked on Rogosa agar (RA, ThermoFisher scientific GmbH, Germany) in duplicate. The plates were anaerobically incubated (CO2 = 10.0%, O2 = 0.2%, N = 89.8%, Binder-Anaerobier Incubator, Fa. BINDER GmBH, Tuttlingen, Germany) at 37.0 °C for 24 h and 48 h. After incubation, the characteristic creamy white of LAB colonies were counted and expressed in a Log10 colony forming unit (CFU)/g.

2.6. pH Value

The pH values in the collected samples were determined directly. A certain amount of the sample (about 2 g) was diluted in a ratio of 1:5 with distilled water and was left to stand for 30 min at room temperature. The pH value was determined using a calibrated glass electrode (HI 2211 pH/ORP Meter, Hanna Instruments Deutschland GmbH, Vöhringen, Germany).

2.7. Lactic Acid

For determining lactate concentrations, perchloric acid (1 mol/L) was first added to the sample material and centrifuged. Potassium hydroxide solution was then added to 2 mL of the supernatant until a pH range of 8–10 was reached. After re-centrifugation, an enzymatic determination (D-/L-lactic acid UV test, Roche Diagnostics GmbH, Mannheim, Germany) of the L- and D-lactate content was carried out in accordance with Bunte et al. [22].

2.8. Fatty Acid

The content of short-chain fatty acids (SCFA) in the homogenized sample was measured with the help of a gas chromatograph (610 Series, Unicam Chromatography GmbH & Co. KG, Kassel, Germany) in accordance with Bunte et al. [22]. The sample was mixed with distilled water at a ratio of 1:4 and centrifuged. After adding an internal standard to the sample (preparation: 10 mL formic acid 89% and 0.1 mL 4-methylvaleric acid), the sample was centrifuged and then gas chromatography was applied. The column has a temperature program of maximum 155 °C (injector: 175 °C, detector: 180 °C). The fatty acids were separated within a running time of 30 min and then determined by means of a flame ionization detector.

2.9. Extract Viscosity

The method used to determine the extract viscosity was based on that described by Dusel et al. [23] but with some modifications. About 5 g of fermented grain was added to 20 mL tap water and then shaken for 5 s on a vortex mixer (Heidolph Reax 2000, Fa.KaliChemie Pharma GmbH, Hannover, Germany). After a standing time of 30 min at 38 °C (incubator model 500, Memmert, GmbH & Co. KG, Schwabach, Germany), the samples were processed again using a vortex mixer and then centrifuged for 10 min at a force of 10,000 g (Heraeus Biofuge Stratos, Kendro Laboratory Products, Osterode, Germany). After centrifugation, the viscosity was determined using Model DVNext, DVNXLVCJG, Viscometer from Ametek Brookfield, Inc., Instrumentation & Specialty Controls Division, Middleborough, MA, USA. For this purpose, 600 µL were removed from the supernatant fluid in the centrifuge tubes and transferred to the measuring unit of the viscometer set to 26 °C. The measuring unit contained an S40 spindle that rotated at 10 rpm. After 1 min, the specified value was recorded.

2.10. Scanning Electron Microscopy Analysis

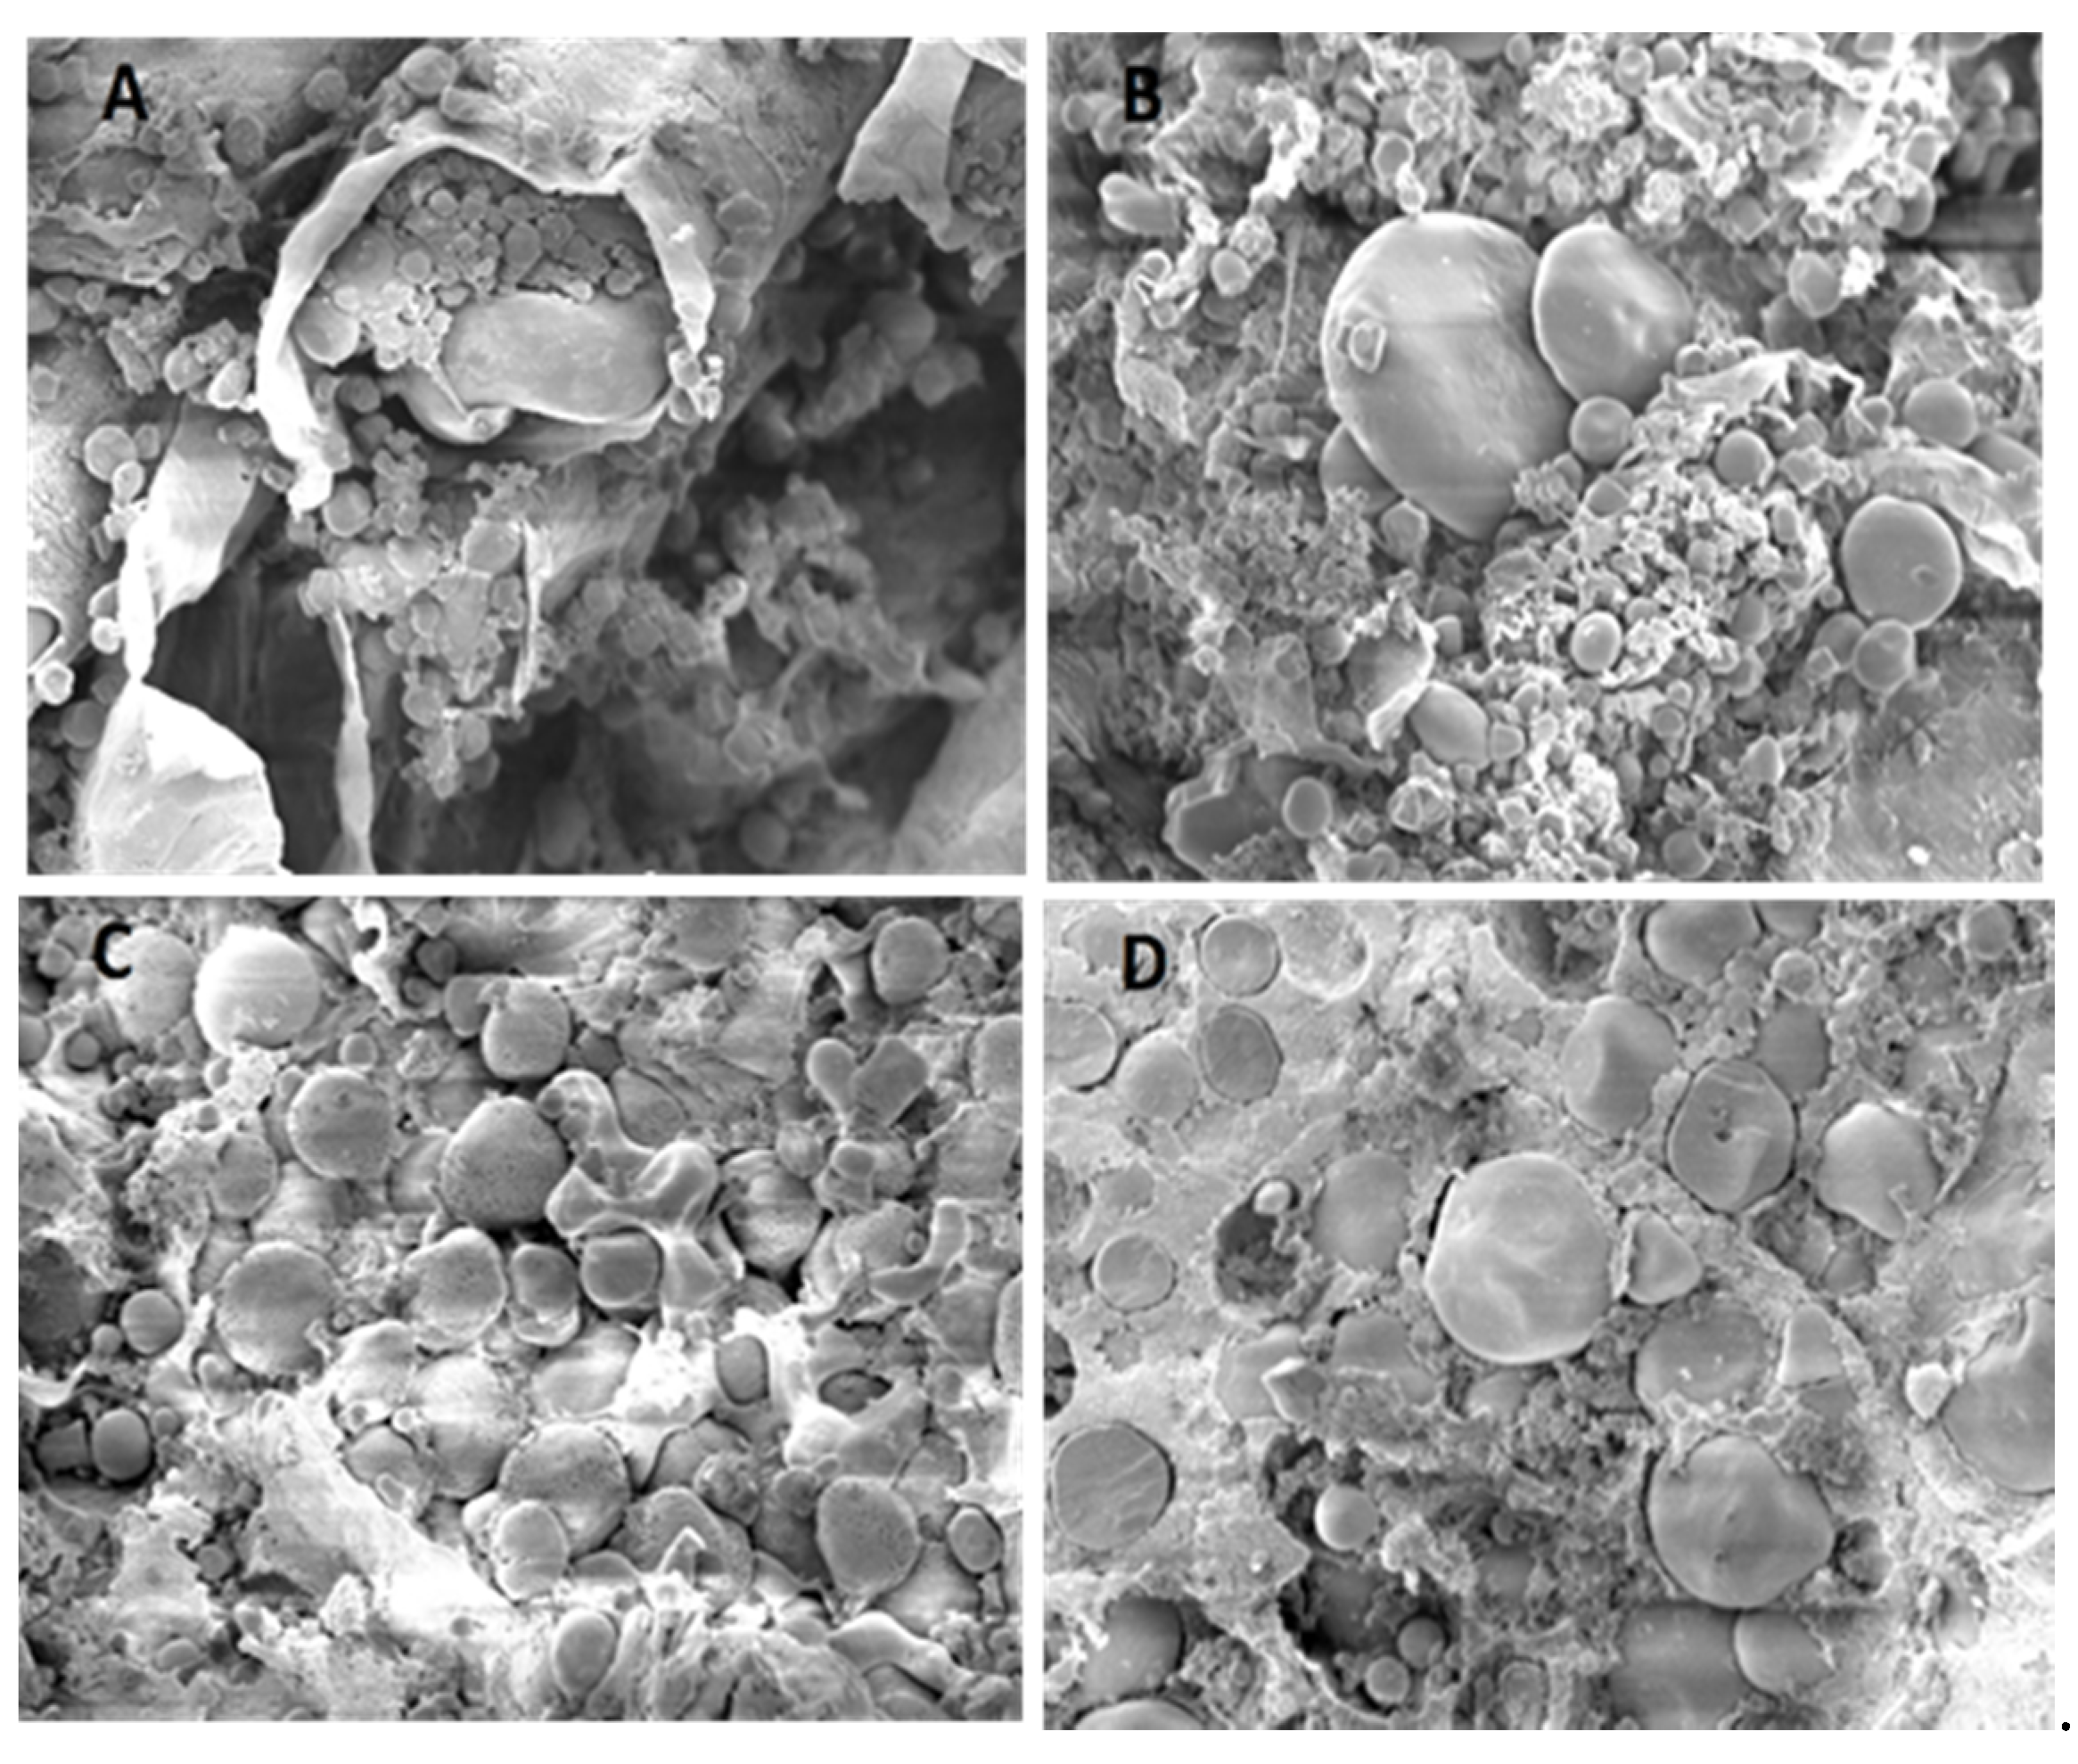
For determining the microstructure of the unfermented and fermented rye and sorghum (of 37.5% DM), a scanned electron microscope was used (EVO15: Carl Zeiss Scanning Electron Microscope GmbH, Jena, Germany) at ×1000 magnification. The examination was done at the Institute for Pathology, University of Veterinary Medicine Hannover, Foundation, Hannover, Germany. Briefly, the samples were fixed in 5% buffered glutaraldehyde (Electron Microscopy Sciences), then rinsed several times in 0.1 M cacodylate buffer. Thereafter, the samples were treated in 1% osmium tetroxide (Electron Microscopy Sciences, Hatfield, PA, USA) for two hours and washed again in 0.1 M cacodylate buffer for one day. The samples were dehydrated in graded alcohol dilutions for two days, infiltrated in isoamyl acetate, and critically point dried using a Polaron E3000 critical point dryer (Quorum Design GmbH, Darmstadt, Germany). Samples were dried doubled at the critical point and coated with gold particles in a sputtering coater (SCD 040: Balzers Union Limited, Balzers, Liechtenstein).

2.11. Statistical Analysis

Statistical analysis was performed using the Statistical Analysis System for Windows, the SAS® Enterprise Guide®, version 9.3 (SAS Institute Inc., Cary, NC, USA). All parameters were analyzed for the individual samples (n = 4). Moreover, the mean values as well as the standard deviation of the mean (SD) were calculated. Assuming normally distributed data, a Ryan–Einot–Gabriel–Welsch test (simple Anova) was performed for checking significant differences of the data. Differences with a significant level of p < 0.05 were considered significant.

3. Results

3.1. Particle Size Distribution

The particle size distribution of the rye and sorghum is summarized in Table 1. The average percentage of rye particles before fermentation (0 h) for experimental groups was about 29.3% DM and 44.9% DM at <0.20 mm and >1.00 mm, respectively. After 24 h of fermentation, significant differences in the particle size distribution <0.20 mm among the different DM contents of rye were noted. Whereas fermented rye with 37.5% DM had the greatest particle size distribution <0.20 mm (73.9%), fermented rye with 62.5% DM content had the lowest (46.4%). On the contrary, fermented rye with 75% DM content had the greatest particle size distribution >1.00 mm (49.8%), while fermented rye with 25% and 37.5% had the lowest percentages (14.3 and 17.0%, respectively).
The average percentage of sorghum particles before fermentation (0 h) for experimental groups was about 20.5% DM and 27.8% DM at <0.20 mm and >1.00 mm, respectively. After 24 h of fermentation, only significant differences were apparent in the particle size distribution <0.20 mm between fermented sorghum of DM contents of 62.5% and 75% (24.2 and 17.5%, respectively). Fermented sorghum with 50% and 75% DM contents had the greatest particle size distribution >1.00 mm (27.9 and 27.3%, respectively) compared to those with 37.5% and 62.5% DM contents (22.1 and 22.0%, respectively).

3.2. Protein Content

The protein contents of the rye and sorghum are presented in Table 2. The protein content in the fermented rye after 24 h did not significantly differ between groups (range: 104–106 g/kg DM). Also, after 48 h of rye fermentation, no significant differences in protein content were seen among groups, except between fermented rye with 25% DM and 62.5% DM (106 and 104 g/kg DM, respectively).
After 24 h of sorghum fermentation, significant differences were only seen in protein content between fermented sorghum with DM contents of 25% and 50% (132 and 126 g/kg DM, respectively). No significant differences were observed in the protein content after 48 h of sorghum fermentation between groups (range: 129–132 g/kg DM).

3.3. Counting Lactic Acid Bacteria

The LAB counts of the rye and sorghum is summarized in Table 3. After fermenting rye for either 24 h or 48, the LAB counts were significantly the lowest for fermented rye with 75% DM (7.15 and 6.32 log10 CFU/g, respectively) compared to the other groups (p < 0.0001). However, no significant differences were noted in the LAB counts for fermented rye with 25, 37.5, 50, and 62.5% DM contents after either 24 h or 48 h.
In the same trend, the LAB counts in the fermented sorghum with 75% DM for either 24 h or 48 h (5.93 and 6.38 log10 CFU/g, respectively) had significantly the lowest counts compared to the other groups (p < 0.0001). Moreover, no significant differences were noted in the LAB counts for fermented sorghum with 25, 37.5, 50, and 62.5% DM contents after either 24 h or 48 h.

3.4. pH Value

The pH values of fermented rye containing different DM contents are shown in Table 4. After fermenting the rye for 6 h, the DM contents of 62.5% and 75% had the highest significant pH values (6.48 and 6.49, respectively), while the DM content of 25% was the lowest in pH value (6.13). Also, after fermenting the rye for 12 h, the DM contents of 62.5% and 75% had the highest significant pH values (6.27 and 6.49, respectively), while the DM content of 37.5% was the lowest in pH value (4.16). Generally, after 24 h or 48 h of rye fermentation, the DM content of 75% had the highest significant pH values (6.42 and 6.40, respectively), while the DM content of 25% was the lowest in pH value (3.57 and 3.55, after 24 and 48 h, respectively).
Statistical differences were noted in the pH values after 6 h of sorghum fermentation among all treatments, whereas the DM content of 75% was the greatest and the DM content of 25% was the lowest (6.54 vs 5.95). The same trend was observed in the pH values of fermented sorghum after 12, 24, and 48 h, whereas the DM content of 75% was the greatest (range: 6.27–6.51) and the DM content of 25% was the lowest (in addition to DM content of 37.5% after 48 h) with a range of 3.77–3.93.

3.5. L-lactic Acid Content

The content of L-lactic acid in fermented rye and sorghum after 24 h or 48 h is reported in Table 5. The L-lactic acid concentration in the fermented rye after either 24 h or 48 h was significantly the greatest in the DM content of 25% (18.7 and 22.9 g/kg DM, respectively) compared to other treatments. While, the L-lactic acid concentration in the fermented rye after either 24 h or 48 h was significantly the lowest in the DM content of 75% (0.36 and 0.55 g/kg DM, respectively) compared to the other treatments.
In the case of fermented sorghum, the L-lactic acid concentration after either 24 h or 48 h was significantly the greatest in the DM content of 25% (22.2 g/kg and 24.4 g/kg DM, respectively) compared to other treatments. Whereas, the L-lactic acid concentration in the fermented sorghum after either 24 h or 48 h was significantly the lowest in the DM content of 75% (0.13 and 0.19 g/kg DM, respectively) compared to the other treatments.

3.6. Fatty Acid Concentrations

The fatty acid content in the fermented rye after either 24 h or 48 h is presented in Table 6. Acetic acid concentration in the fermented rye after either 24 h or 48 h was significantly the greatest in the DM content of 25% (3.02 and 2.32 g/kg DM, respectively) compared to other treatments. While, no significant differences were noted in the acetic acid content among the treatments in the different DM contents (37.5–75%) of fermented rye (24 h or 48 h). After fermenting the rye for 24 h, the propionic acid concentration was the highest with a DM content of 37.5% (0.12 g/kg DM) compared to the other treatments. No concentration of propionic acid was found in the case of rye in DM contents of 62.5% and 75% after 48 h fermentation, while it was in a range of 0.05–0.08 g/kg DM for fermented rye after 48 h with 25–50% DM contents. Butyric acid concentration in the fermented rye after 24 h was significantly the greatest in the DM content of 25% (0.72 g/kg DM) compared to other treatments, while no significant differences were noted in the butyric acid concentration in the DM contents of 37.5–75% for fermented rye (24 h) among the treatments. Nonetheless, no significant differences were noted in the butyric acid concentration among the treatments of different DM contents.
The fatty acid content in the fermented sorghum after either 24 h or 48 h are presented in Table 6. Acetic acid concentration in the fermented sorghum after either 24 h or 48 h was significantly the greatest in the DM content of 25% (1.49 and 1.97 g/kg DM, respectively) compared to other treatments. While, the acetic content was significantly the lowest in the fermented sorghum either after 24 h or 48 h for 75% DM (0.16 and 0.23 g/kg DM, respectively). After fermenting the sorghum for 24 h and 48 h, the propionic acid concentration was the lowest with a DM content of 75% (0.02 g/kg DM) compared to other treatments. Butyric acid concentration in the fermented sorghum after either 24 h or 48 h was significantly the greatest in the DM content of 25% (0.08 and 0.12 g/kg DM) compared to other treatments, while no concentration of butyric acid was detected in any of the treatments with DM contents of 62.5–75% of sorghum fermented for 48 h.

3.7. Viscosity

The data of viscosity measurement in rye during different fermentation periods are displayed in Table 7. At 0 h of fermentation, the rye with 62.5% and 75% DM contents had the highest viscosity values (4.52 and 4.65 mPa·s, respectively) compared to the other treatments. After fermenting the rye for 6 h, the DM content of 75% showed a significantly higher viscosity value (4.62 mPa·s) compared to those contained in 25–50% DM contents (range: 3.37–3.62 mPa·s). When increasing the fermentation period to 12 h, the 75% DM content had significantly the highest viscosity value (4.65 mPa·s), while the 25% DM content had the lowest value (1.72 mPa·s). Following the same trend, when increasing the fermentation process of rye up to 24 h and 48 h, the viscosity value was the highest in the case of 75% DM content (4.65 and 4.61 mPa·s, respectively), while the lowest value was recorded in the case of 25% and 37.5% DM contents (1.52 and 1.55, respectively for 24 h). Also, the lowest viscosity values were observed after fermenting the rye for 48 h in DM contents of 25–50% (range: 1.38–1.65 mPa·s).
The data of viscosity measurement in sorghum during different fermentation periods are presented in Table 7. At 0 h of fermentation, the sorghum with 75% DM content had the highest viscosity values (1.72 mPa·s) compared to the other treatments. When increasing the fermentation period from 12 h to 48 h, the 75% DM had significantly the highest viscosity values (range: 1.21–1.31 mPa·s), while no significant differences were noted among the other treatments in 25–62.5% DM contents.

3.8. Specific Microscopic Features

Figure 3 and Figure 4 show the morphological features of rye and sorghum before and after fermentation by scanning electron microscope at ×1000 magnifications. Scanning electron microscopy after fermentation, initially revealed no damage to the lateral surface of large granules. In rye, characteristic structural changes such as partial or complete lack of cell walls were visible, with partial or complete disappearance of the protein matrix. In sorghum, the peripheral regions of large granules contained numerous, large and deep holes; the lateral surfaces were found to contain different sized hollows, some directed towards the inside of the granule. No uniformity was apparent regarding distribution and size of holes on the surface of large granules.

4. Discussion

The fermentation process could be a positive tool to overcome the antinutritional substances in some alternative protein supplements [2], consequently improving animal health and production performance. Thus, fermentation invariably leads to a wider choice of feed ingredients that can be included in diet formulations for animals [1]. It is well known that to achieve optimal fermentation, a source of carbohydrates is required as a substrate [3]. Sustainable grains such as rye and sorghum contain carbohydrates of different starch structures [24]. Accordingly, fermentation characteristics may be changed and affected by the substrate composition.

4.1. Particle Size and Protein Level

In the present study, before fermentation, no differences were observed among the experimental groups with regard to particle size distribution (at <0.20 mm or at >1.00 mm) either for rye or sorghum. Particle size distribution was significantly affected by the type of fermented grain as well as by different moisture contents. In the current study, fermented rye after 24 h containing a DM content of 75% had the highest particle size distribution at >1.00 mm (49.8% DM) compared to the other treatments of different DM contents (range: 14.3–38.6% DM). However, this was not the case for particle size distribution at >1.00 mm for sorghum containing 25% or 75% DM contents (24.8 and 27.3% DM, respectively) which did not significantly differ. It is well known that during fermentation, macromolecules are broken down into smaller or simpler units [7]. A reduction in particle size could increase the surface area for amylolytic enzyme action and result in a rapid fermentation of glucose and fructose. The relation between particle size and sugar availability has been highlighted by Anguita et al. [25], who reported that reduction increased hydrolysis of starch, especially for raw cereals. However, Tester et al. [26] pointed out that whilst the size and shape of the starch granules is clearly a controlling factor in the hydrolysis of native starches with amylases, factors which control the accessibility of the enzyme to the interior of the granule also regulate hydrolysis.
The protein level in fermented rye either after 24 h or 48 h, in the current study, remained unchanged between groups (except only between 25% DM and 62.5% DM after 48 h). Similarly, after fermenting sorghum for 24 h or 48 h, the protein content did not differ between groups (except between 25% DM and 50% DM after 24 h). Bunte et al. [22] observed that a controlled fermentation did not significantly influence the crude protein content and the amino acids pattern in liquid feed. Zentek and Goodarzi Boroojeni [7] stated that the displayed changes in the protein content of fermented feed ingredients are due to concentration effects where other components are fermented by the microorganisms during the fermentation process. Therefore, the observed protein increases are actually proportional changes. Nonetheless, previous studies have shown that fermentation of cassava pulp increased crude protein content [27,28]. Overall, the type of microorganism proliferating during fermentation, chemical composition of ingredients, and incubation time may play an important role in the determination of fermented ingredients’ nutrient profile.

4.2. Fermentation Characteristics

The efficiency of the fermentation process can be affected by the total DM concentration of the grains. Thus, using different DM concentrations of fermented rye or sorghum grains is essential to identify minimal and maximal moisture levels for ideal fermentation conditions. After 24 h or 48 h of fermentation for rye and sorghum, the counts of LAB did not differ between groups (except for 75% DM). Regardless of the grain type, high DM content (75%) of the grain before fermentation was not suitable for growth/increasing the LAB in comparison to those of low DM contents (range: 25–62.5%). By mixing with water, LAB proliferate and produce lactic acid which reduces the pH of the mixture [29]. Van Winsen et al. [9] described the desirable characteristics for fermented liquid feed as having a LAB concentrations above 9 log10 CFU/mL. Generally, if the water content is increased, a liquid feed is produced which has a lower pH and a microbiota dominated by lactobacilli [1].
The chemical characteristics of fermented cereal grains have previously been reported to differ [29,30], this being confirmed in the present study. In the current study, the pH values of the fermented rye seem to be affected by the DM content. After 6 h of rye fermentation, the low DM content (25% and 37.5%, respectively) had significantly the lowest pH values of 6.13 and 6.14, respectively, in comparison to those in high DM content such as 62.5% and 75% (6.48 and 6.49, respectively). Moreover, decreasing the DM content to 25% DM of rye resulted in excellent production of lactic acid (22.1 g/kg DM). In the case of fermented sorghum after 6 h, the lowest DM content (25%) had significantly the lowest pH value of 5.95 in comparison to that in the higher DM content of 75% (6.54). Also, in the case of sorghum, it is apparent that 25% DM content had the highest production of lactic acid (24.4 g/kg DM).
The low pH reached in our fermented cereal grains, particularly for rye and sorghum of 25% DM content, most likely resulted in growth inhibition of LAB, thereby further reducing acid production [31,32]. The observed pH value of the fermented grains (with low DM content), in our study, is in line with values obtained by Scholten [29] and Moran et al. [33] when fermenting liquid milled wheat. Niba et al. [34] observed that the pH value was significantly lower in fermented sorghum (ratio 1:1.4 water) with Lactobacillus plantarum after 24 h compared to the control fermented sorghum without LAB (3.51 vs 6.06). Scholten [29] measured a pH value of 3.9 after 24 h of incubation and a pH value of 3.7 after 48 h of incubation at 24 °C. During fermentation, the pH is decreased due to the production of organic acids (mainly lactic and acetic), and this may result in the activation of various enzymes, either endogenous to the grains or bacterial.
To the best of our knowledge, very rarely in the literature have the fermentation characteristics such as lactic acid production in rye been studied. However, in the case of sorghum, Niba et al. [34] found that the lactic acid content was significantly higher in fermented sorghum after 24 h compared to the control fermented sorghum without LAB (303 vs 13.2 mmol/L). Also, Niba et al. [35] found that lactic acid concentrations for 24 h fermentation of red and white sorghum were about 312 and 314 mmol/L, respectively. Nonetheless, Niba et al. [34] did find differences in the acetic acid content between control fermented sorghum without LAB and fermented sorghum (5.42 and 10.6 mmol/L, respectively). Overall, the pH value or the level of production of lactic acid from a grain with high DM content/coarse particle size was significantly different from the low DM content/smaller particle sizes (very fine particle size).
The levels of the main SCFA released during in vitro fermentation was affected by the type of ingredient. In the present study, both fermented rye and sorghum with 25% DM showed the largest production of acetic acid (3.02 and 1.49 g/kg DM, respectively) compared to that contained in 37.5% DM (0.68 and 0.72 for rye and sorghum g/kg DM, respectively) after 24 h fermentation. Acetic acid is a normal by-product of alcoholic fermentation by Saccharomyces cerevisiae, and of contaminating lactic acid and acetic acid bacteria [36]. However, the high acetic acid (0.83 g/L) accumulation in barley mash after fermentation might be attributed to endogenous acidogenic bacteria [36]. Nevertheless, it must be mentioned that we used a homofermentative LAB in the current study.

4.3. Viscosity

The current findings show that the fermented rye with low DM content (25% DM and 37.5% DM) had a positive influence on reducing viscosity, particularly after fermenting the rye for 24 h (1.52 and 1.55 mPa·s, respectively). Similarly, we can also observe that fermented sorghum with high DM content (75%) had very high viscosity values compared to other DM contents (25–62.5%). However, the viscosity values in fermented sorghum were low (ranging from 1.09 to 0.96 mPa·s for 25% DM content), but in the case of fermented rye with the same DM content (25%) the range was about 3.63 to 1.38 mPa·s.
To the best of our knowledge, there is little information about viscosity values of in vitro fermented rye and/or sorghum. Depending on the NSP degree of solubility, this comes down to establishing the hydrocolloids of greater or lesser viscosity [15,37]. The proportion of the main polysaccharides present in the NSP fraction of cereals, arabinoxylan, cellulose, and β-glucan, vary significantly depending on the grains [38]. According to Rodehutscord et al. [16], the extract viscosity for unfermented rye (n = 22), unfermented wheat (n = 29), and barley (n = 21) were 20, 1.94, and 1.12 mPa·s, respectively. Viscosity was positively correlated (p < 0.05) with the concentrations of some NSP fractions (soluble arabinose, r = 0.58; soluble xylose, r = 0.62; total arabinose, r = 0.82; total xylose, r = 0.72; galactose, r = 0.54; glucose, r = 0.45; cellulose, r = 0.46) in rye [16]. Overall, in our study, the low viscosity values of the fermented rye and sorghum contained very low DM contents (25% and 37.5%). This may reveal a breakdown of NSP, which was shown in the microscopic images as well as the fermentation characteristics (pH, lactic acid). However, unfortunately, we did not measure the NSP content in our study. It is well known that arabinoxylans enhance digesta viscosity [39], which might lead to a slower passage rate and impaired absorption of nutrients which, in turn, depress growth in monogastric animals [40,41]. Another negative effect of viscosity is that it has the ability to hold water in the digesta, producing sticky droppings and increased moisture of the litter in monogastric houses [20]. Furthermore, increased intestinal viscosity might change the morphology of the ileal villi in monogastric animals [39].

4.4. Microscopic Findings

In the present study, the fermented rye partially lacks a cell wall and starch granules seem to be large, spherical, and without holes. However, in the case of fermented sorghum, there were no visible signs of cell wall degradation, but the starch granules had many holes. In fermented rye (37.5% DM content), the pH value was about 3.75 and the level of L-lactic acid was about 13.9 g/kg DM. This suggests that extensive hydrolysis took place due to fermentation. Also, in the fermented sorghum (37.5% DM content), the pH value was about 3.83 and the level of L-lactic acid was about 12.4 g/kg DM. Consequently, several holes were visible on the starch granules. Similar images of the endosperm under the scanning electron microscopy were obtained by Meyer and Weipert as well as by Schwarz [42,43] on grains degraded by fungi, whereas starch granules in parts of the endosperm were extensively damaged. Furthermore, the protein matrix, which typically surrounds the starch granules was missing in these regions. Histochemical examination of the wheat endosperm led to a destruction of cell walls, starch granules, and storage proteins due to fungi action [44,45]. Overall, it appears that the efficiency of starch hydrolysis is mainly due to the ultrastructural differences among starch granules either in rye or in sorghum rather than to the characteristics of the enzymes or bacteria present [46]. Thus, it would appear from the microscopic findings that fermentation causes degradation of grain components, especially the cell wall, starch, and soluble sugars, by both intrinsic grain enzymes and enzymes emanating from the microorganisms, resulting in the formation of smaller compounds.

5. Conclusions

In the current study, rye achieves some good characteristics for fermentation (except for acetic acid content) after 24 h if it has a DM content before fermentation of 25% or 37.5% based on the values of pH and lactic acid content. However, in case of sorghum, only 12 h of fermentation is enough to achieve optimum fermentation characteristics based on the values of pH and lactic acid content, but again not for high acetic acid content (may affect the animals’ palatability). The present study confirmed that LAB can ferment rye and sorghum, particularly with 25% and 37.5% DM, successfully and demonstrated that both grains undergo rapid fermentation. The use of fermented rye or sorghum as a component in monogastric diets could be more practical for producers that cannot ferment multiple diets or have limited fermentation capacity. Additional research on fermentation of rye or sorghum must focus on the interaction between pH and time as it relates to biosafety.

Author Contributions

Conceptualization, C.B.H. and C.V.; Methodology, A.O., C.B.H., M.F.E.A., A.A.E.-W., J.H., K.R., T.S. and C.V.; Validation, A.O., A.A.E.-W., J.H. and C.V.; Formal analysis, A.O., A.A.E.-W., C.B.H., J.B.L., K.R. and T.S.; Investigation, A.O., C.B.H., M.F.E.A., A.A.E.-W. and C.V.; Resources, C.V.; Data curation, A.O., C.B.H., A.A.E.-W., J.B.L. and C.V.; Writing—original draft preparation, A.O., J.H., A.A.E.-W. and C.V.; Writing—review and editing, A.O., C.B.H., M.F.E.A., A.A.E.-W., J.B.L., J.H. and C.V.; Visualization, A.O., C.B.H., A.A.E.-W., J.B.L., J.H. and C.V.; Supervision, C.B.H., J.H. and C.V.; Project administration, C.B.H. and C.V.; Funding acquisition, C.V. All authors have read and agreed to the published version of the manuscript.

Funding

This Open Access publication was funded by the Deutsche Forschungsgemeinschaft (DFG, German Research Foundation) within the programme LE 824/10-1 “Open Access Publication Costs” and University of Veterinary Medicine Hannover, Foundation. TS is recipient of a PhD fellowship from the National Research Fund, Luxembourg (AFR15686728).

Institutional Review Board Statement

Not applicable.

Informed Consent Statement

Not applicable.

Data Availability Statement

The original contributions generated for the study are included in the article; further inquiries can be directed to the corresponding author.

Acknowledgments

We would like to thank Frances Sherwood-Brock for proofreading the manuscript to ensure correct English. Figure 1 and Figure 2 were created with BioRender.com at 22 December 2021.

Conflicts of Interest

The authors have declared that no competing interests exist.

References

  1. Sugiharto, S.; Ranjitkar, S. Recent advances in fermented feeds towards improved broiler chicken performance, gastrointestinal tract microecology and immune responses: A review. Anim. Nutr. 2019, 5, 1–10. [Google Scholar] [CrossRef] [PubMed]
  2. Olukomaiya, O.O.; Fernando, C.; Mereddy, R.; Li, X.; Sultanbawa, Y. Solid-state fermented plant protein sources in the diets of broiler chickens: A review. Anim. Nutr. 2019, 5, 319–330. [Google Scholar] [CrossRef] [PubMed]
  3. Engberg, R.M.; Hammershj, M.; Johansen, N.F.; Abousekken, M.S.; Steenfeldt, S.; Jensen, B.B. Fermented feed for laying hens: Effects on egg production, egg quality, plumage condition and composition and activity of the intestinal microflora. Br. Poult. Sci. 2009, 50, 228–239. [Google Scholar] [CrossRef] [PubMed]
  4. Waters, D.M.; Mauch, A.; Coffey, A.; Arendt, E.K.; Zannini, E. Lactic acid bacteria as a cell factory for the delivery of functional biomolecules and ingredients in cereal-based beverages: A review. Crit. Rev. Food Sci. Nutr. 2014, 55, 503–520. [Google Scholar] [CrossRef] [PubMed]
  5. Marco, M.L.; Heeney, D.; Binda, S.; Cifelli, C.J.; Cotter, P.D.; Foligné, B.; Gänzle, M.; Kort, R.; Pasin, G.; Pihlanto, A.; et al. Health benefits of fermented foods: Microbiota and beyond. Curr. Opin. Biotechnol. 2017, 44, 94–102. [Google Scholar] [CrossRef] [PubMed]
  6. Kårlund, A.; Gómez-Gallego, C.; Korhonen, J.; Palo-Oja, O.-M.; El-Nezami, H.; Kolehmainen, M. Harnessing microbes for sustainable development: Food fermentation as a tool for improving the nutritional quality of alternative protein sources. Nutrients 2020, 12, 1020. [Google Scholar] [CrossRef] [PubMed] [Green Version]
  7. Zentek, J.; Boroojeni, F.G. (Bio)Technological processing of poultry and pig feed: Impact on the composition, digestibility, anti-nutritional factors and hygiene. Anim. Feed Sci. Technol. 2020, 268, 114576. [Google Scholar] [CrossRef]
  8. Canibe, N.; Jensen, B.B. Fermented liquid feed—Microbial and nutritional aspects and impact on enteric diseases in pigs. Anim. Feed Sci. Technol. 2012, 173, 17–40. [Google Scholar] [CrossRef]
  9. Van Winsen, R.L.; Urlings, B.A.P.; Lipman, L.J.A.; Snijders, J.M.A.; Keuzenkamp, D.; Verheijden, J.H.M.; van Knapen, F. Effect of fermented feed on the microbial population of the gastrointestinal tracts of pigs. Appl. Environ. Microbiol. 2001, 67, 3071–3076. [Google Scholar] [CrossRef] [PubMed] [Green Version]
  10. Qin, L.; Liu, L.; Zeng, A.-P.; Wei, D. From low-cost substrates to Single Cell Oils synthesized by oleaginous yeasts. Bioresour. Technol. 2017, 245, 1507–1519. [Google Scholar] [CrossRef]
  11. Yu, Z.; Dong, B.; Lu, W. Dynamics of bacterial community in solid-state fermented feed revealed by 16S rRNA. Lett. Appl. Microbiol. 2009, 49, 166–172. [Google Scholar] [CrossRef] [PubMed]
  12. Bintsis, T. Lactic acid bacteria as starter cultures: An update in their metabolism and genetics. AIMS Microbiol. 2018, 4, 665–684. [Google Scholar] [CrossRef]
  13. Gous, P.W.; Fox, G.P. Review: Amylopectin synthesis and hydrolysis; Understanding isoamylase and limit dextrinase and their impact on starch structure on barley (Hordeum vulgare) quality. Trends Food Sci. Technol. 2017, 62, 23–32. [Google Scholar] [CrossRef] [Green Version]
  14. Yu, W.; Quek, W.P.; Li, C.; Gilbert, R.G.; Fox, G.P. Effects of the starch molecular structures in barley malts and rice adjuncts on brewing performance. Fermentation 2018, 4, 103. [Google Scholar] [CrossRef] [Green Version]
  15. Bederska-Łojewska, D.; Świątkiewicz, S.; Arczewska-Włosek, A.; Schwarz, T. Rye non-starch polysaccharides: Their impact on poultry intestinal physiology, nutrients digestibility and performance indices—A review. Ann. Anim. Sci. 2017, 17, 351–369. [Google Scholar] [CrossRef] [Green Version]
  16. Rodehutscord, M.; Rückert, C.; Maurer, H.P.; Schenkel, H.; Schipprack, W.; Knudsen, K.E.B.; Schollenberger, M.; Laux, M.; Eklund, M.; Siegert, W.; et al. Variation in chemical composition and physical characteristics of cereal grains from different genotypes. Arch. Anim. Nutr. 2016, 70, 87–107. [Google Scholar] [CrossRef]
  17. Smits, C.H.; Annison, G. Non-starch plant polysaccharides in broiler nutrition–towards a physiologically valid approach to their determination. World Poult. Sci. J. 1996, 52, 203–221. [Google Scholar] [CrossRef]
  18. Ananda, G.K.S.; Myrans, H.; Norton, S.L.; Gleadow, R.; Furtado, A.; Henry, R.J. Wild sorghum as a promising resource for crop improvement. Front. Plant Sci. 2020, 11, 1108. [Google Scholar] [CrossRef]
  19. Awika, J.M.; Rooney, L.W.; Waniska, R.D. Properties of 3-deoxyanthocyanins from sorghum. J. Agric. Food Chem. 2004, 52, 4388–4394. [Google Scholar] [CrossRef]
  20. Knudsen, K.E.B. Fiber and nonstarch polysaccharide content and variation in common crops used in broiler diets. Poult. Sci. 2014, 93, 2380–2393. [Google Scholar] [CrossRef]
  21. Borgelt, L. Einflüsse Einer Zweistufigen Vermahlung in der Mischfutterproduktion auf die Leistung und Gesundheit von Absetzferkeln; University of Veterinary Medicine Hannover, Foundation: Hannover, Germany, 2015. [Google Scholar]
  22. Bunte, S.; Keller, B.; Chuppava, B.; Kamphues, J.; Visscher, C.; El-Wahab, A.A. Influence of fermented diets on in vitro survival rate of some artificially inoculated pathogens—A preliminary study. Processes 2020, 8, 1345. [Google Scholar] [CrossRef]
  23. Dusel, G.; Kluge, H.; Glaser, K.; Simon, O.; Hartmann, G.; Lengerken, J.; Jeroch, H. An investigation into the variability of extract viscosity of wheat-relationship with the content of non-starch-polysaccharide fractions and metabolisable energy for broiler chickens. Arch. Anim. Nutr. 1997, 50, 121–135. [Google Scholar] [CrossRef] [PubMed]
  24. Bertoft, E. Understanding starch structure: Recent progress. Agronomy 2017, 7, 56. [Google Scholar] [CrossRef]
  25. Anguita, M.; Gasa, J.; Martín-Orúe, S.M.; Pérez, J.F. Study of the effect of technological processes on starch hydrolysis, non-starch polysaccharides solubilization and physicochemical properties of different ingredients using a two-step in vitro system. Anim. Feed Sci. Technol. 2006, 129, 99–115. [Google Scholar] [CrossRef]
  26. Tester, R.F.; Qi, X.; Karkalas, J. Hydrolysis of native starches with amylases. Anim. Feed Sci. Technol. 2006, 130, 39–54. [Google Scholar] [CrossRef]
  27. Khempaka, S.; Thongkratok, R.; Okrathok, S.; Molee, W. An evaluation of cassava pulp feedstuff fermented with A. oryzae, on growth performance, nutrient digestibility and carcass quality of broilers. J. Poult. Sci. 2014, 51, 71–79. [Google Scholar] [CrossRef] [Green Version]
  28. Sugiharto, S.; Yudiarti, T.; Isroli, I. Haematological and biochemical parameters of broilers fed cassava pulp fermented with filamentous fungi isolated from the Indonesian fermented dried cassava. Livest. Res. Rural. Dev. 2016, 28, 1–6. [Google Scholar]
  29. Scholten, R.H.J.; Van Der Peet-Schwering, C.M.C.; Hartog, L.A.D.; Balk, M.; Schrama, J.W.; Verstegen, M.W.A. Fermented wheat in liquid diets: Effects on gastrointestinal characteristics in weanling piglets. J. Anim. Sci. 2002, 80, 1179–1186. [Google Scholar] [CrossRef] [Green Version]
  30. Canibe, N.; Jensen, B. Fermented liquid feed and fermented grain to piglets-effect on gastrointestinal ecology and growth performance. Livest. Sci. 2007, 108, 198–201. [Google Scholar] [CrossRef]
  31. Gänzle, M.G.; Ehmann, M.; Hammes, W.P. Modeling of growth of Lactobacillus sanfranciscensis and Candida milleri in response to process parameters of sourdough fermentation. Appl. Environ. Microbiol. 1998, 64, 2616–2623. [Google Scholar] [CrossRef] [Green Version]
  32. Brandt, M.J.; Hammes, W.P. Effects of process parameters on growth and metabolism of Lactobacillus sanfranciscensis and Candida humilis during rye sourdough fermentation. Eur. Food Res. Technol. 2004, 218, 333–338. [Google Scholar] [CrossRef]
  33. Moran, C.A.; Scholten, R.H.J.; Tricarico, J.M.; Brooks, P.H.; Verstegen, M.W.A. Fermentation of wheat: Effects of backslopping different proportions of pre-fermented wheat on the microbial and chemical composition. Arch. Anim. Nutr. 2006, 60, 158–169. [Google Scholar] [CrossRef] [PubMed]
  34. Niba, A.T.; Kouchika, H.; Kudi, A.C.; Beal, J.D.; Brooks, P.H. Effect of micro-organism and particle size on fermentation of sorghum and maize for poultry feed. Afr. J. Biotechnol. 2013, 12, 4147–4157. [Google Scholar]
  35. Niba, A.; Beal, J.; Kudi, A.; Brooks, P. Potential of bacterial fermentation as a biosafe method of improving feeds for pigs and poultry. Afr. J. Biotechnol. 2009, 8. [Google Scholar] [CrossRef]
  36. Tse, T.; Wiens, D.; Shen, J.; Beattie, A.; Reaney, M. Saccharomyces cerevisiae fermentation of 28 barley and 12 oat cultivars. Fermentation 2021, 7, 59. [Google Scholar] [CrossRef]
  37. Knudsen, K.E.B.; Jørgensen, H. Intestinal degradation of dietary carbohydrates-from birth to maturity. In Digestive Physiology of Pigs, Proceedings of the 8th Symposium, Swedish University of Agricultural Sciences, Uppsala, Sweden, 20–22 June 2000; CABI Publishing: Oxfordshire, UK, 2001. [Google Scholar]
  38. Izydorczyk, M.S.; Dexter, J.E. Barley β-glucans and arabinoxylans: Molecular structure, physicochemical properties, and uses in food products—A Review. Food Res. Int. 2008, 41, 850–868. [Google Scholar] [CrossRef]
  39. Teirlynck, E.; Bjerrum, L.; Eeckhaut, V.; Huygebaert, G.; Pasmans, F.; Haesebrouck, F.; Dewulf, J.; Ducatelle, R.; Van Immerseel, F. The cereal type in feed influences gut wall morphology and intestinal immune cell infiltration in broiler chickens. Br. J. Nutr. 2009, 102, 1453–1461. [Google Scholar] [CrossRef] [PubMed]
  40. Bedford, M.R.; Classen, H.L. Reduction of intestinal viscosity through manipulation of dietary rye and pentosanase concentration is effected through changes in the carbohydrate composition of the intestinal aqueous phase and results in improved growth rate and food conversion efficiency of broiler chicks. J. Nutr. 1992, 122, 560–569. [Google Scholar] [CrossRef] [PubMed]
  41. van Krimpen, M.M.; Torki, M.; Schokker, D. Effects of rye inclusion in grower diets on immune competence-related parameters and performance in broilers. Poult. Sci. 2017, 96, 3324–3337. [Google Scholar] [CrossRef] [PubMed]
  42. Meyer, D.; Weipert, D. Beeinflussung der Qualität von Weizen durch den Befall mit Fusarium culmorum. Getreide Mehl Brot (1972) 1986, 40, 35–39. [Google Scholar]
  43. Schwarz, P.; Casper, H.; Barr, J.; Musial, M. Impact of Fusarium head blight on malting and brewing quality of barley. In Fusarium Head Blight of Wheat and Barley; Leonard, K.J., Bushnell, W.R., Eds.; APS Press: St. Paul, MN, USA, 2003; pp. 395–419. [Google Scholar]
  44. Bechtel, D.; Kaleikau, L.A.; Gaines, R.; Seitz, L. The effects of Fusarium graminearum infection on wheat kernels. Cereal Chem. 1985, 62, 191–197. [Google Scholar]
  45. Seitz, L.M.; Bechtel, D.B. Chemical, physical, and microscopical studies of scab-infected hard red winter wheat. J. Agric. Food Chem. 1985, 33, 373–377. [Google Scholar] [CrossRef]
  46. Tang, H.; Watanabe, K.; Mitsunaga, T. Structure and functionality of large, medium and small granule starches in normal and waxy barley endosperms. Carbohydr. Polym. 2002, 49, 217–224. [Google Scholar] [CrossRef]
Figure 1. Experimental design for fermentation process for rye and sorghum, respectively. (Figure was created with BioRender.com at 22 December 2021).
Fermentation 08 00155 g001
Figure 2. Macroscopic appearance of fermented rye (A) and sorghum (B) according to DM content before fermentation and time of fermentation. (Figure was created with BioRender.com at 22 December 2021).
Fermentation 08 00155 g002
Figure 3. Scanning electron microscope images (×1000) of (A) = unfermented, (B) = fermented rye with 37.5% DM content, and (C) = unfermented, (D) = fermented sorghum with 37.5% DM content. Endosperm cells were filled with tightly packed large and small starch granules surrounded by the protein matrix. A relatively smooth surface with fewer wrinkles usually characterizes sorghum grains compared to that of rye. After fermenting the rye, the matrix was usually in the form of small and separated patches, whereas in sorghum, continuous sheets of matrix proteins were often found to intervene between starch granules or between these and cell walls.
Fermentation 08 00155 g003
Figure 4. Scanning electron microscope images (×1000) of starch granules in (A) = unfermented, (B) = fermented rye with 37.5% DM content, and (C) = unfermented, (D) = fermented sorghum with 37.5% DM content. Differentiation of starch granules into two main size categories was apparent. The morphology of the rye starch granule varied from large-oval to small-irregular in shape, without any pores. Less matrix material occupying the spaces between starch granules was observed in rye compared to sorghum.
Fermentation 08 00155 g004
Table 1. Particle size distribution (% DM) in rye and sorghum (n = 4) according to different DM-contents after different durations of fermentation (mean ± SD).
GrainSieve Hole, mm/hExperimental Groups, DM Content in %p-Value
2537.55062.575
Rye<0.2/2467.4 b ± 3.8173.9 a ± 0.7163.2 b ± 2.0346.4 c ± 5.4124.7 d ± 2.10<0.0001
>1.0/2414.3 d ± 2.5017.0 d ± 0.5926.9 c ± 1.4638.6 b ± 3.5149.8 a ± 2.75<0.0001
Sorghum<0.2/2422.3 ab ± 2.7222.1 ab ± 3.6019.5 ab ± 0.9924.2 a ± 2.6517.5 b ± 3.32<0.0240
>1.0/2424.8 ab ± 2.8322.1 b ± 1.6727.9 a ± 0.6021.1 b ± 2.4527.3 a ± 1.28<0.0010
a,b,c,d Means within a row without a common superscript differ (p < 0.05).
Table 2. Protein content (g/kg DM) of rye and sorghum (n = 4) according to different DM-contents after different durations of fermentation (mean ± SD).
GrainTime, hExperimental Groups, DM Content in %p-Value
2537.55062.575
Rye24105 a ± 1.95106 a ± 1.48105 a ± 0.72104 a ± 0.33106 a ± 1.510.0913
48106 a ± 1.51106 ab ± 1.14106 ab ± 0.66104 b ± 0.53107 a ± 0.660.0031
Sorghum24132 a ± 4.25129 ab ± 1.88126 b ± 1.05128 ab ± 0.97128 ab ± 1.660.0428
48132 a ± 2.97131 a ± 0.82129 a ± 0.41129 a ± 0.96131 a ± 2.100.0934
a,b Means within a row without a common superscript differ (p < 0.05).The mean protein content (g/kg DM) at 0 h for rye and sorghum were 104 ± 0.48 and 130 ± 0.94, respectively.
Table 3. Lactic acid bacteria counts (log10 CFU/g) of rye and sorghum (n = 4) according to different DM contents after different durations of fermentation (mean ± SD).
GrainTime, hExperimental Groups, DM Content in %p-Value
2537.55062.575
Rye248.93 a ± 0.089.02 a ± 0.079.10 a ± 0.068.98 a ± 0.127.15 b ± 1.51<0.0001
489.03 a ± 0.179.07 a ± 0.079.21 a ± 0.039.42 a ± 0.126.32 b ± 0.66<0.0001
Sorghum248.94 a ± 0.039.17 a ± 0.019.21 a ± 0.069.22 a ± 0.055.93 b ± 0.50<0.0001
488.77 a ± 0.108.90 a ± 0.188.86 a ± 0.119.21 a ± 0.136.38 b ± 0.66<0.0001
a,b Means within a row without a common superscript differ (p < 0.05).The mean LAB counts (log10 CFU/g) at 0 h for rye and sorghum were 3.47 ± 0.51 and 3.69 ± 0.51, respectively.
Table 4. pH values of rye and sorghum (n = 4) according to different DM contents after different durations of fermentation (mean ± SD).
GrainTime, h
n = 4
Experimental Groups, DM Content in %p-Value
2537.55062.575
Rye66.13 c ± 0.016.14 bc ± 0.026.17 b ± 0.036.48 a ± 0.016.49 a ± 0.01<0.001
124.55 c ± 0.354.16 d ± 0.105.36 b ± 0.216.27 a ± 0.076.49 a ± 0.23<0.001
243.57 d ± 0.013.75 cd ± 0.023.91 c ± 0.014.93 b ± 0.266.42 a ± 0.03<0.001
483.55 e ± 0.023.67 d ± 0.013.83 c ± 0.014.24 b ± 0.106.40 a ± 0.03<0.001
Sorghum65.95 e ± 0.025.87 d ± 0.046.20 c ± 0.036.37 b ± 0.026.54 a ± 0.02<0.001
123.93 d ± 0.054.24 c ± 0.035.82 b ± 0.035.87 b ± 0.056.51 a ± 0.01<0.001
243.77 e ± 0.013.83 d ± 0.013.99 c ± 0.014.09 b ± 0.016.38 a ± 0.06<0.001
483.77 d ± 0.013.79 d ± 0.033.98 c ± 0.014.08 b ± 0.016.27 a ± 0.04<0.001
a,b,c,d,e Means within a row without a common superscript differ (p < 0.05).The average pH values at 0 h for rye and sorghum were 6.50 ± 0.06 and 6.54 ± 0.10, respectively.
Table 5. L-lactic acid content (g/kg DM) of rye and sorghum (n = 4) according to different DM-contents after different durations of fermentation (mean ± SD).
GrainTime, hExperimental Groups, DM Content in %p-Value
2537.55062.575
Rye2418.7 a ± 0.6713.9 b ± 0.779.85 c ± 1.553.75 d ± 1.040.36 e ± 0.04<0.0001
4822.1 a ± 1.1117.3 b ± 1.7712.4 c ± 1.337.67 d ± 1.670.55 e ± 0.21<0.0001
Sorghum2422.2 a ± 3.8012.4 b ± 1.4314.0 b ± 0.8911.75 b ± 1.200.13 c ± 0.01<0.0001
4824.4 a ± 2.9116.5 b ± 0.7515.5 bc ± 0.3613.4 c ± 0.430.19 d ± 0.09<0.0001
a,b,c,d,e Means within a row without a common superscript differ (p < 0.05).
Table 6. Fatty acid concentrations (g/kg DM) of rye and sorghum (n = 4) according to different DM contents after different durations of fermentation (mean ± SD).
GrainItemTime, hExperimental Groups, DM Content in %p-Value
2537.55062.575
RyeAcetic acid243.02 a ± 0.520.68 b ± 0.110.27 b ± 0.180.31 b ± 0.140.31 b ± 0.04<0.0001
482.32 a ± 1.720.41 b ± 0.070.57 b ± 0.200.45 b ± 0.260.61 b ± 0.24<0.0174
Propionic acid24ND0.12 a ± 0.010.04 c ± 0.030.02 bc ± 0.010.02 bc ± 0.01<0.0001
480.05 ab ± 0.070.08 a ± 0.010.07 ab ± 0.030.00 b ± 0.010.00 b ± 0.00<0.0092
Butyric acid240.72 a ± 0.320.06 b ± 0.060.01 b ± 0.010.01 b ± 0.000.01 b ± 0.01<0.0001
480.37 a ± 0.450.03 a ± 0.010.04 a ± 0.010.01 a ± 0.010.01 a ± 0.00<0.0942
SorghumAcetic acid241.49 a ± 0.280.72 b ± 0.140.60 b ± 0.100.49 b ± 0.100.16 c ± 0.02<0.0001
481.97 a ± 0.371.30 b ± 0.170.87 c ± 0.150.61 c ± 0.100.23 d ± 0.01<0.0001
Propionic acid240.04 cd ± 0.010.07 ab ± 0.010.10 a ± 0.010.06 bc ± 0.010.02 d ± 0.00<0.0001
480.04 c ± 0.010.05 b ± 0.010.10 a ± 0.000.07 b ± 0.000.02 d ± 0.00<0.0001
Butyric acid240.08 a ± 0.040.04 b ± 0.010.01 b ± 0.01NDND<0.0003
480.12 a ± 0.030.07 b ± 0.020.00 c ± 0.00NDND<0.0001
a,b,c,d Means within a row without a common superscript differ (p < 0.05). ND: not detected.
Table 7. Viscosity values (mPa·s) in rye and sorghum (n = 4) according to different DM contents after different durations of fermentation (mean ± SD).
GrainTime, hExperimental Groups, DM Content in %p-Value
2537.55062.575
Rye63.59 bc ± 0.283.62 bc ± 0.123.37 c ± 0.424.18 ab ± 0.284.62 a ± 0.29<0.0001
121.72 e ± 0.102.54 c ± 0.112.12 d ± 0.053.10 b ± 0.174.65 a ± 0.11<0.0001
241.52 d ± 0.071.55 d ± 0.021.90 c ± 0.043.01 b ± 0.154.65 a ± 0.09<0.0001
481.38 c ± 0.151.41 c ± 0.051.65 c ± 0.062.32 b ± 0.264.61 a ± 0.13<0.0001
Sorghum60.99 b ± 0.061.02 b ± 0.051.11 a ± 0.101.16 ab ± 0.091.31 a ± 0.13<0.0008
120.97 b ± 0.021.00 b ± 0.071.07 b ± 0.021.07 b ± 0.021.31 a ± 0.13<0.0005
240.96 b ± 0.020.98 b ± 0.061.03 b ± 0.021.05 b ± 0.051.26 a ± 0.08<0.0001
480.96 b ± 0.030.98 b ± 0.070.98 b ± 0.061.00 b ± 0.011.21 a ± 0.08<0.0001
a,b,c,d,e Means within a row without a common superscript differ (p < 0.05). The average viscosity values at 0 h for rye and sorghum were 4.04 and 1.29 mPa·s, respectively.
Publisher’s Note: MDPI stays neutral with regard to jurisdictional claims in published maps and institutional affiliations.

