Article

Oenological Characterization of Native Hanseniaspora uvarum Strains

by
Stojan Mančić
1,
Sandra Stamenković Stojanović
1,
Bojana Danilović
1,
Natalija Djordjević
1,
Marko Malićanin
2,
Miodrag Lazić
1 and
Ivana Karabegović
1,*
1
Faculty of Technology, University of Niš, Bulevar oslobodjenja 124, 16000 Leskovac, Serbia
2
Faculty of Agriculture, University of Niš, Kosančićeva 4, 37000 Kruševac, Serbia
*
Author to whom correspondence should be addressed.
Fermentation 2022, 8(3), 92; https://doi.org/10.3390/fermentation8030092
Submission received: 30 January 2022 / Revised: 17 February 2022 / Accepted: 21 February 2022 / Published: 24 February 2022
(This article belongs to the Special Issue New Aspect on Wine Fermentation)

Abstract

:
The utilization of native yeast strains associated with a distinct terroir for autochthonous grape types represents a novel trend in winemaking, contributing to the production of unique wines with regional character. Hence, this study aimed to isolate native strains of the yeast H. uvarum from the surface of various fruits and to characterize its fermentation capability in Prokupac grape must. Out of 31 yeasts, 8 isolates were identified as H. uvarum. The isolates were able to grow at low (4 °C) temperatures, SO2 concentrations up to 300 ppm and ethanol concentrations up to 5%. Additionally, they provided a good profile of organic acids during the microvinification of sterile grape must. Although the content of acetic acid (0.54–0.63 g/L) was relatively high, the sniffing test proved that the yeast isolates developed a pleasant aroma characterized as fruity. All H. uvarum isolates produced twice the concentration of glycerol compared to commercial wine yeast Saccharomyces cerevisiae, contributing to the fullness and sweetness of the wine. The results for pure and sequential fermentation protocols confirmed that the selected S-2 isolate has good oenological characteristics, the capability to reduce the ethanol content (up to 1% v/v) and a potential to give a distinctive note to Prokupac-grape wines.

1. Introduction

Yeasts play one of the most important roles in the winemaking process. They not only ferment sugar into ethanol and CO2 but also release many aromatic compounds and enzymes into the wine. Hence, the flavor and quality of the wine are largely influenced by the yeast strain [1,2,3]. Indigenous non-Saccharomyces yeast strains are gaining increasing attention in winemaking, due to their good fermentative characteristics and production of specific metabolites that give the wine a recognizable note [4,5,6,7,8,9]. Additionally, it is believed that specific autochthonous yeast strains can be associated with specific regions and impart to wines a more typical, regional character. Given that unique and authentic wines are gaining consumers’ attention more and more, the pursuit of new, unexploited yeasts suitable for the winemaking industry becomes inevitable.
Many non-Saccharomyces yeasts have been characterized and applied in the wine industry [10,11]. Among them, the teleomorph genus Hanseniaspora, morphologically characterized as consisting of apiculate yeasts with bipolar buds, has a special potential in wine production [12]. The Hanseniaspora genus has good oenological characteristics, with a positive effect on the color, taste, aroma and stability of wine [9]. This genus, which has its most significant role at the beginning of the fermentation, is especially important in wine production, due to its capacity to produce secondary metabolites such as higher alcohols, glycerol and esters, which increase the aromatic complexity and quality of the wine [13,14,15,16].
In particular, Hanseniaspora uvarum/Kloeckera apiculata is one of the main fermentative yeasts associated with vineyards, making up 51–89% of the total non-Saccharomyces yeast microbiota [17]. This species has been described as suitable and beneficial for winemaking purposes due to its ability to increase the complexity of the chemical composition of wine [16]. It has the ability to produce high concentrations of esters, especially isoamyl and isobutyl acetate, which contribute to the pleasant fruity aroma in wines [10,13]. Literature data showed that during the production of wine from different grape varieties, this yeast species produced higher amounts of glycerol compared to S. cerevisiae [18,19,20]. Although glycerol does not affect the aromatic profile of wine, it has a positive effect on the mouthfeel properties, providing the fullness and sweetness sensation [21,22]. In addition, H. uvarum produces enzymes such as β-glucosidase and protease in larger quantities than S. cerevisiae. These enzymes are especially important because of their property of enhancing the release of aroma compounds, thus contributing to the enrichment of the sensory characteristics of wine in terms of tropical fruits, berries and floral notes [16,23]. Although H. uvarum was previously mostly known as a high producer of volatile acidity, which is considered to have negative effect on the quality of wine, new research has shown that this ability is strain-dependent, and that certain strains are able to produce acceptable amounts of volatile acidity [24].
The beneficial effects of native non-Saccharomyces yeasts such as H. uvarum are especially pronounced in their application to indigenous grape varieties. According to the principles of precision oenology, which is a new concept in winemaking, the production of premium wines demands a perfect match of yeast strains and grape varieties originating from the same locality [25,26]. Our previous research showed that H. uvarum species can be isolated from the surfaces of different fruits grown in the same area as the autochthonous grape variety Prokupac. Although the Prokupac grape has a long tradition in the production of red wines, it was neglected for years due to excessive use in international wine varieties. Recently, this grape has gained attention for its recognizable character, thus initiating research on its utilization with different yeast strains to produce high-quality wines [27].
Therefore, this study aimed to investigate the oenological potential of native H. uvarum strains from the epiphytic fruit microbiota specific to geographical wine regions in which the autochthonous grape variety Prokupac is grown. Use of the microbial community naturally present on different fruits’ surfaces instead of vineyard and winery microbiota represents a novel approach in the pursuit of non-exploited yeast strains with good oenological potential.

2. Materials and Methods

2.1. Isolation and Identification of the Yeasts

Yeasts were isolated from different fruits (wild blackberry, wild pear, plum and wild plum) in the territory of southern Serbia. Fruit samples were collected at the optimum maturity stage for fruit harvest in localities far away from the main and local roads. Samples were collected in sterile plastic bottles, transferred to the laboratory and processed within 24 h. A total of 10 g of each sample was separately crushed and mixed with 90 mL of sterile saline solution (0.8% w/w, NaCl). The samples were serially diluted and plated on Sabouraud dextrose agar plates (SDA) (Torlak, Belgrade, Serbia) supplemented with 80 mg/L of chloramphenicol (Merck, Darmstadt, Germany) and 5 mg/L of gentamicin sulfate (Merck, Darmstadt, Germany), in order to prevent the growth of bacteria. The plates were incubated at 25 °C for 48 h, and the individual colonies were transferred to new SDA plates using the streak plate technique. Purification of the isolates was performed on SDA plates in a minimum of three consecutive transfers. The purity of the obtained yeast cultures was confirmed by a microscope check. Identification of yeast isolates was performed using a rapid biochemical API 20C AUX yeast test (bioMérieux, Marcy-l’Etoile, France). Molecular identification of representative yeast isolates was performed using ITS1 (5′-TCCGTAGGTGAACCTGCG-3′) and ITS4 (5′-TCCTCCGCTTATTGATATGC-3′) primers, and the results confirmed that the isolates belonged to Hanseniaspora uvarum (data not shown). Yeast isolates were stored in Sabouraud dextrose broth (SDB) (Torlak, Belgrade, Serbia) supplemented with glycerol (20%) at −20 °C, until required.

2.2. Fermentative Characteristics

In order to determine the fermentative characteristics, H. uvarum isolates were subjected to a set of standard tests [2]. Briefly, the growth of H. uvarum isolates at different temperatures was analyzed by plating the strains on SDA plates and incubating at 4, 10, 15 and 20 °C for 48 h. Visible growth on the plates was characterized as positive. Sugar fermentation was determined by inoculation of 0.2 mL of overnight culture to 10 mL of fermentative broth containing (g/L): 10 peptone 4 (Torlak, Belgrade, Serbia), 20 glucose (Centrohem, Stara Pazova, Serbia) and 20 fructose (Merck, Darmstadt, Germany). The production of CO2, which was determined by gas collection in Durham tubes, was stated as positive. The ability to grow at different concentrations of ethanol was monitored by transferring 0.2 mL of overnight yeast culture to 10 mL of fermentative broth supplemented with 3, 5, 7, 9, 11, 13 and 15% v/v of ethanol. Incubation was performed for 24 h at 25 °C, and after that the absorbance was measured at 620 nm (Pye Unicam spectrophotometer, Cambridge, UK). The results were shown as a percentage of yeast cell survival compared to the control grown with no ethanol. In order to determine the resistance of yeast strains to SO2, overnight cultures were plated on fermentative agar plates supplemented with 50, 100, 200 and 300 ppm of potassium metabisulphite (Zorka, Šabac, Serbia). After incubation at 25 °C for 48 h, the appearance of colonies was stated as positive.

2.3. Agar Plate Screening for Aroma Production

To provide a basic insight into the potential for yeast aroma production, the olfactory “sniffing“ method was used [28]. This simple and quick approach was used to perform the initial screening of the aromas that the yeast isolates produced and to detect off-flavors. H. uvarum isolates were streaked on agar plates containing grape juice, glucose and agar and incubated for 7 days at room temperature. After incubation, sensory analysis was performed by a trained 8-person sensory panel, sniffing directly from the plate. The resulting aromas were described as pleasant or unpleasant, with different levels of intensity (weak, medium or strong).

2.4. Microvinification

The Prokupac grape (Tri Morave wine region, Central Serbia) was used for microvinification, according to a previously described procedure [2]. The composition of the must was 22.6 °Brix, total acid was 7.4 g/L and the pH value was 3.59. Microvinifications were performed in 300 mL Erlenmeyer flasks containing 100 mL of grape must, 131 mg/L of NH4H2PO4 and 75 mg/L of (NH4)2SO4. The grape must was autoclaved at 100 °C for 20 min and inoculated with a 48 h old yeast culture (approximately 106 CFU/mL). Grape must inoculated with the commercial wine yeast Saccharomyces cerevisiae (Lalvin ICV D254, Lallemand, Montreal, QC, Canada, 106 CFU/mL) was used as a control sample. Microvinifications were carried out at 25 °C, and sampling was performed daily. The change in Brix value was monitored using a refractometer (ATC Refractometer, Giorgio Bormac, Carpi, Italy). The number of cells was determined by measuring the absorbance at 620 nm and calculating according to the standard curve. Simultaneously, the release of CO2 was determined by measuring the mass loss during fermentation. Further, in order to evaluate the oenological potential of native H. uvarum isolates in real conditions, the isolate with the best fermentative performance was used for non-sterile Prokupac-grape-must fermentation at a laboratory scale (3 L). A total of 3 fermentation trials were performed: pure fermentation with the selected H. uvarum isolate (final cell number was 106 CFU/mL), sequential fermentations initially inoculated with the selected H. uvarum isolate and S. cerevisiae (inoculation with the commercial strain was carried out after °Brix reduction by 3 degrees) and pure fermentation with S. cerevisiae (control). Potassium-metabisufite (2 mg/L, Centrohem, Stara Pazova, Serbia) and pectolytic enzyme EXV (2 mg/L, Lallemand, Montreal, QC, Canada) were added to the must at the beginning of fermentation, and Fermaid E (30 mg/L, Lallemand, Montreal, QC, Canada) was added after 72 h. The fermentation temperature was maintained at 18 °C. The cap was punched down by hand three times per day, and the fermentations were considered complete when the residual sugar content was below 4 g/L. All fermentation trial experiments were performed in triplicate. The resulting wine samples produced with the selected H. uvarum isolate in pure (HU), sequential inoculation with commercial S. cerevisiae (HUSC) and the control sample inoculated with S. cerevisiae (SC) were further subjected to HPLC analysis, and total phenols, anthocyanins and flavonoids were determined by routine spectrophotometric methods, as we previously described in detail in [29]. Prior spectrophotometrically analyzed wine samples were diluted 1:10 (v/v) with deionized water and pH values were adjusted to 3.6 with 1M HCl or NaOH (Zorka Šabac, Serbia), and. The absorbances of the diluted wine samples were measured at 420, 520 and 620 nm, and further used for the calculation of the wine color intensity (CI = A420 + A520 + A620) and color hue (H = A420/A520).

2.5. HPLC Analysis

Wine samples were analyzed using high-pressure liquid chromatography (HPLC) on an Agilent 1100 Series chromatograph (Agilent Technologies, Santa Clara, CA, USA) using an Aminex HPX-87H column [30]. Organic acid concentrations (tartaric, malic, lactic, citric and acetic acids) were determined using a diode array detector (DAD) at 210 nm, while ethanol, glycerol and sugars (glucose and fructose) detection was carried out using a refractive index detector (RID). The mobile phase was isocratic, containing 5 mM H2SO4 in deionized water, at a flow rate of 0.6 mL/min. Before analysis, all samples were diluted 1:1 with deionized water, centrifuged (Th16B centrifuge, Zhengzhou, China) at 6000 rpm for 15 min and filtered through a syringe filter with a pore diameter of 0.45 μm. Standard compounds (sugars, organic acids) were purchased from CPAchem (CPAchem Ltd., Bogomilovo, Bulgaria), and calibration curves were prepared in the concentration range typical for Prokupac grape must and wine. The identification was based on the retention times, and the concentration of each compound was obtained using calibration curves for the above-mentioned compounds as adequate external standards. The results were expressed in g/L.

2.6. Statistical Analysis

All experiments were conducted in triplicate and the results expressed as the average value with the standard deviation. Significant differences among samples were calculated using one-way ANOVA with Tukey’s HSD post hoc test (software IBM SPSS Statistics). Samples with a p-value lower than 0.05 were considered significantly different. PCA analysis was performed using Statistica software.

3. Results

The aim of this study was to isolate and characterize native strains of the yeast H. uvarum present on the surface of various ripe fruits harvested in the territory of Southern Serbia that, besides having good fermentative characteristics, can be associated with the specific terroir of the region where the autochthonous grape variety Prokupac is traditionally grown.

3.1. Isolation and Identification of the Yeasts

A total of 31 yeasts were isolated from wild blackberries, wild pear, plum and wild plum. Out of a total of 17 isolates isolated from wild blackberry, 4 isolates (Kd-8, Kd-9, Kd-10 and Kd-13) were identified as H. uvarum. Among yeast strains isolated from wild plum (Sd-1) and plum (S-2), 2 isolates were identified as H. uvarum. Of the total number of isolates obtained from wild pear surfaces (Kr-2 and Kr-4), 25% were identified as H. uvarum.

3.2. Fermentative Characteristics and Aroma Production

All tested isolates showed good resistance to low temperatures. Growth was maintained even at 4 °C. In addition, they tolerated SO2 concentrations up to 300 ppm (Table 1). On the other hand, ethanol concentration was a growth-limiting factor. An increase in ethanol concentration of up to 5% reduced the growth of H. uvarum isolates by almost 60% (Figure 1). With a further increase in the ethanol concentration, the growth of the tested isolates decreased significantly (Figure 1).
The agar screening method was used to test the aroma production of the yeasts (Table 1). Most of the H. uvarum isolates had the ability to create a pleasant aroma of medium intensity, except Kr-2 which had a strong intensity of unpleasant aroma and Kd-9 which had a strong intensity of pleasant aroma characterized as fruity. When grown on standard SMB medium, cell densities were in the range of 7.24–7.51 log CFU/mL, with Kd-9 reaching the highest cell number among the analyzed isolates (Table 1).
All the tested isolates were able to ferment sugar, with a consumption rate much lower than S. cerevisiae. After 10 days of fermentation, S. cervisiae consumed all of the sugar initially present in the must, while H. uvarum isolates managed to consume less than half. The best sugar consumption among the H. uvarum strains was demonstrated by the S-2 isolate (Figure 2).
The release of CO2 in the first two days of fermentation was similar to that of the control sample inoculated with S. cerevisiae: about 11 g/L/day. As the fermentation continued, CO2 release gradually decreased (Figure 3a). The total amount of CO2 released in the control sample was 95.78 ± 0.45 g/L (Figure 3b). H. uvarum isolates released 60–70% less CO2 compared to the control sample (Figure 3b). The highest amount of CO2 released per day, among the H. uvarum isolates was recorded on the third day of fermentation and ranged from 4.05 to 5.85 g/L/day (Figure 3a). Isolate S-2 stood out from the other isolates, as it released 38.32 ± 0.14 g/L of CO2, which was about 15–30% more than the other isolates (Figure 3b).
During the microvinification process, the total number of viable cells was also monitored. Figure 4 shows the growth kinetics during fermentation. In the first two days, S. cerevisiae reached the exponential growth phase, with the highest cell number of 6.56 log CFU/mL. After that point, the maximum number of cells did not change significantly up to the end of the fermentation process (up to 6.64 log CFU/mL). All H. uvarum isolates demonstrated a similar growth curve. They entered the stationary phase much later than S. cerevisiae, reaching a maximum cell number of 6.36–6.42 log CFU/mL at the end of fermentation. The maximum number of cells reached by H. uvarum isolates was significantly lower than for S. cerevisiae, even though the same number of cells (106 CFU/mL) was inoculated into all microvinifiers initially.

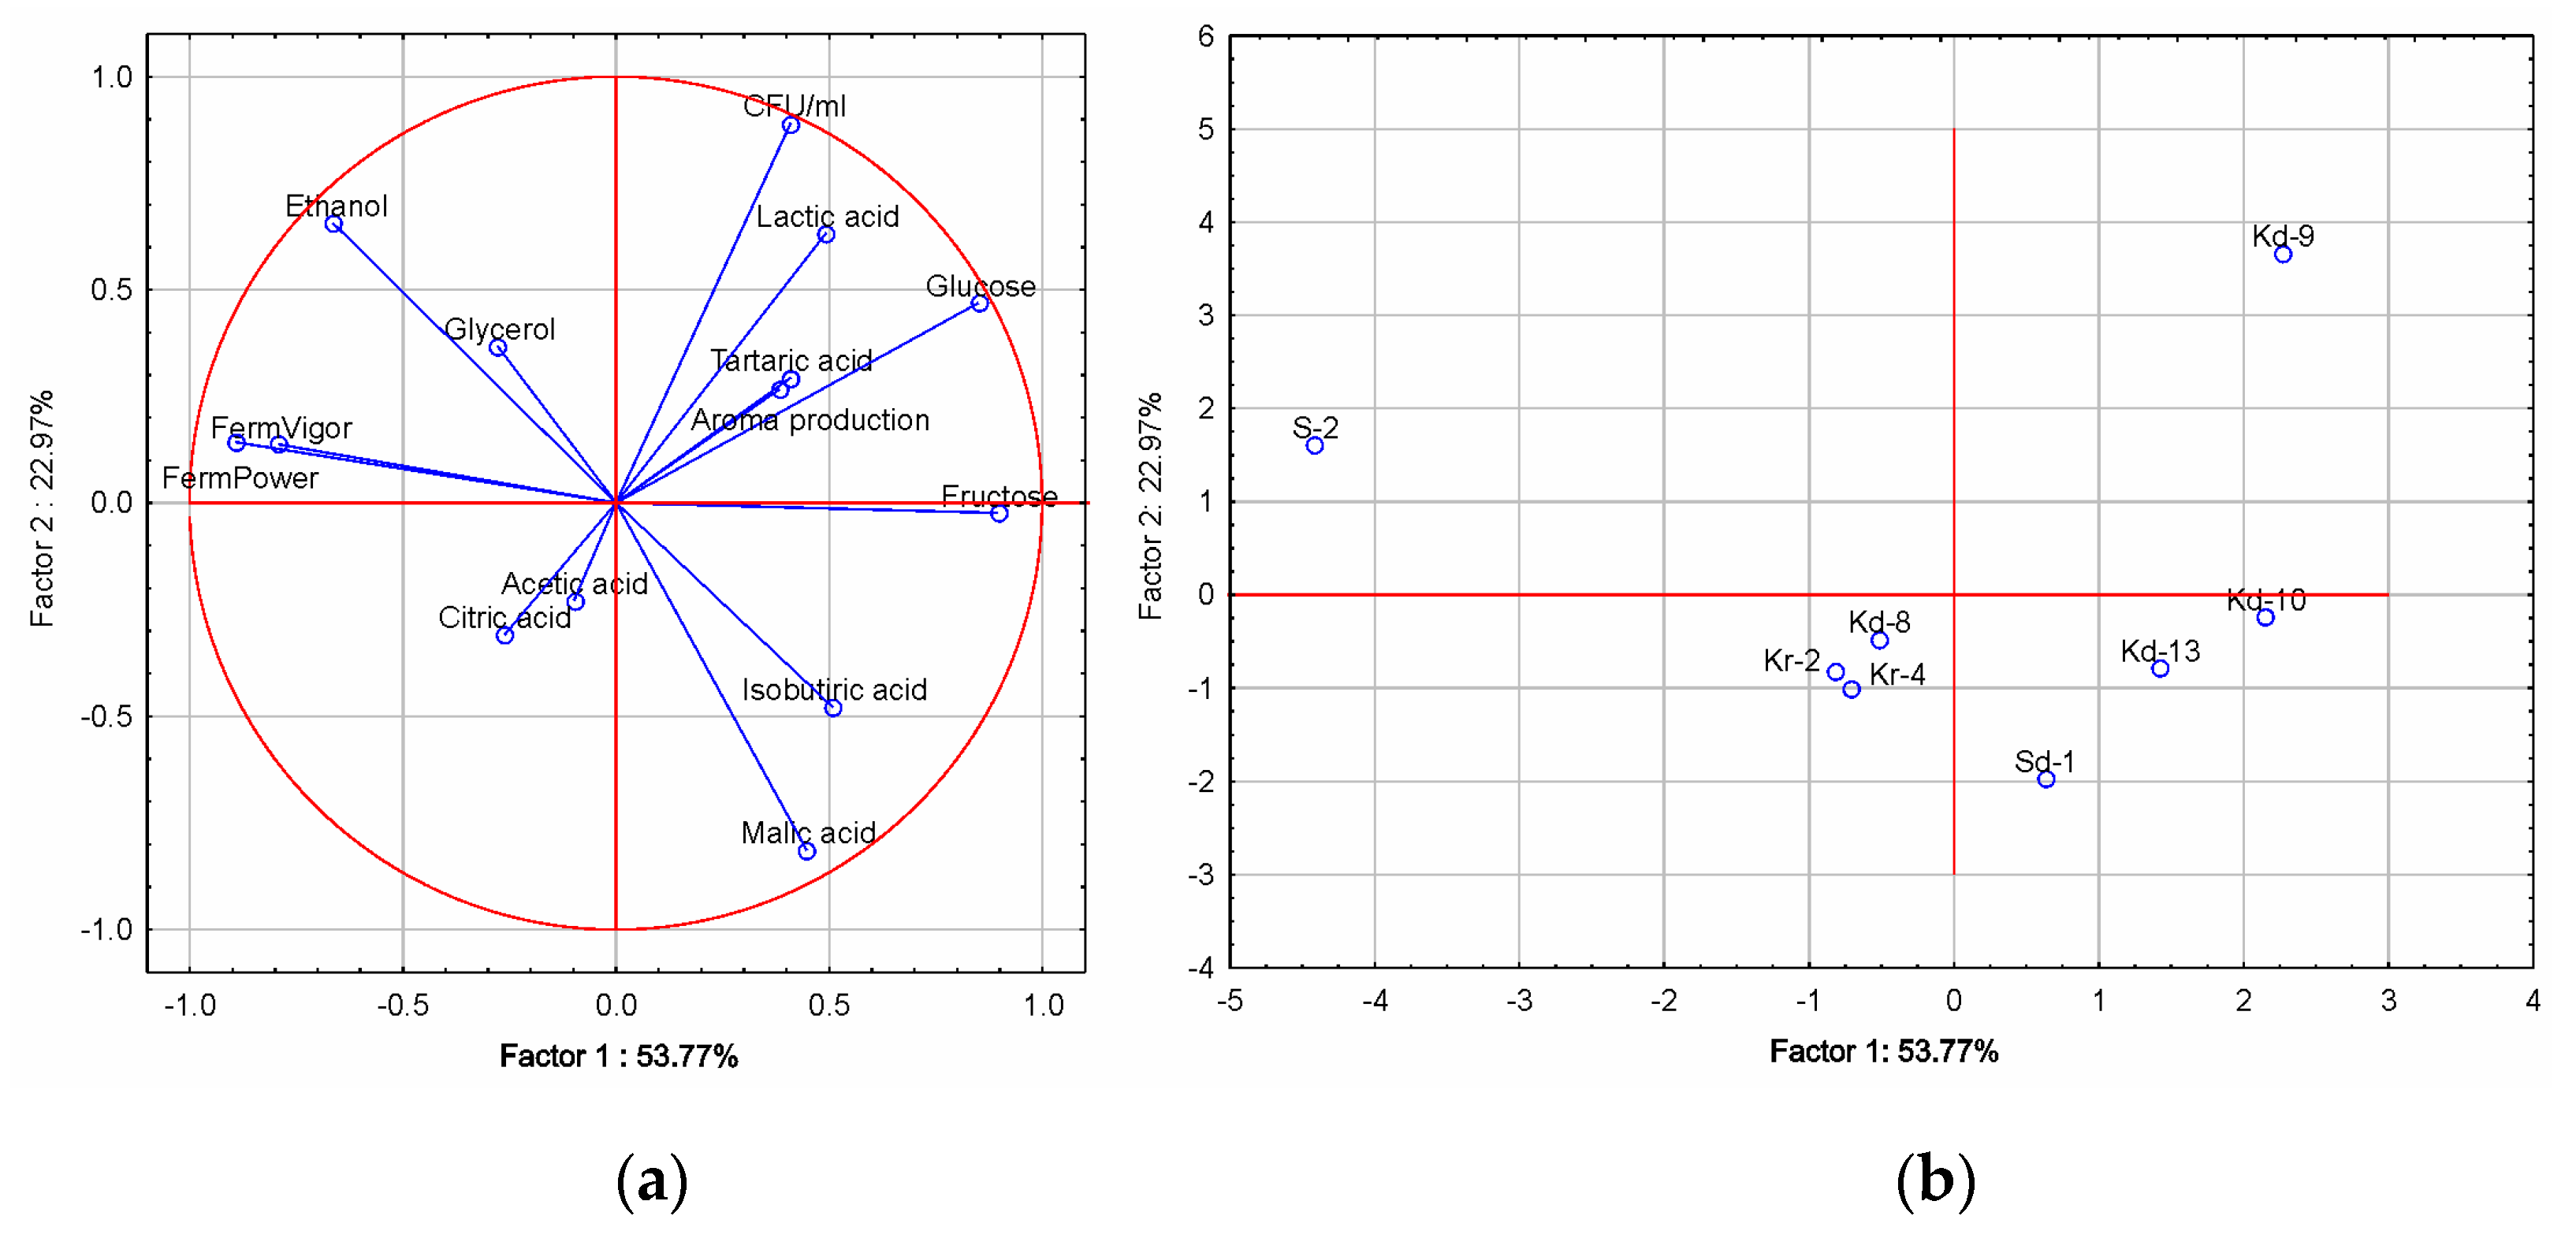
3.3. Chemical Composition of the Wine

The concentration of organic acids was monitored as an important parameter of the quality of the wine. Organic acids found in wine usually originate from the grapes (tartaric, malic and citric acid) or may be produced during the fermentation (succinic, lactic and acetic acid), with each of them having a contribution to the mouthfeel properties of the wine [31]. Hence, wine samples from the vinification experiments were analyzed for the presence of organic acids (tartaric, malic, lactic, vinegar, citric and isobutyric), as well as for glycerol, ethanol, and glucose and fructose content. The results are presented in Table 2.
H. uvarum isolates produced higher amounts of tartaric acid compared to the control sample. The tartaric acid content in all samples ranged from 4.56 to 5.28 g/L. The highest concentration of malic acid (3.22 ± 0.06 g/L) among the H. uvarum isolates was formed by Sd-1. The concentration of malic acid in the samples produced by other H. uvarum isolates was in the range of 2.22–3.11 g/L. On the other hand, the concentrations of lactic and acetic acid were in the ranges 0.09–0.20 g/L and 0.54–0.63 g/L, respectively. The highest concentration of isobutyric acid (0.38 ± 0.05 g/L) was present in the sample fermented with the Kd-10 isolate, while the lowest concentration of this acid was produced by the Kr-4 isolate (0.20 ± 0.05 g/L).
The highest amount of glucose and fructose was found in the samples produced by the Kd-9 isolate (137.07 g/L) and was about 40% higher than for S-2, where the amount of glucose and fructose was lowest (77.59 g/L). In contrast to the analyzed H. uvarum isolates, the amount of glucose and fructose in the control sample was about 3 g/L.
H. uvarum isolates produced a significantly lower ethanol concentration compared to the control sample. The ethanol content was similar for the different H. uvarum isolates, ranging from 3.13 to 4.68% v/v, while the ethanol content in the control sample was 12.14% v/v.
Based on the presented results, the separation of the control wine samples obtained by fermentation with commercial yeast S. cerevisiae is clear, and therefore PCA analyses were used to visualize the effect of different H. uvarum yeast isolates on the chemical composition of Prokupac base wines (Figure 5). The first principal component (Factor 1) explained 53.77% of the total variation, while the second principal component (Factor 2) explained a further 22.98%.
According to the results of the oenological characterization of the tested H. uvarum isolates, the isolate H. uvarum S-2 was chosen for further experiments on non-sterile grape must, in conditions more similar to those in real fermentation. This isolate was chosen because it had the highest fermentative vigor and power values, utilized most of the sugar, produced appropriate amounts of organic acids and conferred a pleasant aroma.
The results of HPLC analyses, as well as those for the content of different groups of polyphenols (total polyphenols, anthocyanins and flavonoids) and the color characteristics of the resulting wines were determined after fermentation, and the results are presented in Table 3.
The wine sample produced via pure fermentation with H. uvarum S-2 contained significantly lower levels of ethanol compared to the control. The content of glycerol (more than 7 g/L) did not differ significantly between the wines produced via pure and sequential fermentation with H. uvarum S-2, but in both cases it was significantly higher than in the control wine. All wine samples were fermented to dryness, with an amount of residual sugars lower than 2.2 g/L. Regarding the organic acids, tartaric and malic acid were the most abundant in all the samples, but the control sample had the highest content of these acids in relation to the other wine samples. In contrast, the wine produced via pure fermentation with H. uvarum S-2 had a significantly higher content of acetic acid, which was almost twice as high as in the control sample but still within acceptable sensory limits. The concentration of lactic acid was three times higher in the wine sample inoculated with H. uvarum S-2 compared to wine fermented using commercial S. cerevisiae. There were slight differences among the wine samples produced with the selected H. uvarum isolate via pure and sequential inoculation in terms of total phenolic, flavonoid and anthocyanin compound concentrations. Compared with the control wine sample, statistically significant differences were observed for the color hue values.

4. Discussion

After being considered an undesirable factor in winemaking for a long time, non-Saccharomyces yeasts have become increasingly popular due to their beneficial effects on the wine. It is now known that these native yeasts can drastically affect the wine’s chemical composition, giving it a distinctive note. Their application in the winemaking industry offers a way to exploit the full biotechnological potential of spontaneous fermentation under controlled conditions [11,32]. In the present study, we investigated one such yeast, i.e., H. uvarum, isolated beyond grapevine-associated microbial communities, with the aim of determining its oenological potential in terms of its capability to conduct alcoholic fermentation and produce important metabolites. We obtained useful information on growth-limiting factors, aroma and organic acid productivity, along with growth kinetics, in comparison to the commercial yeast S. cerevisiae.
The results of this study demonstrated that H. uvarum grows over a wide range of temperatures from 4 °C to 20 °C. This is in line with previously published results which stated that during cold maceration, non-Saccharomyces yeasts are dominated by the strains H. uvarum/K. apiculata [12,13,14,33,34]. Low temperatures cause this species to create larger amounts of esters and have a positive effect on the aromatic profile of the wine. Furthermore, during the cold maceration of Pinot noir grapes, the K. apiculata strain produced higher concentrations of isoamyl and isobutyl acetate, thus contributing to the fruit aroma of banana and strawberry in wine [17]. For this reason, it is proposed that cold maceration should precede alcoholic fermentation in order for the yeast to reach its full potential to improve the aroma of wine [35]. As well as their thermotolerance, H. uvarum isolates were also resistant to SO2 in concentrations much higher than those usually used in the winemaking industry [36]. In contrast, all isolates were sensitive to ethanol (Figure 1), which is in accordance with previously published results [37,38,39]. Ethanol has the ability to inhibit lipid synthesis in the cellular membrane and to eliminate the hydrate layer of the yeast cell, thus affecting cell death and reducing further growth. This effect of ethanol may be overcome by using the cell immobilization technique, which has been successfully applied to yeasts [40].
Apart from Kr-2, all isolates produced a pleasant fruity aroma. The Kd-9 isolate stood out as creating a strong intensity of pleasant aroma characterized as fruity, while isolate S-2 produced an aroma of the lowest intensity.
The amount of CO2 released per 100 mL of grape must is described as the fermentative power, representing an evaluation parameter for yeast fermentative performance. As expected, H. uvarum strains had a lower fermentative power compared to the control sample. Similar results were obtained for K. apiculata isolated from the territory of northern Italy in the fermentation of Trebbiano Toscano grape must, with a slightly lower fermentative power than S. cerevisiae [19]. On the other hand, when fermented on plum must, the same strain released 10–20 g/L more CO2 than in the results obtained in this study [41]. In addition, a significantly higher amount of CO2 was released during fermentation of Moscato grape must and mixed red grape varieties must, where H. uvarum isolates released CO2 in amounts of 78 and 102 g/L, respectively [19]. The difference in the results can be explained by the use of different H. uvarum strains and different nutrients in the fermentation media.
Slow sugar consumption and high levels of residual sugar in the fermentation medium with H. uvarum isolates can be explained by the low fermentative capacity of non-Saccharomyces yeasts in general, which may be a result of the insufficient amounts of organic nitrogen sources in the fermentation medium or the toxic effect of ethanol [13,41]. These results lead to the conclusion that isolates of H. uvarum cannot complete fermentation and that, if applied as a pure culture, they can cause sluggish or stuck alcoholic fermentation. Our results are consistent with the results observed for this yeast species in the case of Emir grape must [42] or agave juice [43] fermentation.
H. uvarum cells exhibited a different growth curve than S. cerevisiae. S. cerevisiae growth is characterized by a rapid exponential phase, reaching the maximum number of viable cells after two days of fermentation. H. uvarum multiplication was slower, as the exponential phase slowly transitioned to the stationary phase after 8 days of fermentation. The specific growth rate was also lower in the case of H. uvarum compared to S. cerevisiae, leading to a smaller number of cells being achieved. The increase in the cell number is in line with the CO2 production. In the first two days, the yeast S. cerevisiae showed the most intense release of CO2, while in the case of H. uvarum the CO2 release was gradual. The viable population of H. uvarum probably decreased due to the increasing ethanol content in the fermentation medium. Nevertheless, important compounds such as different esters, acetic acid and glycerol were produced at the initial stages of fermentation, when H. uvarum still retains its active metabolic state [32]. Fermentation of grape must with the addition of yeast extract [44,45] and of different fruit juices [43,46] using the same yeast resulted in higher cell numbers at the end of the process. This difference can be explained by the content of the grape must subjected to fermentation, with different cultivation conditions or growth factors. Yeast extract in particular, which represents an organic source of nitrogen, stimulates H. uvarum growth [45].
The influence of H. uvarum strains on the chemical composition of Prokupac wines was assessed by comparing the concentrations of the most important organic acids in wine: tartaric, malic, lactic, acetic, citric and isobutyric acid, as well as the ethanol, glycerol and residual sugars.
Organic acids are the primary wine metabolites responsible for the fresh taste and sweet–sour balance of the wine. The content of organic acids affects the stability and sensory perception of the wine in terms of its visual and aromatic characteristics [31].
Tartaric acid was the most abundant organic acid in all analyzed samples, with a statistically significant difference in the samples fermented by different H. uvarum strains, as well as in comparison with the control sample. It is known that tartaric acid is not metabolized under fermentative conditions by lactic acid bacteria or yeasts, so its concentration was not expected to be yeast-strain-dependent. Although precipitation as potassium bitartrate is a main reason for tartaric acid reduction, Gao and Fleet [47] reported that under conditions of high cell density some yeasts (species of Saccharomyces, Kloeckera, Candida, Schizosaccharomyces and Hansenula) possess the ability to degrade L-tartaric acids [47]. Their results showed that the degree of degradation of tartaric acid is low but is dependent on the strain. Bauer and coworker also observed that the tartaric acid concentration in wine slightly depends on the yeast strain [48], while Fonseca [49] noted that some yeast species are capable of utilizing tartaric acid as a source of carbon. This acid has the most significant role in maintaining the chemical stability of the wine and is responsible for the acid taste [50]. A lower level of tartaric acid in wine samples produced from the sterile must compared to the fresh must could be explained by the positive effect of higher temperatures on potassium extraction, which further contribute to the decrease in tartaric acid due to the precipitation of potassium tartrate. Similar results were reported for thermovinified musts and wines from Carignan grapes [51]. Furthermore, after sterilization, the must was cooled before the yeast inoculation, which had an additional positive effect on the precipitation of tartrate and on lowering the tartaric acid content. However, the tartaric acid content obtained in this study was in accordance with the content detected in wine samples produced from the Prokupac variety using S. cerevisiae and native yeast isolates of Candida famata [20].
On the other hand, the concentration of malic acid was about 60% lower in the sample inoculated with S. cerevisiae compared to isolates of H. uvarum, which is within the limits acceptable for wines. During the fermentation of apple juice, K. apiculata produced 4.17 g/L of malic acid [46], which is about 30% more than in the results obtained in our study.
Compared with tartaric and malic acid, lactic acid is milder and softer, and it contributes to the creamier mouthfeel properties of the wine [52]. According to the literature, lactic acid in wine is in concentrations of 1–3 g/L [52]. The isolates of H. uvarum Kd-9, Kd-10 and Kr-4 produced low concentrations of lactic acid, in the range of 0.09–0.20 g/L. In the control sample, the concentration of lactic acid was six times higher compared to the mentioned isolates. Similar results were observed in previous research [46]. It should be pointed out that total wine acidity and pH value depend not only on concentration but also on the relative strength of the organic acids present. Malic acid is a dicarboxylic acid which gives two protons by dissociation in wine, while lactic acid, as a monocarboxylic acid, provides only one proton. According to this, the contribution of lactic acid to the total acidity is two times lower than that of malic acid, so the total acidity decreases, and the pH value is expected to increase, finally affecting the wine’s sensory perception and balance [53]. The low concentrations of lactic acid in the analyzed samples can be explained by the fact that lactic acid bacteria, which are responsible for converting malic acid into lactic acid, were not present in the must due to the sterilization process [54]. On the other hand, lactic acid in the control sample may originate from the commercial preparation used (according to the manufacturer’s specification, Lalvin ICV D254).
Acetic acid was detected at a concentration of 0.54–0.63 g/L in all samples fermented by H. uvarum isolates, which is acceptable with respect to wine quality as values between 0.2 and 0.7 g/L are considered optimal [24,55]. In the control sample, the concentration of acetic acid was 10-20% lower compared to the analyzed isolates. Literature data are consistent with the observed results. Isolates of K. apiculata produced slightly higher amounts of acetic acid in different white and red wines [19,21,42]. A study by Romano et al., which included 48 K. apiculata strains, showed that some strains synthesized less than 70 mg/L of acetic acid, while most of the analyzed strains produced from 200 to 600 mg/L [20], which is consistent with our results and also within the limits of sensory acceptability [55]. The difference in the production of acetic acid can be attributed to the composition of the fermentation medium and the fermentation conditions, as well as the yeast strain itself [56].
The presence of small amounts of citric acid (0.10–0.13 g/L) was observed in samples fermented with the K. apiculata isolates Kd-10, Kd-13, Kr-4, S-2 and Sd-1. These quantities are about 10 times less than the quantities obtained in wine samples fermented by K. apiculata isolated from spontaneously fermented Negroamaro grapes [15]. This difference can be explained, apart from by the initial difference in must composition and fermentation conditions, by the fact that the used Prokupac grape must was sterilized at 100 °C for 20 min before fermentation, which probably led to the decomposition of this thermolabile organic acid.
The highest concentration of isobutyric acid (0.38 ± 0.05 mg/L) was present in the sample fermented with the Kd-10 isolate, while the lowest concentration of this acid was produced by the Kr-4 isolate (0.20 ± 0.05 mg/L). This acid was not detected in the control sample. A similar study that compared wines fermented with H. vineae and S. cerevisiae also demonstrated that H. vineae produced significantly higher amounts of isobutyric acid than S. cerevisiae [57]. Although isobutyric acid can negatively affect the aromatic and sensory profile of wine in concentrations higher than 2.3 mg/L [58], in smaller quantities it contributes to the complexity of the wine aroma [59].
After the completion of microvinification, large amounts of glucose and fructose remained in the samples fermented with H. uvarum isolates. The highest amount of glucose and fructose was in fermentation with the isolate Kd-9 (137.07 g/L), which was about 40% higher than with isolate S-2, where the amount of glucose and fructose was the lowest (77.59 g/L). However, the amount of glucose and fructose in the control sample was much lower. The obtained results are in accordance with a previous study which dealt with the fermentation of sterile Emir grape must. [41]. In all samples fermented with H. uvarum isolates, the amount of glucose was higher than the amount of fructose, once again confirming that the genus Hanseniaspora is fructophilic [15,33,60].
During microvinification, isolates of H. uvarum produced twice the concentration of glycerol compared to the control sample. Isolates S-2 and Kd-10 can be distinguished as good producers of glycerol, with the highest concentrations of 4.40 ± 0.06 and 4.33 ± 0.08 g/L, respectively. The obtained results were in accordance with published results [19]. Lower amounts of glycerol than those achieved in this study were observed in the fermentation of the Macabeo grape variety [18] and the Trebbiano grape variety [11]. The difference in the results is due to the different compositions of the fermentation medium, especially the initial sugar content, as well as the fermentation conditions [61].
H. uvarum isolates produced a significantly lower ethanol concentration compared to the control sample. The ethanol content ranged between 3.13 and 4.68% v/v, which is consistent with the literature [14,33,62]. Jolly and coworkers showed that H. uvarum could produce 5.4–6.5% v/v of ethanol during the fermentation of two different Chardonnay grape must samples [21], while another research group reached a limit of 3.81% v/v of ethanol [18].
The PCA plot (Figure 5) clearly distinguished the wine obtained with the Kd-9 H. uvarum isolate (first quadrant—the positive part of PC 1 and PC 2), which was associated with better aroma production and a higher content of tartaric acid. The S-2 isolate was located in the second quadrant and was associated with a higher ethanol and glycerol content, as well as with higher values for fermentative vigor and power. Kd-8, Kr-2 and Kr-4 H. uvarum isolates were plotted in the negative parts of PC 1 and PC 2, due to the higher content of acetic acid, while the Sd-2 isolate was clearly distinguished due to a higher content of malic acid.
Fermentation of non-sterile Prokupac grape must confirmed that H. uvarum S-2 had good oenological potential in comparison to the commercial S. cerevisiae strain. Although a significant amount of sugar remained in the wines after microvinfication of sterile must, almost all the sugar was depleted in non-sterile grape-must fermentation. This can be explained by the presence of indigenous yeast populations and strains which are capable of finishing the fermentation. Our results also demonstrated that H. uvarum S-2, in both fermentation protocols, pure or sequential, ensured complete fermentation without becoming stuck or sluggish, and also reduced the ethanol content in wines. Wine produced with H. uvarum S-2 via pure fermentation had a significantly lower level of ethanol (11.41% v/v) than the wine produced via sequential (11.90% v/v) and the control (12.46% v/v) fermentation. The reduction of ethanol is considered to be a positive and desirable characteristic, since in the last decades the average content of ethanol in wines has been progressively increasing, mainly in warm-climate wine regions or due to the consumer preference for full-bodied wines [63]. On the other hand, a high ethanol content may influence the perception of the aroma and flavor of the wine, which is why the winemaking industry is currently seeking for viticultural or winemaking methods and strategies to lower the ethanol content [64]. A reduction in the ethanol content (by up to 1% v/v) with H. uvarum S-2 is in agreement with some previous results for H. uvarum [65,66,67]. H. uvarum S-2 achieved better ethanol reduction via pure fermentation, while in sequential fermentations it reduced the ethanol content by 0.56% v/v, probably due to the presence of S. cerevisiae and nutrient availability. Ethanol reduction is very dependent on the yeast strain but also on the yeast combination or fermentation protocols, as previously demonstrated [68]. Furthermore, wine samples obtained via pure or sequential fermentation with H. uvarum S-2 contained around 60% more glycerol than the control, once again confirming the oenological potential of this isolate. The obtained results are in accordance with the amount of glycerol in Prokupac wines made via sequential fermentation with the native Candida famata isolate [2]. Although a higher production of glycerol is often associated with a higher production of acetic acid [69], our fermentation trials resulted in wines with higher concentrations of acetic acid than the control, though still at an acceptable sensory level. In contrast to some earlier characterizations of apiculate yeasts as excessive volatile acid producers [70], the results in the current study indicate that H. uvarum S-2 produced acetic acid in concentrations within acceptable sensory limits. Our results are in line with previous findings regarding 84% of 26 tested Hanseniaspora spp. isolates which were found to produce less than 0.7 g of acetic acid per liter [65]. The amounts of tartaric and malic acid in the obtained wines are in accordance with previous results published on Prokupac grape wines, while slight differences are explained by the differences in the primary composition of the grape must, the higher content of these acids in the grape and differences in initial total acidity. The observed lower content of malic acid in wine samples fermented via both fermentation methods with H.uvarum S-2 compared to the control sample indicated the possible ability of this yeast strain to degrade malic acid, which is considered an advantage for grape varieties with high total acidity. Some earlier studies also demonstrated reductions in the malic acid content by some non-Saccharomyces strains [2,54]. A reduction in tartaric acid compared to the initial value in grape must, as well as in the case of sterile grape-must fermentation, could be explained by the ability of some yeast species to utilize tartaric acid as a source of carbon [49], but should also be considered as a subject for more detailed research related to changes in organic acids during fermentation. The reasons why the tartaric acid content was significantly lower in wine samples produced via pure and sequential fermentation with H. uvarum compared to the control sample, while it is totally the opposite in the fermentation of sterile must, remain unclear. Additionally, the production of tartaric acid can be species- and strain-dependent [71], so the effect of other yeast strains in fresh must cannot be neglected.
The highest content of lactic acid was detected in the wine obtained via pure fermentation with H. uvarum S-2, which is contrary to the results obtained in the microvinification experiments. This discrepancy in the results could be explained by the fact that non-sterile grape must contains, among others, lactic acid bacteria, which use malolactic fermentation to produce lactic acid in wine [72]. Knowing that S. cerevisiae is the dominant strain that performs fermentation until all of the sugar is consumed, it becomes clear that lactic acid bacteria come to expression more easily in fermentation trials with non-Saccharomyces strains such as H. uvarum [73], and it can also be concluded that co-culturing and sequential fermentations can significantly increase the lactic acid content compared to control wines [74].
Although the yeast strain or fermentation protocol did not affect the content of total phenols in the produced wines, the use of H. uvarum S-2 in pure fermentation resulted in a slightly lower content of total anthocyanins and flavonoids compared to the control sample or the sample obtained via sequential fermentation. Despite the fact that some authors have emphasized that the concentrations of phenolic compounds in wines are strain-dependent [75,76], others observed little difference in the total polyphenol and anthocyanin contents in wine samples fermented with forty-nine different non-Saccharomyces yeast strains [77]. The effects of different yeast species on this class of compounds or on wine color are highly diverse and depend on the yeast’s ability to produce enzymes such as β-glycosidase or anthocyanidase, its ability to adsorb pigments on the yeast cell wall, or its ability to produce metabolites such as pyruvic acid or acetaldehyde that may react with polyphenols in wines [78]. Compared to our previous results for the Prokupac wines, the total polyphenols, anthocyanins and flavonoids observed in this study were significantly lower compared to wines from the vintage of 2015, and were in agreement with the total anthocyanins and flavonoids in wines produced with two commercial non-Saccharomyces yeasts, Metschnikowia pulcherrima and Torulaspora delbrueckii, from the vintage of 2018 [1] or with the results presented for the wine obtained from Prokupac grapes treated with different concentrations of Bacillus subtilis preparation from the vintage of 2019 [79]. Some other authors published significantly lower contents of polyphenolic compounds for the Prokupac wine (vintages 2013 and 2014), produced with or without the addition of different aromatic herbs [80]. The differences in the results can be explained by the fact that the concentration of polyphenolic compounds in wine is highly influenced by grape varieties, vintage year, viticultural and winemaking practices, storage and wine aging [81]. Furthermore, in order to chromatically characterize wines produced with H. uvarum S-2 with different fermentation protocols, the intensity and the hue of the color were assessed. There were no significant differences between the wine samples with regard to color intensity, but significant differences were found among samples for the color hue. The highest color hue (up to 10%) was observed for the wine sample produced via pure fermentation with the selected H. uvarum isolate. The parameters related to the wine color are of particular interest for the Prokupac wine, because this grape variety is known to produce wines with lower color intensity [1]. The results obtained for the Prokupac wine sample in this study were higher compared to our previously published results [1,79]. The reasons for the discrepancy may be the content of grape pigments, the duration of maceration, temperature, alcohol content, pH value, storage and aging [77].

5. Conclusions

The assessment of the native non-Saccharomyces yeast strains of H. uvarum showed that this species has a great potential for the production of authentic wines with intact local character. All isolates were thermotolerant and were able to grow at up to 300 ppm SO2 and to ferment the sugar commonly present in grapes. Although sensitive to ethanol, they managed to produce significant amounts of organic acids in the initial stage of fermentation. Isolate Kd-9 contributed to the pleasant aroma with the highest intensity and demonstrated the best growth. The Kd-10 isolate stood out as the best organic acid producer, while the S-2 isolate had the best fermentative vigor and power and consumed the most sugar, along with contributing to a pleasant aroma. The S-2 isolate was chosen for pure and sequential fermentation on non-sterile grape must, where it demonstrated good oenological potential with the capability to reduce ethanol content and increase glycerol and lactic acid concentration. Although sensory analysis and aroma profile determination should be performed to complement the obtained results, this study should encourage further investigation in this field, thus directly contributing to tailored wine production and precision oenology principles.

Author Contributions

Conceptualization, M.M. and M.L.; methodology, I.K. and B.D.; software, I.K. and N.D.; validation, B.D., I.K. and M.M.; formal analysis, S.M. investigation, S.M. and N.D.; resources, B.D.; data curation, M.L.; writing—original draft preparation, S.M.; writing—review and editing, S.S.S. and B.D.; visualization, S.S.S.; supervision, I.K. and B.D.; project administration, M.M.; funding acquisition, M.M. All authors have read and agreed to the published version of the manuscript.

Funding

This research was funded by Ministry of Education, Science and Technological Development of the Republic of Serbia, grant number 451-03-68/2022-14/200133 and by the Ministry of Agriculture, Forestry and Water Management, grant number 680-00-00059/3/2021-02.

Informed Consent Statement

Not applicable.

Data Availability Statement

Not applicable.

Acknowledgments

This research study was conducted at the Faculty of Technology of the University of Niš in Leskovac, Serbia.

Conflicts of Interest

The authors declare no conflict of interest.

References

  1. Karabegović, I.; Malićanin, M.; Danilović, B.; Stanojević, J.; Stojanović, S.S.; Nikolić, N.; Lazić, M. Potential of non-Saccharomyces yeast for improving the aroma and sensory profile of Prokupac red wine. Oeno One 2021, 55, 181–195. [Google Scholar] [CrossRef]
  2. Mančić, S.; Danilović, B.; Malićanin, M.; Stojanović, S.S.; Nikolić, N.; Lazić, M.; Karabegović, I. Fermentative potential of native yeast Candida famata for Prokupac grape must fermentation. Agriculture 2021, 11, 358. [Google Scholar] [CrossRef]
  3. Suárez-Lepe, J.A.; Morata, A. New trends in yeast selection for winemaking. Trends Food Sci. Technol. 2012, 23, 39–50. [Google Scholar] [CrossRef]
  4. García, M.; Esteve-Zarzoso, B.; Arroyo, T. Non-Saccharomyces yeasts: Biotechnological role for wine production. In Grape and Wine Biotechnology; Morata, A., Loira, I., Eds.; IntechOpen: London, UK, 2016. [Google Scholar]
  5. Larroque, M.N.; Carrau, F.; Fariña, L.; Boido, E.; Dellacassa, E.; Medina, K. Effect of Saccharomyces and non-Saccharomyces native yeasts on beer aroma compounds. Int. J. Food Microbiol. 2021, 337, 108953. [Google Scholar] [CrossRef] [PubMed]
  6. Rollero, S.; Bloem, A.; Brand, J.; Ortiz-Julien, A.; Camarasa, C.; Divol, B. Nitrogen metabolism in three non-conventional wine yeast species: A tool to modulate wine aroma profiles. Food Microbiol. 2021, 94, 103650. [Google Scholar] [CrossRef]
  7. Seguinot, P.; Bloem, A.; Brial, P.; Meudec, E.; Ortiz-Julien, A.; Camarasa, C. Analysing the impact of the nature of the nitrogen source on the formation of volatile compounds to unravel the aroma metabolism of two non-Saccharomyces strains. Int. J. Food Microbiol. 2020, 316, 108441. [Google Scholar] [CrossRef]
  8. Zhang, B.; Ivanova-Petropulos, V.; Duan, C.; Yan, G. Distinctive chemical and aromatic composition of red wines produced by Saccharomyces cerevisiae co-fermentation with indigenous and commercial non-Saccharomyces strains. Food Biosci. 2021, 41, 100925. [Google Scholar] [CrossRef]
  9. Testa, B.; Coppola, F.; Lombardi, S.J.; Iorizzo, M.; Letizia, F.; Di Renzo, M.; Succi, M.; Tremonte, P. Influence of Hanseniaspora uvarum as27 on chemical and sensorial characteristics of aglianico wine. Processes 2021, 9, 326. [Google Scholar] [CrossRef]
  10. Jolly, P.; Varela, C.; Pretorius, I.S. Not your ordinary yeast: Non-Saccharomyces yeasts in wine production uncovered. FEMS Yeast Res. 2014, 14, 215–237. [Google Scholar] [CrossRef] [Green Version]
  11. Ciani, M.; Picciotti, G. The growth kinetics and fermentation behaviour of some non-Saccharomyces yeasts associated with wine-making. Biotechnol. Lett. 1995, 17, 1247–1250. [Google Scholar] [CrossRef]
  12. Cadez, N.; Raspor, P.; De Cock, A.W.A.M.; Boekhout, T.; Smith, M.T. Molecular identification and genetic diversity within species of the genera Hanseniaspora and Kloeckera. FEMS Yeast Res. 2002, 1, 279–289. [Google Scholar] [CrossRef]
  13. Martin, V.; Jose Valera, M.; Medina, K.; Boido, E.; Carrau, F. Oenological impact of the Hanseniaspora/Kloeckera yeast genus on wines—A review. Fermentation 2018, 4, 76. [Google Scholar] [CrossRef] [Green Version]
  14. Brilli, L.; Buscioni, G.; Moriondo, M.; Bindi, M.; Vincenzini, M. Influence of interannual meteorological variability on yeast content and composition in sangiovese grapes. Am. J. Enol. Vitic. 2014, 65, 375–380. [Google Scholar] [CrossRef]
  15. De Benedictis, M.; Bleve, G.; Tristezza, M.; Tufariello, M.; Grieco, F. An optimized procedure for the enological selection of non-Saccharomyces starter cultures. Antonie Leeuwenhoek 2011, 99, 189–200. [Google Scholar] [CrossRef]
  16. Borren, E.; Tian, B. The important contribution of non-Saccharomyces yeasts to the aroma complexity of wine: A review. Foods 2021, 10, 13. [Google Scholar] [CrossRef]
  17. Hall, H.; Zhou, Q.; Qian, M.C.; Osborne, J.P. Impact of yeasts present during prefermentation cold maceration of pinot noir grapes on wine volatile aromas. Am. J. Enol. Vitic. 2017, 68, 81–90. [Google Scholar] [CrossRef]
  18. Clemente-Jimenez, J.M.; Mingorance-Cazorla, L.; Martínez-Rodríguez, S.; Las Heras-Vázquez, F.J.; Rodríguez-Vico, F. Molecular characterization and oenological properties of wine yeasts isolated during spontaneous fermentation of six varieties of grape must. Food Microbiol. 2004, 21, 149–155. [Google Scholar] [CrossRef]
  19. Comi, G.; Romano, P.; Cocolin, L.; Fiore, C. Characterization of Kloeckera apiculata strains from the Friuli region in Northern Italy. World J. Microbiol. Biotechnol. 2001, 17, 391–394. [Google Scholar] [CrossRef]
  20. Romano, P.; Suzzi, G.; Comi, G.; Zironi, R.; Maifreni, M. Glycerol and other fermentation products of apiculate wine yeasts. J. Appl. Microbiol. 1997, 82, 615–618. [Google Scholar] [CrossRef]
  21. Jolly, N.P.; Augustyn, O.P.H.; Pretorius, I.S. The effect of non-Saccharomyces yeasts on fermentation and wine quality. S. Afr. J. Enol. Vitic. 2003, 24, 8–10. [Google Scholar] [CrossRef]
  22. Nieuwoudt, H.H.; Prior, B.A.; Pretorius, I.S. Glycerol in South African table wines: An assessment of its relationship to wine quality. S. Afr. J. Enol. Vitic. 2002, 23, 22–30. [Google Scholar] [CrossRef]
  23. Varela, C.; Borneman, A.R. Yeasts found in vineyards and wineries. Yeast 2017, 34, 111–128. [Google Scholar] [CrossRef] [PubMed]
  24. Vilela-Moura, A.; Schuller, D.; Mendes-Faia, A.; Silva, R.D.; Chaves, S.R.; Sousa, M.J.; Côrte-Real, M. The impact of acetate metabolism on yeast fermentative performance and wine quality: Reduction of volatile acidity of grape musts and wines. Appl. Microbiol. Biotechnol. 2011, 89, 271–280. [Google Scholar] [CrossRef] [PubMed] [Green Version]
  25. Lappa, I.K.; Kachrimanidou, V.; Pateraki, C.; Koulougliotis, D.; Eriotou, E.; Kopsahelis, N. Indigenous yeasts: Emerging trends and challenges in winemaking. Curr. Opin. Food Sci. 2020, 32, 133–143. [Google Scholar] [CrossRef]
  26. Di Gennaro, S.F.; Matese, A.; Mancin, M.; Primicerio, J.; Palliotti, A. An open-source and low-cost monitoring system for precision enology. Sensors 2014, 14, 23388–23397. [Google Scholar] [CrossRef] [PubMed] [Green Version]
  27. Pantelić, M.; Dabić Zagorac, D.; Gašić, U.; Jović, S.; Bešlić, Z.; Todić, S.; Natić, M. Phenolic profiles of Serbian autochthonous variety ‘Prokupac’ and monovarietal international wines from the Central Serbia wine region. Nat. Prod. Res. 2018, 32, 2356–2359. [Google Scholar] [CrossRef] [PubMed]
  28. Gutiérrez, A.; Boekhout, T.; Gojkovic, Z.; Katz, M. Evaluation of non-Saccharomyces yeasts in the fermentation of wine, beer and cider for the development of new beverages. J. Inst. Brew. 2018, 124, 389–402. [Google Scholar] [CrossRef]
  29. Nikolić-Milojević, N.; Mošić, I.; Karabegović, I.; Lazić, M.; Nikolić, N.; Perić, S.; Golubović, S.; Davidović, D.; Veličković, D. Influence of the time of maceration on phenolic composition of wines produced from the indigenous variety Prokupac. Biologica Nyssana 2020, 11, 121–128. [Google Scholar] [CrossRef]
  30. Castellari, M.; Versari, A.; Spinabelli, U.; Galassi, S.; Amati, A. An improved HPLC method for the analysis of organic acids, carbohydrates and alchocols in grape musts and wines. J. Liq. Chromatogr. Relat. Technol. 2007, 23, 2047–2056. [Google Scholar] [CrossRef]
  31. Ferreira, A.M.; Mendes-Faia, A. The role of yeasts and lactic acid bacteria on the metabolism of organic acids during winemaking. Foods 2020, 9, 1231. [Google Scholar] [CrossRef]
  32. Jackson, R.S. Fermentation. In Wine Science; Jackson, R.S., Ed.; Academic Press: Cambridge, MA, USA, 2014; pp. 427–534. ISBN 978-0-12-381468-5. [Google Scholar]
  33. Vontrobová, E.; Kubizniakova, P.; Fiala, J.; Sochor, J.; Matoulková, D. Autochthonous yeasts as one of the tools to produce wines by original technologies. Kvas. Prum. 2019, 65, 38–45. [Google Scholar] [CrossRef]
  34. Bink, F.J. Molekulargenetische und Physiologische Untersuchungen an der Weinhefe Kloeckera apiculata (Hanseniaspora uvarum). Ph.D. Thesis, Osnabrück University, Osnabrück, Germany, 2010. [Google Scholar]
  35. Hierro, N.; González, Á.; Mas, A.; Guillamón, J.M. Diversity and evolution of non-Saccharomyces yeast populations during wine fermentation: Effect of grape ripeness and cold maceration. FEMS Yeast Res. 2006, 6, 102–111. [Google Scholar] [CrossRef] [PubMed] [Green Version]
  36. Ough, C.S.; Crowell, E.A. Use of sulfur dioxide in winemaking. J. Food Sci. 1987, 52, 386–388. [Google Scholar] [CrossRef]
  37. Máleková, E.; Lakatošová, J.; Jankura, E. Identification and technological characterization of naturally occurring yeasts on grapevines. In Proceedings of the 39th World Congress of Vine and Wine, Bento Gonçalves, Brazil, 23–28 October 2016. [Google Scholar]
  38. Jankura, E.; Piknová, L.; Lopašovská, J. Identification and technological characteristics of yeast strains from vineyards in slovakia. J. Food Nutr. Res. 2020, 59, 241–249. [Google Scholar]
  39. Snoek, T.; Verstrepen, K.J.; Voordeckers, K. How do yeast cells become tolerant to high ethanol concentrations? Curr. Genet. 2016, 62, 475–480. [Google Scholar] [CrossRef] [PubMed]
  40. Nguyen, H.P.; Du Le, H.; Le, V.V.M. Effect of ethanol stress on fermentation performance of Saccharomyces cerevisiae cells immobilized on Nypa fruticans leaf sheath pieces. Food Technol. Biotechnol. 2015, 53, 96. [Google Scholar] [CrossRef]
  41. Satora, P.; Tuszyński, T. Influence of indigenous yeasts on the fermentation and volatile profile of plum brandies. Food Microbiol. 2010, 27, 418–424. [Google Scholar] [CrossRef]
  42. Zohre, D.E.; Erten, H. The influence of Kloeckera apiculata and Candida pulcherrima yeasts on wine fermentation. Process Biochem. 2002, 38, 319–324. [Google Scholar] [CrossRef]
  43. González-Robles, I.W.; Estarrón-Espinosa, M.; Díaz-Montaño, D.M. Fermentative capabilities and volatile compounds produced by Kloeckera/Hanseniaspora and Saccharomyces yeast strains in pure and mixed cultures during Agave tequilana juice fermentation. Antonie Leeuwenhoek 2015, 108, 525–536. [Google Scholar] [CrossRef]
  44. Mendoza, L.M.; De Nadra, M.C.M.; Farías, M.E. Kinetics and metabolic behavior of a composite culture of Kloeckera apiculata and Saccharomyces cerevisiae wine related strains. Biotechnol. Lett. 2007, 29, 1057–1063. [Google Scholar] [CrossRef]
  45. Mendoza, L.M.; De Nadra, M.C.M.; Bru, E.; Farías, M.E. Influence of wine-related physicochemical factors on the growth and metabolism of non-Saccharomyces and Saccharomyces yeasts in mixed culture. J. Ind. Microbiol. Biotechnol. 2009, 36, 229–237. [Google Scholar] [CrossRef] [PubMed]
  46. Bilbao, A.; Irastorza, A.; Dueñas, M.; Fernandez, K. The effect of temperature on the growth of strains of Kloeckera apiculata and Saccharomyces cerevisiae in apple juice fermentation. Lett. Appl. Microbiol. 1997, 24, 37–39. [Google Scholar] [CrossRef] [PubMed]
  47. Gao, C.; Fleet, G.H. Degradation of malic and tartaric acids by high density cell suspensions of wine yeasts. Food Microbiol. 1995, 12, 65–71. [Google Scholar] [CrossRef]
  48. Bauer, F.; Chidi, B.S.; Rossouw, D.; Buica, A.S.; Bauer, F.F. Determining the Impact of Industrial wine yeast trains on organic acid production under white and red wine-like fermentation conditions. S. Afr. J. Enol. Vitic. 2015, 36, 316–327. [Google Scholar]
  49. Fonseca, A. Utilization of tartaric acid and related compounds by yeasts: Taxonomic implications. Can. J. Microbiol. 2011, 38, 1242–1251. [Google Scholar] [CrossRef]
  50. Ivanova-Petropulos, V.; Petruševa, D.; Mitrev, S. Rapid and simple method for determination of target organic acids in wine using HPLC-DAD analysis. Food Anal. Methods 2020, 13, 1078–1087. [Google Scholar] [CrossRef]
  51. Geffroy, O.; Lopez, R.; Feilhes, C.; Violleau, F.; Kleiber, D.; Favarel, J.L.; Ferreira, V. Modulating analytical characteristics of thermovinified Carignan musts and the volatile composition of the resulting wines through the heating temperature. Food Chem. 2018, 257, 7–14. [Google Scholar] [CrossRef] [Green Version]
  52. Chidi, B.S.; Bauer, F.F.; Rossouw, D. Organic acid metabolism and the impact of fermentation practices on wine acidity—A review. S. Afr. J. Enol. Vitic. 2018, 39, 315–329. [Google Scholar] [CrossRef] [Green Version]
  53. Comuzzo, P.; Battistutta, F. Acidification and pH control in red wines. In Red Wine Technology; Morata, A., Ed.; Academic Press: Cambridge, MA, USA, 2019; pp. 17–34. ISBN 9780128144008. [Google Scholar]
  54. Yılmaz, C.; Gökmen, V. Formation of amino acid derivatives in white and red wines during fermentation: Effects of non-Saccharomyces yeasts and Oenococcus oeni. Food Chem. 2021, 343, 128415. [Google Scholar] [CrossRef]
  55. Lambrechts, M.G.; Pretorius, I.S. Yeast and its Importance to Wine Aroma—A Review. S. Afr. J. Enol. Vitic. 2019, 21, 97–129. [Google Scholar] [CrossRef] [Green Version]
  56. Estela-Escalante, W.D.; Rychtera, M.; Melzoch, K.; Guerrero-Ochoa, M.R. Influence of aeration in the fermentative activity of Kloeckera apiculate during fermentation of apple juice. Acta Biol. Colomb. 2012, 17, 309–322. [Google Scholar]
  57. Jeromel, A.; Korenika, A.M.J.; Tomaz, I. An influence of different yeast species on wine aroma composition. In Fermented Beverages; Grumezascu, A.M., Holban, A.M., Eds.; Woodhead publishing: Duxford, UK, 2019; pp. 171–285. ISBN 9780128152713. [Google Scholar]
  58. Vázquez-Pateiro, I.; Arias-González, U.; Mirás-Avalos, J.M.; Falqué, E. Evolution of the aroma of Treixadura wines during bottle aging. Foods 2020, 9, 1419. [Google Scholar] [CrossRef] [PubMed]
  59. Cheng, G.; Liu, Y.; Yue, T.X.; Zhang, Z.W. Comparison between aroma compounds in wines from four Vitis vinifera grape varieties grown in different shoot positions. Food Sci. Technol. 2015, 35, 237–246. [Google Scholar] [CrossRef] [Green Version]
  60. Mateus, D.; Sousa, S.; Coimba, C.; Rogerson, F.; Simões, J. Identification and characterization of Non-Saccharomyces species isolated from port wine spontaneous fermentations. Foods 2020, 9, 120. [Google Scholar] [CrossRef] [PubMed] [Green Version]
  61. Ivit, N.N.; Longo, R.; Kemp, B. The effect of non-Saccharomyces and Saccharomyces non-Cerevisiae yeasts on ethanol and glycerol levels in wine. Fermentation 2020, 6, 77. [Google Scholar] [CrossRef]
  62. Iris, L.; Antonio, M.; Antonia, B.M.; Antonio, S.L.J. Isolation, Selection, and Identification Techniques for Non-Saccharomyces Yeasts of Oenological Interest. In Biotechnological Progress and Beverage Consumption; Grumezascu, A.M., Holban, A.M., Eds.; Woodhead publishing: Duxford, UK, 2019; pp. 467–508. ISBN 9780128166789. [Google Scholar]
  63. Canonico, L.; Comitini, F.; Ciani, M. Metschnikowia pulcherrima selected strain for ethanol reduction in wine: Influence of cell immobilization and aeration condition. Foods 2019, 8, 378. [Google Scholar] [CrossRef] [Green Version]
  64. Martínez-Pérez, M.P.; Bautista-Ortín, A.B.; Pérez-Porras, P.; Jurado, R.; Gómez-Plaza, E. A new approach to the reduction of alcohol content in red wines: The use of high-power ultrasounds. Foods 2020, 9, 726. [Google Scholar] [CrossRef]
  65. Mestre Furlani, M.V.; Maturano, Y.P.; Combina, M.; Mercado, L.A.; Toro, M.E.; Vazquez, F. Selection of non-Saccharomyces yeasts to be used in grape musts with high alcoholic potential: A strategy to obtain wines with reduced ethanol content. FEMS Yeast Res. 2017, 17, 10. [Google Scholar] [CrossRef] [Green Version]
  66. Mestre, M.V.; Maturano, Y.P.; Gallardo, C.; Combina, M.; Mercado, L.; Toro, M.E.; Carrau, F.; Vazquez, F.; Dellacassa, E. Impact on sensory and aromatic profile of low ethanol Malbec wines fermented by sequential culture of Hanseniaspora uvarum and Saccharomyces cerevisiae native yeasts. Fermentation 2019, 5, 65. [Google Scholar] [CrossRef] [Green Version]
  67. Fernández-González, M.; Di Stefano, R.; Briones, A. Hydrolysis and transformation of terpene glycosides from muscat must by different yeast species. Food Microbiol. 2003, 20, 35–41. [Google Scholar] [CrossRef]
  68. Zhu, X.; Torija, M.J.; Mas, A.; Beltran, G.; Navarro, Y. Effect of a multistarter yeast inoculum on ethanol reduction and population dynamics in wine fermentation. Foods 2021, 10, 623. [Google Scholar] [CrossRef] [PubMed]
  69. Eglinton, J.M.; Heinrich, A.J.; Pollnitz, A.P.; Langridge, P.; Henschke, P.A.; De Barros Lopes, E.M. Decreasing acetic acid accumulation by a glycerol overproducing strain of Saccharomyces cerevisiae by deleting the ALD6 aldehyde dehydrogenase gene. Yeast 2002, 19, 295–301. [Google Scholar] [CrossRef] [PubMed]
  70. Romano, P.; Fiore, C.; Paraggio, M.; Caruso, M.; Capece, A. Function of yeast species and strains in wine flavour. Int. J. Food Microbiol. 2003, 86, 169–180. [Google Scholar] [CrossRef]
  71. Tristezza, M.; Tufariello, M.; Capozzi, V.; Spano, G.; Mita, G.; Grieco, F. The Oenological Potential of Hanseniaspora uvarum in Simultaneous and Sequential Co-fermentation with Saccharomyces cerevisiae for Industrial Wine Production. Front. Microbiol. 2016, 7, 670. [Google Scholar] [CrossRef] [PubMed] [Green Version]
  72. Virdis, C.; Sumby, K.; Bartowsky, E.; Jiranek, V. Lactic acid bacteria in wine: Technological advances and evaluation of their functional role. Front. Microbiol. 2021, 11, 3192. [Google Scholar] [CrossRef] [PubMed]
  73. Comitini, F.; Gobbi, M.; Domizio, P.; Romani, C.; Lencioni, L.; Mannazzu, I.; Ciani, M. Selected non-Saccharomyces wine yeasts in controlled multistarter fermentations with Saccharomyces cerevisiae. Food Microbiol. 2011, 28, 873–882. [Google Scholar] [CrossRef]
  74. Gobbi, M.; Comitini, F.; Domizio, P.; Romani, C.; Lencioni, L.; Mannazzu, I.; Ciani, M. Lachancea thermotolerans and Saccharomyces cerevisiae in simultaneous and sequential co-fermentation: A strategy to enhance acidity and improve the overall quality of wine. Food Microbiol. 2013, 33, 271–281. [Google Scholar] [CrossRef]
  75. Jagatić Korenika, A.M.; Tomaz, I.; Preiner, D.; Plichta, V.; Jeromel, A. Impact of Commercial Yeasts on Phenolic Profile of Plavac Mali Wines from Croatia. Fermentation 2021, 7, 92. [Google Scholar] [CrossRef]
  76. Morata, A.; Gómez-Cordovés, M.C.; Colomo, B.; Suárez, J.A. Pyruvic Acid and Acetaldehyde Production by Different Strains of Saccharomyces cerevisiae:  Relationship with Vitisin A and B Formation in Red Wines. J. Agric. Food Chem. 2003, 51, 7402–7409. [Google Scholar] [CrossRef]
  77. Medina, K.; Boido, E.; Dellacassa, E.; Carrau, F. Effects of Non-Saccharomyces Yeasts on Color, Anthocyanin, and Anthocyanin-Derived Pigments of Tannat Grapes during Fermentation. Am. J. Enol. Vitic. 2018, 69, 148–156. [Google Scholar] [CrossRef]
  78. Tofalo, R.; Suzzi, G.; Perpetuini, G. Discovering the Influence of Microorganisms on Wine Color. Front. Microbiol. 2021, 12, 790935. [Google Scholar] [CrossRef] [PubMed]
  79. Malićanin, M.; Danilović, B.; Cvetković, D.; Stamenković-Stojanović, S.; Nikolić, N.; Lazić, M.; Karabegović, I. Modulation of Aroma and Sensory Properties of Prokupac Wines by a Bacillus-based Preparation Applied to Grapes Prior to Harvest. S. Afr. J. Enol. Vitic. 2020, 41, 158–167. [Google Scholar] [CrossRef]
  80. Lakićević, S.; Popović, T.; Matijašević, S.; Ćirković, B.; Lazić, M.; Popović-Đorđević, J. Chemical evaluation of autochthonous variety “Prokupac” red wine with the addition of selected aromatic herbs. Ann. Univ. Craiova Agric. Mont. Cadastre Ser. 2019, 49, 87–97. [Google Scholar]
  81. Merkytė, V.; Longo, E.; Windisch, G.; Boselli, E. Phenolic Compounds as Markers of Wine Quality and Authenticity. Foods 2020, 9, 1785. [Google Scholar] [CrossRef]
Figure 1. Effect of ethanol concentrations on the yeast growth: S. cerevisiae (◻) and H. uvarum isolates: Kd-8 (●), Kd-9 (△), Kd-10 (▼), Kd-13 (◇), Kr-2 (◀), Kr-4 (▷), S-2 (⬢) and Sd-1 (✩). Error bars represent standard deviations. * Growth was monitored by measuring the absorbance at 620 nm.
Fermentation 08 00092 g001
Figure 2. Total sugar consumption during fermentation of sterile Prokupac grape must with S. cerevisiae (◻) and H. uvarum isolates: Kd-8 (●), Kd-9 (△), Kd-10 (▼), Kd-13 (◇), Kr-2 (◀), Kr-4 (▷), S-2 (⬢) and Sd-1 (✩). Error bars represent standard deviations.
Fermentation 08 00092 g002
Figure 3. Amount of CO2 released per day (a) and end of process (b) during fermentation of sterile Prokupac grape must with S. cerevisiae (◻) and H. uvarum isolates: Kd-8 (●), Kd-9 (△), Kd-10 (▼), Kd-13 (◇), Kr-2 (◀), Kr-4 (▷), S-2 (⬢) and Sd-1 (✩). Error bars represent standard deviations.
Fermentation 08 00092 g003
Figure 4. Cell number increase during microfermentation of Prokupac grape must with S. cerevisiae (◻) and H. uvarum isolates: Kd-8 (●), Kd-9 (△), Kd-10 (▼), Kd-13 (◇), Kr-2 (◀), Kr-4 (▷), S-2 (⬢) and Sd-1 (✩). Error bars represent standard deviations.
Fermentation 08 00092 g004
Figure 5. Principal component analysis (PCA) of the chemical compounds identified in the Prokupac wines and fermentative characteristics of different H. uvarum isolates. (a) Distribution of variables on loadings plot and (b) Distribution of samples on scores plot.
Fermentation 08 00092 g005
Table 1. Growth characteristics and fermentative performance of H. uvarum isolates and commercial S. cerevisiae.
ParameterH. uvarum IsolateS. cerevisiae
Kd-8Kd-9Kd-10Kd-13Kr-2Kr-4S-2Sd-1
Cell number in SDB at 25 °C, log CFU/mL7.30 ± 0.04 a7.51 ± 0.05 b7.37 ± 0.12 a7.28 ± 0.01 a7.26 ± 0.06 a7.24 ± 0.09 a7.32 ± 0.12 a7.25 ± 0.07 a7.90 ± 0.1 c
CO2 production+++++++++
Growth at different temperatures4 °C+++++++++
10 °C+++++++++
15 °C+++++++++
20 °C+++++++++
Tolerance to SO250 ppm+++++++++
100 ppm+++++++++
200 ppm+++++++++
300 ppm+++++++++
Fermentative vigor 11.44 ± 0.06 a1.22 ± 0.03 b1.00 ± 0.03 c1.21 ± 0.03 b1.20 ± 0.03 b1.41 ± 0.04 a1.51 ± 0.03 d1.20 ± 0.03 b3.40 ± 0.09 e
Fermentative power 23.30 ± 0.04 a2.78 ± 0.03 b2.42 ± 0.02 c2.83 ± 0.03 b2.84 ± 0.02 b3.30 ± 0.05 a3.76 ± 0.04 d2.81 ± 0.03 b6.20 ± 0.04 e
Aroma production 3P++P+++P++P++U+++P++P+P++P+++
1 Fermentative vigor—expressed as grams of CO2 produced in 100 mL of the must during the first 3 days of fermentation. 2 Fermentative power—expressed as grams of CO2 produced in 100 mL of must up to the end of fermentation. 3 P—pleasant aroma; U—unpleasant aroma; aroma intensity level: (+) weak, (++) intermediate, (+++) strong. Results are expressed as mean ± SD (standard deviation) (n = 3). Values followed by different letters indicate statistically significant differences at p < 0.05 (Tukey’s HSD test).
Table 2. Concentration (in g/L) of reducing sugars, glycerol and ethanol, and organic acid profile of wine samples at the end of fermentation of sterile Prokupac grape must inoculated with H. uvarum isolates and S. cerevisiae.
CompoundGrape MustH. uvarum IsolateS. cerevisiae
Kd-8Kd-9Kd-10Kd-13Kr-2Kr-4S-2Sd-1
Tartaric acid5.85 ± 0.29 a5.07 ± 0.16 b,c,d5.19 ± 0.04 b,c5.03 ± 0.08 b,d5.28 ± 0.10 c4.87 ± 0.10 d4.71 ± 0.07 e5.03 ± 0.15 b,c,d5.12 ± 0.09 b,c4.56 ± 0.09 f
Malic acid3.23 ± 0.01 a3.00 ± 0.11 b2.54 ± 0.12 c2.85 ± 0.07 d2.96 ± 0.10 b,d,e2.86 ± 0.05 b,d3.11 ± 0.09 b,e2.22 ± 0.04 f3.22 ± 0.06 a1.26 ± 0.05 g
Lactic acid//0.20 ± 0.06 a0.09 ± 0.06 a//0.11 ± 0.04 a//1.17 ± 0.13 b
Acetic acid/0.63 ± 0.07 a0.58 ± 0.02 a0.56 ± 0.01 a0.54 ± 0.08 a0.60 ± 0.12 a0.56 ± 0.06 a0.57 ± 0.05 a0.62 ± 0.07 a0.49 ± 0.02 b
Citric acid///0.10 ± 0.03 a0.10 ± 0.06 a/0.12 ± 0.05 a0.13 ± 0.04 a0.11 ± 0.05 a0.01 ± 0.01 b
Isobutyric acid///0.38 ± 0.05 a0.24 ± 0.06 b/0.20 ± 0.05 b/0.21 ± 0.06 b/
Glucose120.85 ± 3.24 a57.57 ± 0.10 b76.31 ± 0.10 c62.09 ± 1.82 d64.16 ± 0.20 e56.41 ± 0.66 b57.17 ± 0.10 b47.62 ± 0.06 f57.25 ± 0.08 b0.94 ± 0.07 g
Fructose115.43 ± 2.78 a53.60 ± 0.07 b60.72 ± 0.12 c51.21 ± 0.22 d56.13 ± 0.14 e49.12 ± 0.10 f50.95 ± 0.08 d29.97 ± 0.04 g51.36 ± 0.39 d2.52 ± 0.14 h
Ethanol */3.5 ± 0.02 a4.16 ± 0.01 b3.13 ± 0.02 c3.2 ± 0.02 d3.55 ± 0.01 e3.88 ± 0.01 f4.68 ± 0.01 g3.47 ± 0.01 h12.14 ± 0.01 i
Glycerol/3.47 ± 0.06 a3.74 ± 0.07 b4.33 ± 0.08 c3.74 ± 0.08 b4.07 ± 0.10 d3.37 ± 0.07 e4.40 ± 0.06 c3.35 ± 0.08 e2.27 ± 0.15 f
Results are expressed as mean ± SD (standard deviation) (n = 3). Values followed by different letters indicate statistically significant differences at p < 0.05 (Tukey’s HSD test). * % v/v.
Table 3. Characterization of Prokupac wines produced via pure fermentation with H. uvarum S-2 (HU) and S. cerevisiae (SC), and sequential fermentation with H. uvarum S-2 and S. cerevisiae (HUSC).
ParameterFermentation Protocol
HU 1HUSC 2SC 3
Total phenols, g/L GAE1.54 ± 0.11 a1.61 ± 0.11 a1.77 ± 0.14 a
Total flavonoids, mg/L CE784.8 ± 12.1 a844.5 ± 18.7 b848.4 ± 8.4 b
Total anthocyanins, mg/L204.5 ± 3.66 a212.4 ± 4.16 b214.8 ± 3.88 b
Color intensity1.01 ± 0.04 a1.05 ± 0.01 a0.99 ± 0.02 a
Color hue1.21 ± 0.09 a1.07 ± 0.03 b0.92 ± 0.03 c
HPLC analysis
Tartaric acid, g/L4.70 ± 0.01 a4.81 ± 0.03 b5.82 ± 0.06 c
Malic acid, g/L1.15 ± 0.07 a1.15 ± 0.08 a3.10 ± 0.01 b
Lactic acid, g/L0.75 ± 0.03 a0.42 ± 0.01 b0.28 ± 0.02 c
Succinic acid, g/L0.38 ± 0.01 a0.38 ± 0.01 a0.48 ± 0.01 b
Acetic acid, g/L0.52 ± 0.01 a0.36 ± 0.01 b0.24 ± 0.00 c
Glucose, g/L0.81 ± 0.00 a0.92 ± 0.01 b0.92 ± 0.02 b
Fructose, g/L1.26 ± 0.00 a1.26 ± 0.00 a1.06 ± 0.00 b
Ethanol, % v/v11.41 ± 0.02 a11.90 ± 0.15 b12.46 ± 0.09 c
Glycerol, g/L7.41 ± 0.02 a7.36 ± 0.13 a4.55 ± 0.05 b
Different letters indicate significant differences between the samples at p < 0.05 (Tukey’s HSD test). 1 HU—pure fermentation with H. uvarum S-2. 2 HUSC—fermentation with sequential inoculation of H. uvarum S-2 and S. cerevisiae. 3 SC—control sample inoculated with commercial S. cerevisiae.
Publisher’s Note: MDPI stays neutral with regard to jurisdictional claims in published maps and institutional affiliations.

