
The Effect of Different Fining Treatments on Phenolic and Aroma Composition of Grape Musts and Wines

Abstract
:1. Introduction
2. Materials and Methods
2.1. Experimental Design
2.2. Basic Chemical Parameters
2.3. Analysis of Volatile Organic Compounds
2.4. Determination of Total Polyphenols Concentration
2.5. Determination of Individual Phenolic Compounds by HPLC
2.6. Statistical Analysis
3. Results and Discussion
3.1. Basic Analytical Parameters
3.2. Polyphenolic Compounds
3.3. Volatile Aroma Compounds
4. Conclusions
Author Contributions
Funding
Institutional Review Board Statement
Informed Consent Statement
Data Availability Statement
Conflicts of Interest
References
- Lukić, I.; Horvat, I.; Radeka, S.; Damijanić, K.; Staver, M. Effect of different levels of skin disruption and contact with oxygen during grape processing on phenols, volatile aromas, and sensory characteristics of white wine. J. Food Process. Preserv. 2019, 43, e13969. [Google Scholar] [CrossRef]
- Gawel, R.; Smith, P.A.; Cicerale, S.; Keast, R. The mouthfeel of white wine. Crit. Rev. Food Sci. Nutr. 2018, 58, 2939–2956. [Google Scholar] [CrossRef] [PubMed]
- Gutiérrez-Escobar, R.; Aliaño-González, M.J.; Cantos-Villar, E. Wine polyphenol content and its influence on wine quality and properties: A review. Molecules 2021, 26, 718. [Google Scholar] [CrossRef] [PubMed]
- Rihak, Z.; Prusova, B.; Kumsta, M.; Baron, M. Effect of Must Hyperoxygenation on Sensory Expression and Chemical Composition of the Resulting Wines. Molecules 2022, 27, 235. [Google Scholar] [CrossRef]
- Du Toit, W.; Marais, J.; Pretorius, I.; Du Toit, M. Oxygen in must and wine: A review. South Afr. J. Enol. Vitic. 2006, 27, 76–94. [Google Scholar] [CrossRef] [Green Version]
- Marangon, M.; Vincenzi, S.; Curioni, A. Wine fining with plant proteins. Molecules 2019, 24, 2186. [Google Scholar] [CrossRef] [Green Version]
- Braga, A.; Cosme, F.; Ricardo-da-Silva, J.M.; Laureano, O. Gelatine, casein and potassium caseinate as distinct wine fining agents: Different effects on colour, phenolic compounds and sensory characteristics. OENO One 2007, 41, 203–214. [Google Scholar] [CrossRef]
- Ribéreau-Gayon, P.; Glories, Y.; Maujean, A.; Dubourdieu, D. Handbook of Enology, Volume 2: The Chemistry of Wine Stabilization and Treatments; John Wiley & Sons: Hoboken, NJ, USA, 2006. [Google Scholar]
- Río Segade, S.; Paissoni, M.A.; Vilanova, M.; Gerbi, V.; Rolle, L.; Giacosa, S. Phenolic composition influences the effectiveness of fining agents in vegan-friendly red wine production. Molecules 2019, 25, 120. [Google Scholar] [CrossRef] [Green Version]
- Laborde, B.; Moine-Ledoux, V.; Richard, T.; Saucier, C.; Dubourdieu, D.; Monti, J.-P. PVPP− polyphenol complexes: A molecular approach. J. Agric. Food Chem. 2006, 54, 4383–4389. [Google Scholar] [CrossRef]
- Gil, M.l.; Avila-Salas, F.; Santos, L.S.; Iturmendi, N.; Moine, V.; Cheynier, V.; Saucier, C.d. Rosé wine fining using polyvinylpolypyrrolidone: Colorimetry, targeted polyphenomics, and molecular dynamics simulations. J. Agric. Food Chem. 2017, 65, 10591–10597. [Google Scholar] [CrossRef]
- Marchal, R.; Waters, E. New directions in stabilization, clarification and fining of white wines. In Managing Wine Quality; Elsevier: Amsterdam, The Netherlands, 2010; pp. 188–225. [Google Scholar]
- Castro Marín, A.; Colangelo, D.; Lambri, M.; Riponi, C.; Chinnici, F. Relevance and perspectives of the use of chitosan in winemaking: A review. Crit. Rev. Food Sci. Nutr. 2021, 61, 3450–3464. [Google Scholar] [CrossRef] [PubMed]
- Schneider, V. Must hyperoxidation: A review. Am. J. Enol. Vitic. 1998, 49, 65–73. [Google Scholar] [CrossRef]
- Cejudo-Bastante, M.J.; Hermosín-Gutiérrez, I.; Castro-Vázquez, L.I.; Pérez-Coello, M.S. Hyperoxygenation and bottle storage of Chardonnay white wines: Effects on color-related phenolics, volatile composition, and sensory characteristics. J. Agric. Food Chem. 2011, 59, 4171–4182. [Google Scholar] [CrossRef] [PubMed]
- Cheynier, V.; Souquet, J.; Samson, A.; Moutounet, M. Hyperoxidation: Influence of various oxygen supply levels on oxidation kinetics of phenolic compounds and wine quality. Vitis 1991, 30, 107–115. [Google Scholar]
- Balík, J. Vinařství: Návody do Laboratorních Cvičení (Winery, Instructions for Laboratory Excercises); Mendelova zemědělská a lesnická univerzita Brno: Brno, Czech Republic, 2004. [Google Scholar]
- Prusova, B.; Baron, M. Effect of controlled micro-oxygenation on white wine. Ciência Técnica Vitivinícola 2018, 33, 78–89. [Google Scholar] [CrossRef]
- Sochorova, L.; Prusova, B.; Jurikova, T.; Mlcek, J.; Adamkova, A.; Baron, M.; Sochor, J. The study of antioxidant components in grape seeds. Molecules 2020, 25, 3736. [Google Scholar] [CrossRef]
- Sochor, J.; Jurikova, T.; Pohanka, M.; Skutkova, H.; Baron, M.; Tomaskova, L.; Balla, S.; Klejdus, B.; Pokluda, R.; Mlcek, J. Evaluation of antioxidant activity, polyphenolic compounds, amino acids and mineral elements of representative genotypes of Lonicera edulis. Molecules 2014, 19, 6504–6523. [Google Scholar] [CrossRef] [Green Version]
- Jackson, R.S. Wine Science: Principles and Applications; Academic Press: Cambridge, MA, USA, 2008. [Google Scholar]
- Casassa, L.F.; Huff, R.; Steele, N.B. Chemical consequences of extended maceration and post-fermentation additions of grape pomace in Pinot noir and Zinfandel wines from the Central Coast of California (USA). Food Chem. 2019, 300, 125147. [Google Scholar] [CrossRef]
- Waterhouse, A.L. Wine phenolics. Ann. N. Y. Acad. Sci. 2002, 957, 21–36. [Google Scholar] [CrossRef]
- Cosme, F.; Pinto, T.; Vilela, A. Phenolic compounds and antioxidant activity in grape juices: A chemical and sensory view. Beverages 2018, 4, 22. [Google Scholar] [CrossRef] [Green Version]
- Li, H.; Guo, A.; Wang, H. Mechanisms of oxidative browning of wine. Food Chem. 2008, 108, 1–13. [Google Scholar] [CrossRef]
- Cosme, F.; Capão, I.; Filipe-Ribeiro, L.; Bennett, R.; Mendes-Faia, A. Evaluating potential alternatives to potassium caseinate for white wine fining: Effects on physicochemical and sensory characteristics. LWT Food Sci. Technol. 2012, 46, 382–387. [Google Scholar] [CrossRef]
- Waterhouse, A.L.; Laurie, V.F. Oxidation of wine phenolics: A critical evaluation and hypotheses. Am. J. Enol. Vitic. 2006, 57, 306–313. [Google Scholar] [CrossRef]
- Lingua, M.S.; Fabani, M.P.; Wunderlin, D.A.; Baroni, M.V. From grape to wine: Changes in phenolic composition and its influence on antioxidant activity. Food Chem. 2016, 208, 228–238. [Google Scholar] [CrossRef] [PubMed]
- Cheynier, V.F.; Trousdale, E.K.; Singleton, V.L.; Salgues, M.J.; Wylde, R. Characterization of 2-S-glutathionyl caftaric acid and its hydrolysis in relation to grape wines. J. Agric. Food Chem. 1986, 34, 217–221. [Google Scholar] [CrossRef]
- Cheynier, V.F.; Van Hulst, M.W. Oxidation of trans-caftaric acid and 2-S-glutathionylcaftaric acid in model solutions. J. Agric. Food Chem. 1988, 36, 10–15. [Google Scholar] [CrossRef]
- Cáceres-Mella, A.; Peña-Neira, Á.; Parraguez, J.; López-Solís, R.; Laurie, V.F.; Canals, J.M. Effect of inert gas and prefermentative treatment with polyvinylpolypyrrolidone on the phenolic composition of Chilean Sauvignon blanc wines. J. Sci. Food Agric. 2013, 93, 1928–1934. [Google Scholar] [CrossRef]
- Durán-Lara, E.F.; López-Cortés, X.A.; Castro, R.I.; Avila-Salas, F.; González-Nilo, F.D.; Laurie, V.F.; Santos, L.S. Experimental and theoretical binding affinity between polyvinylpolypyrrolidone and selected phenolic compounds from food matrices. Food Chem. 2015, 168, 464–470. [Google Scholar] [CrossRef]
- Coetzee, C.; Du Toit, W. Sauvignon blanc wine: Contribution of ageing and oxygen on aromatic and non-aromatic compounds and sensory composition-A review. South Afr. J. Enol. Vitic. 2015, 36, 347–365. [Google Scholar] [CrossRef] [Green Version]
- Cejudo-Bastante, M.J.; Castro-Vázquez, L.; Hermosín-Gutiérrez, I.; Pérez-Coello, M.S. Combined effects of prefermentative skin maceration and oxygen addition of must on color-related phenolics, volatile composition, and sensory characteristics of Airén white wine. J. Agric. Food Chem. 2011, 59, 12171–12182. [Google Scholar] [CrossRef]
- Day, M.; Schmidt, S.; Smith, P.; Wilkes, E. Use and impact of oxygen during winemaking. Aust. J. Grape Wine Res. 2015, 21, 693–704. [Google Scholar] [CrossRef]
- Ma, T.-Z.; Gong, P.-F.; Lu, R.-R.; Zhang, B.; Morata, A.; Han, S.-Y. Effect of different clarification treatments on the volatile composition and aromatic attributes of ‘Italian Riesling’ icewine. Molecules 2020, 25, 2657. [Google Scholar] [CrossRef] [PubMed]
- Granato, T.M.; Nasi, A.; Ferranti, P.; Iametti, S.; Bonomi, F. Fining white wine with plant proteins: Effects of fining on proanthocyanidins and aroma components. Eur. Food Res. Technol. 2014, 238, 265–274. [Google Scholar] [CrossRef]
- Granato, T.M.; Ferranti, P.; Iametti, S.; Bonomi, F. Affinity and selectivity of plant proteins for red wine components relevant to color and aroma traits. Food Chem. 2018, 256, 235–243. [Google Scholar] [CrossRef]
- Moreno-Arribas, M.V.; Polo, M.C. Wine Chemistry and Biochemistry; Springer: Berlin/Heidelberg, Germany, 2009; Volume 735. [Google Scholar]
- Ruiz, J.; Kiene, F.; Belda, I.; Fracassetti, D.; Marquina, D.; Navascués, E.; Calderón, F.; Benito, A.; Rauhut, D.; Santos, A. Effects on varietal aromas during wine making: A review of the impact of varietal aromas on the flavor of wine. Appl. Microbiol. Biotechnol. 2019, 103, 7425–7450. [Google Scholar] [CrossRef]
- Tarko, T.; Duda-Chodak, A.; Sroka, P.; Siuta, M. The impact of oxygen at various stages of vinification on the chemical composition and the antioxidant and sensory properties of white and red wines. Int. J. Food Sci. 2020, 2020, 7902974. [Google Scholar] [CrossRef] [Green Version]
- Pettinelli, S.; Pollon, M.; Costantini, L.; Bellincontro, A.; Segade, S.R.; Rolle, L.; Mencarelli, F. Effect of flotation and vegetal fining agents on the aromatic characteristics of Malvasia del Lazio (Vitis vinifera L.) wine. J. Sci. Food Agric. 2020, 100, 5269–5275. [Google Scholar] [CrossRef]
- Lambrechts, M.; Pretorius, I. Yeast and its importance to wine aroma-a review. South Afr. J. Enol. Vitic. 2000, 21, 97–129. [Google Scholar] [CrossRef] [Green Version]
- Coetzee, C.; Lisjak, K.; Nicolau, L.; Kilmartin, P.; du Toit, W.J. Oxygen and sulfur dioxide additions to Sauvignon blanc must: Effect on must and wine composition. Flavour Fragr. J. 2013, 28, 155–167. [Google Scholar] [CrossRef]
- Suárez, R.; Suárez-Lepe, J.; Morata, A.; Calderón, F. The production of ethylphenols in wine by yeasts of the genera Brettanomyces and Dekkera: A review. Food Chem. 2007, 102, 10–21. [Google Scholar] [CrossRef]
- Wang, S.; Zhang, Q.; Zhao, P.; Ma, Z.; Zhang, J.; Ma, W.; Wang, X. Investigating the effect of three phenolic fractions on the volatility of floral, fruity, and aged aromas by HS-SPME-GC-MS and NMR in model wine. Food Chem. X 2022, 13, 100281. [Google Scholar] [CrossRef] [PubMed]
- Pittari, E.; Moio, L.; Piombino, P. Interactions between polyphenols and volatile compounds in wine: A literature review on physicochemical and sensory insights. Appl. Sci. 2021, 11, 1157. [Google Scholar] [CrossRef]
- Guo, J.; Yue, T.; Yuan, Y. Impact of polyphenols on the headspace concentration of aroma compounds in apple cider. J. Sci. Food Agric. 2019, 99, 1635–1642. [Google Scholar] [CrossRef] [PubMed]


| Wine | Control | Oxidative | Hyperoxygenation |
|---|---|---|---|
| pH | 3.31 ± 0.00 a | 3.34 ± 0.00 b | 3.38 ± 0.00 c |
| Alcohol % vol | 13.8 ± 0.05 a | 14.7 ± 0.02 b | 14.7 ± 0.01 b |
| Total acidity g·L−1 | 8.50 ± 0.00 a | 8.74 ± 0.00 b | 8.66 ± 0.01 c |
| Residual sugar g·L−1 | 23.85 ± 0.02 a | 12.15 ± 0.03 b | 11.65 ± 0.09 c |
| Tartaric acid g·L−1 | 2.85 ± 0.03 a | 3.06 ± 0.01 b | 2.99 ± 0.03 b |
| Malic acid g·L−1 | 3.94 ± 0.11 a | 4.40 ± 0.02 b | 4.39 ± 0.05 b |
| Lactic acid g·L−1 | 0.44 ± 0.01 a | 0.63 ± 0.01 b | 0.61 ± 0.01 b |
| Acetic acid g·L−1 | 0.24 ± 0.00 a | 0.26 ± 0.01 b | 0.31 ± 0.00 c |
| Glycerol g·L−1 | 7.33 ± 0.13 a | 10.58 ± 0.11 b | 10.26 ± 0.23 c |
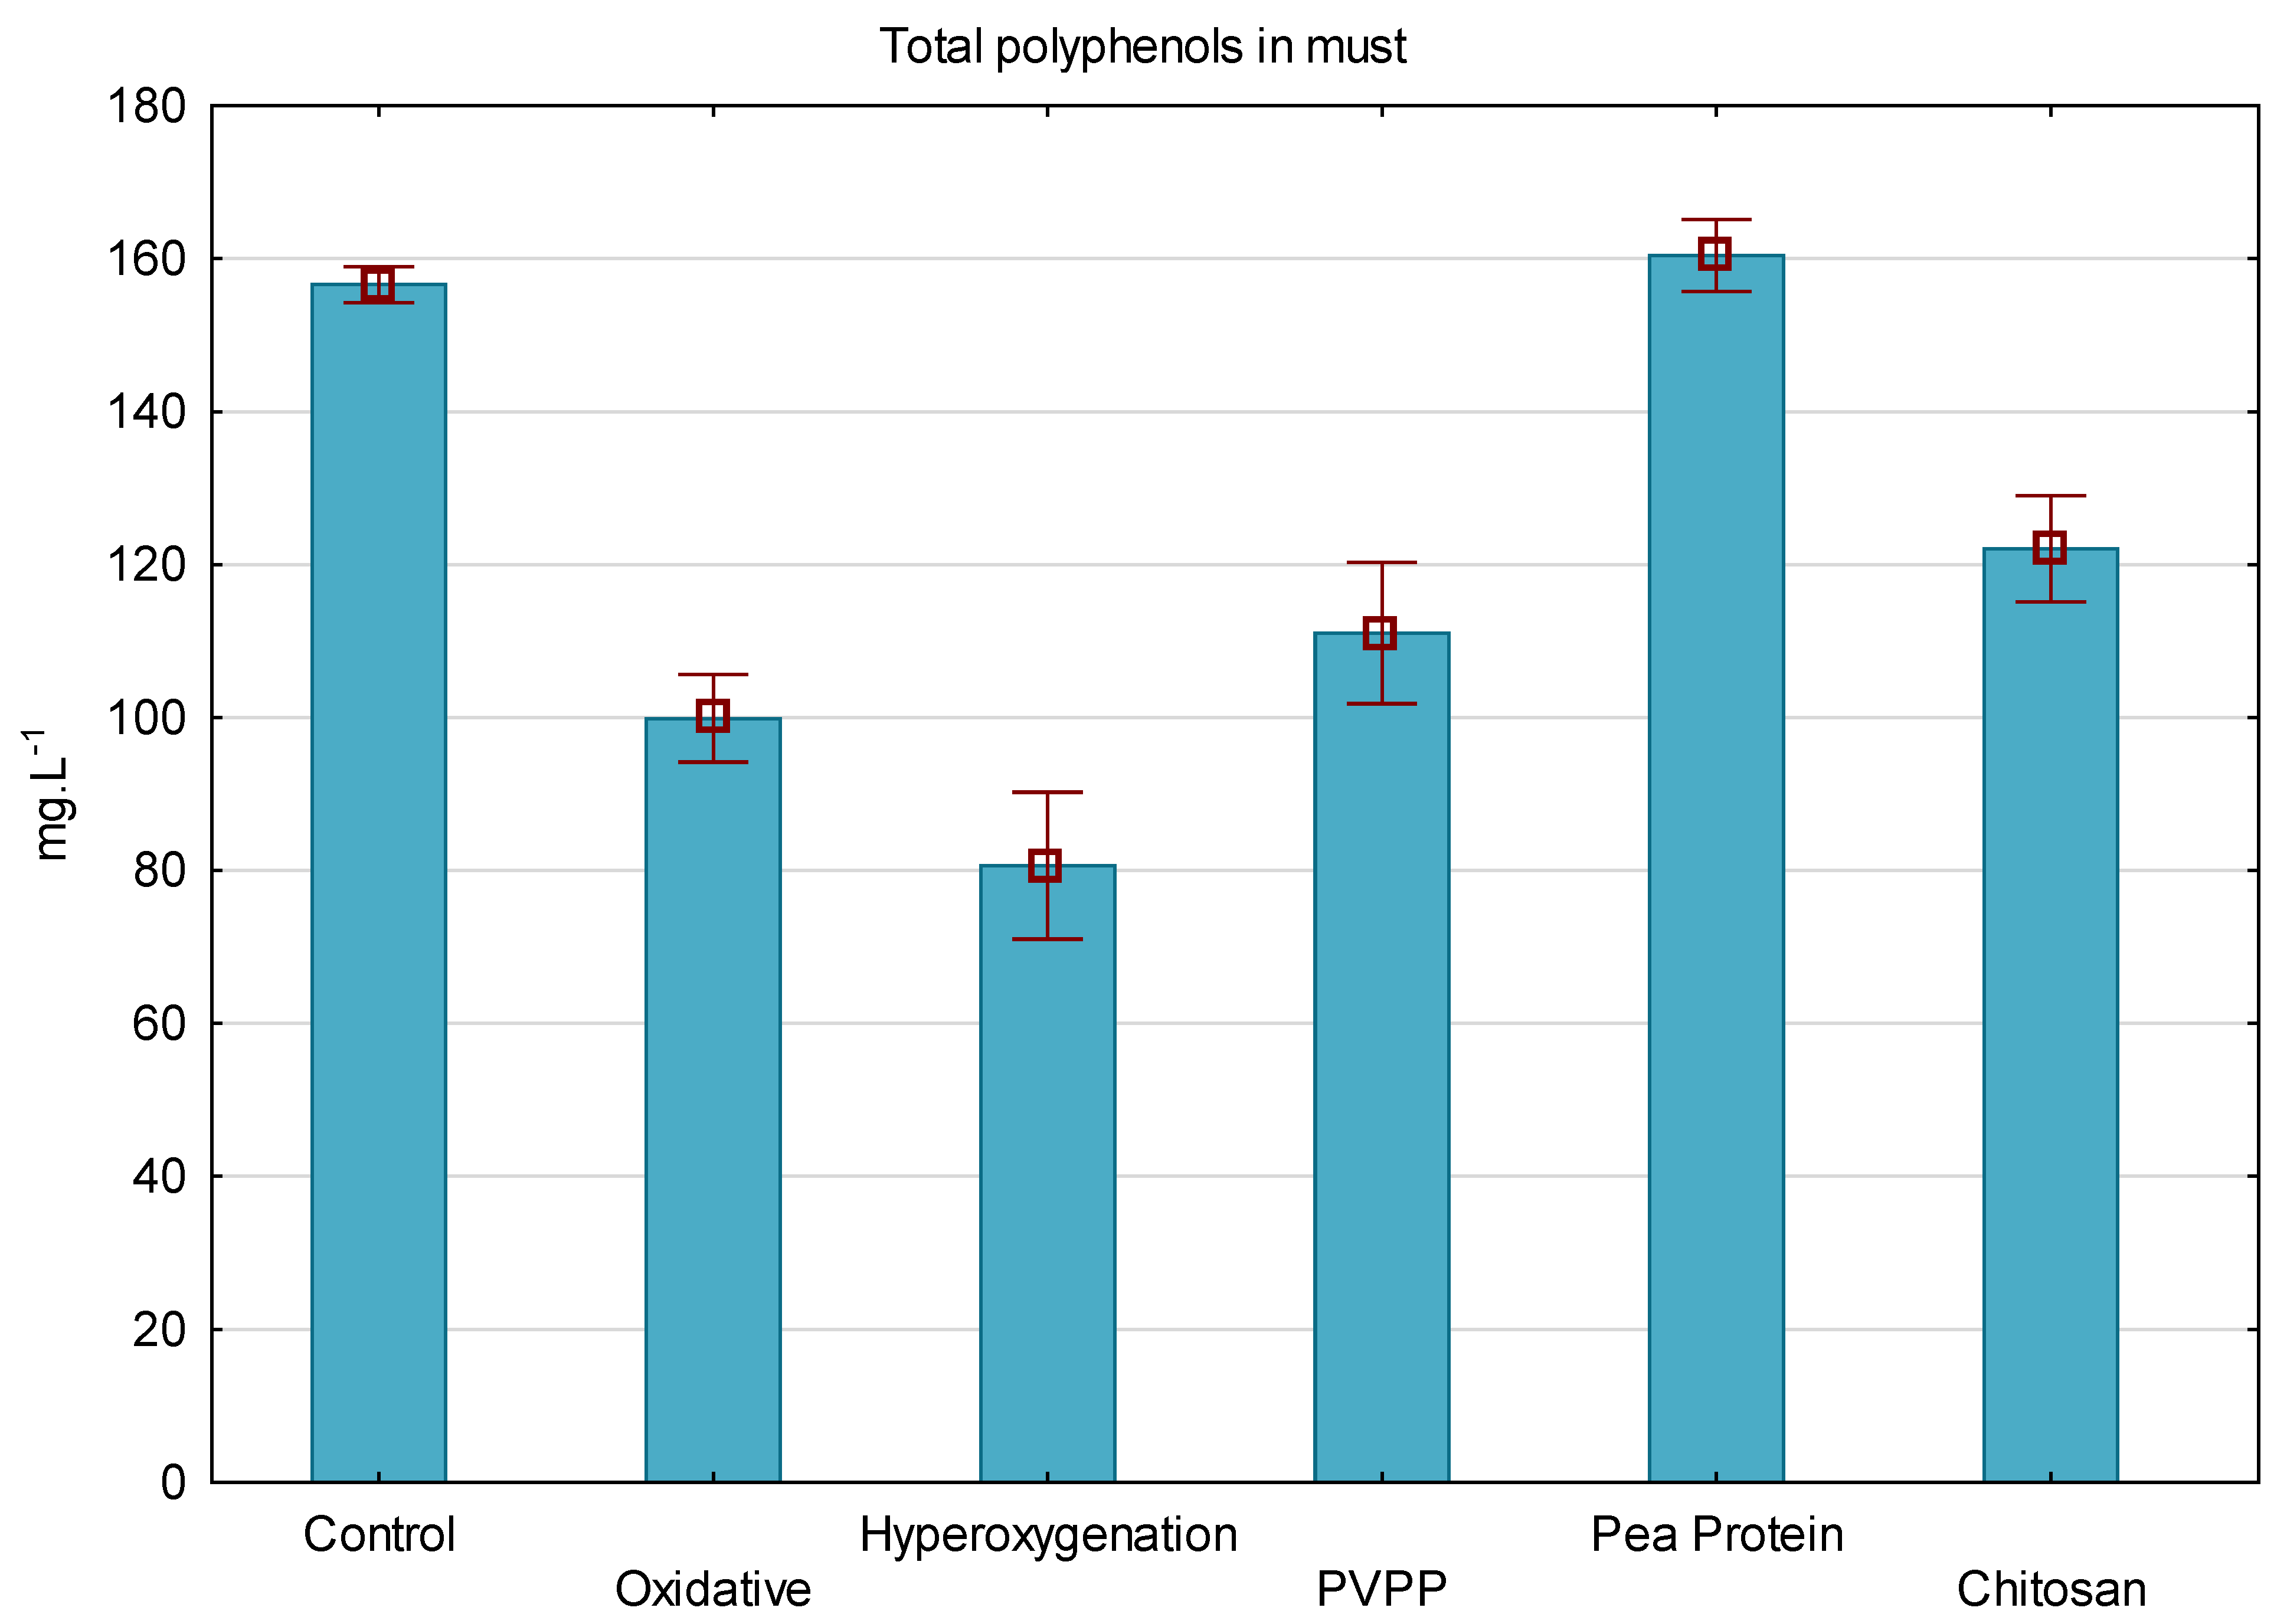
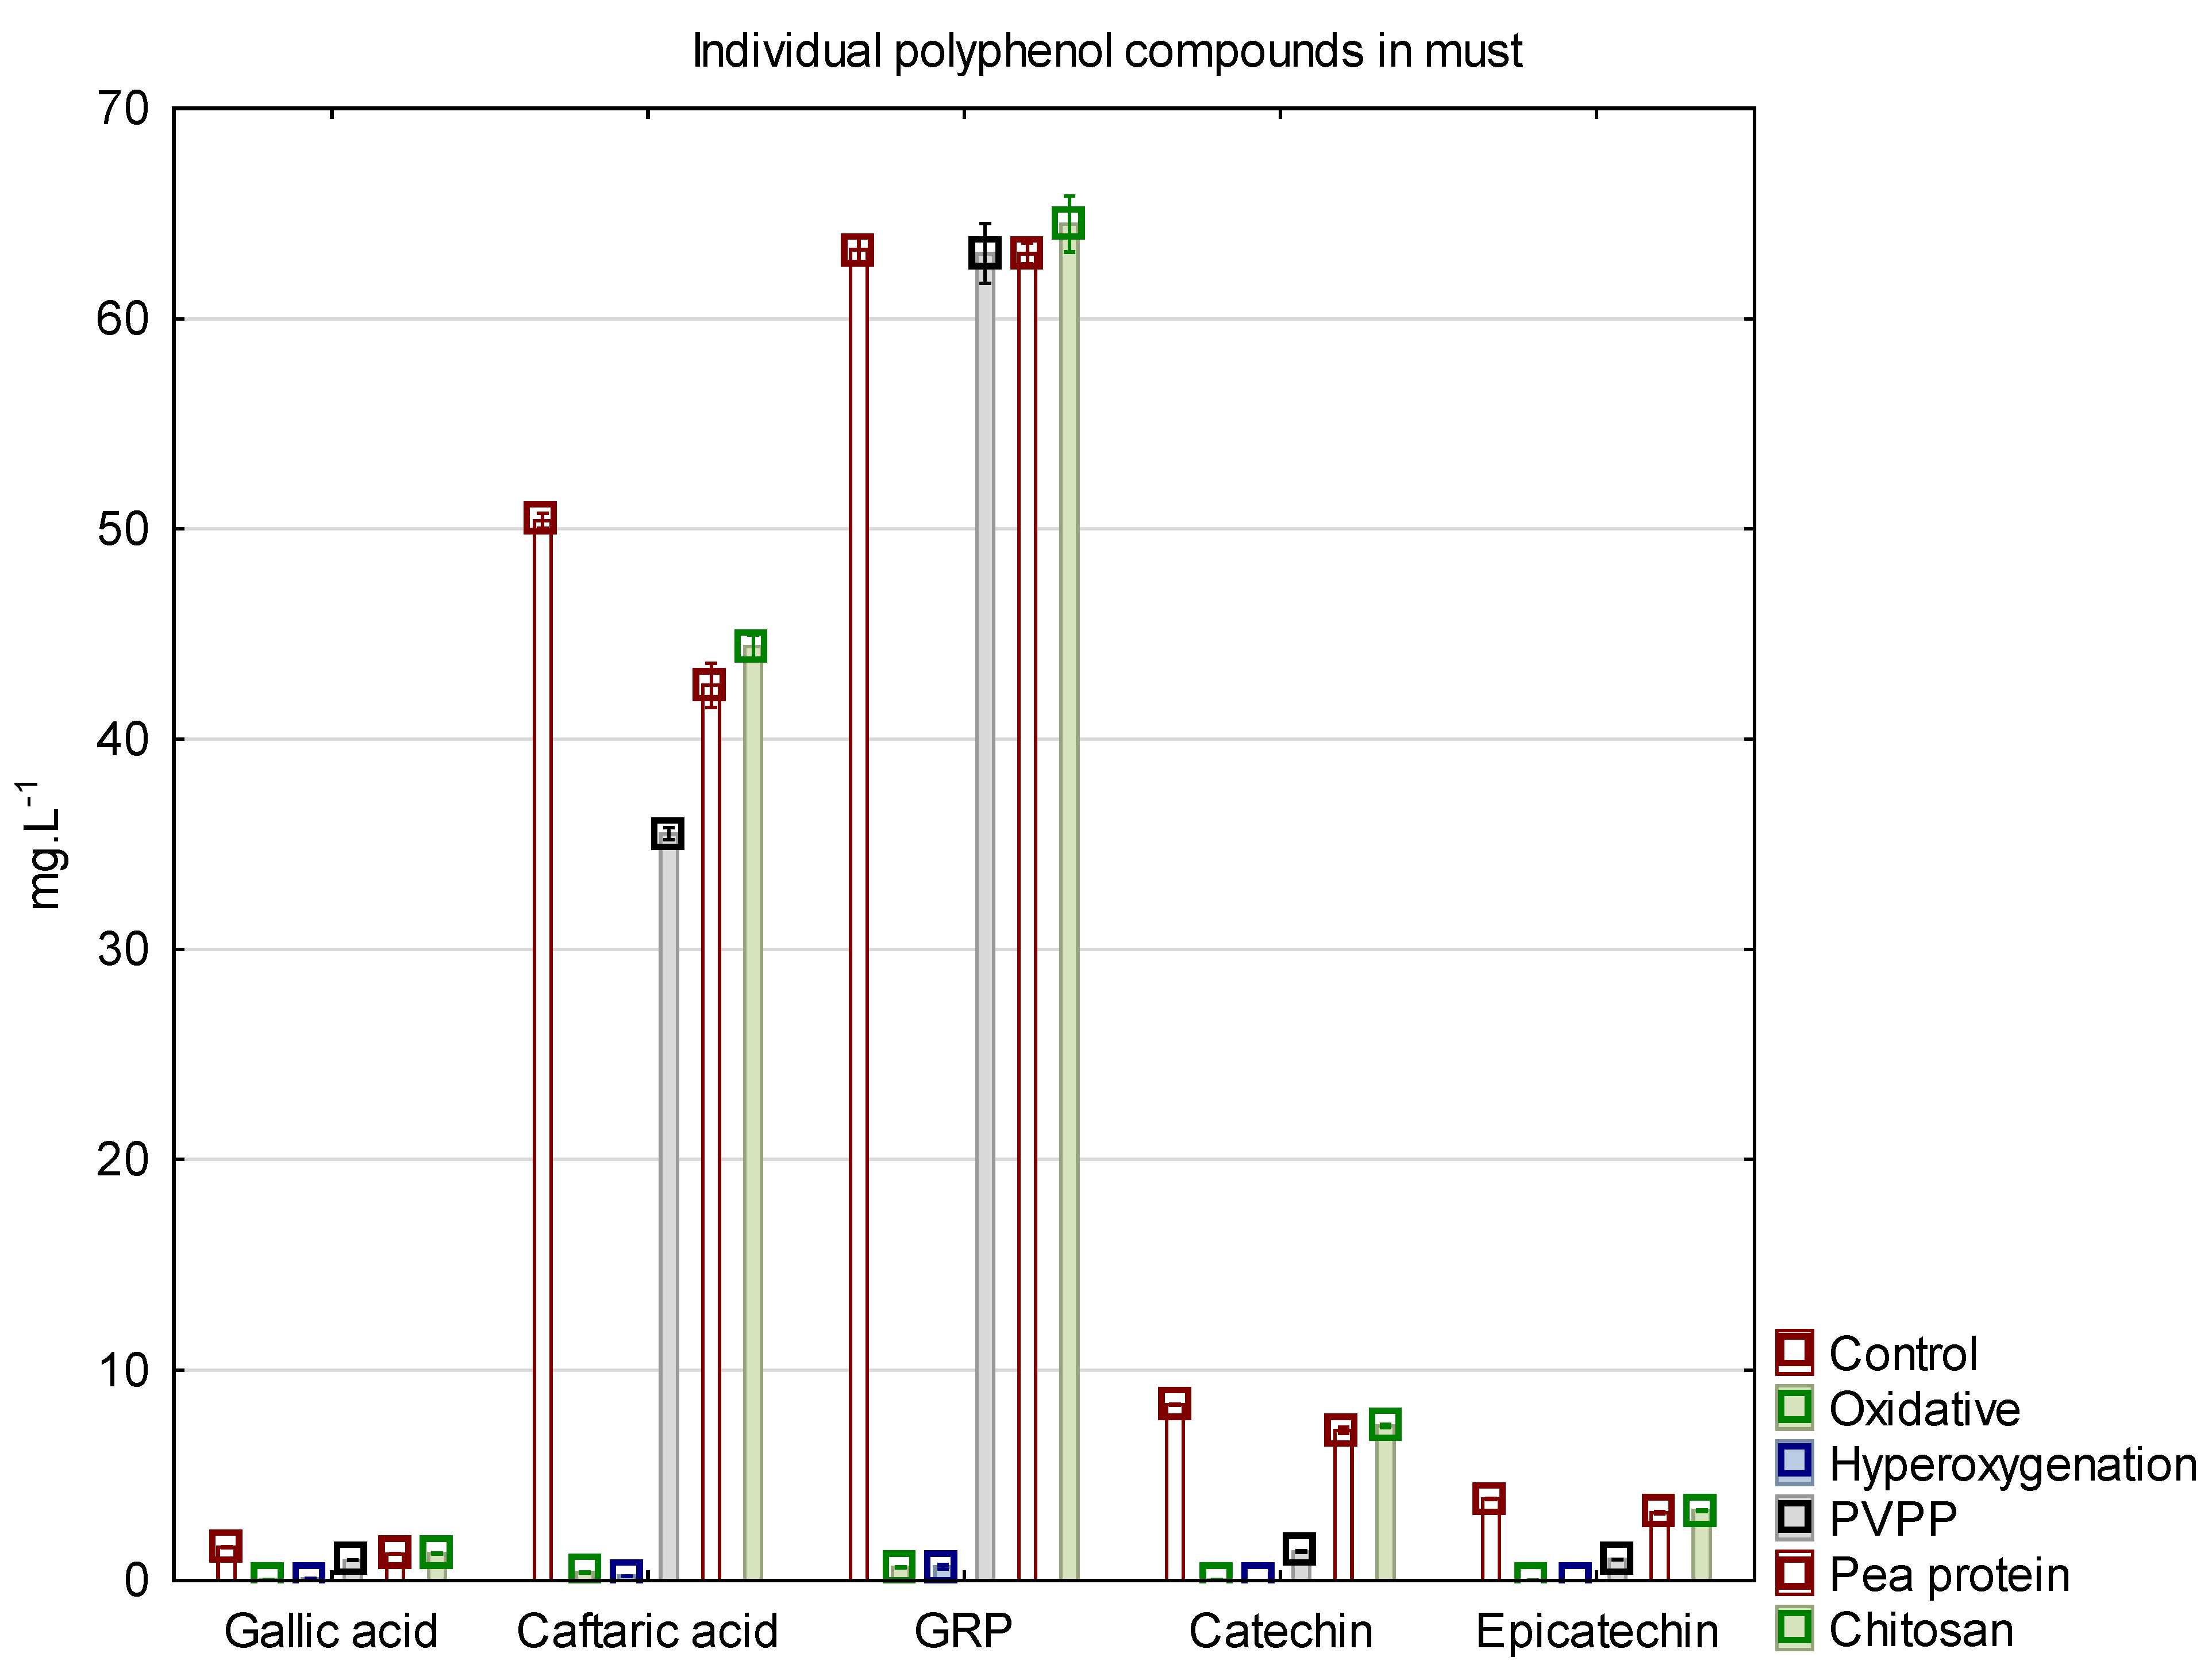
| Phenols in Must (mg·L−1) | Control | Oxidative | Hyperoxygenation | PVPP | Pea Protein | Chitosan |
|---|---|---|---|---|---|---|
| Hydroxybenzoic acids | ||||||
| Gallic acid | 1.58 ± 0.03 d | 0.04 ± 0.01 a | 0.08 ± 0.02 a | 0.96 ± 0.01 c | 1.26 ± 0.01 b | 1.29 ± 0.02 b |
| Protocatechuic acid | 1.39 ± 0.01 a | 0.21 ± 0.01 b | 0.24 ± 0.01 c | 1.11 ± 0.00 d | 1.90 ± 0.01 e | 1.78 ± 0.01 f |
| 4-Hydroxybenzoic acid | 0.47 ± 0.01 e | 0.51 ± 0.01 ab | 0.49 ± 0.01 a | 0.4 ± 0.00 d | 0.55 ± 0.01 c | 0.53 ± 0.01 bc |
| Vanillic acid | 0.06 ± 0.02 | 0.04 ± 0.02 | 0.05 ± 0.02 | 0.03 ± 0.03 | 0.10 ± 0.03 | 0.11 ± 0.02 |
| Sirring acid | 0.01 ± 0.01 a | nd a | nd a | nd a | 0 ± 0.00 a | 0.04 ± 0.02 b |
| Hydroxycinnamic acids | ||||||
| Caftaric acid | 50.38 ± 0.37 e | 0.37 ± 0.02 a | 0.21 ± 0.02 a | 35.50 ± 0.29 b | 42.56 ± 1.05 c | 44.40 ± 0.57 d |
| GRP | 63.28 ± 0.63 a | 0.62 ± 0.02 b | 0.65 ± 0.11 b | 63.10 ± 1.42 a | 63.10 ± 0.49 a | 64.51 ± 1.34 a |
| Caffeic acid | 0.22 ± 0.01 a | 0.09 ± 0.00 b | 0.09 ± 0.01 b | 0.22 ± 0.00 a | 0.24 ± 0.01 a | 0.23 ± 0.01 a |
| Coutaric acid | 10.10 ± 0.07 b | 2.78 ± 0.11 a | 2.65 ± 0.06 a | 8.93 ± 0.03 c | 9.83 ± 0.07 b | 10.48 ± 0.11 d |
| p-Coumaric acid | 0.16 ± 0.00 b | 0.08 ± 0.00 c | 0.11 ± 0.01 c | 0.20 ± 0.01 a | 0.20 ± 0.01 a | 0.18 ± 0.00 ab |
| Fertaric acid | 7.88 ± 0.04 e | 0.23 ± 0.01 a | 0.22 ± 0.02 a | 6.82 ± 0.07 b | 7.29 ± 0.05 c | 7.61 ± 0.02 d |
| Ferulic acid | 0.04 ab | nd c | nd c | 0.04 ± 0.00 b | 0.03 ± 0.01 ab | 0.03 ± 0.00 a |
| Flavanols | ||||||
| Catechin | 8.36 ± 0.03 e | 0.03 ± 0.02 a | nd a | 1.38 ± 0.04 b | 7.15 ± 0.15 c | 7.36 ± 0.07 d |
| Epicatechin | 3.88 ± 0.03 e | 0.01 ± 0.01 a | nd a | 1.00 ± 0.01 b | 3.22 ± 0.06 c | 3.33 ± 0.05 d |
| Procyanidin B1 | 4.35 ± 0.03 e | nd a | nd a | 0.34 ± 0.04 b | 3.80 ± 0.04 c | 4.11 ± 0.05 d |
| Procyanidin B2 | 1.20 ± 0.03 e | nd a | nd a | 0.12 ± 0.01 b | 0.95 ± 0.02 c | 1.02 ± 0.02 d |
| Procyanidin C | 0.65 ± 0.03 c | nd a | nd a | nd a | 0.37 ± 0.05 b | 0.36 ± 0.04 b |
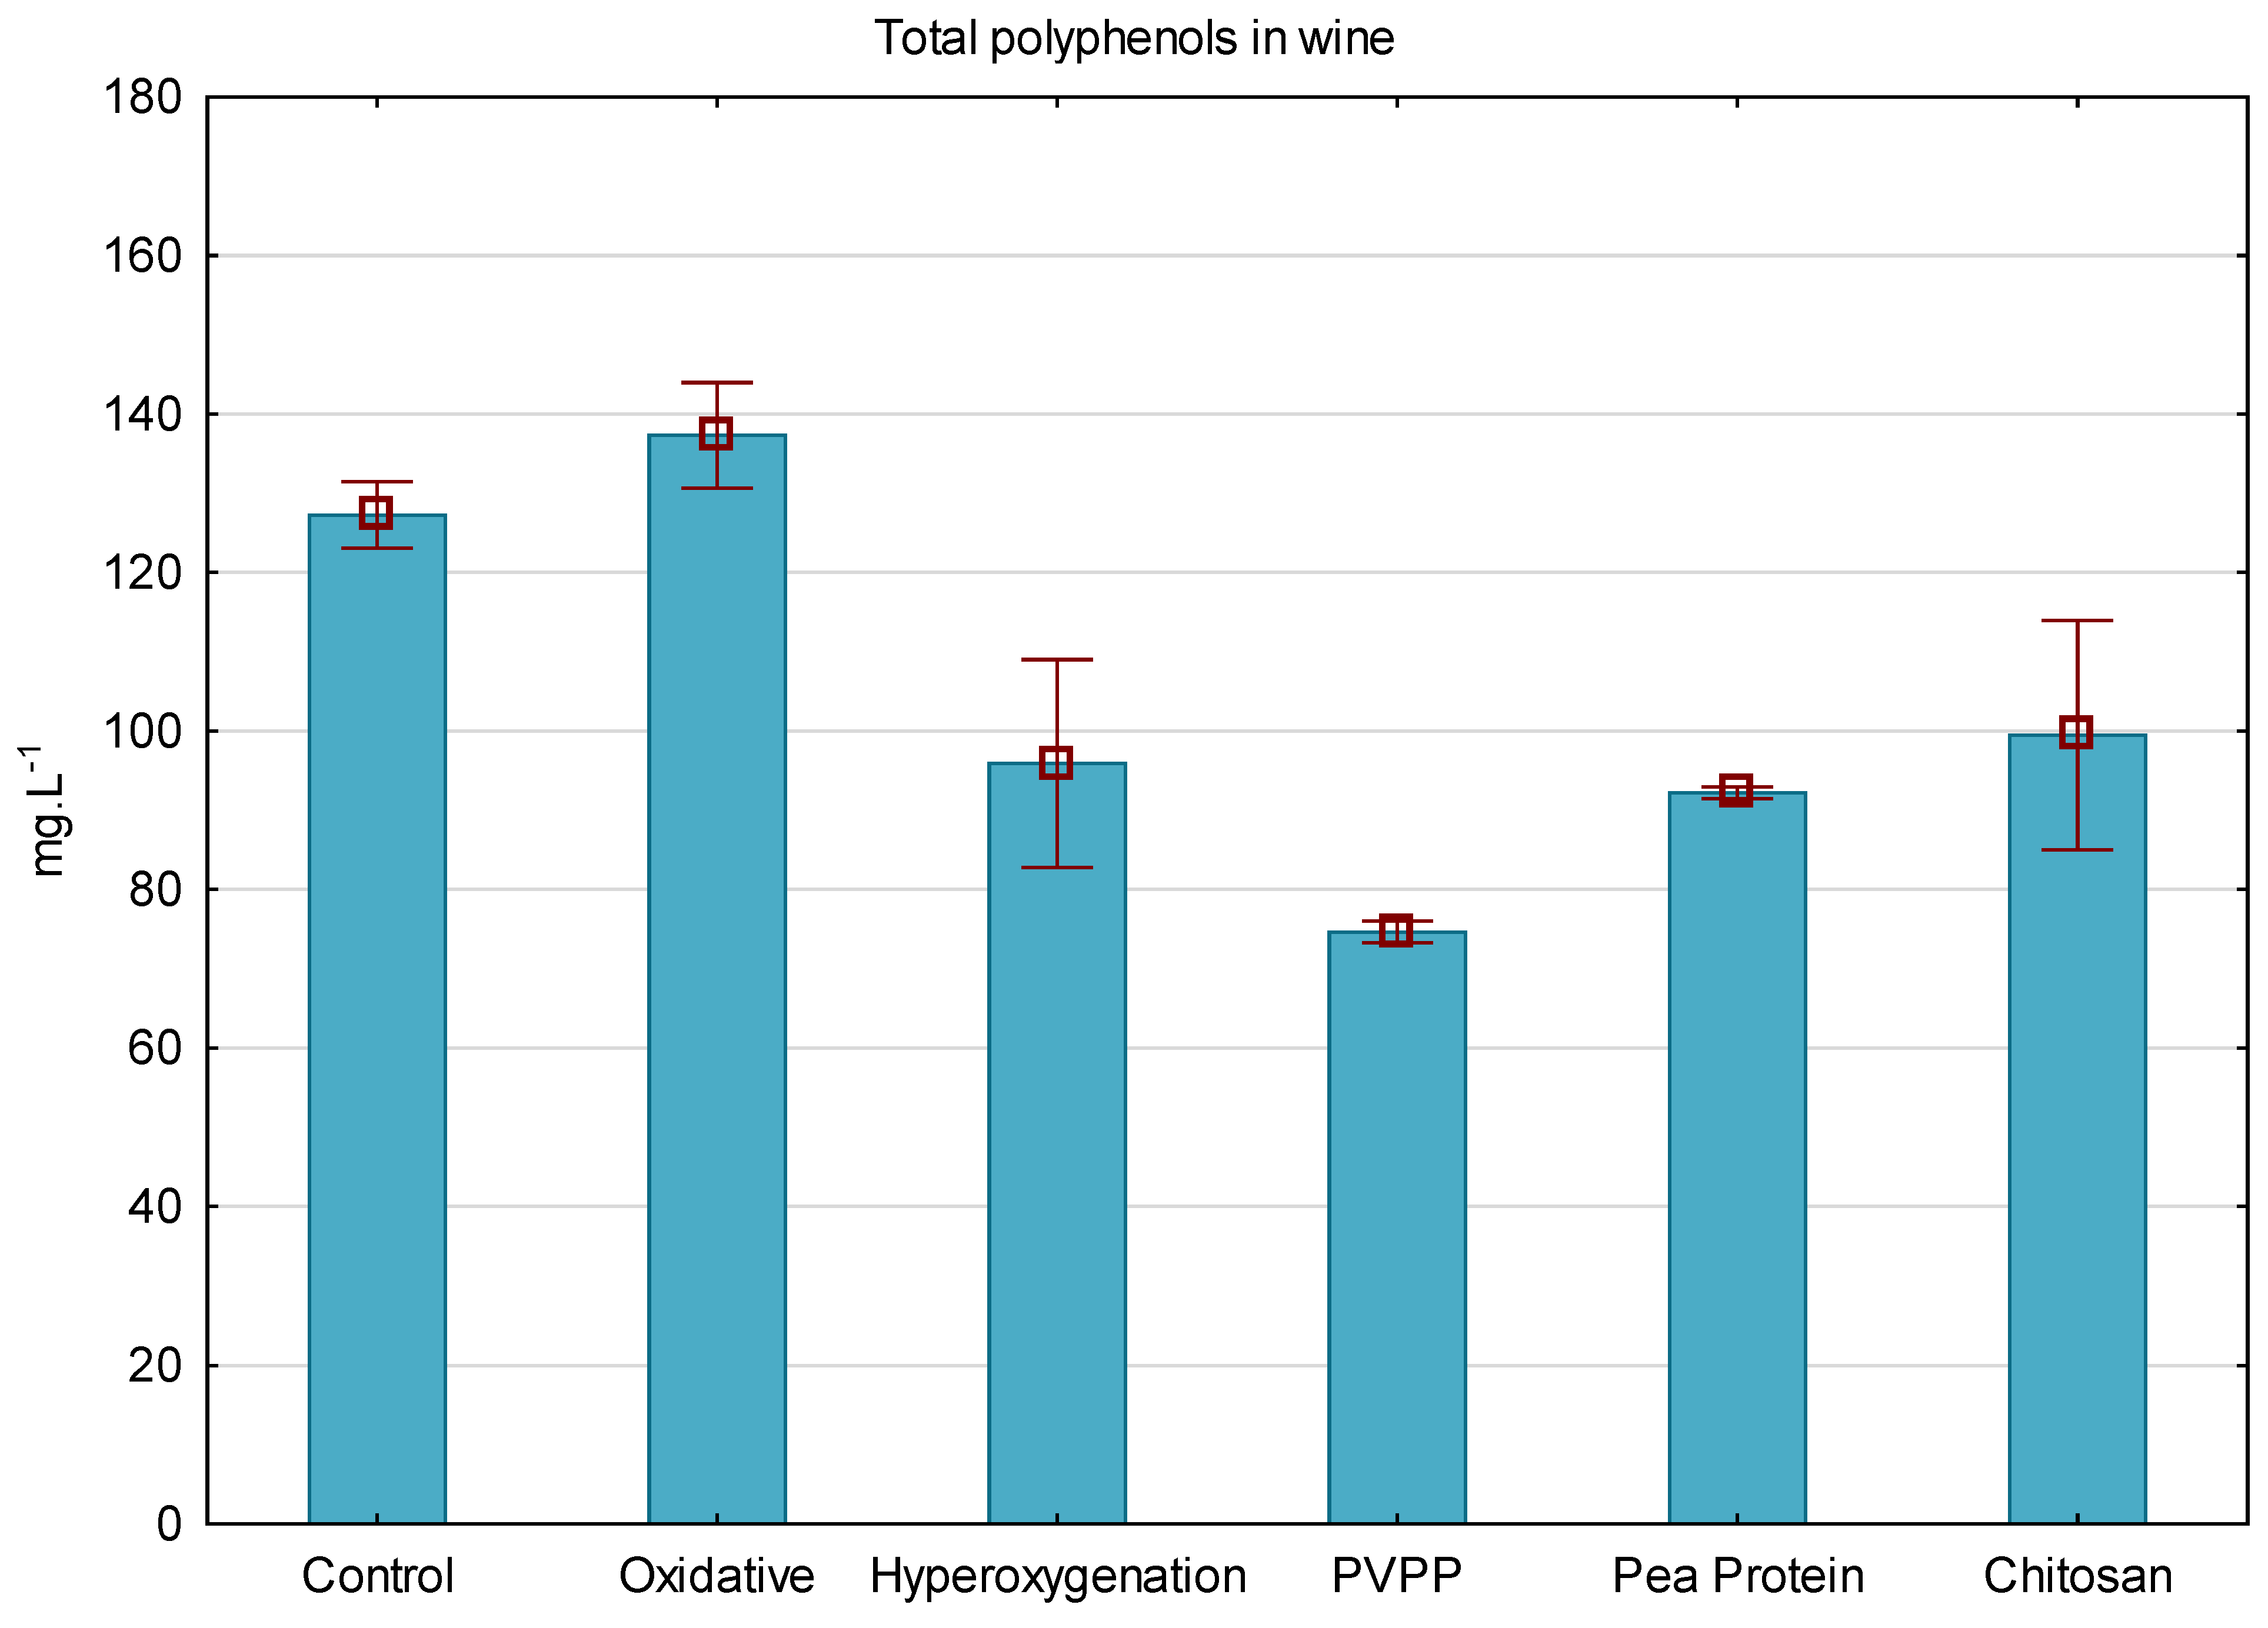
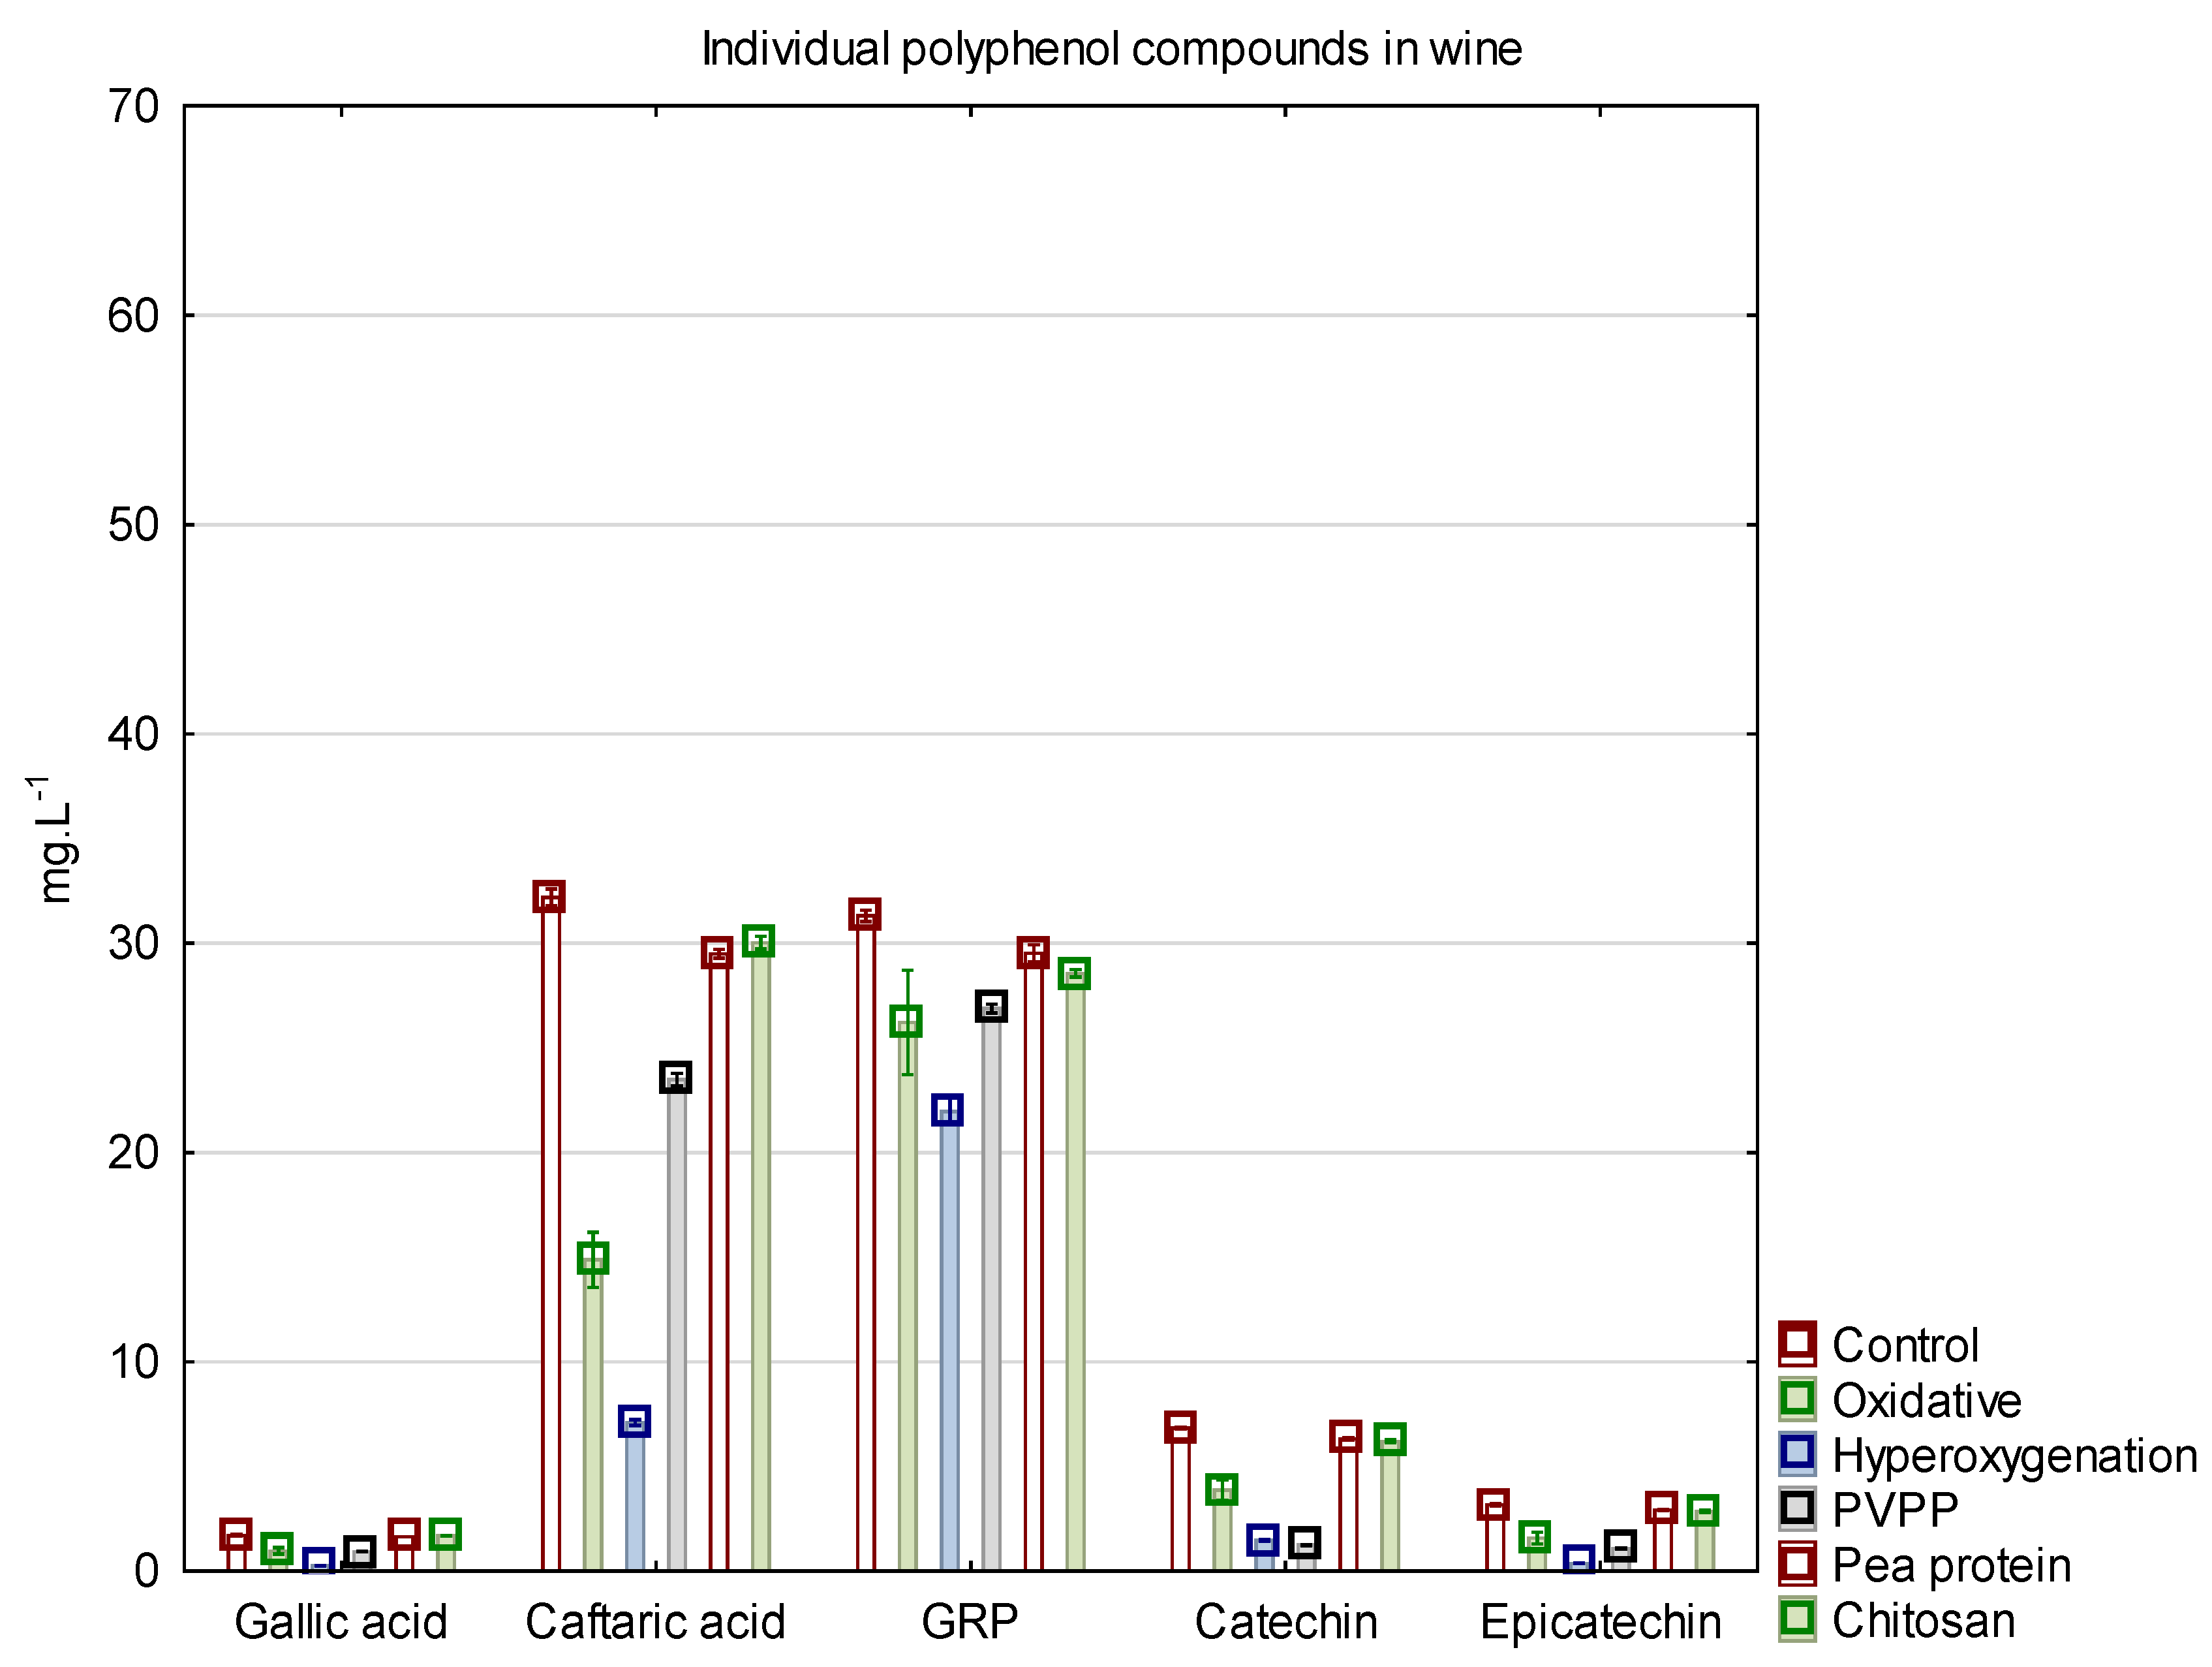
| Phenols in Wine (mg·L−1) | Control | Oxidative | Hyperoxygenation | PVPP | Pea Protein | Chitosan |
|---|---|---|---|---|---|---|
| Hydroxybenzoic acids | ||||||
| Gallic acid | 1.71 ± 0.04 a | 0.97 ± 0.16 b | 0.27 ± 0.01 c | 0.93 ± 0.01 b | 1.64 ± 0.00 a | 1.7 ± 0.00 a |
| Protocatechuic acid | 2.55 ± 0.02 a | 1.55 ± 0.08 c | 1.83 ± 0.04 d | 2.06 ± 0.02 e | 2.64 ± 0.02 ab | 2.72 ± 0.01 b |
| 4-Hydroxybenzoic acid | 0.66 ± 0.01 ab | 0.54 ± 0.02 c | 0.58 ± 0.01 d | 0.63 ± 0.01 b | 0.69 ± 0.01 a | 0.70 ± 0.01 a |
| Vanillic acid | 0.37 ± 0.02 | 0.32 ± 0.02 | 0.34 ± 0.01 | 0.36 ± 0.01 | 0.37 ± 0.03 | 0.34 ± 0.03 |
| Sirring acid | 0.13 ± 0.01 a | 0.15 ± 0.01 b | 0.12 ± 0.01 a | 0.12 ± 0.00 a | 0.14 ± 0.00 ab | 0.13 ± 0.02 ab |
| Hydroxycinnamic acids | ||||||
| Caftaric acid | 32.19 ± 0.40 b | 14.88 ± 1.32 d | 7.10 ± 0.15 c | 23.49 ± 0.29 e | 29.49 ± 0.22 a | 30.02 ± 0.31 ab |
| GRP | 31.31 ± 0.27 b | 26.21 ± 2.49 a | 21.97 ± 0.65 c | 26.88 ± 0.21 ab | 29.41 ± 0.41 ab | 28.56 ± 0.18 ab |
| Caffeic acid | 0.81 ± 0.03 d | 0.49 ± 0.05 a | 0.39 ± 0.01 c | 0.5 ± 0.00 a | 0.67 ± 0.02 b | 0.67 ± 0.01 b |
| Coutaric acid | 7.94 ± 0.04 c | 6.94 ± 0.08 a | 4.50 ± 0.02 d | 6.93 ± 0.03 a | 7.69 ± 0.05 b | 7.84 ± 0.04 bc |
| p-Coumaric acid | 0.74 ± 0.00 ab | 0.76 ± 0.02 a | 0.71 ± 0.01 b | 0.67 ± 0.00 c | 0.78 ± 0.01 a | 0.75 ± 0.00 a |
| Fertaric acid | 7.11 ± 0.04 ac | 7.22 ± 0.12 a | 7.25 ± 0.07 a | 6.21 ± 0.04 d | 6.79 ± 0.02 b | 6.97 ± 0.03 bc |
| Ferulic acid | 0.32 ± 0.01 b | 0.36 ± 0.02 c | 0.32 ± 0.00 ab | 0.28 ± 0.01 a | 0.32 ± 0.00 ab | 0.31 ± 0.01 abc |
| Flavanols | ||||||
| Catechin | 6.84 ± 0.04 a | 3.87 ± 0.48 c | 1.48 ± 0.04 b | 1.24 ± 0.03 b | 6.32 ± 0.06 a | 6.20 ± 0.07 a |
| Epicatechin | 3.17 ± 0.06 a | 1.58 ± 0.28 b | 0.37 ± 0.01 c | 1.08 ± 0.02 b | 2.92 ± 0.03 a | 2.86 ± 0.07 a |
| Procyanidin B1 | 3.35 ± 0.06 d | 1.43 ± 0.29 c | 0.25 ± 0.01 a | nd a | 2.70 ± 0.04 b | 2.50 ± 0.03 b |
| Procyanidin B2 | 0.97 ± 0.01 d | 0.44 ± 0.08 c | 0.07 ± 0.01 a | nd a | 0.78 ± 0.01 b | 0.76 ± 0.01 b |
| Procyanidin C | 0.12 ± 0.08 | nd | nd | nd | 0.10 ± 0.06 | nd |
| Volatile Compounds | Aroma Descriptor * | Control | Oxidative | Hyperoxygenation | PVPP | Pea Protein | Chitosan | |
|---|---|---|---|---|---|---|---|---|
| Higher alcohols | ||||||||
| Isoamyl alcohol | mg·L−1 | ripe fruit | 163.26 ± 3.61 a | 174.65 ± 2.39 c | 166.35 ± 2.85 a | 160.44 ± 0.38 ab | 152.10 ± 2.32 b | 170.26 ± 3.66 ac |
| Isobutanol | mg·L−1 | Ether. fruits | 21.05 ± 0.23 abc | 21.67 ± 0.28 c | 21.03 ±0.17 ab | 20.38 ± 0.12 ab | 20.72 ± 0.36 a | 21.32 ± 0.23 bc |
| 2-Phenylethanol | mg·L−1 | rose. talc. honey | 8.49 ± 0.23 a | 9.45 ± 0.13 c | 9.05 ± 0.16 bc | 8.99 ± 0.25 abc | 8.62 ± 0.11 ab | 9.00 ± 0.28 abc |
| 1-Propanol | mg·L−1 | Fruits. alcohol | 9.45 ± 0.08 a | 14.16 ± 0.30 c | 14.33 ± 0.26 c | 8.24 ± 0.06 b | 9.12 ± 0.18 ab | 9.67 ± 0.11 a |
| 1-Hexanol | mg·L−1 | fresh cut grass | 1.08 ± 0.02 a | 1.42 ± 0.02 b | 1.45 ± 0.02 b | 1.15 ± 0.02 a | 1.15 ± 0.02 a | 1.09 ± 0.03 a |
| C6 unsaturated alcohols | ||||||||
| (E)−3-Hexen-1-ol | µg·L−1 | grass | 48.74 ± 1.93 a | 33.61 ± 4.87 b | 40.05 ± 1.27 ab | 42.88 ± 0.46 ab | 47.84 ± 1.31 a | 39.88 ± 1.28 ab |
| (Z)-3-Hexen-1-ol | µg·L−1 | grass | 47.89 ± 2.74 a | 41.05 ± 5.24 b | 28.42 ± 2.60 ab | 35.21 ± 2.33 ab | 35.29 ± 1.79 a | 38.04 ± 1.11 ab |
| Acetate esters | ||||||||
| Ethyl acetate | mg·L−1 | fruity. nail polish | 36.60 ± 0.70 a | 46.58 ± 0.49 d | 44.04 ± 0.19 c | 41.50 ± 1.85 b | 38.15 ± 0.36 a | 38.42 ± 0.37 a |
| Isoamyl acetate | µg·L−1 | banana | 2782.57 ± 13.73 c | 2223.62 ± 40.63 b | 2052.77 ± 44.24 a | 2090.89 ± 56.90 a | 2061.34 ± 19.59 a | 2069.96 ± 18.70 a |
| Hexyl acetate | µg·L−1 | pear | 289.93 ± 7.25 c | 216.73 ± 3.58 a | 229.29 ± 2.57 b | 209.05 ± 3.37 a | 210.72 ± 3.51 a | 211.24 ± 1.95 a |
| 2-Phenylethyl acetate | µg·L−1 | Peaches. honey. roses | 285.42 ± 3.70 c | 308.54 ± 4.39 b | 310.24 ± 2.64 b | 217.54 ± 4.46 a | 226.56 ± 2.77 a | 229.76 ± 3.50 a |
| Isobutyl acetate | µg·L−1 | Fruits | 158.97 ± 4.55 e | 103.82 ± 1.51 c | 91.41 ± 2.26 b | 133.94 ± 3.68 a | 130.17 ± 3.14 a | 118.79 ± 4.13 d |
| Ethyl esters | ||||||||
| Ethyl butyrate | µg·L−1 | Fruits | 310.67 ± 7.57 b | 391.03 ± 8.14 c | 381.64 ± 12.19 c | 296.40 ± 8.32 ab | 290.21 ± 6.42 ab | 274.04 ± 6.53 a |
| Ethyl hexanoate | µg·L−1 | Flowers. green apple | 675.99 ± 6.74 b | 775.58 ± 13.09 c | 804.93 ± 5.43 d | 612.16 ± 13.95 a | 608.10 ± 8.88 a | 639.67 ± 1.63 a |
| Ethyl octanoate | µg·L−1 | Raisins | 1057.14 ± 28.46 ab | 1053.88 ± 8.43 ab | 1080.04 ± 10.04 b | 993.63 ± 6.83 c | 958.66 ± 11.81 cd | 1035.02 ± 5.28 ad |
| Ethyl decanoate | µg·L−1 | flowers. soap-like | 356.94 ± 1.74 a | 363.36 ± 5.12 ab | 372.63 ± 5.87 b | 362.36 ± 3.35 ab | 300.32 ± 4.00 c | 366.23 ± 0.86 ab |
| Ethyl dodecanoate | µg·L−1 | 27.26 ± 0.56 a | 25.53 ± 0.78 a | 26.03 ± 0.81 a | 24.80 ± 1.57 a | 15.59 ± 0.34 b | 21.40 ± 0.09 c | |
| Ethyl lactate | mg·L−1 | 2.13 ± 0.06 a | 2.34 ± 0.20 a | 2.10 ± 0.13 a | 4.59 ± 0.18 b | 4.12 ± 0.51 b | 4.36 ± 0.06 b | |
| Diethyl succinate | mg·L−1 | melon. vinous | 0.17 ± 0.01 ab | 0.20 ± 0.01 b | 0.14 ± 0.01 a | 0.63 ± 0.02 c | 0.65 ± 0.01 c | 0.57 ± 0.02 d |
| Diethylmalate | mg·L−1 | 0.45 ± 0.06 a | 0.50 ± 0.03 a | 0.45 ± 0.04 a | 1.27 ± 0.04 bc | 1.33 ± 0.02 c | 1.18 ± 0.03 b | |
| Volatile phenols | ||||||||
| 4-Vinylguaiacol | µg·L−1 | carnations | 275.81 ± 15.13 a | 113.50 ± 33.38 c | 29.69 ± 1.16 b | 212.48 ± 3.25 a | 226.24 ± 0.39 a | 210.37 ± 4.98 a |
| 4-Vinylfenol | µg·L−1 | almond shell | 1457.49 ± 38.84 c | 1253.40 ± 66.83 b | 1127.29 ± 32.00 a | 1065.47 ± 11.11 a | 1127.42 ± 19.01 ab | 1073.45 ± 6.49 a |
| Others | ||||||||
| Acetoin | mg·L−1 | buttery. cream | 2.24 ± 0.26 a | 1.30 ± 0.10 b | 1.09 ± 0.06 b | 2.13 ± 0.07 a | 2.10 ± 0.10 a | 2.17 ± 0.03 a |
| 2,3-Butandiol | mg·L−1 | 577.93 ± 16.75 ab | 736.26 ± 11.90 c | 725.21 ± 12.43 c | 543.94 ± 3.60 a | 589.06 ± 5.83 b | 587.13 ± 10.23 ab | |
| 1,1-Diethoxyethan (Acetal) | µg·L−1 | 84.26 ± 5.81 a | 44.67 ± 2.70 d | 25.57 ± 2.02 c | 96.82 ± 2.03 b | 74.29 ± 3.58 a | 97.38 ± 6.60 b | |
Publisher’s Note: MDPI stays neutral with regard to jurisdictional claims in published maps and institutional affiliations. |
© 2022 by the authors. Licensee MDPI, Basel, Switzerland. This article is an open access article distributed under the terms and conditions of the Creative Commons Attribution (CC BY) license (https://creativecommons.org/licenses/by/4.0/).
Share and Cite
Rihak, Z.; Prusova, B.; Prokes, K.; Baron, M. The Effect of Different Fining Treatments on Phenolic and Aroma Composition of Grape Musts and Wines. Fermentation 2022, 8, 737. https://doi.org/10.3390/fermentation8120737
Rihak Z, Prusova B, Prokes K, Baron M. The Effect of Different Fining Treatments on Phenolic and Aroma Composition of Grape Musts and Wines. Fermentation. 2022; 8(12):737. https://doi.org/10.3390/fermentation8120737
Chicago/Turabian StyleRihak, Zdenek, Bozena Prusova, Kamil Prokes, and Mojmir Baron. 2022. "The Effect of Different Fining Treatments on Phenolic and Aroma Composition of Grape Musts and Wines" Fermentation 8, no. 12: 737. https://doi.org/10.3390/fermentation8120737