Article

Antioxidant and Functional Features of Pre-Fermented Ingredients Obtained by the Fermentation of Milling By-Products

1
Department of Agricultural and Food Sciences, University of Bologna, 47521 Cesena, Italy
2
Interdepartmental Centre for Agri-Food Industrial Research, University of Bologna, 47521 Cesena, Italy
3
Department of Pharmacy and Biotechnology, University of Bologna, 40127 Bologna, Italy
4
Kerry Campus, Munster Technological University, Clash, V92 HD4V Tralee, Ireland
*
Authors to whom correspondence should be addressed.
Fermentation 2022, 8(12), 722; https://doi.org/10.3390/fermentation8120722
Submission received: 22 November 2022 / Revised: 7 December 2022 / Accepted: 8 December 2022 / Published: 9 December 2022

Abstract

:
The use of milling by-products as ingredients in food formulations has increased gradually over the past years, due to their well-recognized health properties. Fermentation performed with selected microbial strains or microbial consortia is the most promising way to reduce antinutritional factors of cereals and bran, while increasing their nutritional and functional properties. This work, developed within the BBI project INGREEN, was aimed to study the functional, nutritional and technological features of a pre-fermented ingredient obtained from the fermentation of a mixture of rye bran and wheat germ by a selected microbial consortium composed of yeasts (Kazachstania unispora and Kazachstania servazii) and lactic acid bacteria (Latilactobacillus curvatus) using as reference the unfermented mixture and the same mixture fermented by a baker’s yeast. The selected microbial consortium improved the complexity of the volatile molecules such as acids, alcohols and esters. A better retention of color parameters was maintained compared to the product fermented by a baker’s yeast. In addition, the fermentation by the selected consortium showed a significant increase in short chain fatty acids (more than 5-fold), antioxidant activity (22–24%), total phenol content (53–71%), bioactive peptides (39–52%), a reduction of 20–28% in phytic acid content and an increase in prebiotic activity not only compared to the unfermented product but also compared to the preferment obtained with a baker’s yeast. Overall, the fermentation by the selected microbial consortium can be considered a valuable way to valorize milling by-products and promote their exploitation as food ingredients.

1. Introduction

World cereal production stands at around 2.77 million tons/year [1] which makes cereals one of the main food sources for human consumption [2]. Among cereals, wheat, rice, corn, barley, rye, sorghum and oats are the most consumed ones [3]. During milling processing, several by-products are produced and classified based on particle size and endosperm content. Among them, bran and germ represent the most abundant ones [4]. Currently, cereal bran and germ are mainly used as a feed supplement, while the application in the food sector plays only a minor role [2,5,6]. Although the interest in using bran and germ in food formulation has increased gradually over the years, due to their widely recognized health properties [7,8], their current usage is too limited compared to their production rate (millions of metric tons a year), and it does not fully exploit their wide technological and functional potential [9]. For example, rye bran represents a valuable by-product due to its composition (33.4% cellulose, 5.3% hemicellulose, 3.3% lignin, 18.6% starch, 17.0% protein and 2.5% lipids) [10]. In addition, rye bran contains high amounts of bioactive compounds, including ferulic acid, characterized by antioxidant, anti-inflammatory, and anticancer properties [11]. However, its application in the food sector is still limited due to the negative impact on the sensory properties (mainly appearance, taste and texture) of food, reducing consumer acceptance to a certain extent [2,12]. Additionally, wheat germ is reported to be an excellent source of vitamins, minerals, dietary fiber, proteins, and some functional micronutrients [13,14]. However, the presence of wheat germ adversely affects the quality of flour and bran products, mainly due to the oxidation of unsaturated fatty acids [2,15].
Literature data show that fermentation and enzymatic treatments of cereal bran may increase its functionality [8,16]. In fact, some technological and health promoting properties of bran can be increased by the activity of selected microorganisms or microbial consortia [2,17]. Fermentation performed by selected microbial strains and consortia is the most promising way to reduce the phytate content of cereals and bran, increasing their nutritional values [11]. Literature data indicate that fermentation with well-characterized microbial cultures, containing yeasts and lactic acid bacteria (LAB), represents a useful tool to improve the quality, processability and functionality of fermented cereal products or high fiber ingredients, such as sourdough bread, fermented wheat bran and whole-meal flour [18]. For this reason, the interest in the selection of microbial consortia for the fermentation of milling by-products has greatly increased in recent years [2]. For example, a microbial consortium containing Levilactobacillus brevis and Kazachstania exigua increased the nutritional quality of fermented bran compared to native bran [4]. Fermentation of wheat bran with Levilactobacillus brevis and Candida humilis increased also the functionality of native bran due to the release of free amino acids and phenols [19]. Therefore, a sourdough-like fermentation could improve the nutritional and functional profile of rye bran and wheat germ, also compared to the use of baker’s yeast, usually applied in bakery processes [20,21].
In this context, the aim of this work was to study the functional, nutritional and technological features of a pre-fermented ingredient obtained from the fermentation of a mixture of rye bran and wheat germ by a selected microbial consortium composed of yeast and LABs. The new pre-fermented ingredient was compared with an unfermented milling by-product mixture and a mixture fermented by baker’s yeast (benchmark). In fact, sourdough-like fermentation could improve the nutritional and functional profile of cereal bran compared to the use of traditional baker’s yeast. This study allowed us to valorize a low value by-product into a high functional food ingredient potentially suitable for bakery application.

2. Materials and Methods

2.1. Raw Material: Wheat Germ and Rye Bran

The wheat germ and rye bran were provided by Molini Pivetti S.p.A. (Ferrara, Italy) and Barilla G. e R. F.lli S.p.A. (Parma, Italy), respectively. Samples of wheat germ and rye bran were characterized for moisture, protein, ash, crude fat, soluble, insoluble, and total dietary fiber, as well as mineral content according to [22]. The fatty acid profiles and starch content were determined according to AOAC International [23] and AACC [24], respectively. Lipid fractions were analyzed by gas chromatograph combined with mass spectrometer according to AACC [24]. Phytate content was determined according to Buddrick et al. [25].
The chemical composition of the raw ingredients used in this work is summarized in Table 1.

2.2. Microbial Consortium

A microbial consortium composed of one lactic acid bacterium (LAB) and two yeasts was used as starter for the fermentation of milling by-products. The strains were Latilactobacillus curvatus LS1, Kazachstania unispora FM2 and Kazachstania servazii KAZ2. All the strains belong to the collection of the Department of Agricultural and Food Sciences of Bologna University and were isolated from spontaneously fermented wheat and rye bran. This consortium was selected after a preliminary functional and technological characterization and on the basis of its rapid growth both on wheat germ and rye bran, in the framework of the EU project INGREEN. Both LAB and yeast strains were maintained as frozen stocks (−80 °C), respectively, on Maltose, Man, Rogosa and Sharpe (mMRS) medium (Oxoid, Italy) and on Yeast Extract–Peptone–Dextrose (YPD) medium (Oxoid, Italy), supplemented with 25% glycerol (w/v). The cultures were propagated three times with about 3% (v/v) inoculum in MRS for Latilactobacillus curvatus and YPD for Kazachstania spp. and incubated at 25 °C for 24 h for LAB and 48 h for yeasts.

2.3. Fermentation Process

A milling by-product mixture was prepared in the amount of 1 kg using rye bran (70%) and wheat germ (30%) and placed in a commercial kneader (Major, Kenwood, Italy). The composition of the mixture was preliminarily chosen on the basis of the compositional characteristics of the by-products and the ability of the microbial consortium to have rapid fermentation kinetics and to remain stable over time. Tap water was added in proportion 2:1 to milling by-products. The three strains were previously propagated, as reported above, and then cultivated for 24 h at 25 °C in mMRS broth for Latilactobacillus curvatus and in YPD broth for Kazachstania unispora and Kazachstania servazii. The strains were than collected by centrifugation at 10,000 rpm, washed twice in saline solution (0.9% NaCl) and resuspended in the same solution before their use. The strains were inoculated in the hydrated milling by-product mixture in order to reach a cell load of about 6.5 log CFU/g for Latilactobacillus curvatus and 4.5 log CFU/g for the two yeast strains.
After mixing the inoculated ingredients with a kneader, the mixture was transferred to a sanitized tank, and the fermentation process was conducted in a static way at 25 °C for 24 h. As a benchmark, the same milling by-product mixture, prepared as described above, was inoculated with a lyophilized commercial bakery yeast (Lievital, Lesaffre Italia, Parma, Italy) at an initial level of 7.0 log CFU/g. The lyophilized yeast culture was rehydrated prior to use by adding water at 30 °C for 15 min. Eventually, an unfermented milling by-product mixture was included in the sample set. Fermentation experiments were carried out in triplicate.
Three different preferments were obtained:
  • Milling by-product mixture fermented by the microbial consortium of yeasts and LAB (FM),
  • Milling by-product mixture fermented by a commercial bakery yeast (benchmark)
  • Unfermented milling by-product mixture (UF).

2.4. Acidification Kinetics and Plate Count

The kinetics of acidification were monitored by measuring the pH of the different preferments after 17, 20, 22 and 24 h of fermentation at 25 °C. At the beginning and at the end of fermentation, the cell loads of LAB and yeasts were determined by plate counting on selective agar media: m-MRS + 0.02% cycloheximide for the enumeration of LAB, and YPD + 0.02% chloramphenicol for the enumeration of yeasts. In addition, at the end of fermentation, total titratable acidity (TTA) was determined according to Rizzello et al. [14].

2.5. Nutritional Profile

The preferments were characterized for energy, fats, saturated fatty acids, carbohydrates, sugars, dietary fiber, proteins, and salt according to the Reg UE 1169/2011 25/10/2011 GU CE L304 22/11/2011. In particular, the energy content was evaluated according to da Rocha et al. [26]. The fat content was measured by a Soxhlet extraction method according to AOAC official methods 920.39 [27], and saturated fatty acids were analyzed according to dos Santos Oliveira et al. [28]. The carbohydrate content (%) was calculated by subtracting the contents of ash, fat, fiber and protein from 100% dry matter, according to Costantini et al. [29]. Sugar content was evaluated according to Luchese et al. [30], while dietary fiber was evaluated according to AACCI Approved Method 32–07.01, as reported by Khalid et al. [22]. Protein content was determined by the Kjeldahl method, using N × 5.7 as conversion factor. Acetic acid assay kit and Lactic acid assay kit (Megazyme, Ayr, UK) were used for the quantification of acetic acid and lactic acid, respectively. The fermentation quotient (QF) was determined as the molar ratio between lactic and acetic acids.

2.6. Color Analysis

Color was assessed by a Minolta® CR-400 colorimeter (Milan, Italy), previously calibrated using a standard white ceramic tile, in standardized illuminant (C) and observation angle (0 with respect to an area of 8 mm in diameter) conditions. The CIELAB system was utilized, and the parameters of lightness (L*), redness (a*) and yellowness (b*) were used to objectively define color [31].

2.7. Volatile Molecule Profiles and Short-Chain Fatty Acids

The volatile molecule profiles and short-chain fatty acids (SCFA) were detected using a GC-MS coupled with a solid-phase microextraction technique (SPME), according to Burns et al. [32] with some modifications reported by Rossi et al. [33].

2.8. Fatty Acid Profiles

The lipid fractions of the different preferments were extracted according to the method reported by Boselli et al. [34] with some modifications described in Rossi et al. [33]. The fatty acid composition was determined as fatty acid methyl esters (FAMEs) using GC-MS. Methyl tridecanoate (Sigma, Milan, Italy) (13:0, 0.02 mg/mL) was used as internal standard, and Supelco FAME MIX 37 (Sigma) was used as external reference. The total fatty acid methyl ester profiles analyses were carried out according to Rossi et al. [30].

2.9. Peptide and Phytate Content

The peptide content was determined on the purified fractions obtained from preferment samples. Specifically, 1 g of sample was diluted in 4 mL of Tris-HCl (pH 8.8) 50 mm, stored at 4 °C for 1 h vortexing every 15 min, and centrifuged at 20,000× g for 20 min. The supernatant containing albumins and globulins was used to determine the peptide concentration by the o-phtaldialdehyde (OPA) method according to Coda et al. [35]. As a reference, a standard curve prepared with tryptone (0.1 to 1.5 mg/mL) was used. Phytate content was analyzed according to the AOAC 986.11/88 methodology [36] with a confidence interval calculated at a probability level of about 95%.

2.10. Antioxidant Activity and Phenol Content

To determine total polyphenols and antioxidant activity, 5 g of sample was previously added with 50 mL of 80% methanol. After 30 min, the mixture was centrifuged at 6000 rpm for 20 min. The evaluation of antioxidant activity was performed on the samples using different methodologies. The 2,2-diphenyl-1-picryl-hydrazyl-hydrate (DPPH) assay was used according to Rizzello et al. [37]. For the calculation of the μmol DPPH radical scavenged by the extracts, the absorbance value measured after 10 min was read at 517 nm. A blank reagent was used to verify the stability of DPPH radical dot during the test time. The kinetics of the antioxidant reaction were also determined over 30 min and compared with Trolox as an antioxidant reference. The 2,2′-azino-bis (3-ethylbenzothiazoline-6-sulfonic acid (ABTS) assay was used as reported by Miller and Rice-Evans [38]. The ABTS antioxidant reaction mixture contained 3.0 mL of ethanolic ABTS with an absorbance between 0.68 a 0.72 at 734 nm, and 30 μL of extract sample or 30 μL of ethanol/water (1:1 v/v) for the control. The absorbance at 734 nm was measured every 30 s for 6 min, and the Trolox equivalent was calculated using a standard curve prepared with Trolox. Triplicate determination was performed.
The analysis of total polyphenols was carried out according to the Folin–Ciocalteu methodology as reported by Slinkard and Singleton [39]. The mixture absorbance was read at 750 nm, and the concentration of total phenols was expressed as gallic acid equivalent.

2.11. Prebiotic Activity

The prebiotic activity of the samples was evaluated towards several bacterial strains (Lactiplantibacillus plantarum ATCC 8014, Lacticaseibacillus rhamnosus ATCC 7469, Lactobacillus acidophilus ATCC 4356, Limosilactobacillus fermentum ATCC 9338, Bifidobacterium breve DSM 20091). Bifidobacterium angulatum DSM 20098 and Bifidobacterium longum DSM 20219 were purchased from Medical-Supply Co. Ltd. (Ireland), while Escherichia coli ECOR 1 (ATCC 35320) was purchased in freeze-dried form from ATCC-LGC Standards (UK). The prebiotic index (PI) scores of the various strains were calculated using the following formula:
P r e b i o t i c   I n d e x = ( 24   h increase in OD of probiote on prebiotic ) ( 24   h increase in OD in control MRS ) ( 24   h increase in OD of probiote on glu cos e ) ( 24   h increase in OD in control MRS ) ( 24   h increase in OD of E . c o l i on feed ) ( 24   h increase in OD in control LBA ) ( 24   h increase in OD of E . c o l i on glu cos e ) ( 24   h increase in OD in control MRS )
The formula determined the ratio of growth of Lactobacilli or Bifidobacteria using commercial prebiotics (FOS, GOS and inulin—Merck, Darmstadt, Germany) and preferments in relation to the growth of the non-probiotic E. coli. With the modified formula, glucose yielded a score of 1.00, and the growth of probiotic and enteric strains on known prebiotics or preferments was compared to growth on glucose. Negative or low PI scores were obtained for those strains that grew less on prebiotics or biomass than on glucose or/and exhibited less growth on the prebiotics than the enteric strains [40].
The ability of preferments to sustain the growth of Bifidobacterium spp. (Bifidobacterium breve DSM 20456, Bifidobacterium bifidum DSM 20213, Bifidobacterium longum DSM 20219 and Bifidobacterium adolescentis DSM 20083) was also evaluated through viable cell count. In particular, 50 mg of FM, benchmark or UF sample were dispersed in 10 mL of simulated intestinal fluid (SIF: 0.1% w/v pancreatin, 0.15% w/v Oxgall bile salt, pH 7) [41], and Bifidobacteria, previously grown in MRS, were inoculated at a final concentration of 106 CFU/mL. Bifidobacteria inoculated in SIF only served as control growth. Counts of viable Bifidobacteria on MRS agar plates were carried out at the inoculation time and after 3 h, 6 h and 24 h of incubation at 37 °C. Plates were then incubated at 37 °C in anaerobic jars containing GasPak EZ (Beckton, Dickinson and Co., Milan, Italy) for 24 h.

2.12. Antimicrobial Activity against Gastrointestinal Pathogens

The antibacterial activity of preferments was evaluated towards three gastrointestinal pathogens, namely Escherichia coli ECET, Salmonella choleraesuis serovar typhimurium and Yersinia enterocolitica, belonging to Department of Pharmacy and Biotechnology of University of Bologna. The preferments (FM, benchmark and UF) were incubated in SIF (5 mg/mL) for 24 h at 37 °C. Subsequently, the samples were centrifuged (5000× g for 20 min) in order to harvest the supernatants containing the digested and soluble parts of the preferments, which were used for microbial testing.
The pathogens were cultured in nutrient broth (Difco, Detroit, MI, United States) for 24 h. One hundred microliters (100 µL) of cell suspensions in growth medium (2 × 10⁵ CFU/mL) were then incubated inside 96-multi-well plates together with 100 µL of digested samples at 37 °C under anaerobic conditions. Wells inoculated with 100 μL of cell suspension in culture medium and 100 μL of SIF were used as growth control. Blanks, consisting of SIF and culture medium, were also included.
The growth was evaluated after 24 h of incubation by reading the absorbance at 600 nm (EnSpire Multimode Plate Reader, PerkinElmer Inc., Waltham, MA, USA), and the impact of preferments on microbial growth was expressed in percentage with respect to growth control (100%).

2.13. In Vitro Digestion, Cell Culture and Viability Assay

Tested samples were artificially digested to mimic the natural processes occurring in the human digestive system. Simulated salivary fluid (SSF), simulated gastric fluid (SGF) and simulated intestinal fluid (SIF) were prepared according to the publication of Minekus et al. [42]. Oral digestion was achieved by first mixing weighed amounts of the products with simulated salivary fluid, then adding calcium chloride and distilled water to produce a liquid sample. Gastric digestion was achieved by adding a set volume of gastric fluid to the liquid sample, followed by porcine pepsin and calcium chloride and then bringing the pH to 3 with hydrochloric acid. More distilled water was added, and the samples were placed in a shaking incubator at 37 °C for 2 h. Intestinal digestion was performed by adding simulated intestinal fluid, pancreatin, freshly made bile and calcium chloride. The pH was increased to pH 7 with sodium hydroxide. The samples were thoroughly mixed and incubated at 37 °C for 2 h in the shaking incubator. The samples were then heated to 60 °C for 20 min to inactivate the enzymes. The samples were centrifuged at 4000 rpm for 5 min. The pH was checked to ensure that it was pH 7. The supernatants were removed, filter-sterilized and stored at −20 °C in the freezer for further analysis.
The human epithelial cell line Caco-2 was purchased from European Collection of Cell Culture (ECACC, Salisbury, UK). Cells were maintained in Dulbecco’s modified Eagle’s medium (DMEM; Gibco™, Thermofisher, Waltham, MA, USA) supplemented with 10% fetal bovine serum, 1% non-essential amino acids solution, 100 U/mL penicillin, 100 µg/mL streptomycin and 1% GlutaMAX™ solution (Gibco™). Cells were incubated at 37 °C under 5% CO2 atmosphere. Medium was changed every 2 days, and cells passed at 60% confluence.
The influence of tested samples on Caco-2 viability was determined using PrestoBlue™ Cell Viability Reagent (Thermofisher, Waltham, MA, USA). Caco-2 cells were seeded at a density of 10,000 cells per well in 96-well plates in 100 μL of complete culture media. Cells were allowed to adhere overnight. After 24 h, the cell culture medium was carefully removed and replaced with culture medium supplemented with tested samples. Medium only was used to treat control cells. After 24 h of incubation, PrestoBlue™ Cell Viability Reagent was added to each well of the 96-well plate to the final concentration of 10%. Plates were incubated in the dark for 2 h at 37 °C. Fluorescence was read using a 560 nm excitation/590 nm emission filter set (10 nm bandwidth) with a Thermo Scientific™ Varioskan™ LUX spectrophotometer. Fluorescence data in wells containing cells were corrected for background fluorescence using cell-free media control replicates.

2.14. Statistical Analysis

The results are expressed as the mean of three different samples from three repeated experiments on different days. The data were statistically analyzed using the one-way ANOVA procedure of Statistica 6.1 (StatSoft Italy srl, Vigonza, Italy). The differences between mean values were detected by the HSD Tukey test, and evaluations were based on a significance level of p ≤ 0.05.

3. Results and Discussion

3.1. Fermentation Kinetics and Microbial Characteristics

In this work, a milling by-product mixture composed of rye bran (70%) and wheat germ (30%) was fermented (FM) by a microbial consortium composed of LAB (Latilactobacillus curvatus LS1) and yeasts (Kazachstania unispora FM2 and Kazachstania servazii KAZ2) in order to evaluate the effect of fermentation on the final nutritional, technological and functional characteristics in comparison to an unfermented mixture (UF) and a mixture fermented by commercial baker’s yeast (benchmark). The composition of the milling by-products mixture and the microbial consortium were based on preliminary tests, carried out in the framework of the European project “INGREEN”, in which it was observed that this specific microbial consortium was particularly suitable for fermenting rye bran in a short time and with optimal technological characteristics (fermentation kinetics, stability to backslopping, optimal LAB:yeast ratio, and sensorial features).
The fermentation of the rye bran and wheat germ mixture, with only Saccharomyces cerevisiae (benchmark) or with the selected microbial consortium (FM), was protracted for 24 h at 25 °C. Table 2 lists the pH and acidity at the end of fermentation, and the cell load of LAB and yeasts prior to and after fermentation.
The UF samples showed a pH of 6.43 and a titratable acidity of 6.10 meqNaOH. As expected, the fermentative process by the microbial consortium of yeasts and LAB led to a higher acidification of the preferment that reached a pH of 3.88 and titratable acidity of 21.2 meqNaOH after 24 h. Conversely, the fermentation by a bakery yeast resulted in a less acidic preferment. Lactic acid bacteria and yeasts were not detected in the UF sample. The benchmark sample had a starting yeast load of 6.89 log CFU/g; after 24 h of fermentation, yeasts reached 8.21 log CFU/g while LABs were present at the end of fermentation at a level of 2.11 log CFU/g. The FM samples showed an initial load of LABs and yeasts of 6.54 and 4.67 log CFU/g, respectively. At the end of fermentation, the detected loads of LABs and yeasts were 9.46 and 7.38 log CFU/g, respectively. Only the member strains in the microbial consortium used were detected in the FM preferment at the end of the fermentation process. Spontaneous fermentation was also carried out, and after 24 h of incubation, there was no significant acidification of the sample, while yeast and LAB were present at levels below 3.0 log CFU/g (data not shown).
It is evident that the ratio between yeast and LAB in FM samples at the end of fermentation was about 1:100, which is considered the required ratio for stable wheat sourdough [43,44,45]. The pH below 4.0 reached in FM samples strongly affected the protein solubilization, proteolysis process and protein interactions [43]. Acidification and proteolysis during sourdough fermentation typically result in an increase in amino acids, flavor precursors, and a change in dough rheology and texture [46].

3.2. Nutritional Profile and Fatty Acid Composition

The chemical composition of the preferments (FM and benchmark) and the unfermented milling by-product mixture is reported in Table 3.
No significant differences among samples were observed in terms of total and saturated fat content and total and insoluble fiber. However, the fermentation performed by the microbial consortium of LAB and yeasts led to a significant increase in soluble fiber compared to the UF samples but not compared to the benchmark. These data are in agreement with findings reported by Manini et al. [47] that showed a 30% increase in soluble fiber in wheat bran fermented by backslopping propagation with a stable microbiota of LAB and yeasts. A similar result was also obtained by fermenting wheat bran with a selected consortium containing Lactobacillus bulgaricus, Streptococcus thermophilus and a commercial baker’s yeast [48]. An increase in fiber solubility was also observed in spontaneously fermented wheat germ and in wheat germ fermented by selected microbial consortia containing LAB and yeasts combined or not with hydrolytic enzyme treatments [4,47]. The increase in soluble fiber is very interesting from a nutritional point of view. In fact, the health benefits associated with soluble fiber are several, including longer digestive processes, increased satiety, a positive influence on postprandial glycemic response and reduction of total and LDL cholesterol [49].
Additionally, a significant reduction in starch was observed in FM and benchmark samples, which showed a starch content of 9.1 and 9.3 g/100 g DM, respectively, compared to the UF sample (10.5 g/100 g DM). As expected, the fermentation by the microbial consortium or by commercial bakery yeast reduced the sugar content to 0.3 g/100 g, compared to the native bran mixture that showed 2.8 g/100 g. These data are in agreement with findings reported by other authors that showed a reduction in starch content and sugars, such as raffinose and sucrose, after fermentation of wheat bran and germ, due to microbial metabolism [15,47].
As expected, the preferment obtained by the fermentation of the selected consortia of LAB and yeasts showed a significant increase in lactic acid and acetic acid, to 1.011 and 0.104 g/100 g, respectively, compared to the benchmark and UF. The fermentation quotient (FQ) of the FM samples was 6.5. On the other hand, the presence of Latilactobacillus curvatus in FM samples determined a fast acidification of the matrix due to the rapid conversion of fermentable carbohydrates into mainly lactic acid, but also other organic acids such as acetic acid, formic acid, and ethanol.
Although the amount of fat present was not significantly different as a result of the fermentation process, the fatty acid (FA) profiles of the different samples were determined and are reported in Table 4.
Palmitic and linoleic acids were found to be the main fatty acids detected in all the samples, followed by oleic, linolenic and stearic acid. When compared to the benchmark and UF sample, the relative percentages of oleic and palmitoleic acid increased in FM, while the relative percentage of palmitic acid decreased. Therefore, fermentation by the selected microbial consortium (FM) led to an increase in the unsaturation level (UL) of the fatty acids compared to the benchmark and the UF. Other authors reported an increase in lipid content and a modification of fatty acid profiles in wheat and maize bran subjected to a sourdough-like fermentation [47,50]. The presence of unsaturated FA such as linoleic, linolenic and oleic acid in the pre-fermented ingredients, associated with a reduced content of total FA, has great industrial importance since it is associated with a nutritional, functional and health promoting effect [14]. In addition, the interest in the presence of unsaturated FA is not only related to nutritional aspects, but also to the fact that they are precursors of aromatic and antimicrobial compounds (i.e., furanones) [51].

3.3. Color Analysis

Figure 1 presents the appearance of the UF, FM and benchmark samples, while Table 5 lists the indexes of lightness (L*), redness (a*) and yellowness (b*).
As can be seen from Figure 1 and Table 5, the preferments were characterized by a very different appearance, and consequently of colorimetric indices. The fermentation by the selected microbial consortia of LAB and yeasts led to a significant increase in the L* index compared to the UF sample. In contrast, the benchmark showed rapid browning, as demonstrated by the significant reduction in the L* value compared to the other samples. In addition, a significant increase in the a* index and decrease in the b* index were observed in the FM and benchmark samples compared to the UF sample. On the other hand, fermentation by commercial bakery yeast does not slow down the activity of browning related enzymes, while the lower pH achieved with the selected consortium is responsible for the reduction of enzymatic activity [2]. The color of a preferment, developed for applications in the bakery sector, represents an important parameter both for its acceptability and the impact on the final product. For these reasons, it is very important to prevent browning processes. Fermentation by selected microbial consortia, composed of LAB and yeasts, is from this point of view optimal, as it can increase the presence of antioxidant substances, such as ferulic acid, that can prevent color changes [2,11].

3.4. Volatile Molecule Profiles

Specific profiles in terms of volatile molecules were detected based on the preferments considered (Table 6). A total of 26, 50 and 45 volatile molecules were identified in the aromatic profiles of the UF, FM and benchmark samples, respectively. The fermentation process led to a qualitative and quantitative increase in the aromatic molecules present in the samples, in particular acids, alcohols, and esters. However, the type of microbial consortium used strongly influenced the aromatic profile. In fact, the use of only Saccharomyces cerevisiae (benchmark) led to a particularly higher amount of alcohols (ethanol 40.3 ppm) and esters (ethyl acetate 18.9 ppm). The fermentation by the selected microbial consortium of LAB and yeasts also led to an increase in alcohols and esters, but to a lesser extent than the benchmark. On the contrary, the FM samples showed an increase in acids, such as acetic acid, and short-chain fatty acids. In general, the fermentation process led to an improvement in the aromatic profile of the preferments due to the positive odor perception of the identified molecules. The greater acidic note of the FM preferment was linked to the presence of Latilactobacillus curvatus in the consortium used and was related to the measured lower pH and higher TTA. Other authors reported a higher increase in acetic acid and hexanoic acid in rye bran fermented only by Latilactobacillus curvatus [52]. Fermentation by a bakery yeast resulted in a higher amount of volatile molecules, but the volatile profiles obtained with a consortium of yeasts and LAB showed a wider spectrum of compounds. The synthesis of volatile molecules in yeasts mainly involves the conversion of pyruvate to diacetyl, the formation of esters and the Ehrlich pathway with the conversion of amino acids to volatile compounds; however, the formation of aromatic compounds by the Ehrlich pathway can be enhanced by sourdough fermentation due to the release of the precursor amino acids for the higher proteolysis level [53,54]. On the other hand, it is widely reported that the spectrum and amounts of volatile compounds are higher in sourdoughs fermented with yeasts and lactobacilli compared to baker’s yeast, proving that different microbiota affect the final food volatile profile [53,55]. Additionally, in LAB, the synthesis of volatile molecule compounds is strictly dependent on the species, but in sourdough fermentation, it is well demonstrated that heterofermentative and homofermentative LAB, including Latilactobacillus curvatus, contribute to a higher and wider spectrum of volatile molecules with respect to the use of baker’s yeast [20].

3.5. Functionality

Several functional parameters including bioactive peptides, total SCFA, total phenols, antioxidant activity (DPPH and ABTS) and phytic acid content of the mixture of rye bran and wheat germ fermented by a yeast/LAB consortium or bakery yeast were assessed and compared with the unfermented mixture (Table 7). As shown in Table 7, The fermentation of the milling by-product mixture by the LAB/yeast consortium led to a significant increase in the SCFA content compared to both the unfermented mixture and those fermented with a benchmark baker’s yeast. In fact, the SCFAs detected were 12.64 mg/kg, 2.21 mg/kg and 0.23 mg/kg, respectively, in FM, benchmark and UF sample. The greater content of SCFAs in FM can be attributed to the presence of Latilactibacillus curvatus. In fact, the production of SCFAs in fermented bran and sourdough is related to the metabolic activity of LAB [56]. Lactobacilli can produce SCFAs by the fermentation of carbohydrate end-products such as pyruvate, which is generated during the glycolytic pathway and also by the phosphoketolase route in heterofermenting conditions [57,58]. The detected SCFAs in the FM sample were acetic acid, propanoic acid, butanoic acid, pentanoic acid, hexanoic acid and octanoic acid. However, the dominant SCFAs were acetic acid and hexanoic acid. The beneficial properties of SCFAs are widely reported; they are easily absorbed by the host and have beneficial effects on intestinal function as well as systemic roles in insulin secretion, lipid metabolism, and inflammation, among others [59]. In addition, the contribution of SCFAs to the flavor of bread crumb is also reported [60].
The peptide content was found to be dependent on the sample considered. In any case, the fermentation by the yeasts and LAB consortium led to a significant increase in bioactive peptides (5.41 mg/g) compared to the concentration found in the samples fermented with a baker’s yeast (3.88 mg/g) and the unfermented milling by-product mixture (3.55 mg/g). The functional importance of bioactive peptides is widely demonstrated, and activities such as mineral binding, immunomodulatory, antimicrobial, antioxidative, antithrombotic, hypocholesterolemic and antihypertensive, are attributed to them [35]. The increase in bioactive peptides observed in the FM samples can be attributed to the activities of the LABs present in the microbial consortia used. In fact, the release of various bioactive peptides (e.g., angiotensin I-converting enzyme (ACE)-inhibitory peptides) from proteins through proteolysis by LABs in various food systems is well documented [43,61,62].
The preferment FM showed a significant increase in total phenol content compared to the UF and benchmark. The increase in total phenols with respect to the UF and benchmark was found to be 70% and 50%, respectively. On the other hand, it is widely reported that sourdough fermentation increases the levels of extractable phenolic compounds [63]. These increases are mainly dependent on the breakdown of the cell wall of cereal and brans, followed by enzymatic activities that result in the release of bounded phenolic compounds [64]. This is particularly important in cereal bran, which is very rich in phenolic compounds that generally are present in esterified form linked to the cell wall matrix and consequently not easily available [64,65]. Fermentation can be considered an optimal approach to release the insoluble bounded phenolic acids. In particular, it is well documented that fermentation with LABs or consortia of yeasts and LABs, combined or not with enzymatic treatments, has a positive effect on the bioavailability of polyphenols in fermented wheat bran, wheat germ, rice bran and rye bran [2,18,64].
The increase in phenolic compounds in FM samples resulted in higher antioxidant activity, detected with ABTS and DPPH assay, compared to the UF and benchmark samples. Fermentation of the rye bran and wheat germ mixture by a benchmark baker’s yeast did not lead to a significant increase in antioxidant activity compared to the unfermented mixture. On the contrary, the fermentation by the consortium showed an increase in antioxidant activity ranging between 17 and 24%, depending on the method used, compared to the unfermented milling by-product mixture. These data are in agreement with Rizzello et al. [14], who reported an increase in antioxidant activity due to phenolics and bioactive peptides in wheat germ fermented by Lb. plantarum and Lb. rossiae. An increased content of free and soluble antioxidant compounds after fermentation of wheat bran with a Lb. rhamnosus strain was also observed by Spaggiari et al. [66].
On the other hand, during sourdough fermentation, LABs increased the amount of extractable phenolic compounds and antioxidant peptides [44]. Several lactobacilli can reinforce their inherent cellular antioxidant defense through the secretion of antioxidant enzymes such as superoxide dismutase. In addition, LABs promote the synthesis of glutathione, the main non-enzymatic antioxidant and free-radical scavenger, and exopolysaccharides that are other biomolecules synthesized by LABs and also share antioxidant activity [67].
The FM samples also showed a significantly lower content of phytic acid compared to the UF and benchmark samples. In fact, the FM samples showed a reduction in phytate concentration of about 28% and 20% compared to the UF and benchmark, respectively. Other than bioactive compounds, cereal bran usually contains anti-nutritional molecules such as phytic acid that reduces the bioavailability of important minerals such as Ca2+, Mg2+, Fe2+, and Zn2+ and amino acids. Therefore, the degradation of these compounds is fundamental in order to improve the functional and nutritional characteristics of cereal bran [66]. The results obtained in this work are in agreement with data in the literature that showed a decrease in phytic acid content in wheat bran and wheat germ fermented by LABs [14,48,66]. The hydrolysis of phytic acid is generally carried out by microbial and endogenous phytase that hydrolyzes phytic acid to a non-metal chelator compound [14]. Lactic acid bacteria are a source of phytase, and the pH reached during fermentation by LABs is more suitable to activate flour endogenous phytases [5].

3.6. Prebiotic Activity

The prebiotic activity of the samples was assessed in both aerobic and anaerobic fer-mentation models. The prebiotic index (PI) scores determined are reported in Table 8. Both the FM and UF samples showed a positive value of PI, which means all probiotic bacteria grew more than enteric strains (E. coli). The scores of Lactobacillae strains were noted to be higher than that of Bifidobacteria. Prebiotic indices obtained for Limosilactobacillus fermentum ATCC 9338 grown in UF, FM and FOS were significantly higher than values determined for the other six strains considered. The strains Lactobacillus acidophilus ATCC 4356, Limosilactobacillus fermentum ATCC 9338 and Bifidobacterium angulatum DSM 20098 demonstrated a significantly higher prebiotic index (PI) score for the fermented mixture (FM) in comparison with the unfermented one (UF). Data in the literature indicate that fermented cereal brans may exert prebiotic activity due to production of exopolysaccharides by LABs and in response to the presence of oligosaccharides resulting from hydrolysis of arabinoxylans present in brans [68].
The ability of pre-fermented ingredients (FM and benchmark), as well as UF one, to support the growth of Bifidobacterium spp. highly present in the gut microbiota (B. breve, B. bifidum, B. longum and B. adolescentis) was also confirmed through viable counts in simulated intestinal fluid (Figure 2). The viability of bifidobacteria incubated in SIF without preferments or UF strongly decreased over time and was completely abolished after 6 h (B. bifidum DSM 2013 and B. longum DMS 20219) or 24 h (B. breve DSM 20456 and B. adolescentis DSM 20083). On the contrary, bifidobacteria were able to grow in the presence of the unfermented and fermented mixtures, reaching at least 7.5 log CFU/mL after 24 h of incubation. In particular, after 3 h of incubation, the viable count of Bifidobacterium spp. was always lower in the presence of benchmark, while the viability in the presence of FM was equal (B. breve DMS 20456) or slightly lower than that observed in the presence of the UF mixture. On the contrary, after 6 h and 24 h of incubation, the highest growth was observed in the presence of the FM mixture for all bifidobacteria tested, reaching 8.31–8.96 log CFU/mL. These results underlined that bifidobacteria were able not only to survive, but also to grow in the presence of FM as substrate, confirming the prebiotic activity previously observed.

3.7. Antimicrobial Activity against Gastrointestinal Pathogens

The impact of preferments and UF on relevant gastrointestinal pathogens (E. coli ECET, S. choleraesuis and Y. enterocolitica) was also sought in order to exclude undesired stimulating effects. Results are reported in Figure 3, as growth percentages compared to the growth of pathogens in the absence of mixtures (control). The UF mixture significantly stimulated the growth of S. choleraesuis and Y. enterocolitica, by ~10–18%. Y. enterocolitica was also slightly stimulated by the benchmark (by ~9%, p < 0.05). Noticeably, the FM mixture strongly reduced the growth of gastrointestinal pathogens, with inhibition percentages against E. coli ECET, S. choleraesuis and Y. enterocolitica of 60.5, 48.8 and 43.9%, respectively. This behavior can be due to the lower pH and the presence of metabolites in the FM mixture that can exert antibacterial activities, such as bioactive peptides, SCFA and phenols [69,70,71].

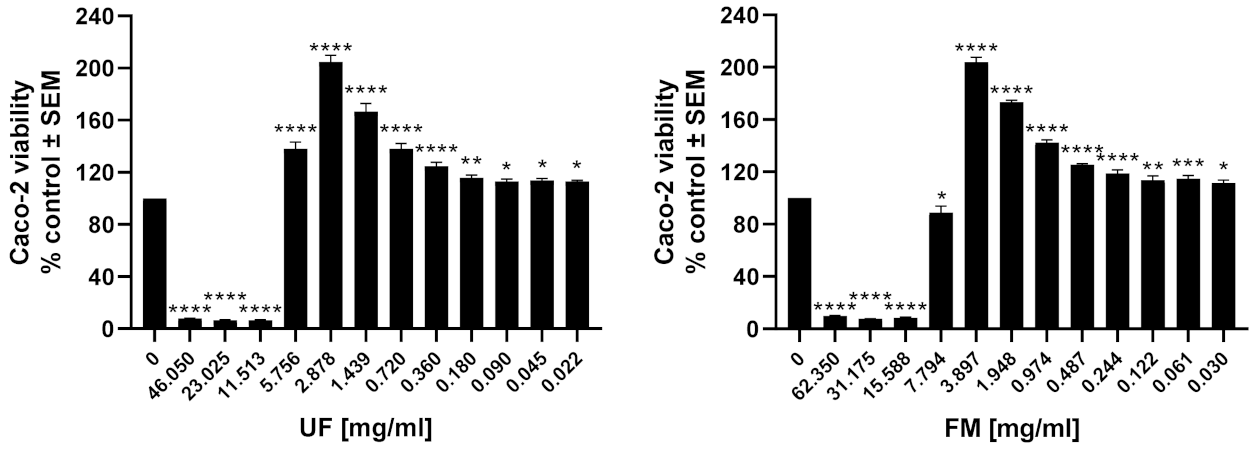
3.8. Caco-2 Viability Assay

Caco-2 cells were treated with tested samples for 24 h, and the viability of the cells was measured using a fluorescent dye, PrestoBlue™. The results of the performed cytotoxicity experiment are displayed in Figure 4.
The results show that three of the highest concentrations of the unfermented milling by-product and the four highest concentrations of sample after fermentation significantly reduced Caco-2 proliferation. All other concentrations of tested samples showed no cytotoxic effect against the analyzed cell model. Moreover, a significant increase in cell proliferation was observed for these doses of tested samples. The best results were obtained for 2.88 mg/mL UF and 3.90 mg/mL FM–Caco-2 viability was 204.77% and 203.93%, respectively. The Caco-2 cellular model is commonly used to investigate potential toxic effects of food or food metabolites in the intestinal mucosa [72]. The effect of pre-fermented cereals on growth of the Caco-2 cell line was assessed by Bruininx et al. [73]. The results of a tetrazolium-based colorimetric assay indicated that after 19 days of cell incubation with 1%, 5% and 10% of fermented cereal supernatant, the cytotoxic effect of tested samples was not observed. In the study by Galli et al. [74], 23 LAB strains were selected and used for wheat flour inoculation. The obtained sourdough extracts did not negatively affect the viability of human intestinal cells, Caco-2. Yang et al. [75] analyzed the cytotoxicity of Lactobacillus rhamnosus and Bifidobacterium animalis ssp. Lactis-fermented seaweed extract using an MTT assay in the Caco-2 cell line. No significant decrease in cell viability was observed. Moreover, one of the tested fermented extracts significantly increased Caco-2 viability when used at a concentration of 400 μg/mL.

4. Conclusions

The data obtained showed the excellent potential of the microbial consortium containing Lb. curvatus, K. servazzii and K. unispora to improve the functional and technological properties of fermented wheat germ and rye bran. First, they showed rapid fermentation kinetics on the by-products used, reaching optimal pH of 3.9 and acidity values of 21.1 meqNaOH within 24 h, with all of the consequences that this aspect has from an industrial point of view. Second, this consortium improved the complexity of the volatile molecules obtained after fermentation, mainly acetic acid and hexanoic acid. Moreover, fermentation by the selected yeasts and LAB determined an increase in SCFA (by more than 5-fold), antioxidant activity (22–24%), total phenol content (53–71%), bioactive peptides (39–52%), a reduction in phytic acid content of 20–28%, and an increase in prebiotic activity not only compared to the unfermented product but also compared to the preferment obtained with a baker’s yeast. FM samples also showed a strong inhibition against gastrointestinal pathogens, ranging between 44 and 61% depending on the pathogen, and at a certain concentration, a stimulation of Caco-2 cell viability by more than 200%. This outcome confirms that a sourdough-like fermentation with a selected consortium of LAB and yeasts can provide superior technological and functional features to the final product. The characteristics of the obtained pre-fermented ingredient indicate that it is potentially suitable for application in the bakery sector, even if other sectors of application, such as the nutraceutical one, can be explored. However, further studies are required to define the optimal ratio to be used and the effects that this ingredient may provide in the final product.

Author Contributions

Conceptualization, R.L., F.P., L.V. and B.V.; methodology, L.S., B.V., D.G. and H.M.; software, L.S. and D.G.; validation, S.R., B.G. and A.A., formal analysis, S.R., A.A., B.G. and A.M.; investigation, S.R., A.A., A.M., D.G., L.S. and B.G.; resources, L.S., D.G., F.P. and R.L.; data curation, S.R., B.G., A.A. and A.M.; writing—original draft preparation, L.S., B.G., D.G., S.R. and H.M.; writing—review and editing, R.L., F.P., A.A., B.V., H.M. and L.V.; visualization, D.G., L.S., L.V., R.L. and B.V.; supervision, R.L., F.P., B.V. and L.V. All authors have read and agreed to the published version of the manuscript.

Funding

This research was performed in the context of the INGREEN project "Bio-based ingredients for sustainable industries through biotechnology". This project has received funding from the Bio Based Industries Joint Undertaking (JU) under grant agreement No 838120. The JU receives support from the European Union’s Horizon 2020 research and innovation program and the Bio Based Industries Consortium.

Institutional Review Board Statement

Not applicable.

Data Availability Statement

Not applicable.

Acknowledgments

The authors would like to thank Narinder Bains (INEUVO Ltd.), the coordinator of the project “INGREEN Bio-based ingredients for sustainable industries through biotechnology”, and also Nadia Morbarigazzi from Barilla G. e R. F.lli S.p.A and Simona Baraldi from Molini Pivetti S.p.A. for providing us with wheat germ and rye bran.

Conflicts of Interest

The authors declare no conflict of interest.

References

  1. FAO. Cereal Supply and Demand Brief. World Food Situation. Food and Agriculture Organization of the United Nations. Available online: https://www.fao.org/worldfoodsituation/csdb/en/ (accessed on 14 November 2022).
  2. Verni, M.; Rizzello, C.G.; Coda, R. Fermentation Biotechnology Applied to Cereal Industry By-Products: Nutritional and Functional Insights. Front. Nutr. 2019, 6, 42. [Google Scholar] [CrossRef] [PubMed] [Green Version]
  3. Zamaratskaia, G.; Gerhardt, K.; Wendin, K. Biochemical Characteristics and Potential Applications of Ancient Cereals—An Underexploited Opportunity for Sustainable Production and Consumption. Trends. Food Sci. Technol. 2021, 107, 114–123. [Google Scholar] [CrossRef]
  4. Coda, R.; Kärki, I.; Nordlund, E.; Heiniö, R.L.; Poutanen, K.; Katina, K. Influence of Particle Size on Bioprocess Induced Changes on Technological Functionality of Wheat Bran. Food Microbiol. 2014, 37, 69–77. [Google Scholar] [CrossRef] [PubMed]
  5. Gobbetti, M.; de Angelis, M.; di Cagno, R.; Polo, A.; Rizzello, C.G. The Sourdough Fermentation Is the Powerful Process to Exploit the Potential of Legumes, Pseudo-Cereals and Milling by-Products in Baking Industry. Crit. Rev. Food Sci. Nutr. 2019, 60, 2158–2173. [Google Scholar] [CrossRef] [PubMed]
  6. Onipe, O.O.; Jideani, A.I.O.; Beswa, D. Composition and Functionality of Wheat Bran and Its Application in Some Cereal Food Products. Int. J. Food Sci. Technol. 2015, 50, 2509–2518. [Google Scholar] [CrossRef]
  7. Prückler, M.; Siebenhandl-Ehn, S.; Apprich, S.; Höltinger, S.; Haas, C.; Schmid, E.; Kneifel, W. Wheat Bran-Based Biorefinery 1: Composition of Wheat Bran and Strategies of Functionalization. LWT.-Food Sci. Technol. 2014, 56, 211–221. [Google Scholar] [CrossRef]
  8. Coda, R.; Katina, K.; Rizzello, C.G. Bran Bioprocessing for Enhanced Functional Properties. Curr. Opin. Food Sci. 2015, 1, 50–55. [Google Scholar] [CrossRef]
  9. Luithui, Y.; Baghya Nisha, R.; Meera, M.S. Cereal By-Products as an Important Functional Ingredient: Effect of Processing. J. Food Sci. Technol. 2019, 56, 1–11. [Google Scholar] [CrossRef]
  10. Galanakis, C.M. Sustainable Applications for the Valorization of Cereal Processing By-Products. Foods 2022, 11, 241. [Google Scholar] [CrossRef]
  11. Zhang, J.; Liu, M.; Zhao, Y.; Zhu, Y.; Bai, J.; Fan, S.; Zhu, L.; Song, C.; Xiao, X. Recent Developments in Fermented Cereals on Nutritional Constituents and Potential Health Benefits. Foods 2022, 11, 2243. [Google Scholar] [CrossRef]
  12. Dziki, D. Rye Flour and Rye Bran: New Perspectives for Use. Processes 2022, 10, 293. [Google Scholar] [CrossRef]
  13. Boukid, F.; Folloni, S.; Ranieri, R.; Vittadini, E. A Compendium of Wheat Germ: Separation, Stabilization and Food Applications. Trends. Food Sci. Technol. 2018, 78, 120–133. [Google Scholar] [CrossRef]
  14. Rizzello, C.G.; Nionelli, L.; Coda, R.; de Angelis, M.; Gobbetti, M. Effect of Sourdough Fermentation on Stabilisation, and Chemical and Nutritional Characteristics of Wheat Germ. Food Chem. 2010, 119, 1079–1089. [Google Scholar] [CrossRef]
  15. Rizzello, C.G.; Nionelli, L.; Coda, R.; di Cagno, R.; Gobbetti, M. Use of Sourdough Fermented Wheat Germ for Enhancing the Nutritional, Texture and Sensory Characteristics of the White Bread. Eur. Food Res. Technol. 2010, 230, 645–654. [Google Scholar] [CrossRef]
  16. Onipe, O.O.; Ramashia, S.E.; Jideani, A.I.O. Wheat Bran Modifications for Enhanced Nutrition and Functionality in Selected Food Products. Molecules 2021, 26, 3918. [Google Scholar] [CrossRef] [PubMed]
  17. Bertsch, A.; Roy, D.; LaPointe, G. Fermentation of Wheat Bran and Whey Permeate by Mono-Cultures of Lacticaseibacillus Rhamnosus Strains and Co-Culture With Yeast Enhances Bioactive Properties. Front. Bioeng. Biotechnol. 2020, 8, 956. [Google Scholar] [CrossRef]
  18. Filannino, P.; di Cagno, R.; Gobbetti, M. Metabolic and Functional Paths of Lactic Acid Bacteria in Plant Foods: Get out of the Labyrinth. Curr. Opin. Biotechnol. 2018, 49, 64–72. [Google Scholar] [CrossRef]
  19. Arte, E.; Rizzello, C.G.; Verni, M.; Nordlund, E.; Katina, K.; Coda, R. Impact of Enzymatic and Microbial Bioprocessing on Protein Modification and Nutritional Properties of Wheat Bran. J. Agric. Food Chem. 2015, 63, 8685–8693. [Google Scholar] [CrossRef]
  20. Arora, K.; Ameur, H.; Polo, A.; di Cagno, R.; Rizzello, C.G.; Gobbetti, M. Thirty Years of Knowledge on Sourdough Fermentation: A Systematic Review. Trends. Food Sci. Technol. 2021, 108, 71–83. [Google Scholar] [CrossRef]
  21. Rizzello, C.G.; Portincasa, P.; Montemurro, M.; di Palo, D.M.; Lorusso, M.P.; de Angelis, M.; Bonfrate, L.; Genot, B.; Gobbetti, M. Sourdough Fermented Breads Are More Digestible than Those Started with Baker’s Yeast Alone: An In Vivo Challenge Dissecting Distinct Gastrointestinal Responses. Nutrients 2019, 11, 2954. [Google Scholar] [CrossRef]
  22. Khalid, K.H.; Ohm, J.B.; Simsek, S. Whole Wheat Bread: Effect of Bran Fractions on Dough and End-Product Quality. J. Cereal. Sci. 2017, 78, 48–56. [Google Scholar] [CrossRef]
  23. Official Methods of Analysis of AOAC International. WorldCat.Org. Available online: https://www.worldcat.org/it/title/official-methods-of-analysis-of-aoac-international/oclc/1085712083 (accessed on 11 November 2022).
  24. AACC. Approved Methods of the AACC, 10th ed.; American Association of Cereal Chemists: St. Paul, MN, USA, 2000; Available online: http://www.sciepub.com/reference/241265 (accessed on 11 November 2022).
  25. Buddrick, O.; Jones, O.A.H.; Cornell, H.J.; Small, D.M. The Influence of Fermentation Processes and Cereal Grains in Wholegrain Bread on Reducing Phytate Content. J. Cereal. Sci. 2014, 59, 3–8. [Google Scholar] [CrossRef]
  26. da Rocha Lemos Mendes, G.; Souto Rodrigues, P.; de las Mercedes Salas-Mellado, M.; Fernandes de Medeiros Burkert, J.; Badiale-Furlong, E. Defatted Rice Bran as a Potential Raw Material to Improve the Nutritional and Functional Quality of Cakes. Plant. Foods Hum. Nutr. 2021, 76, 46–52. [Google Scholar] [CrossRef] [PubMed]
  27. Aoac 920.39 2003_05 Extracto Etereo Dietileter-VSIP. INFO. Available online: https://vsip.info/aoac-92039-200305-extracto-etereo-dietileter-2-pdf-free.html (accessed on 11 November 2022).
  28. Oliveira, M.D.S.; Feddern, V.; Kupski, L.; Cipolatti, E.P.; Badiale-Furlong, E.; de Souza-Soares, L.A. Changes in Lipid, Fatty Acids and Phospholipids Composition of Whole Rice Bran after Solid-State Fungal Fermentation. Bioresour. Technol. 2011, 102, 8335–8338. [Google Scholar] [CrossRef] [PubMed] [Green Version]
  29. Costantini, L.; Lukšič, L.; Molinari, R.; Kreft, I.; Bonafaccia, G.; Manzi, L.; Merendino, N. Development of Gluten-Free Bread Using Tartary Buckwheat and Chia Flour Rich in Flavonoids and Omega-3 Fatty Acids as Ingredients. Food Chem. 2014, 165, 232–240. [Google Scholar] [CrossRef]
  30. Luchese, C.L.; Gurak, P.D.; Marczak, L.D.F. Osmotic Dehydration of Physalis (Physalis peruviana L.): Evaluation of Water Loss and Sucrose Incorporation and the Quantification of Carotenoids. LWT.-Food Sci. Technol. 2015, 63, 1128–1136. [Google Scholar] [CrossRef]
  31. Pointer, M.R. A Comparison of the CIE 1976 Colour Spaces. Color. Res. Appl. 1981, 6, 108–118. [Google Scholar] [CrossRef]
  32. Burns, P.; Patrignani, F.; Serrazanetti, D.; Vinderola, G.C.; Reinheimer, J.A.; Lanciotti, R.; Guerzoni, M.E. Probiotic Crescenza Cheese Containing Lactobacillus Casei and Lactobacillus Acidophilus Manufactured with High-Pressure Homogenized Milk. J. Dairy Sci. 2008, 91, 500–512. [Google Scholar] [CrossRef] [Green Version]
  33. Rossi, S.; Parrotta, L.; del Duca, S.; Rosa, M.D.; Patrignani, F.; Schluter, O.; Lanciotti, R. Effect of Yarrowia Lipolytica RO25 Cricket-Based Hydrolysates on Sourdough Quality Parameters. LWT 2021, 148, 111760. [Google Scholar] [CrossRef]
  34. Boselli, E.; Velazco, V.; Fiorenza Caboni, M.; Lercker, G. Pressurized Liquid Extraction of Lipids for the Determination of Oxysterols in Egg-Containing Food. J. Chromatogr. A. 2001, 917, 239–244. [Google Scholar] [CrossRef]
  35. Coda, R.; Rizzello, C.G.; Pinto, D.; Gobbetti, M. Selected Lactic Acid Bacteria Synthesize Antioxidant Peptides during Sourdough Fermentation of Cereal Flours. Appl. Environ. Microbiol. 2012, 78, 1087–1096. [Google Scholar] [CrossRef] [PubMed] [Green Version]
  36. AOAC 986.11-1988, Phytate in Foods Anion Exchange Method-$14.15: AOAC Official Method. Available online: http://www.aoacofficialmethod.org/index.php?main_page=product_info&cPath=1&products_id=313 (accessed on 11 November 2022).
  37. Rizzello, C.G.; Coda, R.; Mazzacane, F.; Minervini, D.; Gobbetti, M. Micronized By-Products from Debranned Durum Wheat and Sourdough Fermentation Enhanced the Nutritional, Textural and Sensory Features of Bread. Food Res. Int. 2012, 46, 304–313. [Google Scholar] [CrossRef]
  38. Miller, N.J.; Rice-Evans, C.A. Factors Influencing the Antioxidant Activity Determined by the ABTS Radical Cation Assay. Free. Radic. Res. 1997, 26, 195–199. [Google Scholar] [CrossRef] [PubMed]
  39. Slinkard, K.; Singleton, V.L. Total Phenol Analysis: Automation and Comparison with Manual Methods. Am. J. Enol. Vitic. 1977, 28, 49–55. [Google Scholar]
  40. Huebner, J.; Wehling, R.L.; Hutkins, R.W. Functional Activity of Commercial Prebiotics. Int. Dairy. J. 2007, 17, 770–775. [Google Scholar] [CrossRef]
  41. Giordani, B.; Melgoza, L.M.; Parolin, C.; Foschi, C.; Marangoni, A.; Abruzzo, A.; Dalena, F.; Cerchiara, T.; Bigucci, F.; Luppi, B.; et al. Vaginal Bifidobacterium Breve for Preventing Urogenital Infections: Development of Delayed Release Mucoadhesive Oral Tablets. Int. J. Pharm. 2018, 550, 455–462. [Google Scholar] [CrossRef]
  42. Minekus, M.; Alminger, M.; Alvito, P.; Ballance, S.; Bohn, T.; Bourlieu, C.; Carrière, F.; Boutrou, R.; Corredig, M.; Dupont, D.; et al. A Standardised Static in Vitro Digestion Method Suitable for Food—An International Consensus. Food Funct. 2014, 5, 1113–1124. [Google Scholar] [CrossRef] [Green Version]
  43. Scarnato, L.; Serrazanetti, D.I.; Aloisi, I.; Montanari, ·C.; del Duca, S.; Lanciotti, R. Combination of Transglutaminase and Sourdough on Gluten-Free Flours to Improve Dough Structure. Amino. Acids. 2016, 48, 2453–2465. [Google Scholar] [CrossRef]
  44. Gobbetti, M.; Rizzello, C.G.; di Cagno, R.; de Angelis, M. How the Sourdough May Affect the Functional Features of Leavened Baked Goods. Food Microbiol. 2014, 37, 30–40. [Google Scholar] [CrossRef]
  45. de Luca, L.; Aiello, A.; Pizzolongo, F.; Blaiotta, G.; Aponte, M.; Romano, R. Volatile Organic Compounds in Breads Prepared with Different Sourdoughs. Applied. Sci. 2021, 11, 1330. [Google Scholar] [CrossRef]
  46. Scarnato, L.; Montanari, C.; Serrazanetti, D.I.; Aloisi, I.; Balestra, F.; del Duca, S.; Lanciotti, R. New Bread Formulation with Improved Rheological Properties and Longer Shelf-Life by the Combined Use of Transglutaminase and Sourdough. LWT 2017, 81, 101–110. [Google Scholar] [CrossRef]
  47. Manini, F.; Brasca, M.; Plumed-Ferrer, C.; Morandi, S.; Erba, D.; Casiraghi, M.C. Study of the Chemical Changes and Evolution of Microbiota During Sourdoughlike Fermentation of Wheat Bran; Study of the Chemical Changes and Evolution of Microbiota During Sourdoughlike Fermentation of Wheat Bran. Cereal Chem. 2014, 91, 342–349. [Google Scholar] [CrossRef]
  48. Zhao, H.M.; Guo, X.N.; Zhu, K.X. Impact of Solid State Fermentation on Nutritional, Physical and Flavor Properties of Wheat Bran. Food Chem. 2017, 217, 28–36. [Google Scholar] [CrossRef] [PubMed]
  49. Lattimer, J.M.; Haub, M.D. Effects of Dietary Fiber and Its Components on Metabolic Health. Nutrients 2010, 2, 1266–1289. [Google Scholar] [CrossRef] [Green Version]
  50. Decimo, M.; Quattrini, M.; Ricci, G.; Fortina, M.G.; Brasca, M.; Silvetti, T.; Manini, F.; Erba, D.; Criscuoli, F.; Casiraghi, M.C. Evaluation of Microbial Consortia and Chemical Changes in Spontaneous Maize Bran Fermentation. AMB Express. 2017, 7, 205. [Google Scholar] [CrossRef]
  51. Ndagijimana, M.; Vallicelli, M.; Cocconcelli, P.S.; Cappa, F.; Patrignani, F.; Lanciotti, R.; Guerzoni, M.E. Two 2[5H]-Furanones as Possible Signaling Molecules in Lactobacillus Helveticus. Appl. Environ. Microbiol. 2006, 72, 6053–6061. [Google Scholar] [CrossRef] [Green Version]
  52. Kaseleht, K.; Paalme, T.; Mihhalevski, A.; Sarand, I. Analysis of Volatile Compounds Produced by Different Species of Lactobacilli in Rye Sourdough Using Multiple Headspace Extraction. Int. J. Food Sci. Technol. 2011, 46, 1940–1946. [Google Scholar] [CrossRef]
  53. Xu, D.; Zhang, Y.; Tang, K.; Hu, Y.; Xu, X.; Gänzle, M.G. Effect of Mixed Cultures of Yeast and Lactobacilli on the Quality of Wheat Sourdough Bread. Front. Microbiol. 2019, 10, 2113. [Google Scholar] [CrossRef] [Green Version]
  54. Thiele, C.; Gänzle, M.G.; Vogel, R.F. Fluorescence Labeling of Wheat Proteins for Determination of Gluten Hydrolysis and Depolymerization during Dough Processing and Sourdough Fermentation. J. Agric. Food Chem. 2003, 51, 2745–2752. [Google Scholar] [CrossRef]
  55. Gänzle, M.G.; Zheng, J. Lifestyles of Sourdough Lactobacilli—Do They Matter for Microbial Ecology and Bread Quality? Int. J. Food Microbiol. 2019, 302, 15–23. [Google Scholar] [CrossRef]
  56. Pérez-Alvarado, O.; Zepeda-Hernández, A.; Garcia-Amezquita, L.E.; Requena, T.; Vinderola, G.; García-Cayuela, T. Role of Lactic Acid Bacteria and Yeasts in Sourdough Fermentation during Breadmaking: Evaluation of Postbiotic-like Components and Health Benefits. Front. Microbiol. 2022, 13, 969460. [Google Scholar] [CrossRef] [PubMed]
  57. LeBlanc, J.G.; Chain, F.; Martín, R.; Bermúdez-Humarán, L.G.; Courau, S.; Langella, P. Beneficial Effects on Host Energy Metabolism of Short-Chain Fatty Acids and Vitamins Produced by Commensal and Probiotic Bacteria. Microb. Cell Fact. 2017, 16, 79. [Google Scholar] [CrossRef] [PubMed] [Green Version]
  58. Annunziata, G.; Arnone, A.; Ciampaglia, R.; Tenore, G.C.; Novellino, E. Fermentation of Foods and Beverages as a Tool for Increasing Availability of Bioactive Compounds. Focus on Short-Chain Fatty Acids. Foods 2020, 9, 999. [Google Scholar] [CrossRef] [PubMed]
  59. Kasubuchi, M.; Hasegawa, S.; Hiramatsu, T.; Ichimura, A.; Kimura, I. Dietary Gut Microbial Metabolites, Short-Chain Fatty Acids, and Host Metabolic Regulation. Nutrients 2015, 7, 2839–2849. [Google Scholar] [CrossRef] [PubMed] [Green Version]
  60. Birch, A.N.; Petersen, M.A.; Hansen, Å.S. The Aroma Profile of Wheat Bread Crumb Influenced by Yeast Concentration and Fermentation Temperature. LWT.-Food Sci. Technol. 2013, 50, 480–488. [Google Scholar] [CrossRef]
  61. Tagliazucchi, D.; Martini, S.; Solieri, L. Bioprospecting for Bioactive Peptide Production by Lactic Acid Bacteria Isolated from Fermented Dairy Food. Fermentation 2019, 5, 96. [Google Scholar] [CrossRef] [Green Version]
  62. Pessione, E.; Cirrincione, S. Bioactive Molecules Released in Food by Lactic Acid Bacteria: Encrypted Peptides and Biogenic Amines. Front. Microbiol. 2016, 7, 876. [Google Scholar] [CrossRef] [Green Version]
  63. Liukkonen, K.-H.; Katina, K.; Wilhelmsson, A.; Myllymaki, O.; Lampi, A.-M.; Kariluoto, S.; Piironen, V.; Heinonen, S.-M.; Nurmi, T.; Adlercreutz, H.; et al. Process-Induced Changes on Bioactive Compounds in Whole Grain Rye. Proc. Nutr. Soc. 2003, 62, 117–122. [Google Scholar] [CrossRef]
  64. Adebo, O.A.; Medina-Meza, I.G. Impact of Fermentation on the Phenolic Compounds and Antioxidant Activity of Whole Cereal Grains: A Mini Review. Molecules 2020, 25, 927. [Google Scholar] [CrossRef] [Green Version]
  65. Moore, J.; Cheng, Z.; Hao, J.; Guo, G.; Liu, J.G.; Lin, C.; Yu, L. Effects of Solid-State Yeast Treatment on the Antioxidant Properties and Protein and Fiber Compositions of Common Hard Wheat Bran. J. Agric. Food Chem. 2007, 55, 10173–10182. [Google Scholar] [CrossRef]
  66. Spaggiari, M.; Ricci, A.; Calani, L.; Bresciani, L.; Neviani, E.; Dall’Asta, C.; Lazzi, C.; Galaverna, G. Solid State Lactic Acid Fermentation: A Strategy to Improve Wheat Bran Functionality. LWT 2020, 118, 108668. [Google Scholar] [CrossRef]
  67. Laurent-Babot, C.; Guyot, J.P. Should Research on the Nutritional Potential and Health Benefits of Fermented Cereals Focus More on the General Health Status of Populations in Developing Countries? Microorganisms 2017, 5, 40. [Google Scholar] [CrossRef] [PubMed] [Green Version]
  68. Poutanen, K.; Flander, L.; Katina, K. Sourdough and Cereal Fermentation in a Nutritional Perspective. Food Microbiol. 2009, 26, 693–699. [Google Scholar] [CrossRef]
  69. Brown, L.; Pingitore, E.V.; Mozzi, F.; Saavedra, L.M.; Villegas, J.M.; Hebert, E. Lactic Acid Bacteria as Cell Factories for the Generation of Bioactive Peptides. Protein Pept. Lett. 2017, 24, 146–155. [Google Scholar] [CrossRef] [PubMed]
  70. Huang, C.B.; Alimova, Y.; Myers, T.M.; Ebersole, J.L. Short- and Medium-Chain Fatty Acids Exhibit Antimicrobial Activity for Oral Microorganisms. Arch. Oral. Biol. 2011, 56, 650–654. [Google Scholar] [CrossRef] [PubMed] [Green Version]
  71. Guo, L.; Gong, S.; Wang, Y.; Sun, Q.; Duo, K.; Fei, P. Antibacterial Activity of Olive Oil Polyphenol Extract Against Salmonella Typhimurium and Staphylococcus Aureus: Possible Mechanisms. Foodborne. Pathog. Dis. 2020, 17, 396–403. [Google Scholar] [CrossRef]
  72. Tang, A.S.; Chikhale, P.J.; Shah, P.K.; Borchardt, R.T. Utilization of a Human Intestinal Epithelial Cell Culture System (Caco-2) for Evaluating Cytoprotective Agents. Pharm. Res. 1993, 10, 1620–1626. [Google Scholar] [CrossRef]
  73. Bruininx, E.M.A.M.; Koninkx, J.F.J.G.; Binnendijk, G.P.; Zandstra, T.; Heetkamp, M.J.W.; van der Peet-Schwering, C.M.C.; Gerrits, W.J.J. Effects of Prefermented Cereals or the End Products of Fermentation on Growth and Metabolism of Enterocyte-like Caco-2 Cells and on Intestinal Health of Restrictedly Fed Weanling Pigs. Animal 2010, 4, 40–51. [Google Scholar] [CrossRef] [Green Version]
  74. Galli, V.; Mazzoli, L.; Luti, S.; Venturi, M.; Guerrini, S.; Paoli, P.; Vincenzini, M.; Granchi, L.; Pazzagli, L. Effect of Selected Strains of Lactobacilli on the Antioxidant and Anti-Inflammatory Properties of Sourdough. Int. J. Food Microbiol. 2018, 286, 55–65. [Google Scholar] [CrossRef]
  75. Yang, H.S.; Haj, F.G.; Lee, M.; Kang, I.; Zhang, G.; Lee, Y. Laminaria Japonica Extract Enhances Intestinal Barrier Function by Altering Inflammatory Response and Tight Junction-Related Protein in Lipopolysaccharide-Stimulated Caco-2 Cells. Nutrients 2019, 11, 1001. [Google Scholar] [CrossRef]
Figure 1. Appearance of unfermented rye bran and wheat germ mixture (UF) and of the preferment obtained by the fermentation of the selected microbial consortia (FM) and the benchmark after 24 h of fermentation.
Fermentation 08 00722 g001
Figure 2. Viability over time of Bifidobacterium spp. in SIF only or in the presence of FM, benchmark and UF (mean ± SD, n =3).
Fermentation 08 00722 g002
Figure 3. Effects of FM, benchmark and UF on the growth of E. coli ECET, S. choleraesuis and Y. enterocolitica (mean ± SD, n =3). * p < 0.05.
Fermentation 08 00722 g003
Figure 4. Effect of tested samples on Caco-2 cell proliferation. Cells were treated with different concentrations of tested samples for 24 h, and proliferation was assessed using PrestoBlue™ Cell Viability Reagent. The data are presented as the mean ± SEM. Statistical significance in comparison to the negative control (untreated cells) was assessed using one-way ANOVA followed by Dunnett’s multiple comparison test; * p < 0.05; ** p < 0.01; *** p < 0.001; **** p < 0.0001.
Fermentation 08 00722 g004
Table 1. Chemical composition of wheat germ and rye bran used in this work.
Component %Wheat GermRye Bran
Proteins %28.913.8
Humidity %12.111.6
Ashes %3.92.5
Soluble Fiber %1.14.6
Insoluble Fiber %11.918.5
Total fat %7.52.9
Starch %23.645.0
Phytic acid %1.61.3
Table 2. pH, titratable acidity, LAB and yeast cell load (pre- and post-fermentation) of the different samples after 24 h of fermentation. For the same parameter, average values lacking a common letter (a–c) significantly differ from each other.
Pre-FermentationPost-Fermentation
AcidityLABYeastsLABYeasts
SamplepHmeqNaOHlog CFU/glog CFU/glog CFU/glog CFU/g
FM 13.88 ± 0.16 a21.10 ± 0.40 a6.54 ± 0.214.67 ± 0.18 a9.46 ± 0.19 a7.38 ± 0.18 a
Benchmark 25.69 ± 0.13 b9.40 ± 0.30 b<1.06.89 ± 0.22 b2.11 ± 0.11 b8.21 ± 0.21 b
UF 36.43 ± 0.12 c6.10 ± 0.10 c<1.0<1.0--
1 FM: Fermentation by microbial consortia composed of LAB and yeasts. 2 Benchmark: fermentation by a benchmark bakery yeast. 3 UF: unfermented milling by-product mixture.
Table 3. Fat, saturated fatty acids, starch, insoluble fiber, soluble fiber, proteins, salt, lactic acid and acetic acid expressed as g/100 g of dry matter (DM), of the preferment FM compared with the benchmark and the UF sample. For the same parameter, average values lacking a common letter (a,b) significantly differ from each other.
FM 1Benchmark 2UF 3
Fat g/100 g4.0 ± 0.5 a3.0 ± 0.4 a3.5 ± 0.3 a
Saturated fatty acids g/100 g1.2 ± 0.2 a0.9 ± 0.2 a0.9 ± 0.2 a
starch g/100 g9.1 ± 0.4 b9.3 ± 0.5 b10.5 ± 0.7 a
Sugars g/100 g0.3 ± 0.1 a0.3 ± 0.1 a2.8 ± 0.3 b
Insoluble fiber g/100 g38.8 ± 1.2 a41.3 ± 1.6 a40.5 ± 1.3 a
Soluble fiber g/100 g9.3 ± 0.4 a8.5 ± 0.5 ab8.3 ± 0.3 b
Protein g/100 g16.6 ± 0.4 a15.7 ± 0.5 ab15.3 ± 0.4 b
Lactic acid g/100 g1.0110.02-
Acetic acid g/100 g0.1040.060.02
1 FM: Fermentation by microbial consortia composed of LAB and yeasts. 2 Benchmark: fermentation by a benchmark bakery yeast. 3 UF: unfermented milling by-product mixture.
Table 4. Fatty acid profiles expressed as relative percentages, of each considered preferment (FM and benchmark) and unfermented milling by-product mixture (UF). For the same parameter, average values lacking a common letter (a,b) significantly differ from each other.
FA Relative Percentage
C14:0C15:0C16:1C16:0C18:2 n-6C18:1 Δ9C18:3 n-3C18:0CL *UL
UF 10.4 a0.3 a0.4 a37.7 b42.2 a15.1 a2.1 a1.8 a17221.06
Benchmark 20.6 a0.3 a0.3 a35.5 b42.0 a16.9 a2.2 a2.2 a17251.08
FM 30.7 a0.1 a0.8 b30.5 a40.1 a22.6 b2.8 b2.4 a17321.11
1 FM: Fermentation by microbial consortia composed of LAB and yeasts. 2 Benchmark: fermentation by a benchmark bakery yeast. 3 UF: unfermented milling by-product mixture. The fatty acid relative percentages were calculated with respect to the total fatty acid methyl esters. The results are means of three repetitions of three independent experiments. The coefficients of variability, expressed in percentages as ratios between the standard deviations and the mean values, ranged between 2% and 5%. * Mean chain length calculated as (FAP * C) (where FAP is the percentage of fatty acid and C the number of carbon atoms). Unsaturation level calculated as [percentage monoenes + 2(percentage dienes) + 3(percentage trienes)]/100.
Table 5. Average lightness (L*), redness (a*) and yellowness (b*) values prior to fermentation (UF) and at the end of fermentation by the selected microbial consortia of LAB and yeasts (FM) and by a benchmark bakery yeast (benchmark). Data represent means ± SD. For the same parameter, average values lacking a common letter (a–c) significantly differ from each other.
L*a*b*
UF55.32 ± 1.07 b0.85 ± 0.20 a12.45 ± 0.56 c
Benchmark52.63 ± 1.11 c2.62 ± 0.26 c8.77 ± 0.52 a
FM63.15 ± 0.92 a1.68 ± 0.40 b10.66 ± 0.39 b
Table 6. Volatile compounds, expressed as ppm, detected through GC-MS-SPME in preferments FM, benchmark, and the mixture of unfermented milling by-products (UF). The coefficients of variability, expressed as the percentage ratios between the standard deviations and the mean values, ranged between 2% and 5%.
UFFMBenchmark
Odor Perception appm
PentanalFruity-0.030.02
HexanalGreen, Fruity0.732.243.10
HeptanalGreen, Herbal-0.230.54
2-HexenalFruity, Green0.061.230.87
2-Nonenal, (E)-Fatty, Green0.050.180.83
AcetaldehydeEthereal, Pungent, Fruity0.241.181.01
BenzaldehydeFruity, Sharp-0.200.19
Total Aldehydes 1.085.296.56
2,3-ButanedioneButtery, Creamy, Pungent-0.130.15
3-PentanoneEthereal-0.44-
Methyl Isobutyl KetoneGreen, Sharp, Herbal0.340.160.31
2-Hexanone, 4-methyl-Fruity, Fungal, Meaty0.080.110.20
3-Penten-2-one, 4-methyl-Vegetable, Pungent0.400.580.42
4-Heptanone, 2,6-dimethyl-Green, Fruity0.130.220.35
2-Butanone, 3-hydroxy-Buttery, Sweet, Creamy-1.230.28
Total Ketones 0.962.851.71
Ethyl AlcoholAlcoholic, Ethereal0.3526.7140.33
1-PropanolAlcoholic, Fermented-0.200.19
1-Penten-3-olGreen, Ethereal-0.210.18
2-HexanolWiney, Fruity0.210.290.18
1-PentanolFermented, Balsamic0.610.760.21
2-Penten-1-ol, (E)-Green0.130.380.17
1-HexanolHerbal, Hethereal1.298.384.12
1-Octen-3-olEarthy, Mushroom0.190.490.09
HeptanolGreen, Musty-0.792.89
1-Hexanol, 2-ethyl-Citrus, Floral0.060.190.10
1-OctanolWaxy, Green0.060.530.47
2-FuranmethanolBready, Alcoholic-0.060.10
Benzyl AlcoholFloral, Balsamic-0.590.67
1-Butanol, 3-methylFruity, Sweet-1.622.88
3-Nonen-1-ol, (Z)-Waxy, Green-0.153.18
Phenylethyl AlcoholFloral0.080.36-
Total Alcohols 2.9641.7055.67
Acetic AcidAcidic, Sharp0.157.961.85
Butanoic AcidCheesy, Sharp-0.12-
Butanoic Acid, 3-methyl-Sweet, Mentholic-0.36-
Pentanoic AcidCheesy, Acidic-0.43-
Hexanoic AcidFatty, Sour0.083.600.35
Heptanoic AcidCheesy, Rancid, Sour-0.11-
Octanoic AcidFatty, Waxy, Rancid-0.18-
Total Acids 0.239.762.20
Ethyl AcetateEthereal, Fruity, Sweet-8.4518.90
Pentanoic Acid, Ethyl EsterFruity, Sweet-0.411.35
Hexanoic Acid, Ethyl EsterFruity-1.215.21
Heptanoic Acid, Ethyl EsterFruity0.050.050.73
Octanoic Acid, Ethyl EsterWaxy, Fruity, Winey0.11-0.29
Nonanoic Acid, Ethyl EsterWaxy, Fruity--0.51
Butanoic Acid, Ethyl EsterFruity, Juicy--0.27
1-Butanol, 3-methyl-, AcetateFruity, Sweet-0.15-
1-Butanol, 3-methyl-, FormateGreen, Fruity-4.196.87
Total Esters 0.1614.4634.13
Butylated HydroxytoluenePhenolic, Camphoreous1.131.051.05
Cyclohexene, 1,6,6-trimethyl-Citrus, Herbal1.591.531.19
Cyclohexene, 3-methyl-Citrus-0.070.11
Hexadecane-0.080.020.08
Furan, 2-pentyl-Fruity, Green-0.020.07
Benzenamine-1.690.780.99
Total Other Compounds 5.254.254.18
10.6381.32104.45
a Based on data reported in the literature and information found at: http://www.thegoodscentscompany.com/index.html (accessed on 11 November 2022).
Table 7. Bioactive peptides, total SCFA, phenols, antioxidant activity (ABTS and DPPH) and phytic acid content in UF, benchmark and FM. Data represent means ± SD. For the same parameter, average values lacking a common letter (a–c) significantly differ from each other.
FM 1Benchmark 2UF 3
Bioactive peptides (mg/g)5.41 ± 0.17 b3.88 ± 0.34 a3.55 ± 0.28 a
Total SCFA (mg/kg)12.64 ± 0.89 c2.21 ± 0.50 b0.23 ± 0.09 a
Total phenols (Gallic acid mg eq/kg DM)451 ± 22 b295 ± 16 a263 ± 16 a
ABTS (TROLOX mg/kg DM)432 ± 24 b355 ± 16 a349 ± 26 a
DPPH (TROLOX mg/kg DM)229 ± 14 b199 ± 9 a196 ± 15 a
Phytic acid (g/100 g DM)0.76 ± 0.06 b0.95 ± 0.04 a1.05 ± 0.05 a
1 FM: Fermentation by microbial consortia composed of LAB and yeasts. 2 Benchmark: fermentation by a benchmark bakery yeast. 3 UF: unfermented milling by-product mixture.
Table 8. The prebiotic indices of pre-fermented ingredients in UF and FM and commercial prebiotic products, FOS and inulin. For the same bacterial strains, average values lacking a common letter (a–d) significantly differ from each other.
Bacterial StrainsUF 1FM 2FOSINULIN
L. plantarum ATCC 80142.73 a2.78 a1.17 b0.95 c
L. rhamnosus ATCC 74692.80 a2.75 a1.03 b0.28 c
L. acidophilus ATCC 43562.08 b2.65 a0.97 c0.23 d
L. fermentum ATCC 93385.60 b7.86 a1.95 c1.13 c
B. angulatum DSM 200981.61 b2.66 a0.46 c2.16 ab
B. breve DSM 200911.96 b0.82 c1.59 bc5.70 a
B. longum DSM 202193.10 a2.15 b0.79 d1.27 c
1 UF: unfermented milling by-product mixture. 2 FM: fermentation by microbial consortia composed of LAB and yeasts.
Publisher’s Note: MDPI stays neutral with regard to jurisdictional claims in published maps and institutional affiliations.

