Article

Potential Prebiotic Effect of Cava Lees: Changes in Gut Microbiota

by
Alba Martín-Garcia
1,2,3,
Javier Gonzalez-Linares
4,
Montserrat Riu-Aumatell
1,2,3,* and
Elvira López-Tamames
1,2,3
1
Departament de Nutrició, Ciències de l’Alimentació i Gastronomia, Facultat de Farmàcia i Ciències de l’Alimentació, Campus de l’Alimentació de Torribera, Universitat de Barcelona, Av. Prat de la Riba 171, 08921 Santa Coloma de Gramenet, Spain
2
Institut de Recerca en Nutrició i Seguretat Alimentària (INSA·UB), Universitat de Barcelona, Av. Prat de la Riba 171, 08921 Santa Coloma de Gramenet, Spain
3
Xarxa d’Innovació Alimentària de la Generalitat de Catalunya (XIA), C/ Baldiri Reixac 4, 08028 Barcelona, Spain
4
UTOX-PCB, Unit of Experimental Toxicology and Ecotoxicology, Parc Científic de Barcelona, 08028 Barcelona, Spain
*
Author to whom correspondence should be addressed.
Fermentation 2022, 8(11), 657; https://doi.org/10.3390/fermentation8110657
Submission received: 5 October 2022 / Revised: 8 November 2022 / Accepted: 18 November 2022 / Published: 20 November 2022
(This article belongs to the Special Issue Nutrition and Health of Fermented Foods)

Abstract

:
Lees are a winery by-product with a fiber-rich composition that could have a potential prebiotic effect on gut microbiota. Prebiotics cannot be digested by humans but can be used by bacteria found in the large intestine. To evaluate the potential prebiotic effect of lees, they were administered to Wistar rats for 14 days. Feces were collected daily, and DNA was extracted and analyzed by shot gun sequencing. The supplementation with lees did not affect weight, food intake, or water consumption of the studied rats. It was found that lees promoted the increase of relative abundance of probiotic bacteria belonging to the Lactobacillaceae family, as well as other potentially probiotic species such as Blautia hansenii, Roseburia intestinalis, and Ruminococcus obeum. Moreover, lees supplementation also reduced the abundance of certain pathogenic bacteria. In conclusion, lees can improve the presence of beneficial bacteria in the gastrointestinal tract and can be re-valorized as a new ingredient in food formulation.

1. Introduction

Prebiotics are non-digestible ingredients for humans, such as dietary fiber, that can stimulate the growth and/or metabolic activity of a healthy gut microbiota [1,2,3]. In fact, the large intestine is one of the human body organs with the greatest microbial diversity, with over 1000 bacterial species and with a concentration of 1011–1012 UFC/g [4]. In that regard, when dietary soluble fiber arrives to the colon, it is fermented by the gut microbiota, producing short chain fatty acids (SCFA), such as acetic, butyric, and propionic acids [5]. The SCFA are absorbed into the blood stream and are transported to different organs and tissues such as the brain, muscles, or liver, where they can induce several positive effects. For instance, butyrate is the preferred energy source for the intestinal mucosa, while propionate contributes to gluconeogenesis in the liver [4,6]. Moreover, dietary fiber also contains bioactive compounds that can increase antioxidant activity [7].
Since dietary fiber has a positive effect on human health, the European Food Safety Authority (EFSA) recommends an intake of 25 g of fiber per day [8]. Among the health benefits of fiber are the prevention of cardiovascular diseases, hypertension, diabetes, and obesity [9,10]. Furthermore, it contributes to improving the activity of the gastrointestinal tract, satiety, and the modulation of the immune response of the intestinal mucosa [10,11]. Finally, dietary fiber can reduce the glycemic response and the blood cholesterol levels, which are a risk factor in cardiovascular diseases [9,12].
Dietary fiber comes from numerous sources (cereals, fruits, and vegetables); however, due to the eating habits of the population, it is hard to achieve EFSA’s goal [8]. In fact, most European countries do not reach the minimum of 25 g/day of dietary fiber intake, the mean being 19.6 g/day [13]. This results in the need to find alternative sources of fiber [9]. Recently, there has been a growing interest in the composition of several by-products and their possible re-valorization [5,14,15,16,17]. In that regard, wine lees have been described as a source of fiber and antioxidant compounds [5].
Cava lees are a sparkling wine by-product obtained after the second fermentation of wine. Lees are rich in fiber, as well as proteins and polyphenols [5,9], but are considered a waste with no added value. In fact, the consumption of sparkling wine in 2021 was around 11.1 mhL worldwide [18], where each bottle contains approximately 1 g of lees, being a total of 300 tons per year of such by-product (25% of the total waste generated by the wine industry) [19]. Such a volume of waste must be managed, as it not only represents an economic impact for the industry but also has an important effect on the environment. Therefore, there is an increasing tendency to reduce waste production by valorizing by-products and re-introducing them into the production cycle.
In that regard, the valorization of lees has been studied by different research groups. They have been tested in vitro to improve the viability of certain lactic acid bacteria (LAB) with probiotic characteristics [20] and have been described as active against food pathogens (Listeria monocytogenes and Salmonella spp.) [21]. Also, wine lees have been proposed as an alternative source of antioxidants for meat [22] and as an emulsion stabilizer [23]. Moreover, our research group has studied a potential re-valorization of Cava lees as a new ingredient in sourdough and bread, improving the growth and survival of the fermenting microbiota [24,25].
Therefore, if Cava lees are included in food formulation, given their composition, they can contribute to fiber intake and reaching the daily recommended intake value. To that end, the aim of this preliminary study was to evaluate the food safety and the potential prebiotic effect of Cava lees on the intestinal microbiota in an animal model.

2. Materials and Methods

2.1. Ethical Approval

Ethical approval for this study was provided by the Bioethics Committee of the University of Barcelona (IRB00003099).

2.2. Study Design

All experimental procedures were performed according to the Directive 2010/63/EU of the European Parliament on the protection of animals used for scientific purposes. The study was carried out with 24 Wistar rats (RjHan:Wi, Janvier Lab, Le Genest-Saint-Isle, France) (Table 1). At the start of the study, rats were approximately 7–8 weeks old. At least 5 days of acclimatization were allowed under test conditions between animal arrival and the start of treatment.
A daily dose of 3 × 10⁶ lees cells/kg body weight was administered by gavage (lees diet) for 14 days. The test item (Cava lees) was weighed and prepared daily, in 0.5% aqueous solution of carboxymethyl cellulose (CMC) (w/v) (CAS Num.: 9004-32-4; Ref.: 144441.1209, Panreac), before administration. Animals with a Control diet were administered only the aqueous solution of CMC. Irradiated certified laboratory dry diet RM1(P) (Ref.: 801151; Dietex SDS, Argenteuil, France) was offered with unlimited supply, and autoclaved water was offered ad libitum.
Throughout the entire study, animal weight was controlled, as well as food and water intake and any clinic symptoms. During the dietary intervention, feces samples were collected daily to evaluate the prebiotic effect of Cava lees. Animals were subjected to hematological, chemical, and immunological blood analyses at the beginning and end of the treatment (14 days). At the end of the study, the animals were sacrificed to perform a necropsy, a macroscopic examination, and the collection of organs and tissues.

2.3. Intestinal Microbiota Extraction and Analysis

Bacterial DNA was isolated from feces samples using a QIAamp PowerFecal DNA Kit (Ref.: 12830-50, QIAGEN, Germantown, MD, USA), following the manufacturer’s instructions. DNA concentration was measured by BioDrop µLite (Biotech, Madrid, Spain). To analyze the microbial composition, shot gun sequencing was performed on the Illumina MiSeq (Illumina Inc., San Diego, CA, USA) platform by the Genomic and Bioinformatic Service of the Universitat Autònoma de Barcelona. Then, bioinformatics analysis of the microbial composition was performed using the software MG-RAST version 4.04 [26] and QIIME 2 version 2022.2 [27].

2.4. Statistic Analysis

Statistical analysis was performed using Prism 9 v.9.1.2 (225) (GraphPad Software, LLC., San Diego, CA, USA). Differences in the microbiota composition between groups were analyzed by the Kruskal–Wallis test for non-parametric data. Alpha diversity was measured by the Shannon index and evenness, and, for beta diversity, a Bray–Curtis dissimilarity analysis was performed and visualized using a principal coordinates analysis (PCoA). Differences were considered significant with a p-value < 0.05.

3. Results and Discussion

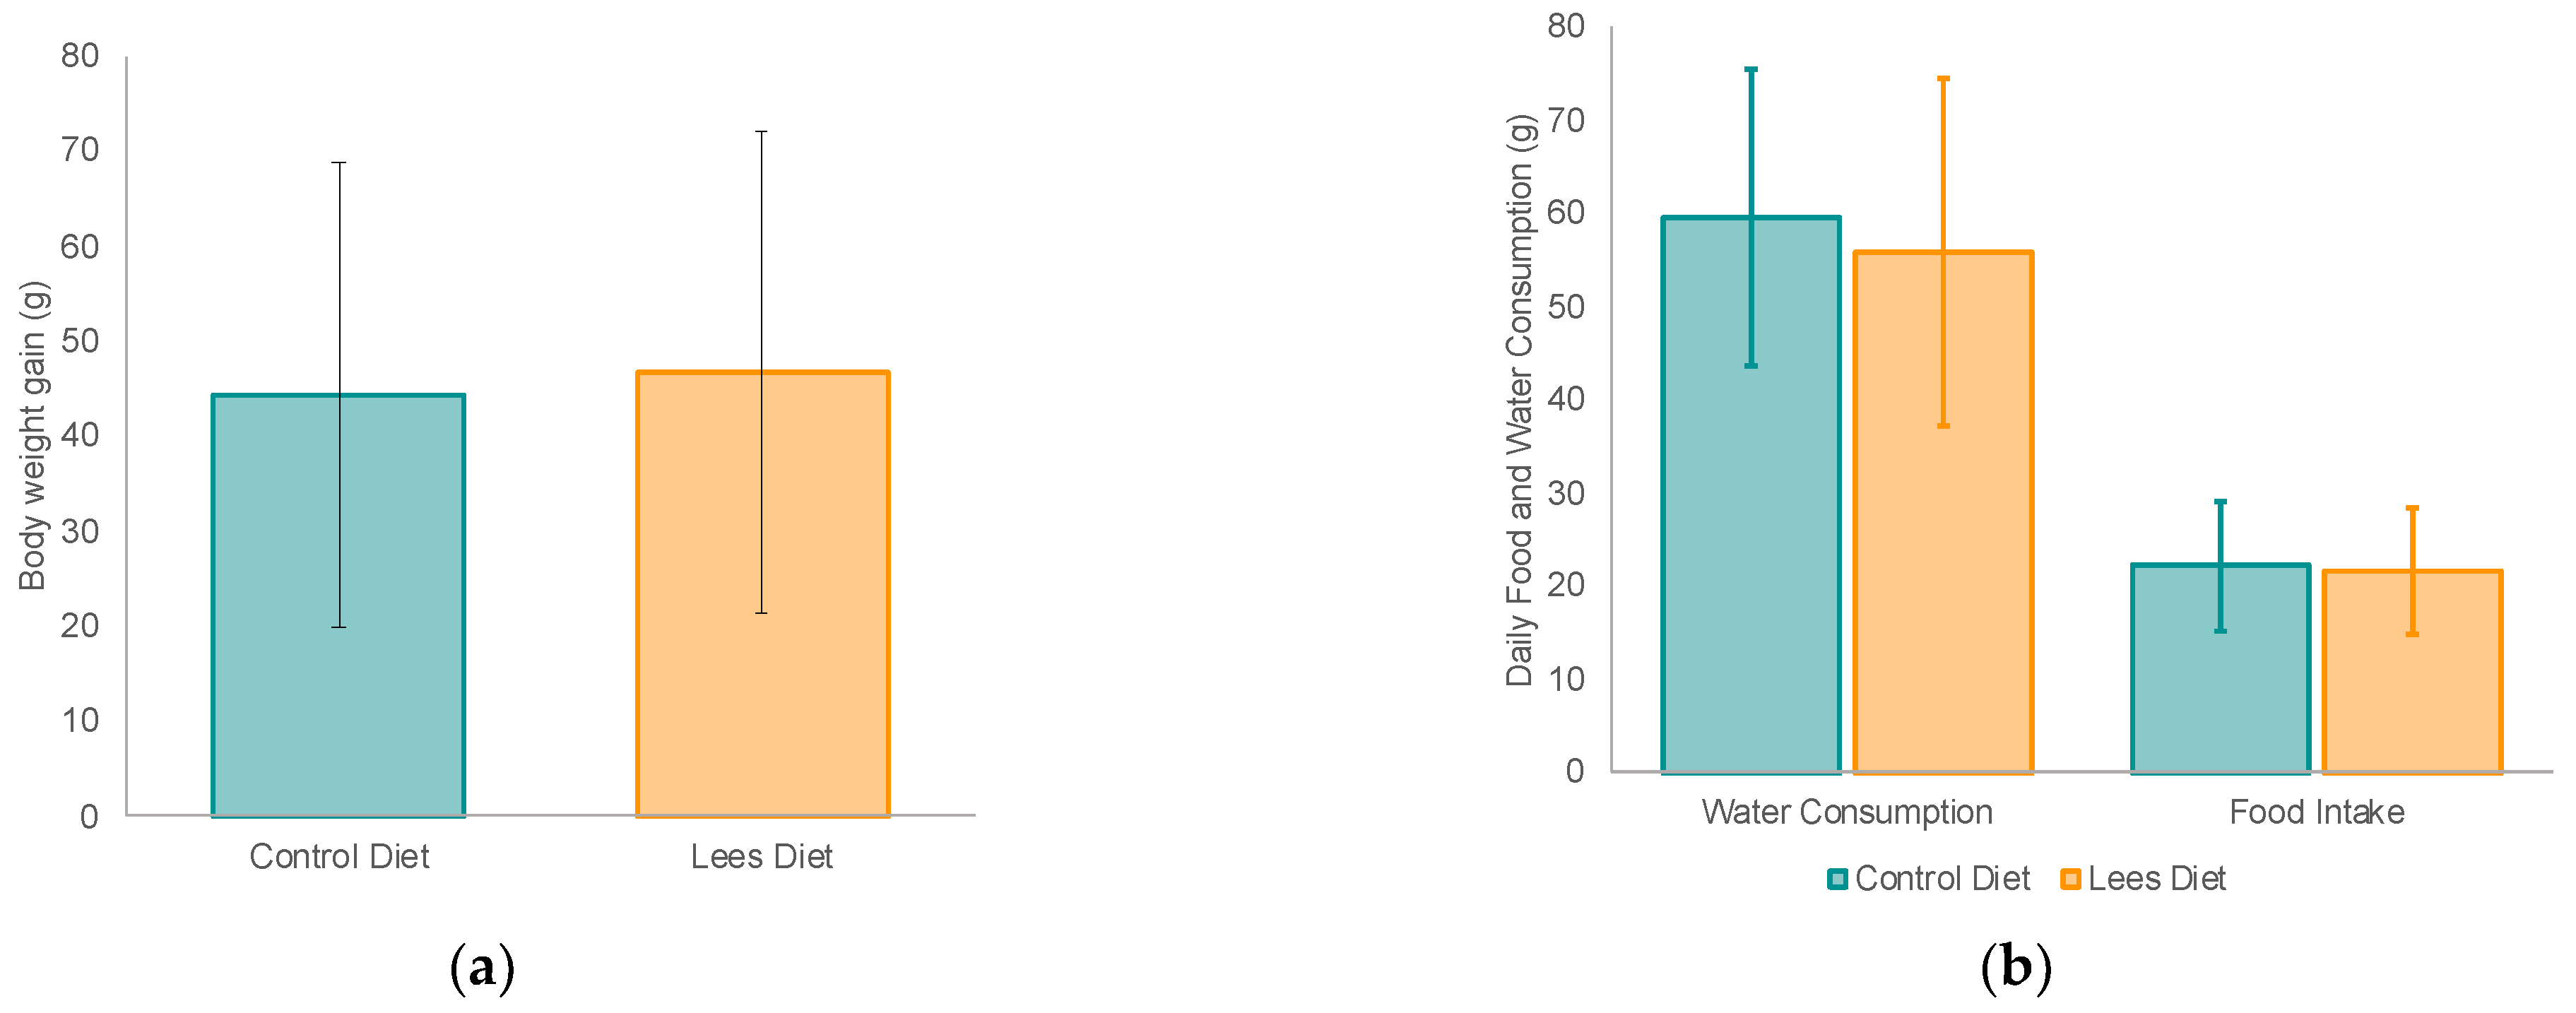
3.1. Effect of Cava Lees on Body Weght, Food Intake and Organs of Rats

Throughout the study (14 days), weight and food and water intake data were registered daily (Figure 1). There were no significant differences in weight gain between the two groups (Figure 1a), nor regarding food intake or water consumption (Figure 1b). At the beginning of the study, rats in the control group weighted 273.2 ± 64.5 g; at the end, the weight was around 317.6 ± 96.0 g. Regarding the lees diet group, at first, the animals weighted 268.9 ± 56.9 g and, at the end, the rats’ weight was 315.7 ± 88.9 g, showing no statistically significant differences between groups.
Once the study was finished, animals were sacrificed, and their organs were removed. In general, there were no statistically significant differences regarding the organ (thymus, liver, spleen, and kidneys) weight of the two animal groups (Table 2). In fact, most organs showed a tendency to a higher weight in rats with a control diet. Nevertheless, rats with a lees diet presented a slight increase in spleen weight, although it was not significant. The spleen is a peripheric lymphoid organ that plays a key role in the immune response of a healthy body [28,29]. Therefore, changes in its volume and structure could have a direct impact on the immunity and resistance of the rat [28]. Even though an increase in spleen weight has been related to obesity [29], the data obtained in this study regarding spleen values of both control and lees diet rats match those of healthy rats [28,29].
Finally, no signs of necrosis nor other adverse effects were seen in the study of acute toxicity between the rats fed with lees and the controls. The observational parameters/general measurements (weight, food and water intake) hematology, biochemistry, histopathology, necropsy, and immunogenicity did not reflect significant differences between the control groups and the mixed trials (data not shown).

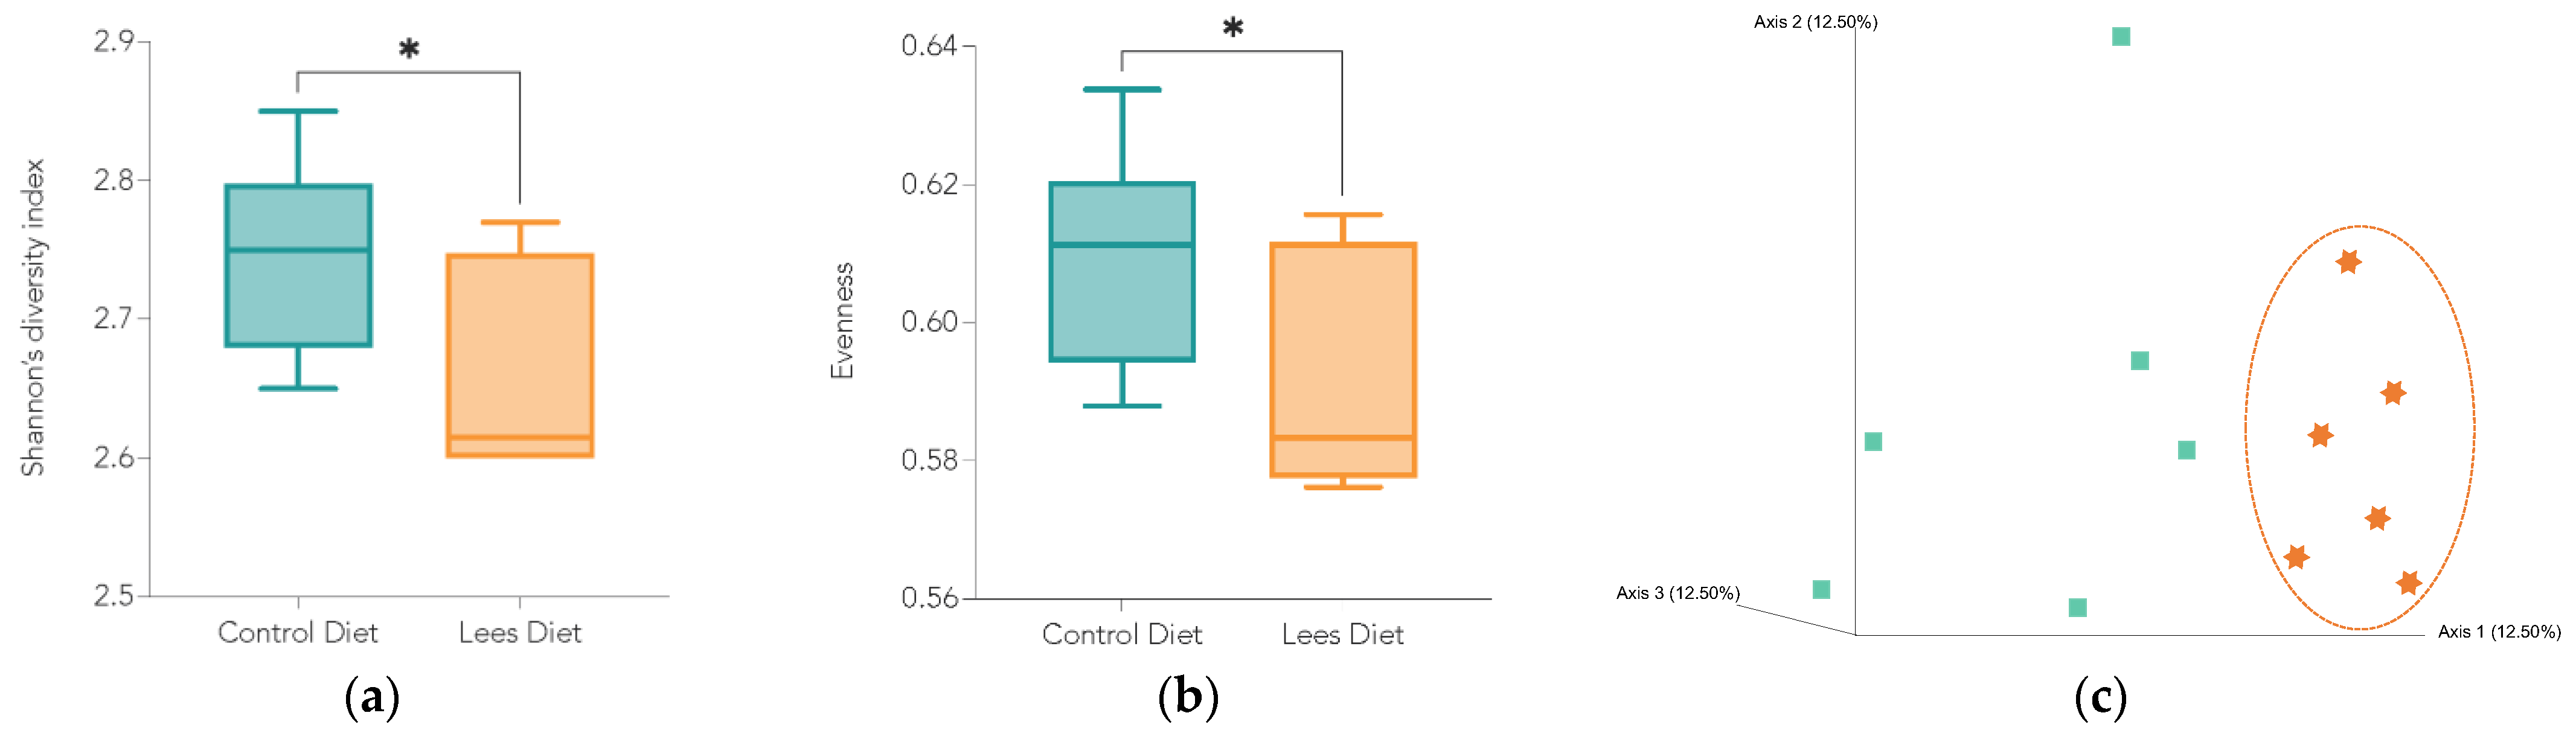
3.2. Effect of Cava Lees on Gut Microbiota Composition

Gut microbial composition of animals with both control and lees diet was analyzed and compared at the phylum, family, genus, and species levels. At the beginning of the study, the gut microbiota of both groups had a similar profile (p > 0.05). Overall, 5 phylum, 20 families, 88 genus, and 204 species were found with a relative abundance greater than 1%.
At a phylum level, Bacteroidetes (26%) and Firmicutes (68%) were the dominant bacteria in both groups. After the 14-day diet intervention, those were still the dominant phylum, although there was a shift in rats with a lees diet, where Bacteroidetes represented 17% and Firmicutes 75% (23% and 66% respectively in control rats), significant changes relative to the control group (p < 0.05). In general, bacteria belonging to the phylum Firmicutes produce more butyrate, while the ones corresponding to Bacteroidetes phylum mainly produce acetate and propionate [30,31,32]. In that regard, butyrate is considered a health promoter since it can increase insulin sensitivity, has anti-inflammatory activity, and regulates the energetic metabolism [30].
On the other hand, propionate and acetate act in different organs and tissues. For instance, the former stimulates GLP-1 and PYY release by L-entero-endocrine cells, which results in the inhibition of appetite (colon) and participates in hepatic gluconeogenesis, lowering the expression of enzymes related to the synthesis of fatty acids and cholesterol (liver) [30,31]; whereas the latter, acetate, stimulates the synthesis of lipids contributing to dyslipidemia (liver) and activates the parasympathetic nervous system (brain) by promoting insulin and gastric mucosa secretions (pancreas) [30,32].
Firmicutes include the families Lachnospiraceae, Lactobacillaceae, and Ruminococcaceae, among others. Table 3 shows the differences in the relative abundance of these families found between the control and lees group.
Bacteria classified as Lachnospiraceae, Lactobacillaceae, and Ruminococcaceae are able to hydrolyze starch and other polysaccharides (e.g., inulin), and produce SCFA such as butyrate [33,34]. In the present study, the relative abundance of such bacteria increased significantly in the animals with a lees diet. In fact, Zhang et al. (2017) [35] reported that, in mice fed with a pomegranate extract (rich in polyphenols), the abundance of Ruminococcaceae increased and Clostridiaceae decreased. It has been reported that wine lees are rich in bioactive compounds such as polyphenols [9,23]. Moreover, Ruminococcaceae bacteria are responsible for the degradation of several polysaccharides and fibers, and are related to the prevention of hepatitis (alcoholic and non-alcoholic), hepatic encephalopathy, and an increase in intestinal permeability [36].
Lachnospiraceae bacteria found in the human intestine mainly belong to the genus Blautia, Coprococcus, Dorea, Lachnospira, Oribacterium, and Roseburia [33]. It was found that Blautia hansenii, Ruminococcus obeum, and Roseburia intestinalis increased significantly with the intake of Cava lees (Figure 2). In this sense, Guo et al. (2017) [37] studied the possible prebiotic effect of polyphenols from green tea to reduce induced obesity in mice with a high-fat diet. They focused on the gut microbiota composition as well as the bacterial metabolic products, finding a positive correlation between an increase in Roseburia and the production of butyrate in mice fed with polyphenols from green tea. That increase in SCFA production could be related to the prevention of opportunistic pathogens and colon diseases by favoring the growth of commensal bacteria [37,38]. Furthermore, it has been observed that certain species of Blautia present antimicrobial activity against pathogens such as Clostridium perfringens, which makes them potential probiotics that benefit the host [39].
Nonetheless, Oliver et al. (2021) [40] reported a negative correlation between the relative abundance of Roseburia and Ruminococcus, and Bifidobacterium, suggesting a negative interaction between species from these taxa. Indeed, they observed a decrease in Bifidobacterium in animals with dietary fiber intake (2.7%) versus control (4.7%), while there was an increase in Roseburia (8.3%—lees; 3.9% control) and Ruminoccocus (8.9%—lees; 5.8%—control). As a matter of fact, Bifidobacterium participate in cross-feeding with other bacteria that produce butyrate and release oligo- and mono-saccharides from more complex substrates [34]. We observed a lower abundance of Bifidobacterium in rats with lees supplementation, although it was not significant.
Finally, various species of the family Lactobacillaceae are classified as probiotics. In general, we found that rats with lees supplementation presented a higher relative abundance of potentially probiotic bacteria (Table 3). These bacteria can modulate the immune response of the host, provide extra energy via SCFA production, and influence the structure, function, and integrity of the intestine [41]. Moreover, different strains of Lactobacillus, isolated from gut microbiota, have shown antimicrobial activity against pathogens resulting from the production of lactic acid, bacteriocins, and other bactericidal compounds [41,42,43]. In addition, several studies report that the intake of dietary fiber increases the relative abundance of Lactobacillus [44]. Table 4 shows the species of Lactobacillaceae bacteria that presented significant differences between the control and lees groups.
Regarding pathogenic bacteria, such as Enterobacteriaceae, Clostridiaceae, and Campylobacteraceae, rats with a diet supplemented with Cava lees showed a tendency to decrease (Table 5), while no significant changes were observed in rats with control diet (data not shown). In addition, certain pathogens decreased significantly in rats with diets supplemented with lees (Listeriaceae, Staphylococcaceae, and Vibrionaceae).
Enterobacteriaceae, which include Salmonella enterica, Shigella spp., and Escherichia coli, are known foodborne pathogens associated with intestinal infections [45]. In the present study, rats with a lees diet showed a tendency to decrease the abundance of such species (data not shown). Nevertheless, when focusing on different genera included in the previously discussed families, we observed significant differences between groups compared to the initial abundance of Clostridium, Campylobacter, Listeria, Staphylococcus, and Vibrio (Figure 3).
It has been reported that wine by-products present an antimicrobial activity against some of these bacteria, proposing them as natural additives in the food industry to ensure food safety as well as preventing food spoilage [46]. In fact, Hernández-Macias et al. (2021) [21] reported an antimicrobial effect, in vitro, of Cava lees on Salmonella spp. and L. monocytogenes.
Therefore, Cava lees might be active against pathogenic bacteria, which would help reduce foodborne illness. However, an extended supplementation of Cava lees is needed to confirm these preliminary results.

Bacterial Diversity

Bacterial diversity was assessed by alpha (Figure 4a,b) and beta diversity (Figure 4c). Alpha diversity is a measure of the number of different bacteria found within a sample, considering the evenness and distribution of such bacteria. The higher the value of the Shannon index, the more diversity there will be in the sample studied.
Regarding alpha diversity, it was observed that rats from the control group had a significantly higher diversity than the lees group. That could be a result of an increase in bacteria that produce antimicrobial compounds (e.g., L. brevis, L. plantarum, or L. sakei) and can reduce the relative abundance of other microorganisms.
On the other hand, beta diversity is related to the differences between individuals regarding the distribution of genera and species. Figure 4c shows that the animals with lees supplementation clustered together, while controls were more dispersed. This can translate to a greater homogeneity in the gut microbiota of animals with lees supplementation.
Finally, a differential abundance analysis with gneiss was performed (Figure 5). It can be observed that the denominator of y0 has few OTUs compared to the numerator of y0y0. Although balances were not able to infer absolute changes of microbes, it could limit the number of possible scenarios: the taxa in the numerator, on average, increased between the control and lees groups, the taxa in the denominator decreased between the lees and control groups, or a combination of both cases. The subsequent balance analysis showed a greater number of unique taxa in the control group (data not shown). Nevertheless, further investigations are needed in other to elucidate the presented preliminary results.

4. Conclusions

Due to the rich fiber composition of Cava lees, this by-product can present potential prebiotic characteristics. The supplementation with lees did not result in a weight increase nor a modification of the food and water intake. In addition, it did not have a negative impact on the studied organs. As for their effect on gut microbiota, lees promoted an increase in the relative abundance of potential probiotic bacteria (B. hansenii, R. intestinalis, and R. obeum). Additionally, the abundance of certain species of bacteria from the family Lactobacillaceae also increased significantly. All of the above could result in an increase in SCFA production (acetate, butyrate, and propionate). Therefore, it could be interesting to study the evolution of SFCA with a prolonged supplementation of Cava lees to confirm these preliminary results. Hence, the supplementation or formulation of food with Cava lees could be a new strategy for the re-valorization of such a by-product.

Author Contributions

Conceptualization, E.L.-T.; methodology, J.G.-L.; investigation, A.M.-G. and J.G.-L.; writing—original draft preparation, A.M.-G.; writing—review and editing, M.R.-A. and E.L.-T.; supervision, M.R.-A.; project administration, E.L.-T. All authors have read and agreed to the published version of the manuscript.

Funding

This research was funded by Comisión Interministerial de Ciencia y Tecnología (CICYT) (Spain) AGL2016-78324-R; the Generalitat de Catalunya, Project 2017-1376 SGR; INSA-UB (Institut de Recerca en Nutrició i Seguretat Alimentària), by XIA (Xarxa d’Innovació Alimentària); and Chartier World Lab Barcelona sponsorship with a grant from the Gouvernement du Québec to A.M.-G.

Institutional Review Board Statement

The animal study protocol was approved by the Bioethics Committee of the University of Barcelona (IRB00003099).

Informed Consent Statement

Not applicable.

Conflicts of Interest

The authors declare no conflict of interest.

References

  1. Siró, I.; Kápolna, E.; Kápolna, B.; Lugasi, A. Functional Food. Product Development, Marketing and Consumer Acceptance—A Review. Appetite 2008, 51, 456–467. [Google Scholar] [CrossRef] [PubMed]
  2. Davani-Davari, D.; Negahdaripour, M.; Karimzadeh, I.; Seifan, M.; Mohkam, M.; Masoumi, S.J.; Berenjian, A.; Ghasemi, Y. Prebiotics: Definition, Types, Sources, Mechanisms, and Clinical Applications. Foods 2019, 8, 92. [Google Scholar] [CrossRef] [PubMed] [Green Version]
  3. Chaluvadi, S.; Hotchkiss, A.T.; Yam, K.L. Chapter–36—Gut Microbiota: Impact of Probiotics, Prebiotics, Synbiotics, Pharmabiotics, and Postbiotics on Human Health. In Probiotics, Prebiotics, and Synbiotics; Watson, R.R., Preedy, V.R., Eds.; Academic Press: Cambridge, MA, USA, 2016; pp. 515–523. ISBN 978-0-12-802189-7. [Google Scholar]
  4. Slavin, J. Fiber and Prebiotics: Mechanisms and Health Benefits. Nutrients 2013, 5, 1417–1435. [Google Scholar] [CrossRef] [PubMed] [Green Version]
  5. Rivas, M.Á.; Casquete, R.; Córdoba, M.d.G.; Ruíz-Moyano, S.; Benito, M.J.; Pérez-Nevado, F.; Martín, A. Chemical Composition and Functional Properties of Dietary Fibre Concentrates from Winemaking By-Products: Skins, Stems and Lees. Foods 2021, 10, 1510. [Google Scholar] [CrossRef] [PubMed]
  6. Louis, P.; Flint, H.J. Formation of Propionate and Butyrate by the Human Colonic Microbiota. Environ. Microbiol. 2017, 19, 29–41. [Google Scholar] [CrossRef] [Green Version]
  7. Baenas, N.; Nuñez-Gómez, V.; Navarro-González, I.; Sánchez-Martínez, L.; García-Alonso, J.; Periago, M.J.; González-Barrio, R. Raspberry Dietary Fibre: Chemical Properties, Functional Evaluation and Prebiotic in Vitro Effect. LWT 2020, 134, 110140. [Google Scholar] [CrossRef]
  8. EFSA Panel on Dietetic Products, Nutrition, and Allergies (NDA) Scientific Opinion on Dietary Reference Values for Carbohydrates and Dietary Fibre. EFSA J. 2010, 8, 1462. [CrossRef] [Green Version]
  9. Troilo, M.; Difonzo, G.; Paradiso, V.M.; Summo, C.; Caponio, F. Bioactive Compounds from Vine Shoots, Grape Stalks, and Wine Lees: Their Potential Use in Agro-Food Chains. Foods 2021, 10, 342. [Google Scholar] [CrossRef]
  10. Anderson, J.W.; Baird, P.; Davis, R.H., Jr.; Ferreri, S.; Knudtson, M.; Koraym, A.; Waters, V.; Williams, C.L. Health Benefits of Dietary Fiber. Nutr. Rev. 2009, 67, 188–205. [Google Scholar] [CrossRef]
  11. Ciudad-Mulero, M.; Fernández-Ruiz, V.; Matallana-González, M.C.; Morales, P. Chapter Two—Dietary Fiber Sources and Human Benefits: The Case Study of Cereal and Pseudocereals. In Advances in Food and Nutrition Research; Ferreira, I.C.F.R., Barros, L., Eds.; Functional Food Ingredients from Plants; Academic Press: Cambridge, MA, USA, 2019; Volume 90, pp. 83–134. [Google Scholar]
  12. Satija, A.; Hu, F.B. Cardiovascular Benefits of Dietary Fiber. Curr. Atheroscler Rep. 2012, 14, 505–514. [Google Scholar] [CrossRef]
  13. Stephen, A.M.; Champ, M.M.-J.; Cloran, S.J.; Fleith, M.; van Lieshout, L.; Mejborn, H.; Burley, V.J. Dietary Fibre in Europe: Current State of Knowledge on Definitions, Sources, Recommendations, Intakes and Relationships to Health. Nutr. Res. Rev. 2017, 30, 149–190. [Google Scholar] [CrossRef] [PubMed] [Green Version]
  14. Gómez, B.; Peláez, C.; Martínez-Cuesta, M.C.; Parajó, J.C.; Alonso, J.L.; Requena, T. Emerging Prebiotics Obtained from Lemon and Sugar Beet Byproducts: Evaluation of Their in Vitro Fermentability by Probiotic Bacteria. LWT 2019, 109, 17–25. [Google Scholar] [CrossRef]
  15. Mildner-Szkudlarz, S.; Bajerska, J.; Zawirska-Wojtasiak, R.; Górecka, D. White Grape Pomace as a Source of Dietary Fibre and Polyphenols and Its Effect on Physical and Nutraceutical Characteristics of Wheat Biscuits. J. Sci. Food Agric. 2013, 93, 389–395. [Google Scholar] [CrossRef] [PubMed]
  16. Mildner-Szkudlarz, S.; Zawirska-Wojtasiak, R.; Szwengiel, A.; Pacyński, M. Use of Grape By-Product as a Source of Dietary Fibre and Phenolic Compounds in Sourdough Mixed Rye Bread. Int. J. Food Sci. Technol. 2011, 46, 1485–1493. [Google Scholar] [CrossRef]
  17. Rivas, M.Á.; Benito, M.J.; Ruíz-Moyano, S.; Martín, A.; Córdoba, M.d.G.; Merchán, A.V.; Casquete, R. Improving the Viability and Metabolism of Intestinal Probiotic Bacteria Using Fibre Obtained from Vegetable By-Products. Foods 2021, 10, 2113. [Google Scholar] [CrossRef]
  18. International Organisation of Vine and Wine. 2021 Statistical Report on World Vitiviniculture; International Organisation of Vine and Wine: Paris, France, 2022. [Google Scholar]
  19. De Iseppi, A.; Lomolino, G.; Marangon, M.; Curioni, A. Current and Future Strategies for Wine Yeast Lees Valorization. Food Res. Int. 2020, 137, 109352. [Google Scholar] [CrossRef]
  20. Hernández-Macias, S.; Comas-Basté, O.; Jofré, A.; Bover-Cid, S.; Latorre-Moratalla, M.L.; Vidal-Carou, M.C. Growth-Promoting Effect of Cava Lees on Lactic Acid Bacteria Strains: A Potential Revalorization Strategy of a Winery By-Product. Foods 2021, 10, 1636. [Google Scholar] [CrossRef]
  21. Hernández-Macias, S.; Ferrer-Bustins, N.; Comas-Basté, O.; Jofré, A.; Latorre-Moratalla, M.; Bover-Cid, S.; Vidal-Carou, M. del C. Revalorization of Cava Lees to Improve the Safety of Fermented Sausages. Foods 2021, 10, 1916. [Google Scholar] [CrossRef]
  22. Alarcón, M.; López-Viñas, M.; Pérez-Coello, M.S.; Díaz-Maroto, M.C.; Alañón, M.E.; Soriano, A. Effect of Wine Lees as Alternative Antioxidants on Physicochemical and Sensorial Composition of Deer Burgers Stored during Chilled Storage. Antioxidants 2020, 9, 687. [Google Scholar] [CrossRef]
  23. Felix, M.; Martínez, I.; Sayago, A.; Recamales, M.Á.F. Wine Lees: From Waste to O/W Emulsion Stabilizer. Innov. Food Sci. Emerg. Technol. 2021, 74, 102810. [Google Scholar] [CrossRef]
  24. Martín-Garcia, A.; Riu-Aumatell, M.; López-Tamames, E. Revalorization of Cava (Spanish Sparkling Wine) Lees on Sourdough Fermentation. Fermentation 2022, 8, 133. [Google Scholar] [CrossRef]
  25. Martín-Garcia, A.; Riu-Aumatell, M.; López-Tamames, E. By-Product Revalorization: Cava Lees Can Improve the Fermentation Process and Change the Volatile Profile of Bread. Foods 2022, 11, 1361. [Google Scholar] [CrossRef] [PubMed]
  26. Meyer, F.; Paarmann, D.; D’Souza, M.; Olson, R.; Glass, E.; Kubal, M.; Paczian, T.; Rodriguez, A.; Stevens, R.; Wilke, A.; et al. The Metagenomics RAST Server—A Public Resource for the Automatic Phylogenetic and Functional Analysis of Metagenomes. BMC Bioinform. 2008, 9, 386. [Google Scholar] [CrossRef] [PubMed] [Green Version]
  27. Bolyen, E.; Rideout, J.R.; Dillon, M.R.; Bokulich, N.A.; Abnet, C.C.; Al-Ghalith, G.A.; Alexander, H.; Alm, E.J.; Arumugam, M.; Asnicar, F.; et al. Reproducible, Interactive, Scalable and Extensible Microbiome Data Science Using QIIME 2. Nat Biotechnol. 2019, 37, 852–857. [Google Scholar] [CrossRef] [PubMed]
  28. Hu, Q.; Li, S.; Qiao, E.; Tang, Z.; Jin, E.; Jin, G.; Gu, Y. Effects of Boron on Structure and Antioxidative Activities of Spleen in Rats. Biol. Trace Elem. Res. 2014, 158, 73–80. [Google Scholar] [CrossRef] [PubMed]
  29. Altunkaynak, B.Z.; Ozbek, E.; Altunkaynak, M.E. A Stereological and Histological Analysis of Spleen on Obese Female Rats, Fed with High Fat Diet. Saudi Med. J. 2007, 28, 353–357. [Google Scholar]
  30. Magne, F.; Gotteland, M.; Gauthier, L.; Zazueta, A.; Pesoa, S.; Navarrete, P.; Balamurugan, R. The Firmicutes/Bacteroidetes Ratio: A Relevant Marker of Gut Dysbiosis in Obese Patients? Nutrients 2020, 12, 1474. [Google Scholar] [CrossRef]
  31. Chambers, E.S.; Viardot, A.; Psichas, A.; Morrison, D.J.; Murphy, K.G.; Zac-Varghese, S.E.K.; MacDougall, K.; Preston, T.; Tedford, C.; Finlayson, G.S.; et al. Effects of Targeted Delivery of Propionate to the Human Colon on Appetite Regulation, Body Weight Maintenance and Adiposity in Overweight Adults. Gut 2015, 64, 1744–1754. [Google Scholar] [CrossRef] [Green Version]
  32. Perry, R.J.; Peng, L.; Barry, N.A.; Cline, G.W.; Zhang, D.; Cardone, R.L.; Petersen, K.F.; Kibbey, R.G.; Goodman, A.L.; Shulman, G.I. Acetate Mediates a Microbiome–Brain–β-Cell Axis to Promote Metabolic Syndrome. Nature 2016, 534, 213–217. [Google Scholar] [CrossRef] [Green Version]
  33. Vacca, M.; Celano, G.; Calabrese, F.M.; Portincasa, P.; Gobbetti, M.; De Angelis, M. The Controversial Role of Human Gut Lachnospiraceae. Microorganisms 2020, 8, 573. [Google Scholar] [CrossRef]
  34. Flint, H.J.; Scott, K.P.; Duncan, S.H.; Louis, P.; Forano, E. Microbial Degradation of Complex Carbohydrates in the Gut. Gut Microbes 2012, 3, 289–306. [Google Scholar] [CrossRef] [PubMed]
  35. Zhang, S.; Yang, J.; Henning, S.M.; Lee, R.; Hsu, M.; Grojean, E.; Pisegna, R.; Ly, A.; Heber, D.; Li, Z. Dietary Pomegranate Extract and Inulin Affect Gut Microbiome Differentially in Mice Fed an Obesogenic Diet. Anaerobe 2017, 48, 184–193. [Google Scholar] [CrossRef] [PubMed]
  36. Su, H.; Chen, J.; Miao, S.; Deng, K.; Liu, J.; Zeng, S.; Zheng, B.; Lu, X. Lotus Seed Oligosaccharides at Various Dosages with Prebiotic Activity Regulate Gut Microbiota and Relieve Constipation in Mice. Food Chem. Toxicol. 2019, 134, 110838. [Google Scholar] [CrossRef]
  37. Guo, X.; Cheng, M.; Zhang, X.; Cao, J.; Wu, Z.; Weng, P. Green Tea Polyphenols Reduce Obesity in High-Fat Diet-Induced Mice by Modulating Intestinal Microbiota Composition. Int. J. Food Sci. Technol. 2017, 52, 1723–1730. [Google Scholar] [CrossRef]
  38. Martin-Gallausiaux, C.; Marinelli, L.; Blottière, H.M.; Larraufie, P.; Lapaque, N. SCFA: Mechanisms and Functional Importance in the Gut. Proc. Nutr. Soc. 2021, 80, 37–49. [Google Scholar] [CrossRef] [PubMed]
  39. Liu, X.; Mao, B.; Gu, J.; Wu, J.; Cui, S.; Wang, G.; Zhao, J.; Zhang, H.; Chen, W. Blautia—A New Functional Genus with Potential Probiotic Properties? Gut Microbes 2021, 13, 1875796. [Google Scholar] [CrossRef] [PubMed]
  40. Oliver, A.; Chase, A.B.; Weihe, C.; Orchanian, S.B.; Riedel, S.F.; Hendrickson, C.L.; Lay, M.; Sewall, J.M.; Martiny, J.B.H.; Whiteson, K. High-Fiber, Whole-Food Dietary Intervention Alters the Human Gut Microbiome but Not Fecal Short-Chain Fatty Acids. mSystems 2021, 6, e00115-21. [Google Scholar] [CrossRef] [PubMed]
  41. Khan, S.; Moore, R.J.; Stanley, D.; Chousalkar, K.K. The Gut Microbiota of Laying Hens and Its Manipulation with Prebiotics and Probiotics To Enhance Gut Health and Food Safety. Appl. Environ. Microbiol. 2020, 86, e00600-20. [Google Scholar] [CrossRef]
  42. Han, X.; Ding, S.; Ma, Y.; Fang, J.; Jiang, H.; Li, Y.; Liu, G. Lactobacillus Plantarum and Lactobacillus Brevis Alleviate Intestinal Inflammation and Microbial Disorder Induced by ETEC in a Murine Model. Oxidative Med. Cell. Longev. 2021, 2021, e6867962. [Google Scholar] [CrossRef]
  43. Liévin-Le Moal, V.; Servin, A.L. Anti-Infective Activities of Lactobacillus Strains in the Human Intestinal Microbiota: From Probiotics to Gastrointestinal Anti-Infectious Biotherapeutic Agents. Clin. Microbiol. Rev. 2014, 27, 167–199. [Google Scholar] [CrossRef] [Green Version]
  44. So, D.; Whelan, K.; Rossi, M.; Morrison, M.; Holtmann, G.; Kelly, J.T.; Shanahan, E.R.; Staudacher, H.M.; Campbell, K.L. Dietary Fiber Intervention on Gut Microbiota Composition in Healthy Adults: A Systematic Review and Meta-Analysis. Am. J. Clin. Nutr. 2018, 107, 965–983. [Google Scholar] [CrossRef] [PubMed]
  45. Babu, L.; Reddy, P.; Murali, H.S.; Batra, H.V. Optimization and Evaluation of a Multiplex PCR for Simultaneous Detection of Prominent Foodborne Pathogens of Enterobacteriaceae. Ann. Microbiol. 2013, 63, 1591–1599. [Google Scholar] [CrossRef]
  46. Mattos, G.N.; Tonon, R.V.; Furtado, A.A.L.; Cabral, L.M.C. Grape by-product extracts against microbial proliferation and lipid oxidation: A review. J. Sci. Food Agric. 2017, 97, 1055–1064. [Google Scholar] [CrossRef] [PubMed]
Figure 1. Rats’ body weight gain and daily food and water intake according to the dietary intervention (control or lees diet): (a) body weight gain of rats; (b) food and water consumption by rats.
Fermentation 08 00657 g001
Figure 2. Differences in relative abundance (%) of potentially probiotic bacteria between animals with control and lees diet. Significant differences between groups are indicated with asterisks (*): (a) Blautia hansenii; (b) Ruminococcus obeum; (c) Roseburia intestinalis.
Fermentation 08 00657 g002
Figure 3. Difference between groups (control diet and lees diet) regarding the initial abundance of different genera of pathogenic bacteria. Significant differences between groups are indicated with asterisks (*).
Fermentation 08 00657 g003
Figure 4. Alpha and beta diversity between animals with control (green) and lees (orange) diet. Significant differences between groups are indicated with an asterisk (*): (a) Shannon diversity index (alpha diversity); (b) evenness (alpha diversity); (c) beta diversity between animals with control (green squares) and lees (orange stars) diet determined by the Bray–Curtis index and principal coordinates analysis (PCoA).
Fermentation 08 00657 g004
Figure 5. Heatmap of the differential abundance analysis. The numerators for each balance are highlighted in light red, while the denominators are highlighted in dark red.
Fermentation 08 00657 g005
Table 1. Experimental design describing the two tested diets (control and lees diet).
GroupLabelLees Dose (mg/kg/Day)Administered Volume (mL/kg/Day)Animal Number
MaleFemale
1Control0101–67–12
2Lees2000 11013–1819–24
1 Safety factor equivalent to 15 times the recommended dose.
Table 2. Weight (g) of different organs (thymus, liver, spleen, and kidneys) of rats according to diet (control or lees). Values are mean ± standard deviation.
OrganControl DietLees Dietp-Value
Thymus0.73 ± 0.140.68 ± 0.100.398
Liver11.91 ± 3.7111.21 ± 3.680.650
Spleen0.82 ± 0.170.94 ± 0.240.158
Kidneys2.11 ± 0.592.06 ± 0.450.802
Table 3. Differences regarding relative abundance (%) of bacteria from the phylum Firmicutes between rats with control and lees diet. Values are mean ± standard deviation.
FamilyControl DietLees Dietp-Value
Lachnospiraceae10.87 ± 1.9115.22 ± 1.870.02
Lactobacillaceae9.71 ± 0.8311.71 ± 1.090.03
Ruminococcaceae8.55 ± 1.5311.00 ± 1.020.02
Table 4. Differences regarding abundance of bacteria from the family Lactobacillaceae between rats with control and lees diet. Values are mean ± standard deviation.
SpeciesControl DietLees Dietp-Value
Lactobacillus brevis240 ± 124671 ± 4430.02
Limosilactobacillus fermentum327 ± 2261144 ± 9050.02
Lacticaseibacillus paracasei115 ± 68370 ± 2900.04
Lactiplantibacillus plantarum636 ± 4222072 ± 9670.04
Ligilactobacillus ruminis1109 ± 7755224 ± 16280.02
Latilactobacillus sakei166 ± 105509 ± 2860.04
Ligilactobacillus salivarius1721 ± 11437684 ± 28200.02
Table 5. Abundance of pathogenic bacteria between the beginning (t = 0 days) and end (t = 14 days) of the study in rats with lees supplementation. Values are mean ± standard deviation.
FamilyInitial (t = 0 Days)End (t = 14 Days)p-Value
Enterobacteriaceae1249 ± 472736 ± 3520.07
Clostridiaceae47,330 ± 14,33937,557 ± 22,3130.47
Campylobacteraceae707 ± 555366 ± 1700.31
Listeriaceae561 ± 144360 ± 1640.04
Staphylococcaceae423 ± 134260 ± 960.03
Vibrionaceae354 ± 62219 ± 1180.03
Publisher’s Note: MDPI stays neutral with regard to jurisdictional claims in published maps and institutional affiliations.

