Article

Effect of Fermentation Strategy on the Quality and Aroma Characteristics of Yellow Peach Wines

1
Shandong Academy of Grape, Shandong Academy of Agricultural Sciences, Jinan 250100, China
2
College of Food Science and Engineering, Shandong Agriculture and Engineering University, Jinan 250100, China
3
Penglai Vine and Wine Service Center, 206 Zhonglou East Road, Penglai District, Yantai 265600, China
*
Author to whom correspondence should be addressed.
Fermentation 2022, 8(11), 604; https://doi.org/10.3390/fermentation8110604
Submission received: 19 October 2022 / Revised: 3 November 2022 / Accepted: 3 November 2022 / Published: 4 November 2022
(This article belongs to the Special Issue Brewing & Distilling 3.0)

Abstract

:
To obtain high-quality yellow peach wines of varying characteristics, different fermentation strategies, including various pre-fermentative treatments, were applied. This study aimed to determine the effect of different fermentation strategies on the physicochemical properties, monomer phenol content, in vitro antioxidant activity, and volatile compounds of yellow peach wine. The results showed that peach wine P12, fermented with pulp, had higher total phenolic content (TPC), total flavonoid content (TFC), monomer phenol and volatile compound content, and antioxidant activity. Ten monomeric phenols were detected in peach wines, and the content of catechin was the highest. Juice fermentation wine, J12, had a strong floral aroma, and some volatile compounds were released during fermentation when water was added to the pulp, and low alcohol content did not reduce the variety of volatile compounds. The main aroma and common characteristics of the fermented yellow peach wine were dominated by esters, with a relative odor activity value (ROAV) ≥ 1, namely, isoamyl acetate, ethyl hexanoate, and ethyl octanoate. Our results demonstrated that the application of the described fermentation strategies significantly affected the quality and volatile compound content of yellow peach wines. This might assist in the development of a highly diverse yellow peach wine flavor.

1. Introduction

Peach (Prunus persica (L.) Batsch), belonging to family Rosaceae, is a climacteric stone fruit that originated in China and is one of the most important fruits in the Chinese economy [1]. Yellow peach, with high nutrition and pleasant flavor, derives its name from its yellow flesh, and is a good source of dietary fiber, vitamin C, carbohydrates, minerals, and dietary antioxidants [2]. Because of the rapid loss of firmness during ripening, yellow peach deteriorates extremely easily and browns after harvesting, which drastically restricts its shelf life and considerably hinders the development of the yellow peach industry. Therefore, deep yellow peach processing was urgently required, which has led to the processing of yellow peach into canned fruit, juice, preserved fruit, fruit wine, and other products. Among the various peach processing products, yellow peach wine products not only retain the nutrients to the maximum extent, but also meet the diverse needs of the fruit wine market. Yellow peach wine usually has a pleasant and smooth taste with a strong and immediately recognizable aroma [3]. However, studies on yellow peach wine production are still scarce.
The quality of fruit wine is affected by many factors, such as the variety of the raw materials, fruit maturity, and fermentation technology. Some researchers have focused on the effect of varieties, maturity, and different strains on the quality of yellow peach wine [4,5,6]. Most of these studies used peach juice or concentrated juice as the main raw material for fermentation with high alcohol, while studies on the functional components of yellow peach wines derived from pulp fermentation or low-alcohol peach wine are rare. In fruit wine production, different fermentation strategies significantly influence the chemical composition of juice, which can affect the active components, antioxidant activity, and aroma of the final fruit wine [7,8]. According to modern oenological practice, completely different white wine properties were obtained when white grapes were immediately fermented of the grape juice after the harvest and macerated and fermented in direct contact with the mash [9,10]. In apple fruit wine production, maceration of the mash along with mash fermentation were used. Mash fermentation induces spontaneous malolactic fermentation and yields an apple wine product with new and interesting sensory properties [7]. Because of social and health concerns, low-alcohol fruit wines with an alcohol content of 1-7% (v/v) are now more popular, and research on low-alcohol or non-alcoholic yellow peach wine is important [11]. Studies have shown that consumption of excessive ethanol may increase the risk of health problems [12], and that wines with high alcohol content are generally considered to be unbalanced, with low fruitiness, masked main aroma, and poor quality [13].
Owing to the growing needs of consumers, diverse fruit wines with different tastes, flavors, alcohol content, and nutritive value are attracting increased attention [14]. However, comprehensive studies regarding the influence of different fermentation processes on changes in active components, antioxidant activity, and aroma profile of yellow peach wine are scarce. This study compared the quality of yellow peach wines produced using different fermentation strategies from four aspects: physicochemical properties, monomeric phenol content, antioxidant activity, and volatile compound content. The observations will provide a theoretical basis for the production of yellow peach wines of different qualities and facilitate the improvement of yellow peach wine quality.

2. Materials and Methods

2.1. Materials and Reagents

Saccharomyces cerevisiae (LALVIN EC-1118) and pectinase Lafazym extract were purchased from Lallemand Inc., Montreal, QC, Canada; 500 g).
ABTS+•(2,2′-azinobis 3-ethylbenzothiazoline-6-sulfonic acid), DPPH+•(2,2-diphenyl-1-picrylhydrazyl), TPTZ (2,4,6-Tris (2-pyridyl-S-triazine), Trolox (5,7,8-tetramethylchroman-2-carboxylic acid), Folin–Ciocalteu reagent, monomer phenol standards, and HPLC-grade methanol were purchased from Sigma-Aldrich (St. Louis, MO, USA). 2-Octanol was purchased from Sigma (Shanghai, China).

2.2. Sample Preparation

The test variety was non-commercial yellow peach (Sweet gold) with a slightly poor appearance but good quality, which was provided by Shandong Jinkui Agricultural Science and Technology Co., Ltd. (Jinan, Shandong, China) in May 2021. Yellow peach fruit without mechanical injuries and pests was selected for the experiments. Previously, the peaches were cleaned with tap water and disrupted using a juicer. Then, the mixtures were poured into fermentation tanks to up to 2/3rd of their volume loading capacity of 5 L and were supplemented with high-grade sucrose according to the required alcohol level, 60 mg/L potassium metabisulfite (K2S2O5), 0.3 g/L pectinase, and 0.2 g/L yeast. Tartaric acid was added to adjust the pH to 3.30. Finally, the fermentation was performed at 25 °C until a constant alcohol content was reached, depending on the fermentation strategy used. During fermentation, it should be stirred twice a day for the first three days and then once in the next few days. The different fermentation strategies were as follows: Process 1: Peach juice + yeast EC1118 was fermented to dry wine, and alcohol content was 12% v/v (J12); Process 2: Peach pulp + yeast EC1118 was fermented to dry wine, and alcohol content was 12% v/v (P12); Process 3: Peach pulp (30% water) + yeast EC1118 was fermented to dry wine and alcohol 12% v/v (PW12); Process 4: Peach pulp (30% water) + yeast EC1118 was fermented to obtain alcohol content of 5% v/v and residual sugar content of 40 g/L (PW5); PW5, sweet and low-alcohol peach wine, was obtained using termination alcohol fermentation.
When the fermentations were complete, all the samples were pressed manually with cheesecloth. To maintain 40 g/L residual sugar, 100 ppm sodium bisulfite was added to the sample (PW5) to stop alcohol fermentation, and was then stored at 0 °C for 2 months. The other three wine samples were placed in a cold room at 4 °C to settle for 2 months. The wines were then centrifuged at 8000× g for 5 min and were stored at −20 °C for 3 days before analysis.

2.3. Physicochemical Analysis

Reducing sugar, pH, total acid, total volatile acidity, alcohol content, dry extract, total sulfur dioxide, and free sulfur dioxide were investigated using the method based on China National Food Standard GB/T 15038-2006.
Total phenolic content (TPC) was determined using the Folin–Ciocalteu colorimetric method [15]. A calibration curve was established using the gallic acid standard solution, and the TPC in the wines was expressed as gallic acid equivalent (GAE) per liter of a sample (mg/L). The total flavonoid content (TFC) was measured using an aluminum chloride colorimetric assay [16]. A calibration curve was established using a catechinic acid standard solution, and the TFC in the wines was expressed as catechinic acid equivalent (CAE) per liter of a sample (mg/L).

2.4. Monomer Phenol Content

The extraction of phenolic compounds was based on a published method [17]. Ten milliliter sample was extracted thrice with 10 mL ethyl acetate after the pH was adjusted to 2.0 and 7.0 with 1 mol/L HCl and 1 mol/L NaOH, respectively, following which the mixture was evaporated to dryness in a vacuum rotary evaporator at 40 °C and redissolved in 2 mL methanol.
The Agilent ZORBAX SB-C18 column (4.6 × 250 mm, 5 μm, Agilent Technologies Inc., Palo Alto, CA, USA) was connected to the UV absorption detector, and the wavelength was set to 280 and 320 nm. The mobile phase was 2% acetic acid solution and methanol (50:50, v/v). The injection volume was 10 μL, and the flow rate was 0.8 mL/min at 30 °C. Qualitative and quantitative determination was based on retention time and standard curves.

2.5. Antioxidant Activity

2.5.1. DPPH Radical Scavenging System

Radical scavenging activity against DPPH+• was determined based on the method described by Espín et al. [18] with slight modifications. Properly diluted wine solution (0.5 mL) was mixed with 3.5 mL DPPH+• reagent (100 µM) and incubated for 2 h. Absorbance was measured at 517 nm. The results were expressed as millimolar of Trolox equivalents on the relevant calibration curve.

2.5.2. ABTS Radical Scavenging System

Radical scavenging activity against ABTS+• was determined based on the method described by Marfil et al. [19] with slight modifications. Properly diluted wine solution (0.2 mL) was mixed with 6 mL ABTS reagent and incubated for 30 min. The results were expressed as millimolar of Trolox equivalents on the relevant calibration curve.

2.5.3. Ferric Ion Reducing Antioxidant Power (FRAP) Method

The method described by Szydłowska-Czerniak et al. [20] with slight modifications was used. In total, 2.9 mL of the reactive mixture was incubated with 50 µL of the sample. Properly diluted wine solution (0.2 mL) was mixed with 4.0 mL TPTZ working solution consisting of 25 mL of 0.1 mol/L acetate buffer, 2.5 mL of 10 mmol/L TPTZ solution, 2.5 mL of 20 mmol/L FeCl3 solution reagent and incubated for 10 min at 37 °C. Absorbance was measured at 593 nm. The results were expressed as millimolar of Trolox equivalents on the relevant calibration curve.

2.6. Analysis of Volatile Compounds

2.6.1. Identification and Quantification of Volatile Compounds

The volatile compounds in the peach wine were analyzed using headspace solid phase microextraction (HS-SPME) and gas chromatography-mass spectrometry (GC-MS) in a QP2010 Ultra GC-MS system (Shimadzu Technologies Inc., Kyoto, Honshu, Japan). Some modifications were made according to Xi et al. [21] and Fan et al. [22]. Five milliliters of wine peach samples were placed in a 15 mL SPME sample vial with 1.0 g NaCl and 2 μL internal standard solution of 2-octanol (0.996 mg/L). Then, the samples were agitated and equilibrated at 40 °C for 30 min to extract the volatiles in the autosampler (Shimadzu AOC-6000, Shimadzu Technologies Inc., Kyoto, Honshu, Japan).
The GC-MS conditions were as follows: SH-PolarWax-MS column (30 m × 0.25 mm × 0.25 μm, Shimadzu Technologies Inc., Kyoto, Honshu, Japan) was prepared for the separation. The column temperature was set at 40 °C for 2 min, then raised to 130 °C at the rate of 5 °C/min, followed by an increase to 170 °C at 3 °C/min, then increased to 200 °C at the rate of 10 °C/min. The carrier gas flow rate was 1.0 mL/min. The electron ionization was operated at 70 eV with ion source temperature at 250 °C. The ion mass scanning ranged from 30 to 500 m/z.
The volatile compounds were identified after comparison with the mass spectra library (NIST) and quantified using 2-octanol as the internal standard with three biological replicates.

2.6.2. Evaluation of Key Volatile Substances

Odor activity values (OAVs) were used to identify volatile compounds that differed significantly among different treatments [23]. They were calculated using the equation OAV = c/t, where c is the concentration of each compound in the sample, and t is its odor threshold value.
The relative odor activity value (ROAV) has been proposed to evaluate the contribution of individual volatile compounds to the overall aroma [24,25,26]. The ROAVs that ranged from 0 to 100 were used to identify key volatile compounds. It was calculated according to the formula:
ROAV i = 100 × OAV i OAV max
where OAVmax is the maximum OAVi of all the compounds, and OAVi is the OAV of a specific volatile compound. Volatile compounds with ROAV ≥ 1 were generally the key flavor compounds, whereas those with 0.1 ≤ ROAV < 1 were considered not so important for the overall flavor of the sample.

2.7. Statistical Analysis

Statistical analyses were performed using SPSS 19.0 (SPSS Inc., Chicago, IL, USA) to evaluate physicochemical parameters and volatile compounds in this study. The results of the one-way analysis of variance (ANOVA) test were considered statistically significant if p < 0.05. Principal component analysis (PCA) was performed using the ggplot package in the R language software (in version 3.3.3, https://www.r-project.org/, URL (accessed on 23 May 2022). Experiments were performed in triplicate.

3. Results and Discussion

3.1. Physicochemical Properties

The physicochemical properties of the different peach wine samples are shown in Table 1. The total acid content in the fermented peach wine juice of J12 and the pulp fermentation of P12 did not differ significantly. The total acid concentration in peach wine P12 was slightly lower than that in J12. This might have occurred due to the degradation of acids via the Krebs cycle upon pulp fermentation [7]. A significant difference in the dry extract content was observed between the four wine samples (p < 0.05), and it was highest in product P12 (26.58 g/L) and lowest in J12, with a concentration of 19.80 g/L. The dry extract content was reduced for the pulp fermentation in which 30% water was added to PW12 and PW5. Peach wine PW5 was considered a low-alcohol wine, the alcohol content of which varied between 1 and 7% (v/v), while the alcohol content of the other three wines was high. The mass concentration of reducing sugar in peach wine PW5 was 39.78 g/L, which is a semi-sweet fruit wine, while the reducing sugar content of other wine samples that belong to the dry fruit wine category according to China National Food Standard GB/T15037-2006 were all less than 4 g/L.
As shown in Table 1, compared to other wine samples, peach wine PW5 had the highest total and free sulfur dioxide content (112.58 mg/L and 32.35 mg/L, respectively), because more potassium metabisulphite (K2S2O5) was added to stop fermentation. The total sulfur dioxide content in all four wine samples was less than the 250 mg/L limited requirements of China National Food GB/T15037-2006.
The highest value of volatile acids was observed in product P12, followed by that in products PW12 and PW5, and the lowest was observed in J12. Within the concentration range of 0.2–0.7 g/L, volatile acids may contribute to the flavor complexity of wine via interaction with other flavor compounds [24]. The volatile acidity levels detected in wine samples were all within this limit.

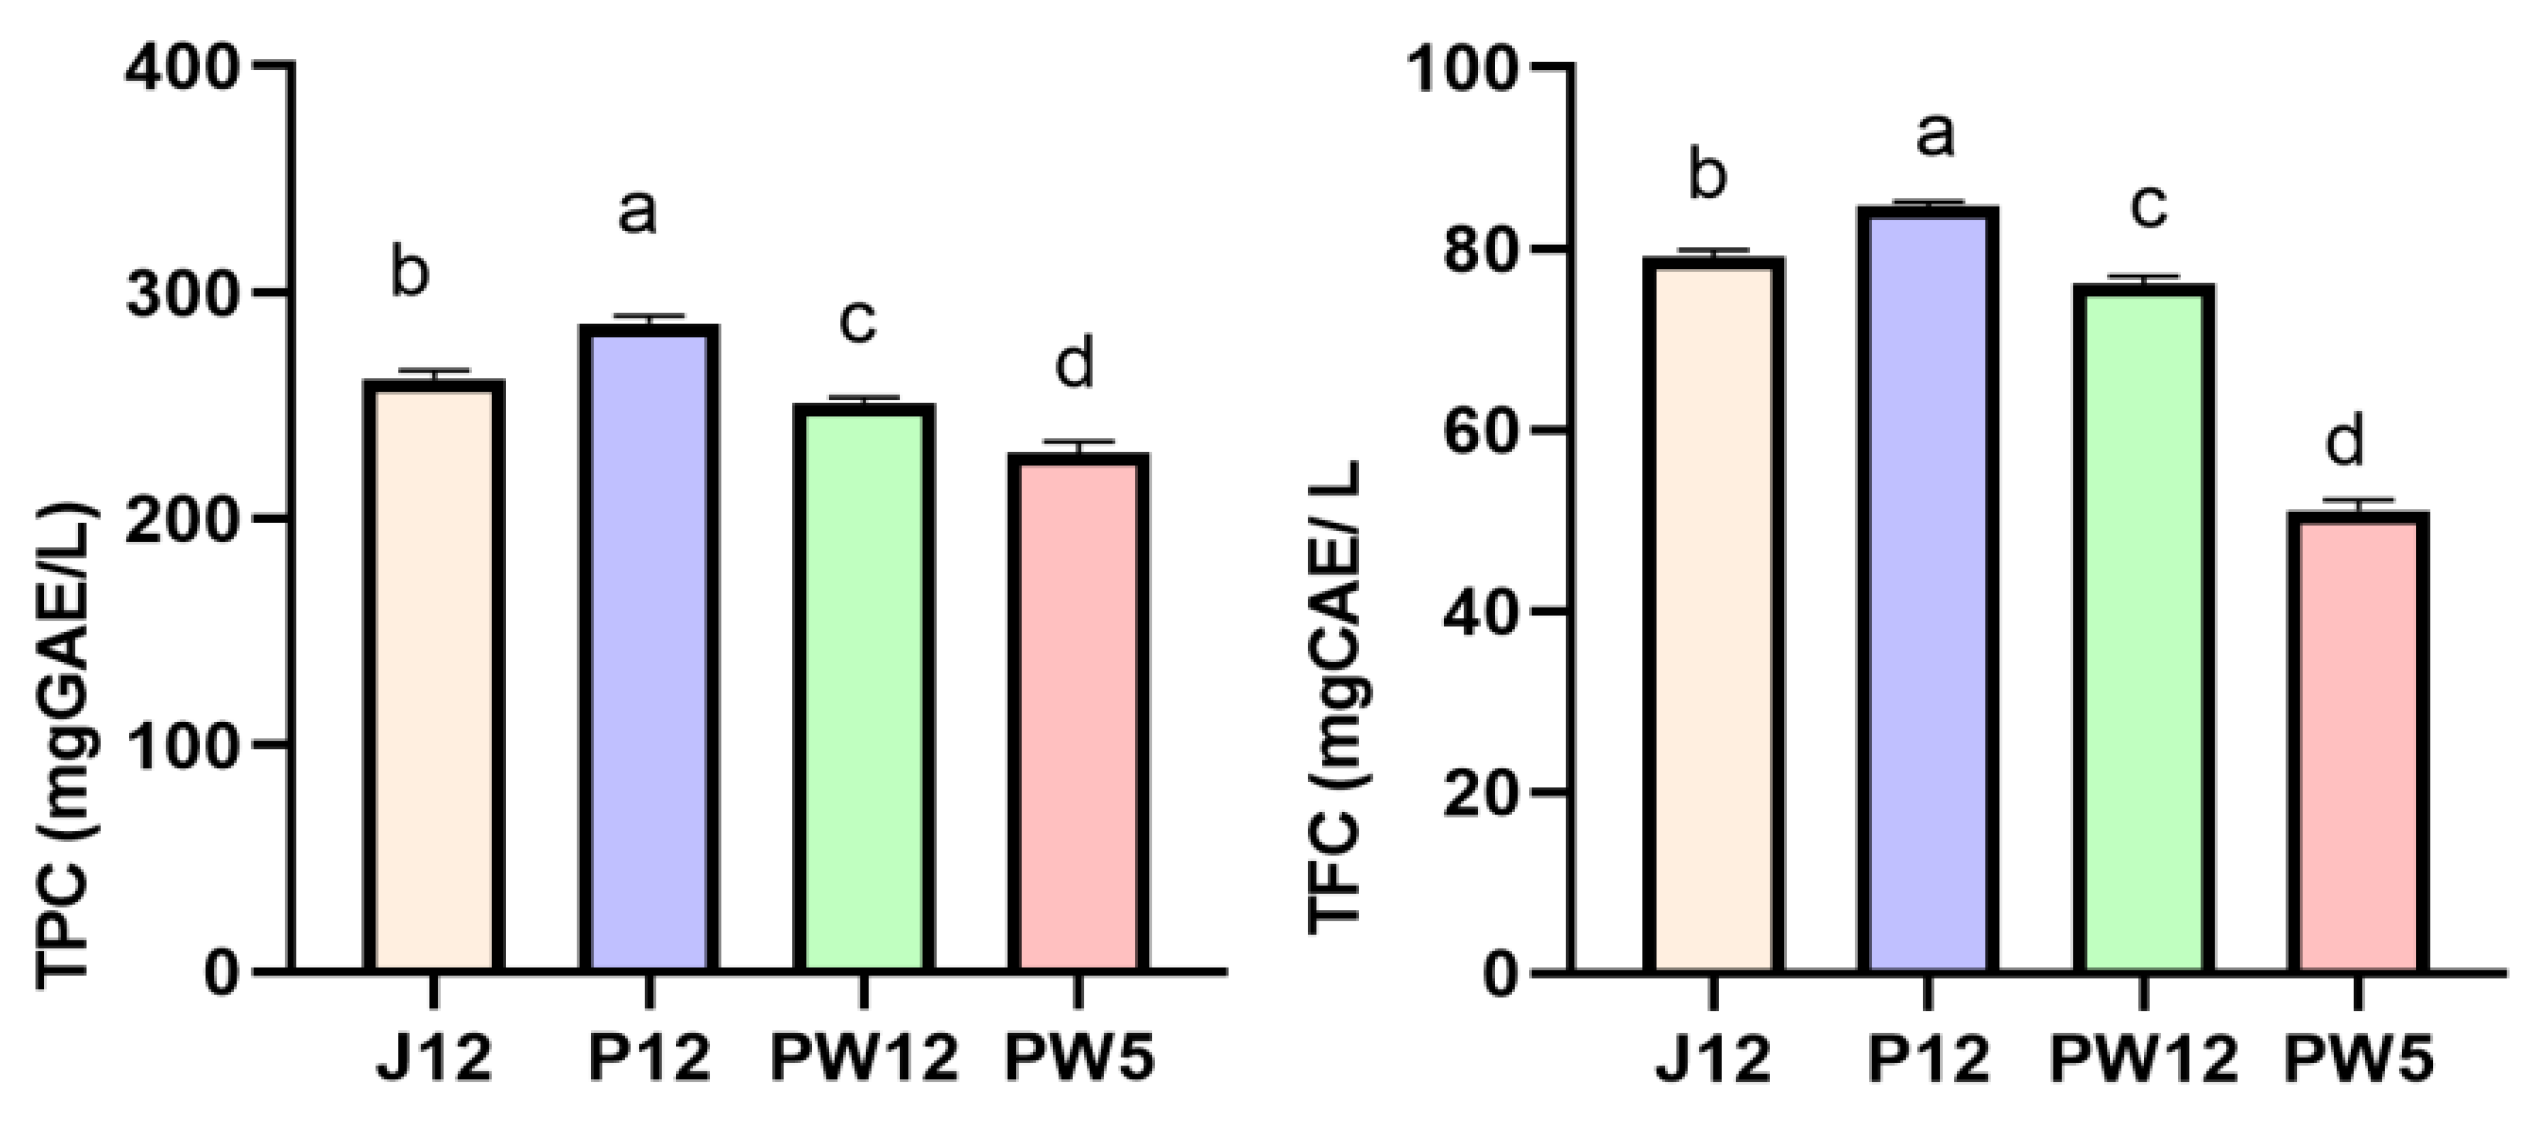
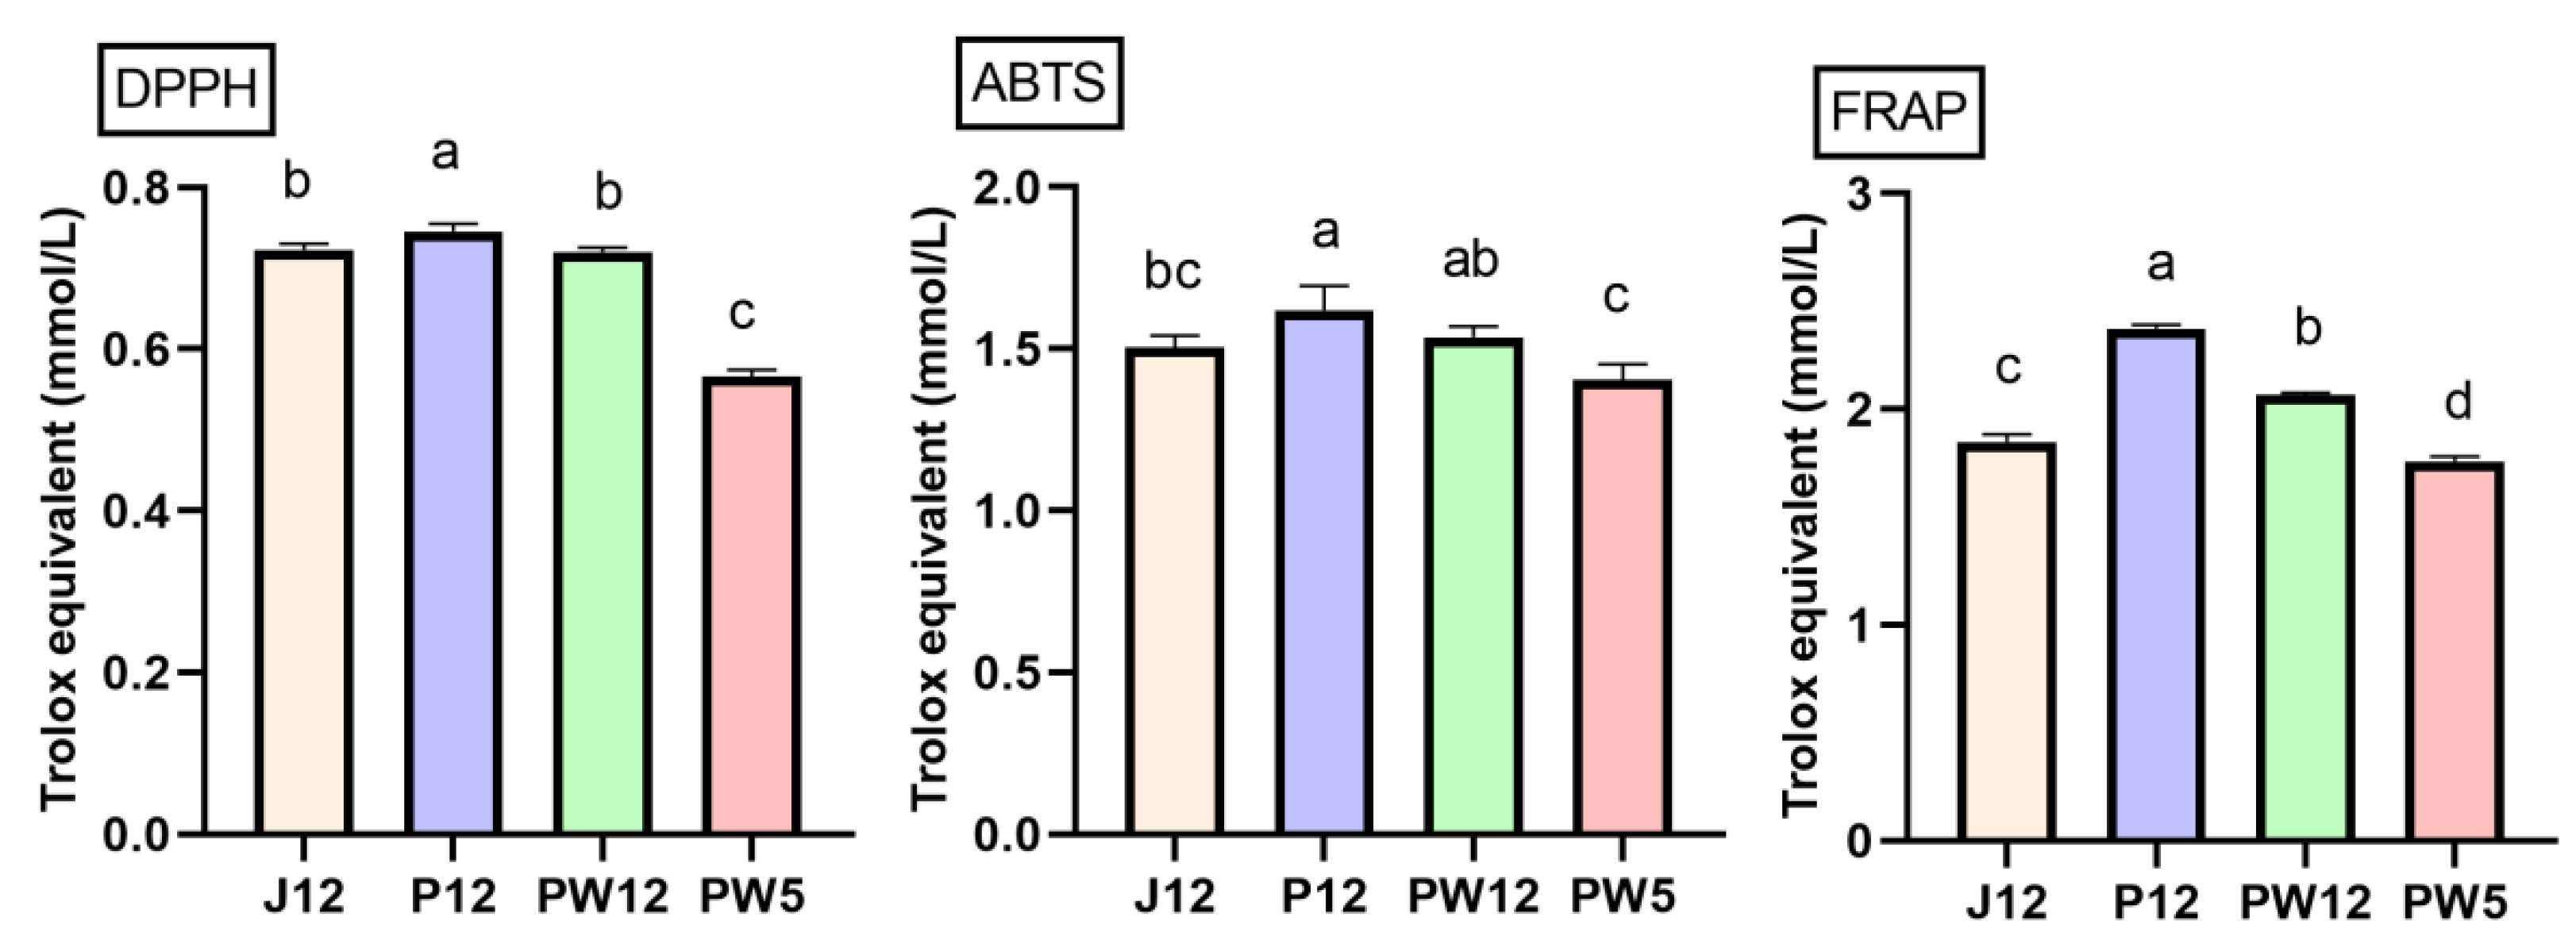
3.2. TPC, TFC, and Antioxidant Activity

Significant differences in TPC and TFC were observed between the four wine samples (p < 0.05) (Figure 1). Both TPC and TFC increased for the pulp fermentation peach wine P12, with the highest values of 286.33 mg GAE/L and 84.67 mg CAE/L, respectively. The lowest values were observed in PW5 (229.13 mg GAE/L and 51.09 mg CAE/L, respectively). The TPC of yellow peach wines has been reported to range from 180 mg GAE/L to 320 mg GAE/L, and TFC from 59 mg CAE/L to 72 mg CAE/L [4]. These levels are comparable to those for yellow peach wines in our study.
The antioxidant activity of different peach wine samples is shown in Figure 2. As one method is usually insufficient to reflect all the antioxidant activities of complex substances, three different methods, including DPPH+•, ABTS+•, and FRAP assays, were used to study the antioxidant properties of the wines. Significant differences between DPPH+• and ABTS+• activities were observed in peach wines J12 and P12, and similar trends were observed in PW12 and PW5. The highest antioxidant activity was observed in P12 and the lowest in PW5. The results showed that TPC and TFC correlated with the antioxidant activity, despite slight differences in the results obtained using FRAP. Some studies have confirmed a strong positive correlation between the total antioxidant activity in fruit wines and TPC [27,28]. In contrast, some researchers showed that TPC did not correlate with antioxidant activity [29,30].

3.3. Monomer Phenols

As phenolic compounds affect the wine quality (color and flavor) and volatile compounds via intermolecular interactions, they are usually used in evaluating wine quality and authenticity [31]. Table 2 shows that 10 monomer phenols (catechin, gallic acid, chlorogenic acid, caffeic acid, catechin gallate, ferulic acid, rutin, myricetin, morin, and quercitrin) were detected in peach wines, while 6 compounds (cumaric acid, epicatechin gallate, epicatechin, syringic acid, benzoic acid, and salicylic acid) were not detected. The total monomeric phenol content varied significantly between peach wines P12 and J12, as well as between PW12 and PW5 (p < 0.05). Compared to that in pulp control wine P12, the total monomeric phenol content was not significantly reduced in PW12, which was fermented after adding 30% water to the pulp. This indicated that the addition of water to fruit pulp may promote the dissolution of polyphenols. The highest concentration of total monomeric phenol was detected in P12 (8.59 mg/L), and the lowest value was observed in J12 (7.98 mg/L). Chlorogenic acid was not detected in J12.
Catechins and catechin gallate were the most abundant flavan-3-ols in yellow peach wine. Catechin content was the highest among the 10 monomer phenols, and ranged from 3.08 to 3.45 mg/L. Flavan-3-ols have antioxidant activity and influence the activity of antioxidant enzymes in fruit wines [32]. Chlorogenic acid, caffeic acid, and ferulic acid were the major hydroxycinnamic acids, and morin, myricetin, and rutin were the major flavonols of yellow peach wine. Reports have shown that catechin, chlorogenic acid, neochlorogenic acid, epicatechin, and cyanidin are the major phenolic compounds in honey peaches [5], while quercetin and rutin are the major flavonols [33].

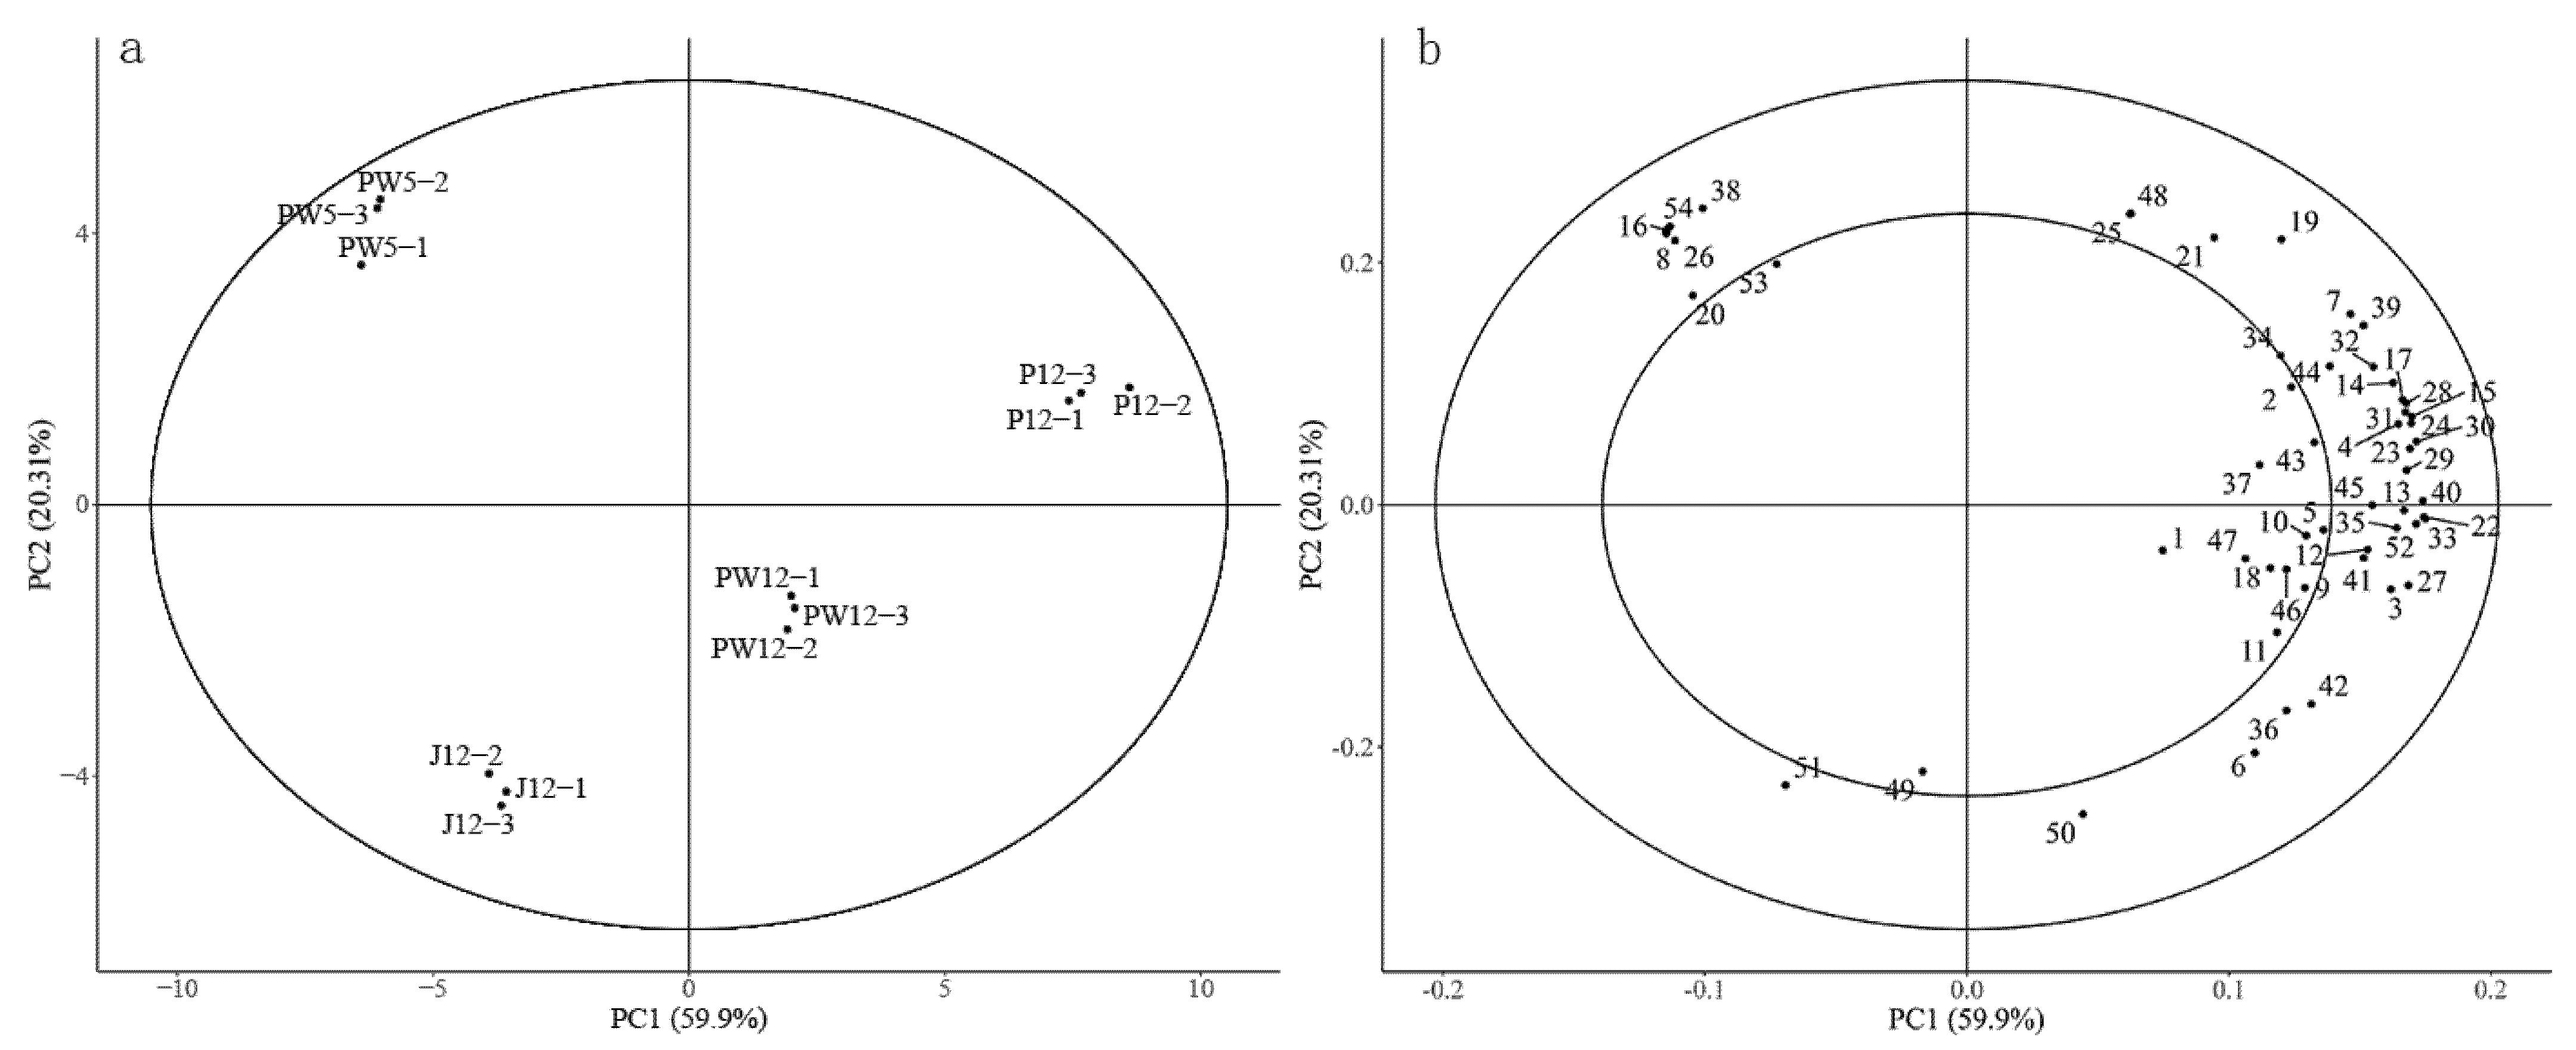
3.4. Analysis of Volatile Compounds

In total, 54 major volatile compounds were identified in peach wines (Table 3). They were divided into 5 groups that included 32 esters, 11 alcohols, 2 aldehydes, 4 terpenes and lactones, and 5 acids. There were 45, 50, 51, and 52 varieties of volatile compounds in these four wine samples, with the total amount of volatile compounds being 5384.05, 12180.80, 8809.51, and 4254.13 μg/L respectively. Because of alcohol extraction and the fatty acid decomposition, the amounts of total volatile compounds in PW5 were less than those in the other samples. The variety of volatile compounds in J12 was less than that in P12, but it did not decrease in PW12 and PW5. As for yellow peach wine, this suggests that some of the volatile compounds could be released during fermentation of pulp with the addition of water, imparting a complex fruity aroma to yellow peach wine, and the reduction of alcohol content did not reduce the variety of volatile compounds.
Esters with a floral and fruity aroma were the main volatile compounds in yellow peach wine. Significant differences were observed in the total content of esters between the different samples. The highest ester content was found in P12 (9642.45 μg/L), and the lowest value was observed in PW5 (2803.93 μg/L). Ethyl octanoate, ethyl decanoate, ethyl hexanoate, isoamyl acetate, and ethyl laurate were the most abundant esters. These substances were also the characteristic aroma components in honey peach wines [5]. In general, yellow peach wine showed the largest variety and highest concentrations of ethanol ester, while Merlot wines showed higher concentrations of acetate esters than other ester types [34]. Ethanol esters, also known as fatty acid ethyl esters, are secondary metabolites of yeast. A study has shown that the increase in fatty acid ethyl ester content can enhance the fruit flavor of wine [35]. Compared to that in P12, cis-2-hexenyl acetate, ethyl 7-octenoate, octyl formate, and methyl decanoate were not detected in J12, and ethyl 4-hexenoate and ethyl 2, 4-hexadienoate were only detected in PW12 and PW5. Alcohols are the second largest aroma substances of peach wine, mainly formed due to yeast metabolism and hydrolysis of glycosides and esters [36]. The concentration of higher alcohols differed significantly in wines produced using four strategies, with the highest value in P12 (2280.17 μg/L) and the lowest value in PW5 (1238.70 μg/L). Among all the alcohols, isoamyl alcohol, isobutyl alcohol, and 1-butanol were present in relatively high concentrations. Terpenes and lactones such as linalool, citronellol, α-terpineol, and gamma-decalactone were detected in peach wine samples. α-Terpineol was only detected in J12. Linalool and gamma-decalactone are the key odorants in yellow-fleshed peach at harvest [36,37]. The total concentrations of terpenes and lactones in J12 were slightly higher than that in P12, with the values 34.13 μg/L and 32.85 μg/L, respectively, and the lowest value was observed in PW5 (21.45 μg/L). Volatile compounds of terpenes and lactones are mainly responsible for the floral aromas in wines [36]. The results suggested that juice fermentation wine had a strong floral aroma. Two aldehydes (decanal and benzaldehyde) and five acids (butanoic acid, hexanoic acid, octanoic acid, decanoic acid, and benzoic acid) were found in four peach wines. The concentration of benzaldehyde was significantly higher in PW5, which had a strong cherry sweet and bitter almond flavor [5]. The most abundant acids were octanoic acid and hexanoic acid, which produce cheese and fruit flavor at low concentrations, while they have harsh rancid odors at high concentrations [5]. The concentration of acids in P12 and PW12 was the highest, with the values 315.88 μg/L and 225.28 μg/L, respectively. This demonstrates that pulp fermentation or fermentation using pulp with added water may increase the release of free fatty acids from the pulp or promote fatty acid biosynthesis by the yeast [7].
PCA of the 54 volatile compounds mentioned in Table 3 indicated that 80.21% of the total variance was explained by the first two principal components. PC1 and PC2 represented 59.9% and 20.31% of the variance, respectively (Figure 3). There were marked differences between fermentation processes. and the four wines could be better distinguished by the first two principal components. The PCA results, as shown in Figure 3b, showed an association between the total volatile compounds. Most of the 54 volatile compounds showed positive values on PC1, displaying the relation of the fermentation process with pulp. Some volatile compounds, such as isooctyl alcohol (16), ethyl 4-hexenoate (8), benzaldehyde (54), and ethyl 7-octenoate (26), found in the positive extremes of PC2, were associated with peach wine PW5. The volatiles, linalool, and α-terpineol, belonging to terpenes, were associated with peach wine J12, and were associated with a pleasant floral aroma.

3.5. Comparison of Key Volatile Compounds

Table 4 lists the odor threshold in the 11% ethanol solution and the ROAV of the investigated wines. The higher the ROAV value, the higher the contribution to the aroma characteristics in yellow peach wine. The high content of ethyl octanoate and sensory threshold of 5 μg/L indicated maximum attribution to the overall flavor. ROAVmax of ethyl octanoate in yellow peach wine was set to 100. Ethyl octanoate (ROAV = 100) showed the maximum contribution; it predominantly contributes to fruity odor with pineapple, pear note, and floral aroma [38].
Nine main flavor compounds with ROAV > 0.1 were identified in yellow peach wines, including isoamyl acetate, ethyl hexanoate, ethyl octanoate, ethyl decanoate, ethyl benzoate, methyl decanoate, isopentyl octanoate, hexanoic acid, and linalool, among which methyl decanoate was not detected in peach wine J12. With ROAV ≥ 1, three compounds, namely, ethyl octanoate, ethyl hexanoate, and isoamyl acetate, were the key volatile compounds of peach wines J12 and PW5. Four compounds, namely, ethyl octanoate, ethyl hexanoate, isoamyl acetate, and ethyl decanoate, were the key volatile compounds of peach wines P12 and PW12. Isoamyl acetate, ethyl hexanoate, and ethyl octanoate characterize the common characteristics of yellow peach wines. With ROAV between 0.1 and 1, ethyl decanoate, ethyl benzoate, isopentyl octanoate, hexanoic acid, and linalool exerted an important modifying effect on the overall flavor, modifying the wine. Studies have shown that ethyl hexanoate and linalool were the main aroma components of yellow peach fruit [37], and that isoamyl acetate, ethyl hexanoate, ethyl octanoate, ethyl decanoate, and linalool were the major contributing aroma substances of yellow peach fruit wine [39]. The ROAV of six higher alcohols was less than 0.01. This indicated that the contribution of higher alcohols to the actual aroma is actually small.

4. Conclusions

In this study, we investigated the quality and aroma characteristics of yellow peach wines produced using four fermentation strategies. The results indicated that the pulp fermentation wine has the highest content of total phenolics, total flavonoids, monomer phenols, and volatile compounds, and that its vitro antioxidant activity was higher than those of the three other samples. All fermentative processes exhibited desirable production of volatile compounds in fruit wines. For yellow peach wine, water can be added during the brewing process. However, according to traditional wine-making techniques, water is not allowed in the wine-making process. This demonstrated that an uncritical direct transfer of oenological measures into peach wine production might not be useful. The increasing awareness regarding health and the large flavor diversity of fruit wine varieties demands that research on wine with low alcohol content should be promoted. This study can provide a reliable theoretical basis for the production of highly attractive and diverse fruit wines.

Author Contributions

Conceptualization, supervision, H.L. and H.S.; writing-original draft preparation, methodology, H.L.; data curation, investigation, D.G. and Y.G.; software, H.G. and C.W.; resources, Z.Z.; funding acquisition, H.S. All authors have read and agreed to the published version of the manuscript.

Funding

This study was supported by the Natural Science Foundation Support of Shandong Province (ZR2020QC230), Establishment of Producing Mode and Application of Key Technology of Fruit Wine for Rural Tourism (SD2019ZZ025), and Research and Integration of Key Technologies for Improving Typical Quality of Fruit Wine (CXGC2022D03).

Institutional Review Board Statement

Not applicable.

Informed Consent Statement

Not applicable.

Data Availability Statement

Not applicable.

Conflicts of Interest

The authors declare no conflict of interest.

References

  1. Sun, Y.; Li, Y.; Pan, L.; Abbas, A.; Jiang, Y.; Wang, X. Authentication of the geographic origin of Yangshan region peaches based on hyperspectral imaging. Postharvest Biol. Technol. 2020, 171, 111320. [Google Scholar] [CrossRef]
  2. Yang, X.; Chen, J.; Jia, L.; Yu, W.; Wang, D.; Wei, W.; Li, S.; Tian, S.; Wu, D. Rapid and Non-Destructive Detection of Compression Damage of Yellow Peach Using an Electronic Nose and Chemometrics. Sensors 2020, 20, 1866. [Google Scholar] [CrossRef] [PubMed] [Green Version]
  3. Li, M.X.; Liu, C.F.; Wang, R.; Zheng, F.Y.; Wang, J.J.; Niu, C.T.; Li, Q. Optimization of Fermentation Process and Analysis of Aroma Components of Yellow Peach Wine. J. Food Sci. Biotechnol. 2021, 40, 39–49. [Google Scholar]
  4. Zhang, X.Q.; Lv, Z.Z.; Liu, H.; Yang, W.B.; Jiao, Z.G.; Liu, J.C. Characteristics of peach wines made from different cultivars and evaluation on their suitability for wine brewing. J. Fruit Sci. 2021, 38, 1368–1380. [Google Scholar] [CrossRef]
  5. Liu, Q.; Weng, P.; Wu, Z. Quality and aroma characteristics of honey peach wines as influenced by different maturity. Int. J. Food Prop. 2020, 23, 445–458. [Google Scholar] [CrossRef] [Green Version]
  6. Liu, C.; Li, M.; Ren, T.; Wang, J.; Niu, C.; Zheng, F.; Li, Q. Effect of Saccharomyces cerevisiae and non-Saccharomyces strains on alcoholic fermentation behavior and aroma profile of yellow-fleshed peach wine. LWT 2022, 155, 112993. [Google Scholar] [CrossRef]
  7. Ruppert, V.; Innerhofer, G.; Voit, J.; Hiden, P.; Siegmund, B. The Impact of the Fermentation Strategy on the Flavour Formation of Ilzer Rose (Malus domestica Borkh.) Apple Wine. Foods 2021, 10, 2348. [Google Scholar] [CrossRef] [PubMed]
  8. Guo, J.; Yan, Y.; Wang, M.; Wu, Y.; Liu, S.-Q.; Chen, D.; Lu, Y. Effects of enzymatic hydrolysis on the chemical constituents in jujube alcoholic beverage fermented with Torulaspora delbrueckii. LWT 2018, 97, 617–623. [Google Scholar] [CrossRef]
  9. Urdapilleta, I.; Demarchi, S.; Parr, W.V. Influence of culture on social representation of wines produced by various methods: Natural, organic and conventional. Food Qual. Prefer. 2020, 87, 104034. [Google Scholar] [CrossRef]
  10. Sancho-Galán, P.; Amores-Arrocha, A.; Jiménez-Cantizano, A.; Palacios, V. Influence of the Presence of Grape Skins during White Wine Alcoholic Fermentation. Agronomy 2021, 11, 452. [Google Scholar] [CrossRef]
  11. Huang, J.; Wang, Y.; Ren, Y.; Wang, X.; Li, H.; Liu, Z.; Yue, T.; Gao, Z. Effect of inoculation method on the quality and nutritional characteristics of low-alcohol kiwi wine. LWT 2022, 156, 113049. [Google Scholar] [CrossRef]
  12. Wood, A.M.; Kaptoge, S.; Butterworth, A.S.; Willeit, P.; Warnakula, S.; Bolton, T.; Paige, E.; Paul, D.S.; Sweeting, M.; Burgess, S.; et al. Risk thresholds for alcohol consumption: Combined analysis of individual-participant data for 599,912 current drinkers in 83 prospective studies. Lancet 2018, 391, 1513–1523. [Google Scholar] [CrossRef] [Green Version]
  13. Pham, D.-T.; Ristic, R.; Stockdale, V.J.; Jeffery, D.W.; Tuke, J.; Wilkinson, K. Influence of partial dealcoholization on the composition and sensory properties of Cabernet Sauvignon wines. Food Chem. 2020, 325, 126869. [Google Scholar] [CrossRef] [PubMed]
  14. Velic, D.; Velic, N.; Klarić, D.A.; Klaric, I.; Tominac, V.P.; Kosmerl, T.; Vidrih, R. The production of fruit wines—A review. Croat. J. Food Sci. Technol. 2018, 10, 279–290. [Google Scholar] [CrossRef]
  15. Zhou, K.; Yu, L. Total phenolic contents and antioxidant properties of commonly consumed vegetables grown in Colorado. LWT 2006, 39, 1155–1162. [Google Scholar] [CrossRef]
  16. Kim, D.-O.; Jeong, S.W.; Lee, C.Y. Antioxidant capacity of phenolic phytochemicals from various cultivars of plums. Food Chem. 2003, 81, 321–326. [Google Scholar] [CrossRef]
  17. Webber, V.; Dutra, S.V.; Spinelli, F.R.; Marcon, Â.R.; Carnieli, G.J.; Vanderlinde, R. Effect of glutathione addition in sparkling wine. Food Chem. 2014, 159, 391–398. [Google Scholar] [CrossRef]
  18. Espín, J.C.; Soler-Rivas, C.; Wichers, H.J. Characterization of the Total Free Radical Scavenger Capacity of Vegetable Oils and Oil Fractions Using 2,2-Diphenyl-1-picrylhydrazyl Radical. J. Agric. Food Chem. 2000, 48, 648–656. [Google Scholar] [CrossRef]
  19. Marfil, R.; Giménez, R.; Martínez, O.; Bouzas, P.R.; Rufián-Henares, J.A.; Mesías, M.; Cabrera-Vique, C. Determination of polyphenols, tocopherols, and antioxidant capacity in virgin argan oil (Argania spinosa, Skeels). Eur. J. Lipid Sci. Technol. 2011, 113, 886–893. [Google Scholar] [CrossRef]
  20. Szydłowska-Czerniak, A.; Karlovits, G.; Dianoczki, C.; Recseg, K.; Szłyk, E. Comparison of Two Analytical Methods for Assessing Antioxidant Capacity of Rapeseed and Olive Oils. J. Am. Oil Chem. Soc. 2007, 85, 141–149. [Google Scholar] [CrossRef]
  21. Xi, X.; Xin, A.; You, Y.; Huang, W.; Zhan, J. Increased varietal aroma diversity of Marselan wine by mixed fermentation with indigenous non-saccharomyces yeasts. Fermentation 2021, 7, 133. [Google Scholar] [CrossRef]
  22. Fan, X.; Jiao, X.; Liu, J.; Jia, M.; Blanchard, C.; Zhou, Z. Characterizing the volatile compounds of different sorghum cultivars by both GC-MS and HS-GC-IMS. Food Res. Int. 2020, 140, 109975. [Google Scholar] [CrossRef] [PubMed]
  23. Genovese, A.; Lamorte, S.A.; Gambuti, A.; Moio, L. Aroma of Aglianico and Uva di Troia grapes by aromatic series. Food Res. Int. 2013, 53, 15–23. [Google Scholar] [CrossRef]
  24. Liu, S.X.; Laaksonen, O.; Kortesniemi, M.; Kalpio, M.; Yang, B.R. Chemical composition of bilberry wine fermented with non-Saccharomyces yeasts (Torulaspora delbrueckii and Schizosaccharomyces pombe) and Saccharomyces cerevisiae in pure, sequential and mixed fermentations. Food Chem. 2018, 266, 262–274. [Google Scholar] [CrossRef] [PubMed]
  25. Wei, J.; Wang, S.; Zhang, Y.; Yuan, Y.; Yue, T. Characterization and screening of non-Saccharomyces yeasts used to produce fragrant cider. LWT 2019, 107, 191–198. [Google Scholar] [CrossRef]
  26. Zhu, Y.; Chen, J.; Chen, X.; Chen, D.; Deng, S. Use of relative odor activity value (ROAV) to link aroma profiles to volatile compounds: Application to fresh and dried eel (Muraenesox cinereus). Int. J. Food Prop. 2020, 23, 2257–2270. [Google Scholar] [CrossRef]
  27. Arozarena, I.; Ortiz, J.; Hermosín-Gutiérrez, I.; Urretavizcaya, I.; Salvatierra, S.; Córdova, I.; Marín-Arroyo, M.R.; Noriega, M.J.; Navarro, M. Color, Ellagitannins, Anthocyanins, and Antioxidant Activity of Andean Blackberry (Rubus glaucus Benth.) Wines. J. Agric. Food Chem. 2012, 60, 7463–7473. [Google Scholar] [CrossRef]
  28. Rupasinghe, H.V.; Clegg, S. Total antioxidant capacity, total phenolic content, mineral elements, and histamine concentrations in wines of different fruit sources. J. Food Compos. Anal. 2007, 20, 133–137. [Google Scholar] [CrossRef]
  29. Heinonen, I.M.; Lehtonen, P.J.; Hopia, A.I. Antioxidant Activity of Berry and Fruit Wines and Liquors. J. Agric. Food Chem. 1998, 46, 25–31. [Google Scholar] [CrossRef]
  30. Ljevar, A.; Ćurko, N.; Tomašević, M.; Radošević, K.; Gaurina Srček, V.; Kovačević Ganić, K. Phenolic composition, antioxidant capacity and in vitro cytotoxicity assessment of fruit wines. Food Technol. Biotechnol. 2016, 54, 145–155. [Google Scholar] [CrossRef]
  31. Merkytė, V.; Longo, E.; Windisch, G.; Boselli, E. Phenolic Compounds as Markers of Wine Quality and Authenticity. Foods 2020, 9, 1785. [Google Scholar] [CrossRef] [PubMed]
  32. Cakar, U.; Grozdanic, N.; Petrovic, A.; Pejin, B.; Nastasijevic, B.; Markovic, B.; Dordevic, B. Fruit Wines Inhibitory Activity Against α-Glucosidase. Curr. Pharm. Biotechnol. 2018, 18, 1264–1272. [Google Scholar] [CrossRef] [PubMed]
  33. Kumar, A.; Lakshman, K.; Jayaveera, K.N.; Tripathi, S.M.; Satish, K.V. Estimation of gallic acid, rutin and quercetin in Ter-minalia chebula by HPTLC. Jordan. J. Pharm. Sci. 2010, 3, 63–68. [Google Scholar]
  34. Massera, A.; Assof, M.; Sari, S.; Ciklic, I.; Mercado, L.; Jofré, V.; Combina, M. Effect of low temperature fermentation on the yeast-derived volatile aroma composition and sensory profile in Merlot wines. LWT 2021, 142, 111069. [Google Scholar] [CrossRef]
  35. Hu, K.; Jin, G.-J.; Mei, W.-C.; Li, T.; Tao, Y.-S. Increase of medium-chain fatty acid ethyl ester content in mixed H. uvarum/S. cerevisiae fermentation leads to wine fruity aroma enhancement. Food Chem. 2018, 239, 495–501. [Google Scholar] [CrossRef]
  36. González-Rompinelli, E.M.; Rodríguez-Bencomo, J.J.; García-Ruiz, A.; Sánchez-Patán, F.; Martín-Álvarez, P.J.; Bartolomé, B.; Moreno-Arribas, M.V. A winery-scale trial of the use of antimicrobial plant phenolic extracts as preservatives during wine ageing in barrels. Food Control 2013, 33, 440–447. [Google Scholar] [CrossRef]
  37. Zhang, B.; Shen, J.-Y.; Wei, W.-W.; Xi, W.-P.; Xu, C.-J.; Ferguson, I.; Chen, K. Expression of Genes Associated with Aroma Formation Derived from the Fatty Acid Pathway during Peach Fruit Ripening. J. Agric. Food Chem. 2010, 58, 6157–6165. [Google Scholar] [CrossRef]
  38. Shi, F.; Zhang, Q.; Chen, J.; Karimi, H.R. Macroscopic Expressions of Molecular Adiabatic Compressibility of Methyl and Ethyl Caprate under High Pressure and High Temperature. Abstr. Appl. Anal. 2014, 2014, 512576. [Google Scholar] [CrossRef]
  39. Yu, H.Y.; Qian, X.H.; Chen, C.; Tian, H.X. Changes of flavor compounds of yellow peach wine during the fermentation process. Sci. Technol. Food Ind. 2018, 39, 87–93. [Google Scholar] [CrossRef]
Figure 1. Total phenolic and total flavonoid contents of the investigated wines. Values are the averages of three replicates, and different alphabets indicate significant differences (p < 0.05) according to Duncan test.
Fermentation 08 00604 g001
Figure 2. Antioxidant activity of the investigated wines. Values are the averages of three replicates and different alphabets indicate significant differences (p < 0.05) according to Duncan test.
Fermentation 08 00604 g002
Figure 3. Principal component analysis of free volatile compounds in the investigated wines. PCA scores (a) and correlation loading (b) plots.
Fermentation 08 00604 g003
Table 1. Physicochemical properties of the investigated wines.
Physicochemical IndexesJ12P12PW12PW5
Total acid /(g/L)5.12 ± 0.05 a5.08 ± 0.09 a4.93 ± 0.05 b4.93 ± 0.05 b
pH3.30 ± 0.00 c3.33 ± 0.00 b3.36 ± 0.00 a3.33 ± 0.00 b
Reducing sugar /(g/L)0.92 ± 0.03 b0.54 ± 0.03 c0.63 ± 0.07 c39.78 ± 0.09 a
Alcohol /(v/v)12.29 ± 0.01 b12.76 ± 0.01 a10.95 ± 0.02 c5.11 ± 0.01d
Dry extract /(g/L)19.80 ± 0.21 d26.58 ± 0.03 a21.17 ± 0.19 c22.12 ± 0.15 b
Volatile acid /(g/L)0.35 ± 0.02 b0.38 ± 0.02 a0.36 ± 0.01 ab0.37 ± 0.02 ab
Total sulfur dioxide /(mg/L)55.50 ± 0.46 b57.34 ± 1.20 b55.50 ± 1.82 b112.58 ± 1.21 a
Free sulfur dioxide /(mg/L)15.51 ± 0.46 c17.20 ± 0.46 b16.83 ± 1.21 bc32.35 ± 0.79 a
Note: Values are averages of three replicates. Data expressed as mean ± standard deviation (SD). Different alphabets in the same row indicate significant differences (p < 0.05) according to Duncan test.
Table 2. Monomer phenol contents of the investigated wines (mg/L).
CompoundsRetention Time/minJ12P12PW12PW5
Gallic acid6.5580.30 ± 0.00 a0.28 ± 0.00 c0.30 ± 0.00 a0.29 ± 0.01 b
Cumaric acid10.845----
Catechin15.2923.10 ± 0.00 c3.45 ± 0.01 a3.23 ± 0.06 b3.08 ± 0.03 c
Chlorogenic acid 17.5530 c0.63 ± 0.01 a0.61 ± 0.12 a0.22 ± 0.00 b
Epicatechin gallate19.559----
Caffeic acid20.7720.37 ± 0.010.36 ± 0.010.35 ± 0.000.37 ± 0.03
Epicatechin21.917----
Syringic acid23.208----
Catechin gallate30.9710.40 ± 0.01 a0.41 ± 0.04 a0.31 ± 0.00 b0.44 ± 0.01 a
Ferulic acid32.460.19 ± 0.01 b0.18 ± 0.00 bc0.17 ± 0.00 c0.21 ± 0.02 a
Benzoic acid38.068----
Rutin40.2580.39 ± 0.04 b0.37 ± 0.01 b0.34 ± 0.01 b0.48 ± 0.02 a
Salicylic acid41.091----
Myricetin45.2250.76 ± 0.03 b0.98 ± 0.01 a0.95 ± 0.02 a0.78 ± 0.03 b
Morin49.5822.15 ± 0.14 a1.93 ± 0.11 b2.18 ± 0.05 a2.17 ± 0.03 a
Quercitrin54.3990.32 ± 0.05 a0 c0.13 ± 0.03 b0.01 ± 0.01 c
Total 7.98 ± 0.22 b8.59 ± 0.09 a8.57 ± 0.16 a8.05 ± 0.03 b
Note: Values are averages of three replicates. Data expressed as mean ± standard deviation (SD). Different alphabets in the same row indicate significant differences (p < 0.05) according to Duncan test. “-”: not detected.
Table 3. Volatile compounds identified in the investigated wines.
No.CompoundsRetention
Time/min
Odor DescriptionJ12 P12PW12PW5
Alcohols (μg/L)
1Isobutyl alcohol5.019Fusel, whiskey301.65 ± 6.05 b353.56 ± 15.09 a166.87 ± 10.41d214.22 ± 4.03 c
21-Butanol6.135 3.84 ± 0.00 b7.04 ± 0.00 a2.61 ± 0.91 c4.02 ± 0.00 b
3Isoamyl alcohol7.656Fruity, banana, whiskey1043.6 ± 47.48 c1452.6 ± 53.77 a1197.30 ± 5.92 b803.57 ± 8.05 d
41-Hexanol11.323Fusel, fruity, sweet, grass just cut145.07 ± 7.50 c319.93 ± 12.04 a192.43 ± 12.21 b150.52 ± 2.32 c
5Cis-3-hexenol12.056 5.55 ± 0.74 b8.61 ± 1.36 a5.73 ± 1.81 b4.36 ± 0.58 b
63-Ethoxypropanol 11.767 10.67 ± 0.74 a10.95 ± 1.35 a7.82 ± 0.00 b0.67 ± 0.58 c
71-Heptanol13.918Herbal2.56 ± 0.00 c9.39 ± 0.00 a5.21 ± 0.91 b5.03 ± 0.00 b
8Isooctyl alcohol14.813Fruity, lemon0 b0 b0 b4.36 ± 0.58 a
91-Decanol21.292 1.28 ± 0.00 c2.35 ± 0.01 b3.13 ± 0.00 a1.01 ± 0.00 d
10Benzyl alcohol24.477Floral, rose, phenolic10.67 ± 0.74 b17.11 ± 1.44 a6.78 ± 0.9 c5.70 ± 0.58 c
112-Phenylethanol 25.687Floral, rose, dried rose67.41 ± 3.70 b65.28 ± 0.00 b136.63 ± 1.81 a45.26 ± 2.01 c
Total1590.61 ± 54.67 b2280.17 ± 74.96 a1725.07 ± 24.96 b1238.70 ± 12.65 c
Esters (μg/L)
12Ethyl acetate2.249Fruity, pineapple 333.65 ± 24.09 b582.763 ± 16.65 a278.99 ± 10.06 c155.21 ± 5.54 d
13Isoamyl acetate 5.716Fruity, banana223.16 ± 3.22 c645.33 ± 22.39 a584.06 ± 18.80 b183.38 ± 2.53 d
14Ethyl hexanoate 8.361Sweet fruity, pineapple, waxy, green382.72 ± 13.55 d839.32 ± 36.46 a556.94 ± 23.36 b447.21 ± 7.81 c
15Hexyl acetate9.32Fruity, green, apple, banana, sweet93.01 ± 1.96 d685.23 ± 27.06 a394.24 ± 15.09 b146.16 ± 3.07 c
16Ethyl 4-hexenoate9.826Sweet fruity, pineapple0 c0 c6.26 ± 0.00 b95.21 ± 4.54 a
17Trans-3-hexenyl acetate10.42 7.68 ± 0.00 d24.25 ± 1.35 a17.21 ± 0.00 b10.39 ± 0.58 c
18Propyl hexanoate10.525Fruity, pineapple, loganberry2.56 ± 0.00 ab3.91 ± 1.35 a1.56 ± 0.00 bc1.01 ± 0.00 c
19Cis-2-hexenyl acetate10.875 0 d50.06 ± 1.36 a23.99 ± 0.90 c28.83 ± 1.54 b
20Ethyl trans-2-hexenoate12.162 4.27 ± 0.74 b3.91 ± 1.35 b2.61 ± 0.90 b6.71 ± 0.57 a
21Methyl octanoate 12.287Citrus2.56 ± 0.00 b9.39 ± 0.00 a8.34 ± 0.91 a8.15 ± 1.00 a
22Ethyl octanoate13.524Fruity, pineapple, creamy, dairy1491.2 ± 35.91 c3393.3 ± 19.168 a2461.4 ± 54.87 b1009.7 ± 49.85 d
23Isopentyl hexanoate14.07Fruity, apples, pineapples3.84 ± 0.00 c12.51 ± 1.36 a8.87 ± 0.91 b4.03 ± 0.00 c
24Octyl acetate 14.468 1.28 ± 0.00 c10.95 ± 1.35 a6.26 ± 0.00 b2.01 ± 0.00 c
25Ethyl 2,4-hexadienoate14.53 0 c0c5.21 ± 0.91 b21.79 ± 2.10 a
26Ethyl 7-octenoate14.714 0 c2.35 ± 0.00 a0 b1.68 ± 0.57 d
27Propyl octanoate15.57 11.95 ± 0.74 c25.81 ± 0.00 a15.45 ± 1.29 b2.01 ± 0.00 d
28Ethyl nonanoate 15.985Sweet, fruity, pear8.11 ± 0.74 c25.03 ± 1.35 a16.15 ± 0.92 b10.06 ± 1.01 c
29Isobutyl n-octanoate16.388 7.68 ± 0.00 b21.12 ± 2.35 c10.95 ± 0.00 c5.36 ± 0.58 a
30Octyl formate16.445 0 c17.99 ± 1.35 a8.34 ± 0.91 b0 c
31Nonyl acetate16.966 1.28 ± 0.00 c7.82 ± 1.36 a4.69 ± 0.00 b2.01 ± 0.00 c
32Methyl decanoate17.372 0 c9.39 ± 0.00 a6.78 ± 0.91 b3.01 ± 0.01 d
33Ethyl decanoate18.449Fruity, waxy, apple grape, brandy866.56 ± 6.77 c2537.5 ± 94.52 a1807.5 ± 38.46 b462.96 ± 62.86 d
34Ethyl benzoate18.747Mint34.13 ± 1.95 b64.14 ± 1.36 a28.16 ± 0.00 c37.21 ± 4.02 b
35Isopentyl octanoate18.881Pineapple, coconut, brandy29.44 ± 1.28 c82.91 ± 1.36 a79.79 ± 1.57 b21.80 ± 1.55 d
36Ethyl 9-decenoate19.584Fruity, fatty20.91 ± 1.96 d132.20 ± 1.89 a62.58 ± 3.13 b53.30 ± 7.04 c
37Benzyl acetate20.196 2.99 ± 0.74 b5.47 ± 1.36 a1.56 ± 0.00 b2.01 ± 0.00 b
38Propyl decanoate20.396Fruity11.09 ± 2.66 b13.30 ± 1.36 ab16.15 ± 0.92 a4.36 ± 0.58 d
39Isobutyl decanoate21.186Fruity2.13 ± 0.74 b7.92 ± 1.36 b4.69 ± 0.00 b53.30 ± 7.04 a
40Ethyl laurate23.958Floral, fruity91.73 ± 5.17 c377.03 ± 23.15 a277.43 ± 11.32 b52.97 ± 3.81 d
41Isopentyl decanoate24.643Banana, brandy4.27 ± 0.74 b5.47 ± 1.36 a5.74 ± 0.91 a0.67 ± 0.06 b
42Ethyl palmitate38.655Light wax, creamy 4.27 ± 0.74 a5.47 ± 1.36 a5.73 ± 0.91 a0.67 ± 0.58 b
43Diethyl phthalate40.181 25.60 ± 1.28 b35.98 ± 1.35 a22.42 ± 0.91 c23.13 ± 1.01 c
Total3666.35 ± 66.79 c9642.45 ± 323.79 a6735.46 ± 126.93 b2803.93 ± 153.12 d
Acids (μg/L)
44Butanoic acid17.876Cheese 0 c4.69 ± 0.00 a4.28 ± 1.06 a2.01 ± 0.00 b
45Hexanoic acid23.541Fatty, cheesy, fruity 20.05 ± 0.74 b54.76 ± 2.71 a56.93 ± 6.62 a20.45 ± 0.58 b
46Octanoic acid31.207Acidic, cheesy, fruity 57.17 ± 6.57 c133.76 ± 4.06 b200.8 ± 2.14 a48.37 ± 1.74 c
47Decanoic acid38.083Rancid, fat 9.81 ± 1.48 c28.94 ± 3.58 b52.65 ± 5.31 a10.73 ± 0.58 c
48Benzoic acid41.157 0 c3.13 ± 1.35 a1.22 ± 1.06 bc2.68 ± 0.58 ab
Total87.04 ± 9.39 c225.28 ± 10.75 b315.88 ± 33.21 a84.15 ± 2.90 c
Terpenoids and lactones (μg/L)
49Linalool16.225Citrus, floral, sweet, rose, woody, green, blueberry 23.47 ± 1.96 a18.77 ± 0.00 b17.18 ± 1.03 b16.43 ± 2.32 b
50Citronellol21.359Lemon, citrus 3.41 ± 0.74 a2.35 ± 0.00 a3.06 ± 1.06 a1.01 ± 0.00 b
51α-Terpineol250Floral, pine 1.28 ± 0.01 a0 b0 b0 b
52γ-Decalactone33.188Coconut, peach 5.97 ± 0.74 c11.61 ± 0.21 a7.96 ± 1.06 b4.03 ± 0.00 d
Total34.13 ± 3.22 a32.85 ± 0.00 a28.16 ± 1.06 b21.45 ± 2.33 c
Aldehydes (μg/L)
53Decanal14.938Citrus, floral, sweet fruity 3.35 ± 0.58 b1.57 ± 0.36 b1.84 ± 0.00 ab3.35 ± 0.58 a
54Benzaldehyde15.239Cherry, bitter almond 5.97 ± 1.48 b7.04 ± 0.00 b3.06 ± 1.06 b102.59 ± 7.59 a
Total7.25 ± 1.48 b8.61 ± 1.36 b4.90 ± 1.06 b105.93 ± 7.68 a
Note: Values are averages of three replicates. Data expressed as mean ± standard deviation (SD). Different alphabets in the same row indicate significant differences (p < 0.05) according to Duncan test.
Table 4. Flavor compounds and corresponding ROAV values.
No.CompoundsOdor Threshold
(µg/L)
Relative Odor Activity Value (ROAV)
J12 P12PW12PW15
1Isobutyl alcohol40,000<0.01<0.01<0.01<0.01
2Isoamyl alcohol 30,000<0.010.01<0.01<0.01
31-Hexanol8000<0.01<0.01<0.01<0.01
4Cis-3-hexenol400<0.01<0.01<0.01<0.01
5Benzyl alcohol200,000<0.01<0.01<0.01<0.01
62-Phenylethanol 14,000<0.01<0.01<0.01<0.01
7Ethyl Acetate75000.010.020.01<0.01
8Isoamyl acetate 301.514.373.951.24
9Ethyl hexanoate 145.5512.188.086.49
10Hexyl acetate15000.010.090.050.02
11Ethyl octanoate5100100100100
12Ethyl nonanoate 1300<0.010.090.05<0.01
13Methyl decanoate600.320.230.10
14Ethyl decanoate2000.882.581.840.47
15Ethyl benzoate530.130.250.110.14
16Isopentyl octanoate1250.050.130.130.04
17Ethyl laurate15000.010.050.04<0.01
18Ethyl palmitate1000<0.01<0.01<0.01<0.01
19Butanoic acid1730<0.01<0.01<0.01
20Hexanoic acid420.100.260.280.10
21Octanoic acid5000.020.050.080.02
22Decanoic acid1000<0.01<0.010.01<0.01
23Benzoic acid10000<0.01<0.01<0.01
24Linalool250.190.150.140.13
25Citronellol100<0.01<0.01<0.01<0.01
26α-Terpineol250<0.01000
27γ-Decalactone880.010.030.02<0.01
28Decanal100.070.030.040.07
29Benzaldehyde3000<0.01<0.01<0.01<0.01
Publisher’s Note: MDPI stays neutral with regard to jurisdictional claims in published maps and institutional affiliations.

