Article

The Potential of Traditional ‘Gaja’ and New Breed Lines of Waxy, Blue and Purple Wheat in Wholemeal Flour Fermentation

1
Institute of Animal Rearing Technologies, Faculty of Animal Sciences, Lithuanian University of Health Sciences, Tilzes Str. 18, LT-47181 Kaunas, Lithuania
2
Department of Food Safety and Quality, Veterinary Academy, Lithuanian University of Health Sciences, Tilzes g. 18, LT-47181 Kaunas, Lithuania
3
Institute of Food Safety, Animal Health and Environment BIOR, Lejupes iela 3, LV-1076 Riga, Latvia
4
Laboratory for Process Engineering, Environment, Biotechnology and Energy, Faculty of Engineering, University of Porto, 4099-002 Porto, Portugal
5
Associate Laboratory in Chemical Engineering, Faculty of Engineering, University of Porto, 4099-002 Porto, Portugal
6
Institute of Agricultural and Food Sciences, Agriculture Academy, Vytautas Magnus University, LT-44248 Kaunas, Lithuania
7
Institute of Agriculture, Lithuanian Research Centre for Agriculture and Forestry, Instituto al. 1, LT-58344 Kedainiai, Lithuania
*
Author to whom correspondence should be addressed.
Fermentation 2022, 8(10), 563; https://doi.org/10.3390/fermentation8100563
Submission received: 4 October 2022 / Revised: 18 October 2022 / Accepted: 18 October 2022 / Published: 20 October 2022
(This article belongs to the Special Issue The Role of Antioxidant Compounds in Fermented Foods)

Abstract

:
The aim of this study was to analyse and compare the acidity, microbiological and colour characteristics, fatty (FA) and amino (AA) acid profiles, biogenic amine (BA) and gamma-aminobutyric acid (GABA) concentrations, and macro- and microelement contents in non-treated (non-fermented) and fermented wholemeal cereal flours of ‘Gaja’ (traditional wheat) and new breed lines DS8888-3-6 (waxy wheat), DS8548-7 (blue wheat) and DS8535-2 (purple wheat). Independent fermentations were undertaken with selected strains of Pediococcus acidilactici, Liquorilactobacillus uvarum and Lactiplantibacillus plantarum. The results revealed that all the wholemeal cereal flours of the analysed wheat varieties are suitable for fermentation with the selected strains because all the fermented samples showed lactic acid bacteria (LAB) viable counts higher than 8.00 log10 CFU/g and desirable low pH values. In most of the cases, fermentation increased the concentration of essential amino acids in the wholemeal cereal samples, and the LAB strain used for fermentation proved to be a significant factor in all the essential amino acid content of wholemeal wheat (p ≤ 0.0001). When comparing the non-fermented samples, the highest GABA content was found in ‘Gaja’ and waxy wheat samples (2.47 µmol/g, on average), and, in all the cases, fermentation significantly increased GABA concentration in the wholemeal cereals. On the other hand, total levels of biogenic amines in wholemeal samples ranged from 22.7 to 416 mg/kg. The wheat variety was a significant factor in all the analysed macro- and microelement contents (p ≤ 0.0001) in the wholemeal cereals. Furthermore, fermentation showed to be a significant factor in most of the FA content of the wholemeal cereal samples. Finally, fermentation can also contribute to improving the biological and functional value of wholemeal wheat flours (by increasing essential amino acids and GABA concentrations); however, safety parameters (e.g., biogenic amines) also should be taken into consideration when optimizing the most appropriate technological parameters.

1. Introduction

Nowadays, consumers, as well as food and livestock producers, are looking for higher-value foodstuffs to meet the requirements of a balanced diet for both human and animal nutrition. Cereal grains are the most important food and feed material around the world due to their possible long-term storage, relatively easy transportation and concentrated nutritional and energy value. In addition to the most traditional cereals, progress in the development of new cereal varieties can be seen often, and, as a result, new and higher-value cereal grains are suggested for consumption. However, despite new varieties or hybrid lines that may show good chemical composition and a higher content of bioactive and functional compounds, data concerning its changes during the fermentation process are scarce, which is the main technology used in the cereal industry for both food and feed processing.
Additionally, to the chemical composition evaluation of new breed lines of wheat cereals, we hypothesized that different wheat varieties (traditional, waxy, blue, purple) may constitute a significant factor in the chemical composition of fermented cereal flours, including fatty and amino acid profiles, biogenic amines (BA) and gamma-aminobutyric acid (GABA) formation. Taking into consideration that lactic acid bacteria (LAB), as technological microorganisms used for cereal flour fermentation, are sensitive to environment conditions (including the nutrient composition of fermentable substrates), fermentation of different cereal grain varieties is very likely to lead to different final compositions of the fermented substrate/matrix. Moreover, in addition to the desirable microbial metabolites (e.g., organic acids and free amino acids), toxic compounds can be formed, such as biogenic amines. Finally, experimental data on the chemical composition of new wheat grain varieties (non-fermented and fermented flours with different LAB strains) can be important for their better application in the food and feed industries.
Waxy wheat was developed in 1995 [1]. Its unique properties, including the quantity of amylose, alter the texture parameters, stability and viscosity of the resulting food products [2,3,4,5]. Waxy starch has a higher swelling capacity in comparison with common starch [6]. Moreover, waxy wheat starch can be used as a thickener in the food and feed industry [7]. It was reported that the supplementation of waxy wheat flour with traditional ones can improve the quality and sensory properties of quick-frozen products [8]. The low amylose concentration of waxy wheat grain leads to better quality bread, including a longer shelf-life [9]. Additionally, the supplementation of waxy wheat flour to the main bread formula leads to a better flavour of the products [10]. Taking into consideration specific properties of the waxy wheat starch, we hypothesized that these characteristics could have a greater influence on LAB activity and viability, as well as on the metabolites released by them to the fermentable substrate.
Along with waxy wheat, coloured wheat grain has recently gained important attention from researchers and technologists [11,12,13,14]. The purple colour of wheat grain is explained by the presence of anthocyanin in the pericarp, and the blue colour in the aleurone [15]. The grain of coloured wheat has shown anti-inflammatory, antimicrobial and other desirable biological activities for human and animal nutrition [11,13,14,16,17,18,19]. However, presently, the data about the chemical composition of coloured wheat are scarce [20]. Furthermore, changes in the chemical composition of coloured wheat grains during the fermentation process was not reported so far. Taking into consideration specific compounds of the coloured wheat, which can induce inhibition of microorganisms, we hypothesized that differences can be attained in coloured wheat fermentation in comparison with traditional (‘Gaja’) and waxy wheat.
However, the chemical composition of the main substrate (i.e., wholemeal wheat grain) and the microorganisms used for fermentation are key factors. In this study, three LAB strains were selected for wholemeal wheat fermentation because of their proven good technological properties [21,22], desirable antimicrobial and antifungal characteristics [23], as well as a positive influence in vivo on piglets microbiota and other health parameters [24].
The aim of this study was to analyse and compare the acidity, microbiological and colour characteristics, fatty (FA) and amino (AA acid) profiles, BA and GABA concentration, macro- and microelement contents in non-treated (non-fermented or raw material) and fermented wholemeal cereal flours of ‘Gaja’ (traditional wheat) and new breed lines of DS8888-3-6 (waxy wheat), DS8548-7 (blue wheat) and DS8535-2 (purple wheat), and using three LAB strains, viz. Pediococcus acidilactici, Liquorilactobacillus uvarum and Lactiplantibacillus plantarum strains. This study will also contribute to the creation of a database on the chemical composition of the new breed lines of wheat grains.

2. Materials and Methods

2.1. Wheat Varieties Used in the Experiments

The schematic representation of the experimental design is given in Figure 1. The grains of wheat varieties ‘Gaja’ (traditional wheat) and new breed lines DS8888-3-6 (waxy wheat), DS8548-7 (blue wheat) and DS8535-2 (purple wheat) were provided by the Institute of Agriculture, Lithuanian Research Centre for Agriculture and Forestry (LAMMC, Akademija, Kėdainiai distr., Lithuania). Field trials were conducted during 2020–2021 at the experimental base of the LAMMC in Akademija, Kėdainiai distr., Lithuania (55°39′ N 23°57′ E). Field experiment description in detail is given in Supplementary File S1.
Wheat grains (moisture content of the wheat grain was 14%) were milled with Laboratory Mill 120 (Perten Instruments AB, Stockholm, Sweden) until the particle size was 1–2 mm. The moisture content of the grain was determined by using Infratec™ 1241 Grain Analyser (FOSS, Foss Allé DK-3400, Hilleroed, Denmark).

2.2. Lactic Acid Bacteria Strains (LAB) Used in the Experiments and Wholemeal Wheat Flour Fermentation

The LAB strains Pediococcus acidilactici, Liquorilactobacillus uvarum and Lactiplantibacillus plantarum were used for wholemeal wheat flour fermentation. The LAB strains, possessing antibacterial and antifungal properties [23] as well as good technological characteristics for wheat bread preparation [25,26], were obtained from the Lithuanian University of Health Sciences (Kaunas, Lithuania). Before the experiments, the LAB strains stored at −80 °C (Microbank system, Pro-Lab Diagnostics, Birkenhead, UK) were activated and multiplied in de Man–Rogosa–Sharpe (MRS) broth (Oxoid Ltd., Hampshire, UK) at (30 ± 2) °C for 24 h, under aerobiosis, before use in the wholemeal cereal flour fermentation. The wholemeal wheat flours, water and a suspension of LAB strain (3% of dry matter of the wholemeal flour) containing 8.7 log10 CFU/mL were fermented at (30 ± 2) °C for 24 h. For 100 g of wholemeal wheat flour, 60 mL of water was added and mixed. Non-fermented wholemeal samples were analysed as a control. The analysis of total titratable acidity, pH, microbiological and colour characteristics was performed directly after fermentation, while the rest of samples were vacuum packed and frozen at –18 °C until further analysis of other compounds.

2.3. Evaluation of Total Titratable Acidity (TTA), pH, Microbiological and Colour Characteristics of Wholemeal Wheat Flour Samples

The total titratable acidity (TTA) was evaluated for a 10 g wholemeal wheat flour mixed with 90 mL of water. Results were expressed as the volume in mL of 0.1 mol/L NaOH solution required to achieve a pH value of 8.2. The pH of wholemeal samples was measured using a pH electrode (PP-15; Sartorius, Goettingen, Germany). The LAB viable count was determined according to the method described by Bartkiene et al. [22]. The colour characteristics of wholemeal samples were evaluated on the sample surface using a CIE L*a*b* system (CromaMeter CR-400, Konica Minolta, Tokyo, Japan). The results were expressed as the CIE colour values, i.e., L* (brightness/darkness), a* (redness/greenness) and b* (yellowness/blueness).

2.4. Analysis of the Amino Acids (AA) and Gamma-Aminobutyric Acid (GABA) of Wholemeal Wheat Flour Samples

Sample preparation and dansylation were performed according to the method of Hua-Lin Cai et al. [27], with some modifications, which are given in Supplementary File S2.

2.5. Analysis of the Biogenic Amine (BA) Content of Wholemeal Wheat Flour Samples

The extraction and determination of BA in non-fermented and fermented wholemeal wheat flour followed the procedures developed by Ben-Gigirey et al. [28]. Detailed description of the method is given in Supplementary File S3.

2.6. Analysis of Macro- and Microelements Content of Wholemeal Wheat Flour Samples

For macro- and microelement analysis in wholemeal wheat flour samples, an Agilent 7700x ICP-MS (Agilent Technologies, Hachioji, Japan) and software Mass Hunter Work Station for ICP-MS, version B.01.01 (Agilent Technologies, Hachioji, Japan) were used. Description of the method in detail is given in Supplementary File S4.

2.7. Fatty Acid (FA) Composition Analysis of Wholemeal Wheat Flour Samples

The fatty acid (FA) composition of the wholemeal wheat grain samples was determined using GC-MS-QP2010 (Shimadzu, Kyoto, Japan) gas chromatograph with a mass spectrometer. The fatty acid methyl esters (FAME) concentration was determined using a prepared calibration curve, and results were expressed as the percentage of total FAME concentration in the sample. Description of the method in detail is given in Supplementary File S5.

2.8. Statistical Analysis

Microbiological results were expressed as the mean (n = 5) ± standard error (SE), and physicochemical results were expressed as the mean (n = 3) ± standard error (SE). The experiment was performed by preparing three parallel samples (/replicates) for fermentation. In order to evaluate the effects of the different wheat varieties and different LAB strains used for wheat grain wholemeal fermentation, the data were analysed by multivariate analysis of variance (ANOVA). Shapiro–Wilk Test was used to determine the normality, whereas for homoscedasticity evaluation, the homoscedasticity test was performed by using SPSS Statistical Package. The linear Pearson’s correlation coefficients were calculated using the statistical package SPSS for Windows [version 28.0.1.0 (142), SPSS, Chicago, IL, USA]. Correlation level interpretation was performed in accordance with the procedure by Evans [29]. The results were recognized as statistically significant at p ≤ 0.05.

3. Results and Discussion

3.1. Acidity, Microbiological and Chromaticity Characteristics of Wholemeal Wheat Flour Samples

The pH, total titratable acidity (TTA), colour and microbiological characteristics of the wheat grain wholemeal are shown in Table 1. Significant differences between the control group (non-fermented) and fermented dough samples were found when comparing the acidity, and the lowest pH was achieved with the wholemeal ‘Gaja’ and DS8535—2 (purple wheat) samples (on average, 6.00). However, higher TTA values were found in ‘Gaja’ and DS8888-3-6 (waxy wheat) samples (on average, 1.22° N), in comparison with DS8548—7 (blue wheat) and DS8535—2 (purple wheat) (on average, 1.01° N). When comparing the pH of non-treated and fermented samples, in all the fermented groups, the lowest pH was reached in samples fermented with Pediococcus acidilactici strain. In addition, most of the latter samples (fermented ones) showed the highest TTA, as expected. The test between the subjects showed that the LAB strain used for fermentation was a significant factor in TTA (p ≤ 0.0001). Moreover, a moderate positive correlation was established (r = 0.552, p ≤ 0.001) between the TTA and type of LAB. The concentration of organic acids in fermented wholemeal flours depend on numerous factors, including LAB strain used, processing parameters and flour composition. [30]. However, controlling excessive acidity is one of the major challenges in fermented wheat, especially when they are used as a sourdough for breadmaking. Previous studies reported the influence of the interaction of processing factors on fermented cereal acidity parameters, microorganism growth, volatile compounds and amino acids formation [30]. However, the changes in waxy and coloured wheat grain during the fermentation process were not described. Thus, this study demonstrated that the cereal variety is not a significant factor in the acidity parameters (pH and TTA) of the fermented wholemeal wheat flours when using Pediococcus acidilactici, Liquorilactobacillus uvarum and Lactiplantibacillus plantarum. It was also possible to conclude that all these LAB strains are suitable for acidic fermentation of the new varieties of wholemeal wheat grains under scrutiny in this research study.
When analysing the colour characteristics of non-fermented and fermented wholemeal wheat samples, with all the tested LAB strains, the fermented ‘Gaja’ samples showed higher L* (lightness) coordinates in comparison with non-fermented ones. However, opposite tendencies of the waxy, blue and purple wholemeal wheat cereals were found, as in the latter samples, L* decreased after fermentation (except DS8888-3-6 fermented with Lactiplantibacillus plantarum). Cereal variety proved to be a significant factor in the L* coordinates of the samples (p = 0.023). Different trends were established when comparing a* (redness) coordinates. After fermentation, a* coordinates showed tendencies to increase in all fermented ‘Gaja’ samples, in wholemeal waxy wheat fermented with Pediococcus acidilactici, wholemeal waxy wheat cereal fermented with Liquorilactobacillus uvarum and in wholemeal purple wheat fermented with Pediococcus acidilactici. However, fermentation decreased a* coordinates in all the fermented wholemeal blue wheat cereal samples. Comparing the b* (yellowness) coordinates, they were lower in both fermented wholemeal coloured wheat in comparison with non-fermented ones. However, in traditional wheat ‘Gaja’, fermentation with Liquorilactobacillus uvarum and Lactiplantibacillus plantarum increased b* coordinates by 76.5 and 108.7%, respectively. Opposite trends were found in wholemeal waxy wheat samples, as fermentation with Pediococcus acidilactici and Liquorilactobacillus uvarum decreased b* values by 27.1 and 20.2%, respectively, in comparison with non-fermented ones. Variation in colour components in the cereal grain depends on genetic factors, growing conditions, as well as on technological processes [12]. Yellow C-glycosides of flavones are mainly present in the outer layer of cereal grains. However, carotenoids are located in the endosperm [12]. In addition, there is a great diversity of anthocyanin composition among various cereals [31], and the stability of these compounds can be influenced by substrate pH, temperature, the presence of ascorbic acid, oxygen and enzymes, among other factors [32]. This study showed that the LAB strain used for fermentation, cereal variety and the interaction between these factors had a significant impact on a* coordinates of wholemeal cereal samples (p = 0.021, p ≤ 0.023 p ≤ 0.001, respectively), and in most of the cases, fermented samples showed lower redness and yellowness.
Comparing LAB viable counts in fermented wholemeal wheat flours, the purple wheat samples fermented with Pediococcus acidilactici and Liquorilactobacillus uvarum showed the highest numbers of viable LAB (on average, 8.83 log10 CFU/g). As a matter of fact, technological microorganisms play a major role in developing the characteristics of fermented cereal flours [33]. A moderate positive correlation was established between the LAB viable counts and TTA (r = 0.552, p ≤ 0.001). In addition, the type of LAB strain used for fermentation was a significant factor on samples TTA (p ≤ 0.0001). Fermented cereal dough is a stressful ecosystem that is characterized by a low pH, high carbohydrate concentrations, oxygen limitation and viable cell counts of LAB ≥ 108 CFU/g [34]. In this study, all the fermented wholemeal wheat flour samples showed LAB viable counts higher than 8.00 log10 CFU/g, and the type of LAB strain used for fermentation was a significant factor in LAB viable counts of wholemeal fermented flours (p ≤ 0.0001). Finally, despite the colour intensity of the colored wheats being reduced during fermentation, all the tested wholemeal wheat flour samples showed desirable low pH values and a high number of viable LAB after fermentation.

3.2. Amino Acids (AA), γ-Aminobutyric Acids (GABA) and Biogenic Amines (BA) of Wholemeal Wheat Flour Samples

Essential amino acid concentrations of the wholemeal wheat grain samples are shown in Table 2. When comparing non-fermented samples, no significant differences were found in threonine, methionine, phenylalanine and histidine concentrations. However, in comparison with traditional and waxy wheat samples, higher valine concentration in both colored wholemeal wheat cereals was established (on average, by 14.6% higher). In contrast to these findings, in comparison with both colored wheat, traditional (‘Gaja’) and waxy wheat samples showed higher concentrations of leucine/isoleucine. Simultaneously, the highest concentration of lysine was found in ‘Gaja’ samples (0.360 µmol/g). In most of the cases, fermentation increased essential amino acid concentration in wholemeal wheat flour samples, but methionine in DS8888-3-6 La.p and in DS8548-7 La.p, and histidine in ‘Gaja’Li.u, DS8888-3-6 La.p. and DS8548-7 La.p. The LAB strain used for fermentation proved to constitute a significant factor on all the essential amino acid concentrations in wholemeal wheat grains (p ≤ 0.0001). On the other hand, wheat variety was a significant factor on threonine, methionine, valine, lysine and histidine concentrations (p = 0.002, p ≤ 0.0001, p = 0.002, p = 0.034, p ≤ 0.0001, respectively), and interaction of these factors was showed to be significant on methionine, valine and histidine contents (p ≤ 0.0001, p ≤ 0.0001, and p ≤ 0.01, respectively).
Nonessential amino acid and GABA concentrations of the wholemeal wheat grain samples are shown in Table 3. Regarding the nonessential amino acid concentrations in non-fermented samples, ‘Gaja’ and waxy wholemeal wheat flours showed higher arginine content, in comparison with both wholemeal coloured wheat, and wheat variety has shown to be a significant factor on arginine content (p = 0.21).
The highest glutamine concentration was found in wholemeal blue wheat (2.52 µmol/g), and the wheat variety was a significant factor in glutamine content (p ≤ 0.0001). The highest glutamic acid and glycine concentration was obtained in the ‘Gaja’ samples. The highest serine content was found in wholemeal waxy wheat, and the highest alanine content was established in wholemeal blue wheat. Wheat variety was a significant factor in the content of most of these amino acids, but alanine (p = 0.015, p = 0.028 and p = 0.009, respectively). The aspartic acid concentration in ‘Gaja’ and purple wheat samples was, on average, 15.5% lower in comparison with wholemeal waxy and blue wheat grain samples. The lowest proline concentration was found in the ‘Gaja’ samples (0.285 µmol/g). In all the cases, tyrosine content in non-fermented samples was lower than 0.020 µmol/g. When comparing fermented samples, different tendencies were found, and the type of LAB strain used for fermentation represented a significant factor in arginine, glutamine, aspartic acid, glycine, alanine, proline and tyrosine content (p ≤ 0.0001, p ≤ 0.0001, p ≤ 0.0001, p = 0.004, p ≤ 0.0001, p ≤ 0.0001, p ≤ 0.0001, respectively). The interaction between LAB strain used for fermentation and wheat variety was significant with regards to the arginine, glutamine, glutamic acid, alanine, proline and tyrosine concentrations (p ≤ 0.0001, p ≤ 0.0001, p = 0.027, p = 0.005, p = 0.003, p = 0.039, respectively).
Despite wheat grains being a good source of protein, the amounts of essential amino acids (especially lysine) are low [35]. Finally, the quality of the protein must be taken into consideration because the cereal-based diet tends to be deficient in some essential amino acids. Having in mind that the amino acid profile (especially essential amino acids) shows the quality of protein, the use of fermentation in this study showed prospective results, as most of the essential amino acid concentrations in wholemeal wheat cereal samples increased. Cereal grain proteins supply 47% of total global protein intake [36], and cereal-based proteins are a predominant protein source in developing countries [37]. For this reason, finding technological solutions to increase the biological value of wheat cereal varieties becomes very important. Protein content in wheat grains can vary due to genetic differences, agronomic factors, cultivation conditions, etc., but essential amino acids are the most important parameter from nutritional and physiological points of view [36,38,39]. Better knowledge of the amino acid profile of different wheat varieties is beneficial not only to wheat farmers but also to food and feed manufacturers [40]. The recommended daily intake of total essential amino acids is 83.5 mg/kg of body weight [41]. In addition to lysine, threonine, which is present at low concentrations in cereals, is very important from a nutritional standpoint [42]. Recommended daily intake for threonine is about 19 mg/kg [43]. Recommended daily intake for histidine is 8 and 12 mg/kg of body weight/day in adults [44,45,46]. Phenylalanine is essential for the growth and development of children [47]. Leucine stimulates muscle protein synthesis [44,48]. Recommended daily intake for leucine is 39 mg/kg body weight per day [41].
It was reported that in wheat cereal grains, the predominant nonessential amino acid is glutamic, which concentration can range from 24.79 to 37.05 g/100 g protein [49]. Glutamic acid plays a major role in amino acid metabolism in the body and shows neurotransmitter function [47]. The mean daily intake of glutamic acid is 15 g/day [44]. Moreover, usually, wheat grains show low content of cysteine, methionine and histidine [50].
The results of this study showed that the quality of wholemeal wheat grain proteins can be significantly improved trough the modification of the amino acid profile by using fermentation biotechnology with selected LAB strains. However, it should be pointed out that for a feed industry, these results can be of great interest because one can obtain products with higher biological added value for feed purposes. However, for the food industry, fermented wholemeal wheat grain should be further tested (e.g., in bread production), and the quality, as well as the food safety parameters of the end-products, must be taken into consideration because, during the thermal treatment, various (desirable and not) changes may occur.
When comparing GABA concentration in non-fermented samples, the highest content was found in wholemeal ‘Gaja’ and waxy wheat samples (on average, 2.47 µmol/g). Conversely, fermentation increased GABA concentration in all wholemeal cereal doughs. In addition, the LAB strain used for fermentation, the wheat variety and the interaction of these factors were shown to be significant on GABA concentration in wholemeal wheat grain samples (p ≤ 0.0001, p = 0.002 and p = 0.004, respectively).
GABA is a non-protein amino acid compound produced during the decarboxylation of L-glutamic acid [51]. GABA shows many desirable effects in the body, including neurotransmission and regulation of brain metabolism [52].
Due to the activity of LAB (decarboxylation, deamination, transamination, etc.), the production of several functional compounds in cereal grains may occur [53,54,55,56,57], including GABA [58,59]. It was reported that during the fermentation with LAB, GABA could be formed [60,61,62], and, as a matter of fact, fermented food is a good source of dietary GABA [53]. The selection of cereal varieties, based on their nutritional and functional potential, may be very useful in improving the features of food and feed products. Finally, our study showed that fermentation with selected LAB increases GABA concentration in all the tested wholemeal wheat cereal samples and can be a very prospective technology to increase the functional value of cereals.
Biogenic amine concentration in wholemeal wheat cereal samples is shown in Table 4. Phenylethylamine was found in all the wholemeal cereal samples (fermented and non-fermented), and a higher concentration of this compound was disclosed in non-fermented samples of the wholemeal ‘Gaja’, waxy and blue wheat flour (on average, by 14.2, 24.1 and 27.2%, respectively, higher in comparison with fermented ones). However, opposite trends were found in wholemeal purple wheat cereal samples, and the lowest phenylethylamine concentration was found in samples fermented with Lactiplantibacillus plantarum (30.9 mg/kg). Putrescine was observed in non-fermented ‘Gaja’ samples, in waxy wheat cereal samples fermented with Liquorilactobacillus uvarum, and in wholemeal waxy, blue and purple wheat cereals fermented with Lactiplantibacillus plantarum. Waxy wheat samples fermented with Lactiplantibacillus plantarum showed 8.3 and 2.3 times higher concentrations of putrescine, in comparison with wholemeal blue and purple wheat, respectively, fermented in the same conditions. Cadaverine was formed in all samples fermented with Liquorilactobacillus uvarum and Lactiplantibacillus plantarum strains. When comparing cadaverine concentration between different cereal groups fermented with the same LAB strain, the highest concentration was found in purple wheat samples fermented with Liquorilactobacillus uvarum (122.6 mg/kg). Furthermore, the cereal group consisting of wholemeal ‘Gaja’, waxy and purple wheat samples fermented with Lactiplantibacillus plantarum showed, on average, a concentration as high as 120.0 mg/kg cadaverine. Histamine was just formed in wholemeal waxy, blue and purple wheat cereal samples fermented with Lactiplantibacillus plantarum, and the highest concentration of histamine was reached in wholemeal purple wheat samples (66.3 mg/kg).
Tyramine (35.6 mg/kg) was formed in wholemeal purple wheat cereal samples fermented with Lactiplantibacillus plantarum, and it also displayed the highest spermidine concentration (51.8 mg/kg). When comparing spermidine in all wholemeal cereal groups, non-fermented wholemeal ‘Gaja’, waxy and blue flours contained spermidine concentrations above 20.0 mg/kg. Nevertheless, spermidine was not found in non-fermented whole purple wheat samples. In opposite to these trends, spermidine was found in all the fermented whole purple wheat samples, and its content ranged from 24.5 to 51.8 mg/kg (in fermented samples with Pediococcus acidilactici and Lactiplantibacillus plantarum, respectively). Spermine was just found in wholemeal purple wheat flour fermented with Lactiplantibacillus plantarum (20.2 mg/kg). Multivariate analyses of between-subjects effects indicated that the LAB strain used for fermentation, the wheat variety and their interaction were significant factors in the concentration of all biogenic amines (p ≤ 0.0001).
Increased concentrations of cadaverine, putrescine and spermidine in products are associated with microbial activity [63]. There are a few mechanisms of action for the accumulation of biogenic amines in food, which are explained by their possible synthesis via the decarboxylation of amino acids, as well as by transamination of aldehydes or ketones [64,65]. There are published works highlighting the negative effects of tyramine and phenylethylamine on human [66] and animal health [67]. In addition to the negative effect on health, putrescine and cadaverine are characterised as specifically smelly molecules [68], whose presence in food or feed may reduce their acceptability. The total amount of biogenic amines in food is very important because they can increase toxicity [66,69]. Arginine can be metabolised via bacterial action to putrescine; lysine can be converted to cadaverine, histidine to histamine, tyrosine to tryptophan and phenylalanine to tyramine, tryptamine and β-phenylethylamine, respectively [70]. Histamine is the most toxic biogenic amine [71,72,73]. Tyramine is related to migraines, and cadaverine and putrescine can increase the toxic effect of other biogenic amines [74]. The Food and Drug Administration (FDA) suggested that the maximum permitted histamine in food should be limited to 500mg/kg, and a level of >1000 mg/kg should be considered, for safety for consumption purposes, as unfit for human consumption [75,76]. The European Union (EU) regulation suggests values between 100 and 200 mg of histamine per kilogram of food for the Scomberesocidae and Scombridae fish families [77], as well as the highest concentration of 300 mg/kg for the total biogenic amine content in fish and derivatives.
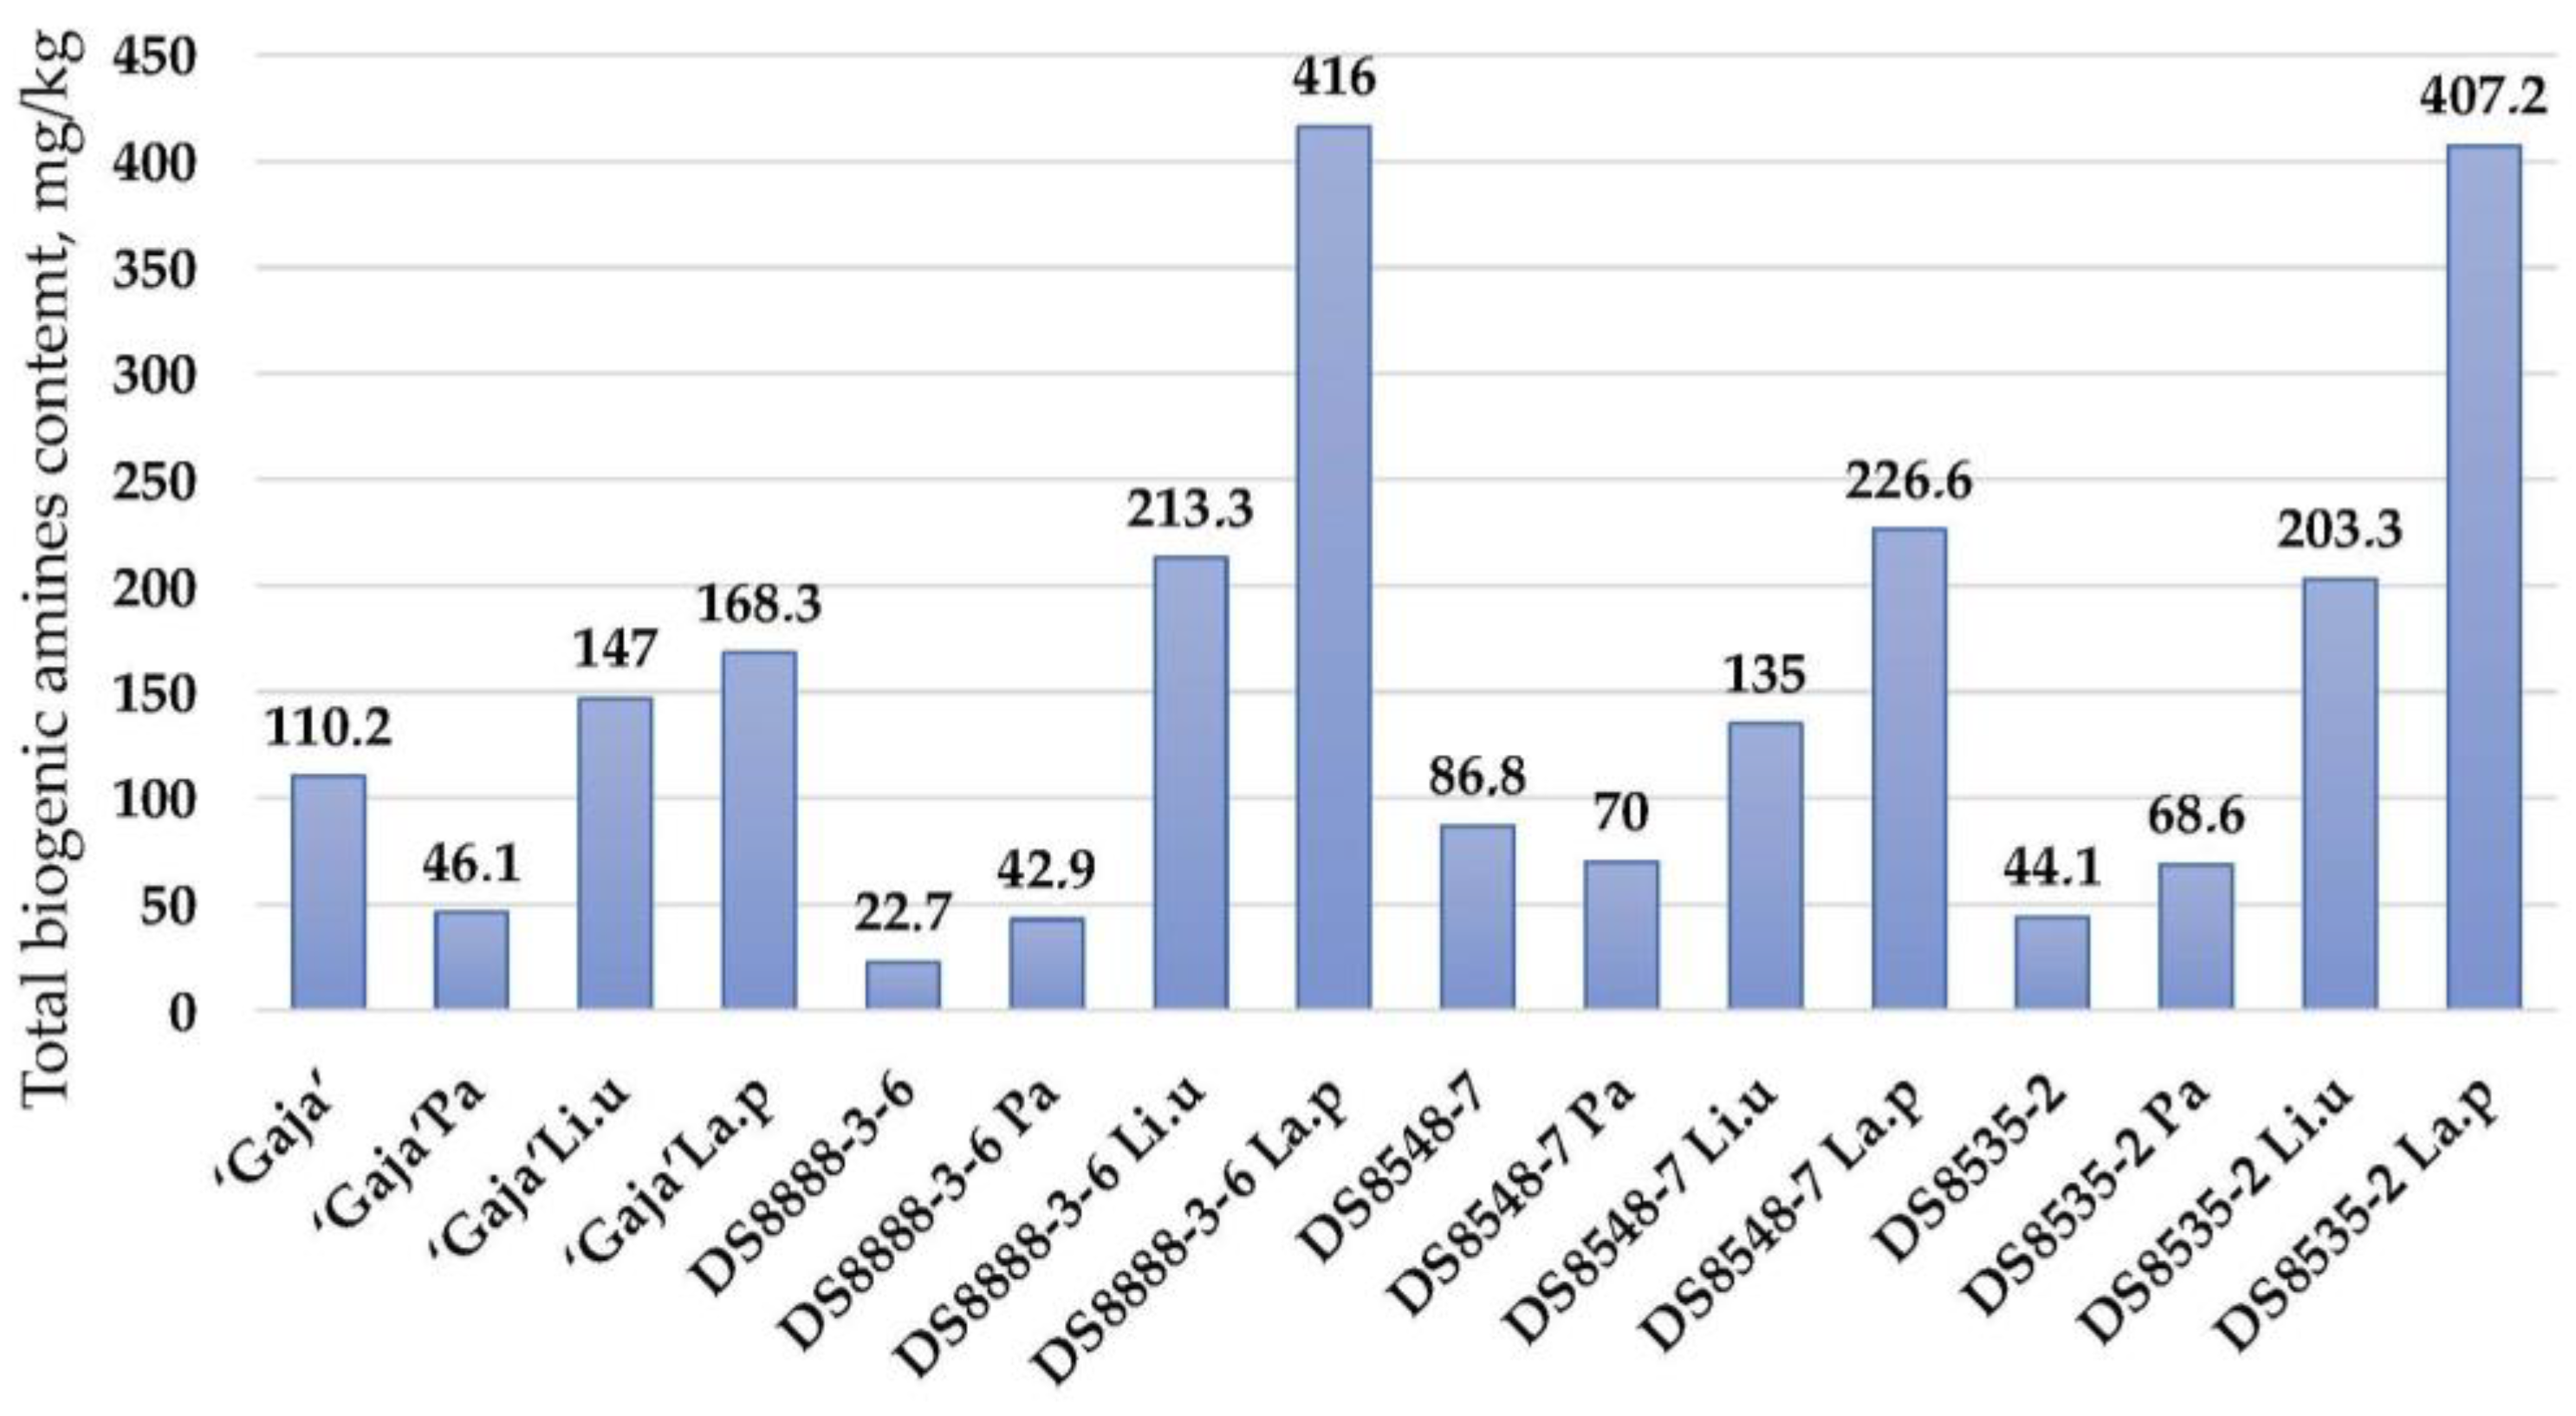
According to the results obtained in this study, the formation of biogenic amines in whole wheat cereal products should be taken into consideration, as the total levels of biogenic amine ranged from 22.7 (in non-fermented DS8888-3-6 samples) to 416 mg/kg (in samples DS8548-7 fermented with Lactiplantibacillus plantarum) (Figure 2). Moderate positive correlations were found between cadaverine concentration, TTA and viable LAB viable counts (r = 0.308, p = 0.033 and r = 0.581, p = 0.0001, respectively). However, a moderate positive correlation between histamine concentration and LAB viable counts was revealed (r = 0.306, p = 0.034).

3.3. Macro- and Microelements of Wholemeal Wheat Flour Samples

Macroelement concentrations in wholemeal wheat cereal samples are shown in Table 5. Significant differences were found in the Na content when comparing the macroelement concentrations in non-fermented and fermented groups, which, in all the cases, was lower in non-fermented samples. These differences can be explained by the addition of the LAB suspension, which contained a physiological (NaCl) solution.
When comparing the varieties of wholemeal wheat cereals under scrutiny, the highest Mg and K concentrations were obtained in wholemeal ‘Gaja’ wheat. However, the highest Ca content was found in wholemeal waxy wheat samples. Multivariate test of between-subject effects showed that the LAB strain used for fermentation and the interaction with the wheat variety had a significant impact on the Na concentration in wholemeal cereals (p ≤ 0.0001) and showed as well that the wheat variety was a significant factor on the concentration of all the analysed macroelements (p ≤ 0.0001).
Essential microelement concentrations of the wholemeal wheat cereal samples (except Co, Ni and Se, whose concentrations were lower than 0.010, 0.5 and 0.20 mg/kg, respectively) are given in Table 6. A concentration higher than 0.010 mg/100 g Cr was only detected in wholemeal waxy wheat samples (on average, 0.154 mg/100 g), and fermentation was not a significant factor towards the Cr content. Wholemeal blue and purple wheat samples showed the highest Mn concentration (on average, 16.2 mg/kg), and, comparatively, in wholemeal ‘Gaja’ and waxy wheats, the Mn concentration, on average, was 21.0 and 53.5% lower, respectively. The highest Fe content was found in wholemeal ‘Gaja’ (on average, 24.8 mg/kg), and s waxy, blue and purple wheats showed, on average, 35.1% lower Fe concentrations. Moreover, wholemeal ‘Gaja’ showed the highest Cu content (on average, 2.19 mg/kg), and wholemeal waxy, blue and purple wheat samples showed, on average, 47.9, 55.6 and 63.2% lower Cu concentrations, respectively. The highest concentration of Zn was found in wholemeal purple wheats (8.31 mg/kg), and wholemeal ‘Gaja’, waxy and blue wheats showed, on average, 21.1, 33.7 and 20.0% lower Zn contents, respectively. A multivariate test of between-subject effects showed that the LAB strain used for fermentation was a significant factor in Cr concentration in wholemeal cereals (p = 0.007). On the other hand, wheat variety was a significant factor in Cr, Mn and Cu contents (p ≤ 0.0001), and LAB strain and wheat variety interaction were significant factors in Cr concentration in wholemeal wheat samples (p ≤ 0.0001).
Non-essential microelement concentrations of the wholemeal wheat cereal samples (except V, Mo, Ag, Sb, Cs, Ti, Al and Li, whose concentrations were lower than 2, 0.5, 2, 0.5, 2, 2, 5 and 0.050 mg/kg, respectively) are shown in Table 7. Wholemeal ‘Gaja’ samples showed higher concentrations of As and Rb in comparison with wholemeal waxy, blue and purple wheat flours, in which these microelements were absent. The highest concentration of Sr was found in wholemeal blue wheat samples (2.58 mg/kg), and the wholemeal ‘Gaja’ samples showed the highest Cd content (0.54 mg/kg). The highest Ba concentration was found in wholemeal blue wheat samples, and the highest Pb content was disclosed in purple wheat wholemeal.
A multivariate test of between-subject effects revealed that the wheat variety was a significant factor on all the analysed non-essential microelement contents (p ≤ 0.0001) in wholemeal cereals. This finding can lead to the conclusion that different cereal varieties present different capacities to accumulate these elements from the environment.
Cereal grains are an important source of macro- and microelements [78]. Macro- and microelements are essential compounds for human and animal nutrition [79]. The mineral and trace element contents of many raw plant-based materials are known to be related to the cultivar and variety of plant, soil and weather conditions, fertilisers used, etc. [80,81]. The levels of some elements can vary in a large range [78]. From the nutritional standpoint, major attention has been given to the elements Fe, Ca, Cu and Zn [82].
However, other trace elements are also very important, and micronutrient malnutrition afflicts billions of people [83]. According to World Health Organization (WHO), 46% of children (from 5 to 14 years-old) have Fe deficiency anaemia, 48% of pregnant women are Fe deficient [84], and, on average, 200 million people lack essential trace elements [85]. The food industry tries to solve this problem by the addition of nutrients to food, but they do not ensure nutrient absorption from the end product [86]. If nutrient-rich wheat cereal grain can be bred, the problems mentioned above might be solved. It was reported that coloured wheat grains contain numerous nutrients which are beneficial to human health [87,88,89], and black wheat showed higher contents of iron, zinc, manganese, copper, selenium, magnesium, potassium and phosphorus when compared to traditional ones [90]. Likewise, organic chromium content in black wheat was, on average, four times higher in comparison with traditional ones [90]. Correspondingly, it was reported that Se concentration in purple wheat is higher than in control by, on average, 173.6% [83].
Finally, the determination of the nutrient content in cereals, such as essential elements, is necessary to perceive their dietary intake. Calcium is an element in bone tissues. Potassium and Na play an important role in maintaining osmotic pressure and in the transmission of nervous impulses, and Mg is a cofactor in more than 300 enzymatic reactions. Trace elements (Fe, Cu, Co, Zn, Mn, Mo) are also needed for the proper functioning of the organism but are required in smaller quantities [91,92,93,94,95]. These trace elements are involved in numerous biological processes: Fe is involved in oxygen transport, Co is an element forming part of cobalamin or vitamin B12, and Mo, Mn, Zn or Cu are components in many enzymes [96,97,98]. This study, considering the importance of cereals in the diet, demonstrates the importance of creating databases of new wheat varieties, which can be a good source of micro- and macroelements in human and animal diets.

3.4. Fatty Acid Composition of Wholemeal Wheat Flour Samples

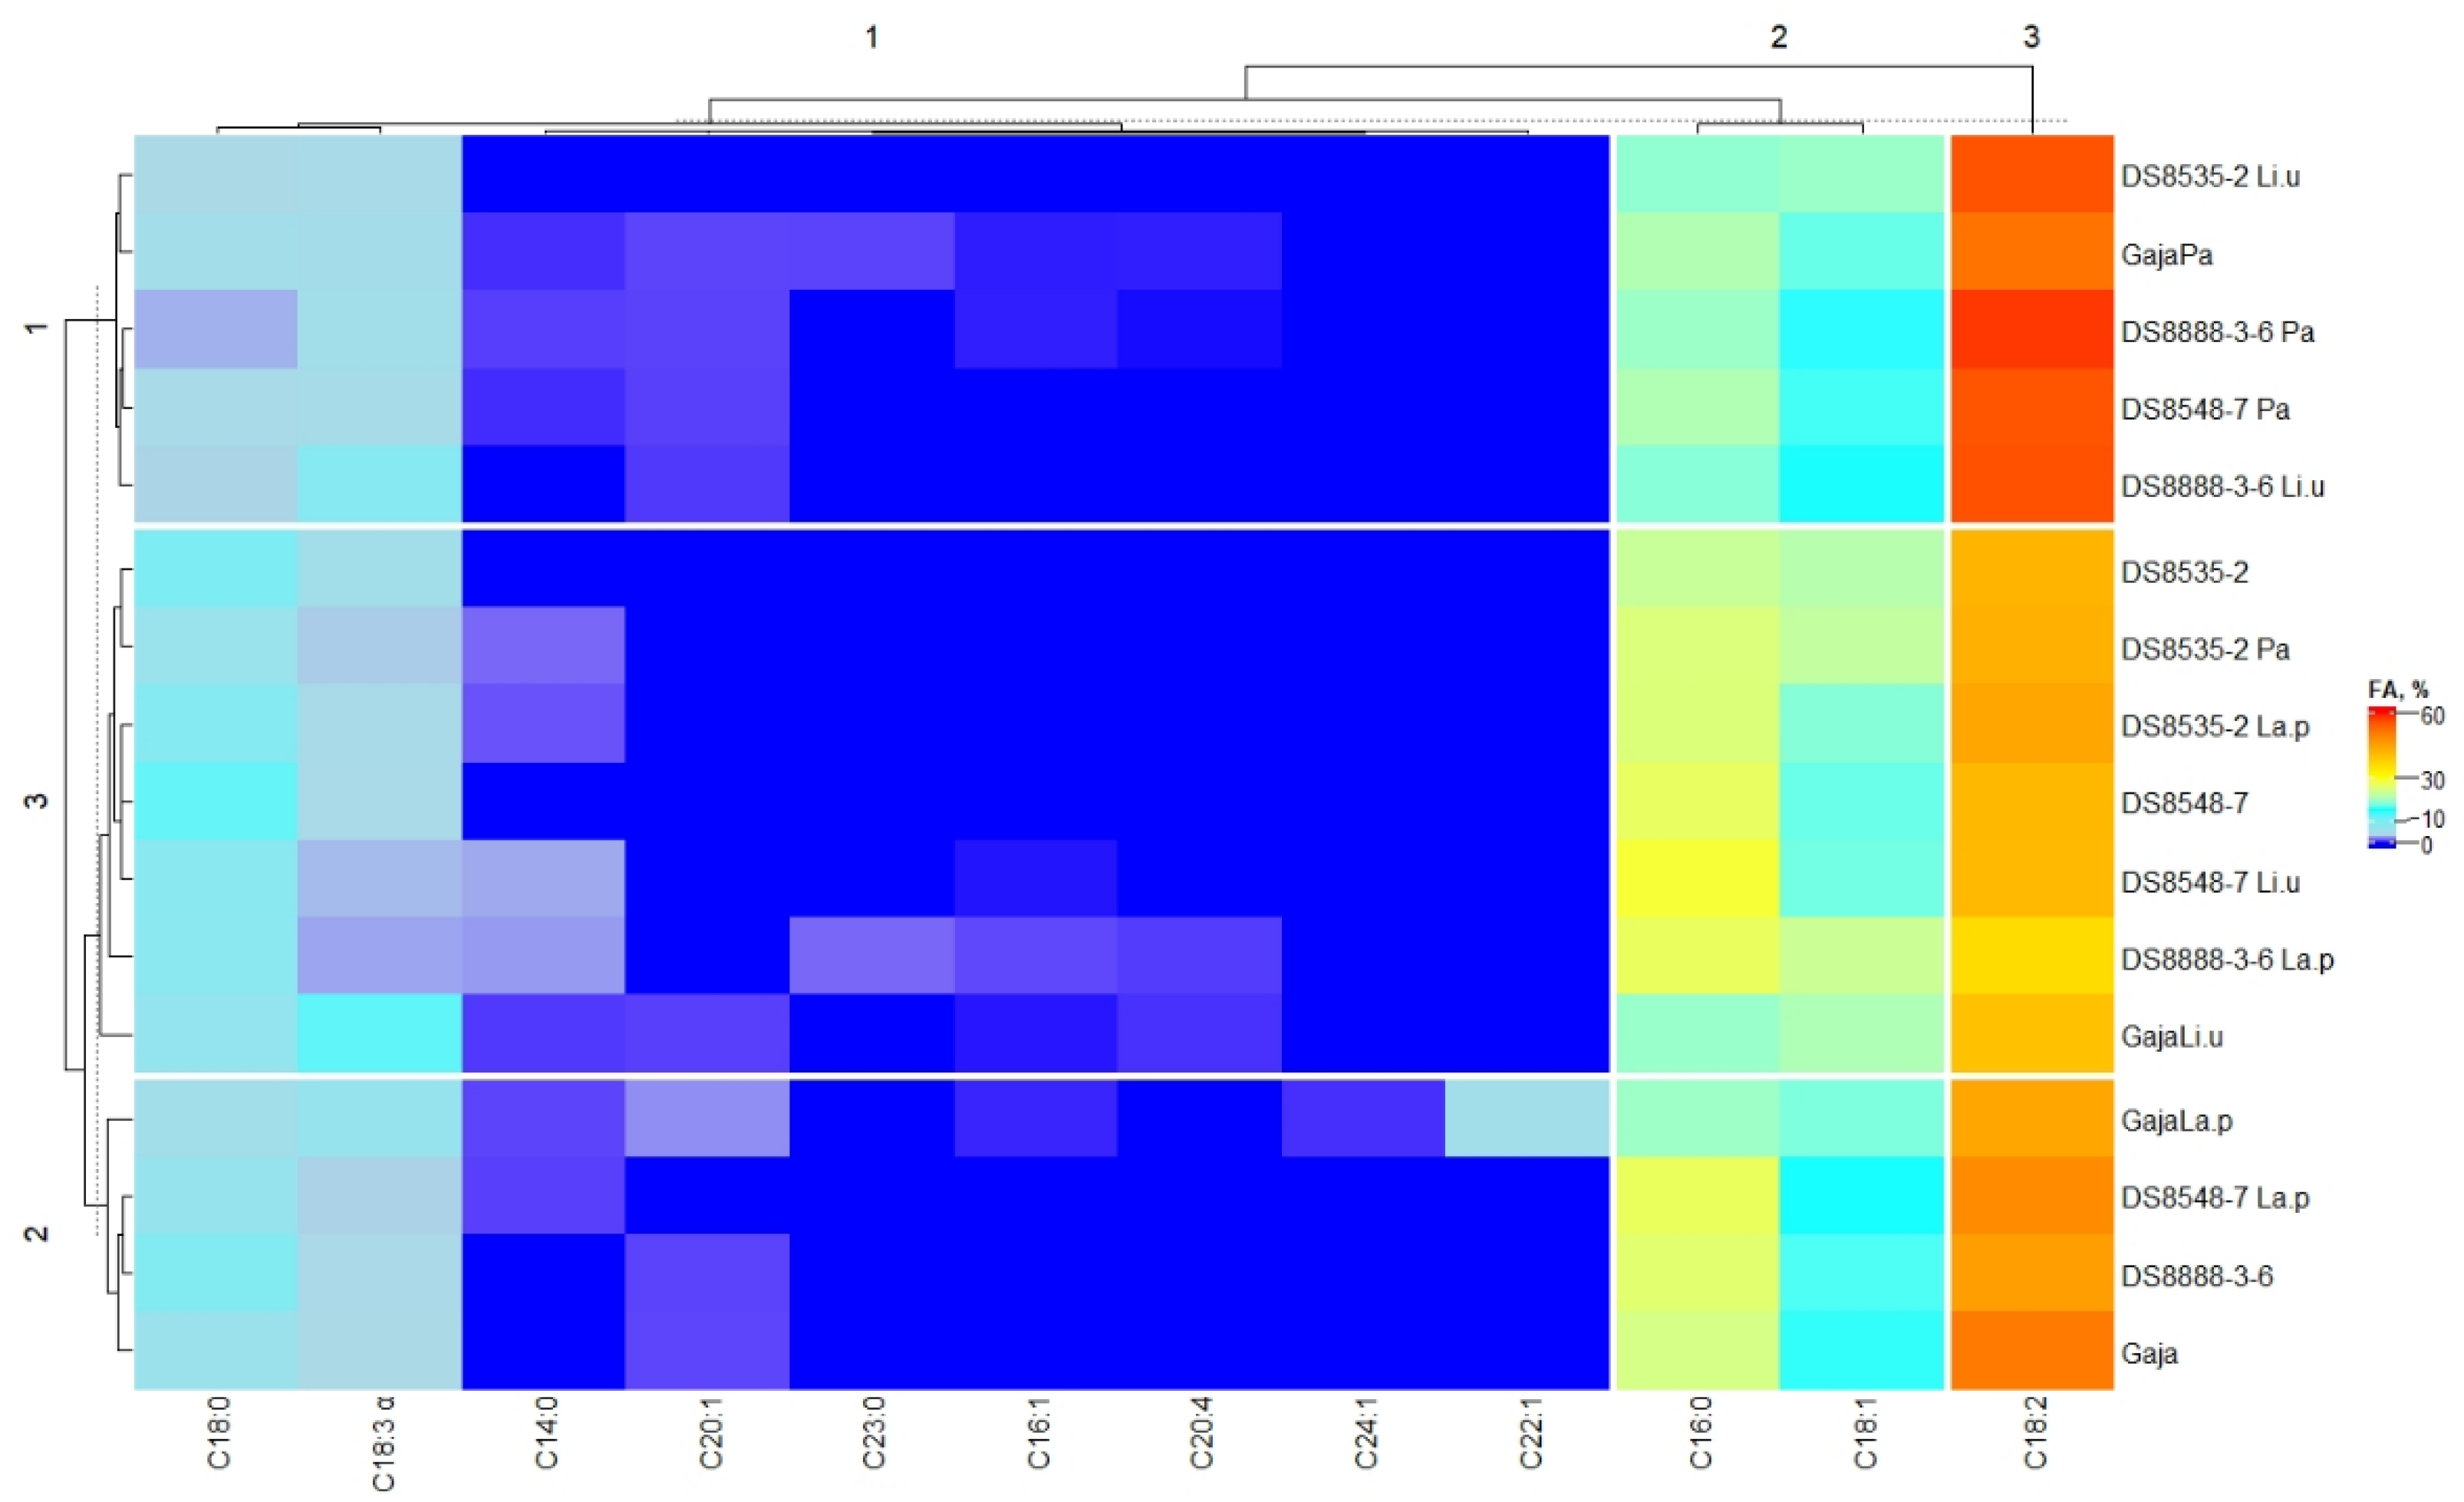
Fatty acid composition (expressed as a percentage of the total fatty acid content) of the wholemeal wheat cereal samples is given in Table 8. Moreover, the detailed fatty acid profile is given in Supplementary Table S1. A detailed fatty acid profile of the wheat cereal wholemeal samples is in the heatmap of Figure 3.
The highest saturated fatty acids content was found in wholemeal blue wheat flour (38.14% from the total fatty acid content) when comparing the non-fermented samples. Nonetheless, in most of the cases, fermentation reduced the saturated fatty acid content of wholemeal wheat samples—except wholemeal waxy and purple wheat fermented with Lactiplantibacillus plantarum and wholemeal blue wheat fermented with Liquorilactobacillus uvarum. A multivariate test of between-subjects effects showed that the LAB strain used for fermentation, wheat variety and the interaction of these factors were significant in the saturated fatty acid content of wholemeal wheat cereals (p ≤ 0.0001).
Different tendencies of the monounsaturated fatty content were obtained. In addition, when comparing non-fermented samples, the highest content was displayed in wholemeal purple wheat samples (21.33% from the total fatty acids content). However, after fermentation with Lactiplantibacillus plantarum and Liquorilactobacillus uvarum, the monounsaturated fatty content in wholemeal purple wheat was reduced. Conversely, in samples fermented with Pediococcus acidilactici, an increase in monounsaturated fatty acid content was detected. Furthermore, fermentation with any of the tested LAB strains increased monounsaturated fatty acid content in wholemeal ‘Gaja’ wheat cereal. Moreover, it also increased monounsaturated fatty acid content in wholemeal waxy wheat cereal samples fermented with Lactiplantibacillus plantarum, in wholemeal blue wheat cereal samples fermented with Liquorilactobacillus uvarum fermented, and, finally, in wholemeal purple wheat cereal samples fermented with Pediococcus acidilactici. A multivariate test of between-subjects effects showed that the type of LAB strain used for fermentation and its interaction with the wholemeal wheat variety had a significant effect on the monounsaturated fatty acid content of wholemeal wheat flours (p = 0.038).
When analysing polyunsaturated fatty acids in non-fermented samples, the highest content was found in wholemeal ‘Gaja’ wheat cereal. In turn, in fermented samples, different tendencies were established, and, in most of the cases, fermentation increased the polyunsaturated fatty acid content of wholemeal wheat cereal samples, viz.: in wholemeal ‘Gaja’, waxy and blue wheat cereal samples fermented with Pediococcus acidilactici; in wholemeal waxy and purple wheat cereal samples fermented with Liquorilactobacillus uvarum; and in wholemeal blue and purple wheat cereal samples fermented with Lactiplantibacillus plantarum fermented. However, analysed factors were not significant in the polyunsaturated fatty acid content of wholemeal cereal samples.
Comparing the omega-3 (ω-3), omega 6 (ω-6) and omega 9 (ω-9) content, fermentation reduced ω-3 content in wholemeal waxy, blue and purple wheat cereal samples fermented with Lactiplantibacillus plantarum, as well as in wholemeal blue and purple wheat cereal samples fermented with Liquorilactobacillus uvarum, and in wholemeal purple wheat cereal samples fermented with Pediococcus acidilactici. A lower content of ω-6 after fermentation was found in wholemeal ‘Gaja’ and blue wheat cereal samples fermented with Liquorilactobacillus uvarum, and in wholemeal ‘Gaja’ and waxy wheat cereal samples fermented with Lactiplantibacillus plantarum. Moreover, fermentation with Lactiplantibacillus plantarum reduced ω-9 content in both wholemeal colored wheat samples; fermentation with Pediococcus acidilactici and Liquorilactobacillus uvarum reduced ω-9 content in wholemeal waxy wheat; and finally, fermentation with Pediococcus acidilactici and Liquorilactobacillus uvarum was a significant factor on reducing ω-9 content in wholemeal blue and purple wheat samples, respectively. Multivariate test of between-subjects effects showed that the LAB strain used for fermentation and its interaction with wholemeal wheat variety interaction was significant on ω-6 content of wholemeal wheat cereal samples (p ≤ 0.050). However, analysed factors and their interaction were not significant on ω-3 and ω-9 concentrations of wholemeal cereal samples.
When analysing the content of individual fatty acids in wholemeal wheat samples, the results unveiled that the dominant fatty acids in all wholemeal wheat cereal samples were linoleic acid (C18:2), palmitic acid (C16:0), octadec-9-enoic acid (C18:1 cis, trans), stearic acid (C18:0) and α-linolenic acid (C18:3 α) (Figure 3). Moreover, fermented samples revealed a wider variety of individual fatty acids. In most of the fermented samples, tetradecanoic acid (C14:0) was formed, with the highest content observed in DS8548-7 Li.u wholemeal samples (2.24% of the total fatty acid content). Moreover, six fermented samples showed, in their fatty acid profile, the presence of palmitoleic acid (C16:1), and the highest concentration of C16:1 was found in DS8888-3-6 La.p cereal wholemeal (0.682% from the total fatty acid content). Cis-5,8,11,14-eicosatetraenoic acid (C20:4) accounted for just 4 out of 16 analysed wholemeal samples, and its content ranged from 0.051 to 0.527% of the total fatty acid content (in DS8888-3-6 Pa and DS8888-3-6 La.p, respectively). Cis-13-docosenoic acid (C22:1) (4.88% from the total fat content) and cis-15-tetracosenoic acid (C24:1) (0.367% from the total fat content) were formed just in ‘Gaja’La.p samples. Moreover, tricosanoic acid (C23:0) was just found in ‘Gaja’Pa and DS8888-3-6 La.p wholemeal cereal samples (0.628 and 1.17% from the total fatty acid content, respectively). Multivariate test of between-subjects effects showed that the type of LAB strain used for fermentation was a significant factor on the concentrations of C14:0, C16:1, C18:0, C18:2, C20:4, C22:1, C23:0 and C24:1 in wholemeal cereals (p ≤ 0.0001, p ≤ 0.0001, p = 0.034, p = 0.023, p ≤ 0.0001, p ≤ 0.0001, p ≤ 0.0001, p ≤ 0.0001, respectively). Moreover, wholemeal wheat variety was a significant factor on the content of C14:0, C16:1, C18:3 α, C20:1, C20:4, C22:1, C23:0 and C24:1 (p ≤ 0.0001, p ≤ 0.0001, p = 0.002, p ≤ 0.0001, p ≤ 0.0001, p ≤ 0.0001, p ≤ 0.0001 and p ≤ 0.0001, respectively). However, the interaction of LAB strain and wheat variety was significant on the concentrations of C14:0, C16:1, C18:0, C18:2, C18:3 α, C20:1, C20:4, C22:1, C23:0 and C24:1 in wholemeal wheat samples (p ≤ 0.0001, p ≤ 0.0001, p = 0.004, p ≤ 0.0001, p ≤ 0.001, p ≤ 0.0001, p ≤ 0.0001, p ≤ 0.0001, respectively).
It was reported that cereal grains are rich in unsaturated fatty acids as well as are a good source of essential polyunsaturated fatty acids (namely, linoleic and linolenic acids) [99]. Wheat lipids also contain saturated fatty acids [palmitic (20.5%) and stearic acids (1.5%)]. The fatty acids composition of wheat grain makes from a nutritional point of view the cereals balanced foodstuffs [99].
Dominant unsaturated fatty acids in wheat are C18:2, C18:1, C18:3 and C16:1 (which includes two essential ones to know: linoleic and linolenic acids) [99]. Essential fatty acids are involved in many metabolic processes, including cholesterol metabolism [100,101,102]. The fatty acid profile of wheat is dependent on many factors, including genetics [103], environmental conditions and agronomic practices [100,103,104]. It was reported that durum and hard red wheat have a higher lipid content and distinct fatty acid profile in comparison with soft white wheat [99]. Moreover, cold weather can increase the total lipid concentration and the unsaturated fatty acid content in wheat cereal grains [105]. Bottari et al. reported more than 60 fatty acids in wheat cereal, with even numbers of carbon atoms from C12 to C30 as well as C15 and C17. The major fatty acids were saturated and unsaturated C16 and C18 and, particularly, C16:0, C18:1 and C18:2, which together represented around 90% of the total [106]. However, the main fatty acids in wheat cereals are C16:0, C18:0, C18:1, C18:2 and C18:3, and other fatty acid contents represent, on average, 1–2%. The differences in wheat fatty acid profile reported in different studies are explained by the different genetic, climatic and agronomical conditions, as well as the interaction between genotype × year × treatment as the main factor towards the variability of the fatty acid concentration observed in durum wheat samples [104]. Armanino et al. reported that the fatty acid profile of durum wheat is influenced by the cultivar [103]. In addition, variation in saturated and unsaturated fatty acids within the same wheat cereal grain variety can be obtained, and both biotic and abiotic stresses are related to these differences [105,107]. Finally, the fatty acid composition and level of unsaturation also vary according to the type of cereal, for example, when comparing maize and rye flours [108,109,110,111,112]. Regarding the fatty acid content, this study showed that in addition to the wheat variety, the process of fermentation is a significant factor on most of the fatty acid content in wholemeal wheat cereal grain. Finally, the changes of fatty acid profile during the biotechnological processes should also be taken into consideration to achieve the best technological and nutritional characteristics of the cereal-based end product.

4. Conclusions

Although coloured wheat grain has attracted attention due to its anti-inflammatory, antimicrobial and other desirable biological activities, the reported data, especially about the impact of fermentation, are still scarce. Therefore, this work contributes to the knowledge of the impact of LAB (Pediococcus acidilactici, Liquorilactobacillus uvarum and Lactiplantibacillus plantarum) fermentation on acidity, microbiological and colour traits, fatty and amino acid profiles, gamma-aminobutyric acid and biogenic amine concentrations, macro- and microelement contents in wholemeal cereal grains of ‘Gaja’ (traditional wheat) and new breed lines DS8888-3-6 (waxy wheat), DS8548-7 (blue wheat) and DS8535-2 (purple wheat). As our study indicated, due to the good viability of LAB and obtained low pH values in tested samples, all wholemeal wheat varieties were an appropriate substrate for fermentation with selected LAB strains. In most of the samples, essential amino acids and GABA content significantly increased after fermentation, while wholemeal ‘Gaja’ and waxy wheat samples contained the most GABA (on average, 2.47 µmol/g). The content of macro- and microelements depended on the wheat variety, while most of the fatty acids in wholemeal cereal grains were significantly affected by the fermentation. In addition to the improved nutritional value of fermented wholemeal wheat flours, some safety aspects, such as the formation of biogenic amines, should be pointed out in the production process, as the total levels of biogenic amines in tested samples ranged from 22.7 (in non-fermented DS8888-3-6) to 416 mg/kg (in DS8548-7 fermented with Lactiplantibacillus plantarum). The results of this study are beneficial for agri-food and feed industries since it gives information on the effect of fermentation on the final characteristics of cereal-based products.

Supplementary Materials

The following supporting information can be downloaded at: https://www.mdpi.com/article/10.3390/fermentation8100563/s1, Supplementary File S1. Field experiments; Supplementary File S2. Analysis of the Amino Acids and Gamma-Aminobutyric Acid; Supplementary File S3. Analysis of the Biogenic Amine Content; Supplementary File S4. Analysis of Macro- and Microelements Content in Grain Wholemeal; Supplementary File S5. Fatty Acid Composition Analysis; Supplementary Table S1. Detailed fatty acids profile of the wheat cereal wholemeal samples; Supplementary Table S2. Images of the wholemeal wheat flour samples (non-fermented flours and fermented baking doughs).

Author Contributions

Conceptualization, E.B. and V.R.; methodology, V.S., E.Z., D.K., E.M., V.B., A.B., Z.L. and V.R.; software, E.M., V.S. and E.Z.; validation, V.S., E.Z., D.K. and E.M.; formal analysis, V.S., E.Z., D.K., A.B. and E.M.; investigation, V.S., E.Z., D.K., E.M., V.B., A.B., R.R., Z.L. and V.R.; resources, E.B., V.B. and V.R.; data curation, V.S., E.Z., D.K., E.M., V.B., A.B., J.M.R., Z.L. and V.R.; writing—original draft preparation, E.B., V.S., E.Z., D.K., R.R. and V.B.; writing—review and editing, E.B., V.R., Z.L., V.S., E.Z., J.M.R. and V.B.; visualization, E.M., V.S. and E.Z.; supervision, E.B., V.R. and J.M.R.; project administration, E.B. All authors have read and agreed to the published version of the manuscript.

Funding

This research received no external funding.

Data Availability Statement

Data available on request due to restrictions e.g., privacy or ethical. The data are not publicly available due to privacy restrictions.

Acknowledgments

The authors gratefully acknowledge the EUREKA Project “SUSFEETECH” (Nr. 01.2.2-MITA-K-702-05-0001). This work is based upon the work from COST Action 18101 SOURDOMICS—Sourdough biotechnology network towards novel, healthier and sustainable food and bioprocesses (https://sourdomics.com/; https://www.cost.eu/actions/CA18101/, accessed on 28 September 2022), where the author E.B. is the Vice-Chair and leader of the working group 6 “Project design and development innovative prototypes of products and small-scale processing technologies” and the author J.M.R. is the Chair and Grant Holder Scientific Representative and is supported by COST (European Cooperation in Science and Technology) (https://www.cost.eu/, accessed on 15 July 2022). COST is a funding agency for research and innovation networks. Regarding the author J.M.R., this work was also financially supported by LA/P/0045/2020 (ALiCE) and UIDB/00511/2020-UIDP/00511/2020 (LEPABE), funded by national funds through FCT/MCTES (PIDDAC).

Conflicts of Interest

The authors declare no conflict of interest.

References

  1. Nakamura, T.; Yamamori, M.; Hirano, H.; Hidaka, S.; Nagamine, T. Production of Waxy (Amylose-Free) Wheats. Mol. Gen. Genet. MGG 1995, 248, 253–259. [Google Scholar] [CrossRef]
  2. Huang, Y.-C.; Lai, H.-M. Noodle Quality Affected by Different Cereal Starches. J. Food Eng. 2010, 97, 135–143. [Google Scholar] [CrossRef]
  3. Baik, B.-K.; Lee, M.-R. Effects of Starch Amylose Content of Wheat on Textural Properties of White Salted Noodles. Cereal Chem. 2003, 80, 304–309. [Google Scholar] [CrossRef]
  4. Sasaki, T.; Yasui, T.; Matsuki, J. Effect of Amylose Content on Gelatinization, Retrogradation, and Pasting Properties of Starches from Waxy and Nonwaxy Wheat and Their F1 Seeds. Cereal Chem. 2000, 77, 58–63. [Google Scholar] [CrossRef]
  5. Blazek, J.; Copeland, L. Pasting and Swelling Properties of Wheat Flour and Starch in Relation to Amylose Content. Carbohydr. Polym. 2008, 71, 380–387. [Google Scholar] [CrossRef]
  6. Zhang, H.; Zhang, W.; Xu, C.; Zhou, X. Morphological Features and Physicochemical Properties of Waxy Wheat Starch. Int. J. Biol. Macromol. 2013, 62, 304–309. [Google Scholar] [CrossRef] [PubMed]
  7. Zhou, C.; Sun, Y.; Yao, Y.; Li, H.; He, J. Study of Noodle Quality Based on Protein Properties of Three Wheat Varieties. J. Food Qual. 2022, 2022, e6383080. [Google Scholar] [CrossRef]
  8. Rausch, K.D.; Singh, V. Crops–Cereals. In Food Processing Principles and Applications; Wiley-Blackwell: New York, NY, USA, 2014; pp. 293–304. [Google Scholar]
  9. Song, J.M.; Liu, A.F.; You, M.S.; Li, B.Y.; Wu, X.Y.; Zhan, Z.D.; Liu, G.T. Effects of Waxy Flour Blending on Starch Pasting Properties and Noodle Quality of Non Waxy Flour. Sci. Agric. Sin. 2004, 37, 1838–1842. [Google Scholar]
  10. Aifeng, L.; Ran, H.; Dungong, C.; Haosheng, L.; Xinyou, C.; Jianmin, S.; Cheng, L.; Jun, G.; Faji, L.; Shengnan, Z.; et al. Applicability of Waxy Wheat Variety for Improving the Quality of Noodle and Steamed Bread. Int. J. Nutr. Food Sci. 2021, 10, 72. [Google Scholar] [CrossRef]
  11. Gupta, R.; Meghwal, M.; Prabhakar, P.K. Bioactive Compounds of Pigmented Wheat (Triticum Aestivum): Potential Benefits in Human Health. Trends Food Sci. Technol. 2021, 110, 240–252. [Google Scholar] [CrossRef]
  12. Lachman, J.; Martinek, P.; Kotíková, Z.; Orsák, M.; Šulc, M. Genetics and Chemistry of Pigments in Wheat Grain—A Review. J. Cereal Sci. 2017, 74, 145–154. [Google Scholar] [CrossRef]
  13. Mbarki, S.; Sytar, O.; Zivcak, M.; Abdelly, C.; Cerda, A.; Brestic, M. Anthocyanins of Coloured Wheat Genotypes in Specific Response to Salstress. Molecules 2018, 23, 1518. [Google Scholar] [CrossRef] [PubMed] [Green Version]
  14. Paznocht, L.; Kotíková, Z.; Šulc, M.; Lachman, J.; Orsák, M.; Eliášová, M.; Martinek, P. Free and Esterified Carotenoids in Pigmented Wheat, Tritordeum and Barley Grains. Food Chem. 2018, 240, 670–678. [Google Scholar] [CrossRef] [PubMed]
  15. Sharma, N.; Kumari, A.; Chunduri, V.; Kaur, S.; Banda, J.; Goyal, A.; Garg, M. Anthocyanin Biofortified Black, Blue and Purple Wheat Exhibited Lower Amino Acid Cooking Losses than White Wheat. LWT 2022, 154, 112802. [Google Scholar] [CrossRef]
  16. Sharma, S.; Chunduri, V.; Kumar, A.; Kumar, R.; Khare, P.; Kondepudi, K.K.; Bishnoi, M.; Garg, M. Anthocyanin Bio-Fortified Colored Wheat: Nutritional and Functional Characterization. PLoS ONE 2018, 13, e0194367. [Google Scholar]
  17. Sharma, N.; Tiwari, V.; Vats, S.; Kumari, A.; Chunduri, V.; Kaur, S.; Kapoor, P.; Garg, M. Evaluation of Anthocyanin Content, Antioxidant Potential and Antimicrobial Activity of Black, Purple and Blue Colored Wheat Flour and Wheat-Grass Juice against Common Human Pathogens. Molecules 2020, 25, 5785. [Google Scholar] [CrossRef]
  18. Sharma, S.; Kapoor, P.; Kaur, S.; Kumari, A.; Sharma, N.; Kumar, A.; Chunduri, V.; Garg, M. Changing Nutrition Scenario: Colored Wheat–A New Perspective. In Physiological, Molecular, and Genetic Perspectives of Wheat Improvement; Springer: Berlin/Heidelberg, Germany, 2021; pp. 71–88. [Google Scholar]
  19. Sytar, O.; Bośko, P.; Živčák, M.; Brestic, M.; Smetanska, I. Bioactive Phytochemicals and Antioxidant Properties of the Grains and Sprouts of Colored Wheat Genotypes. Molecules 2018, 23, 2282. [Google Scholar] [CrossRef] [Green Version]
  20. Tian, S.; Chen, Z.; Wei, Y. Measurement of Colour-Grained Wheat Nutrient Compounds and the Application of Combination Technology in Dough. J. Cereal Sci. 2018, 83, 63–67. [Google Scholar] [CrossRef]
  21. Bartkiene, E.; Bartkevics, V.; Pugajeva, I.; Krungleviciute, V.; Mayrhofer, S.; Domig, K. The Contribution of P. Acidilactici, L. Plantarum, and L. Curvatus Starters and L-(+)-Lactic Acid to the Acrylamide Content and Quality Parameters of Mixed Rye—Wheat Bread. LWT 2017, 80, 43–50. [Google Scholar] [CrossRef]
  22. Bartkiene, E.; Starkute, V.; Katuskevicius, K.; Laukyte, N.; Fomkinas, M.; Vysniauskas, E.; Kasciukaityte, P.; Radvilavicius, E.; Rokaite, S.; Medonas, D.; et al. The Contribution of Edible Cricket Flour to Quality Parameters and Sensory Characteristics of Wheat Bread. Food Sci. Nutr. 2022. [Google Scholar] [CrossRef]
  23. Bartkiene, E.; Lele, V.; Ruzauskas, M.; Domig, K.J.; Starkute, V.; Zavistanaviciute, P.; Bartkevics, V.; Pugajeva, I.; Klupsaite, D.; Juodeikiene, G.; et al. Lactic Acid Bacteria Isolation from Spontaneous Sourdough and Their Characterization Including Antimicrobial and Antifungal Properties Evaluation. Microorganisms 2020, 8, 64. [Google Scholar] [CrossRef] [PubMed] [Green Version]
  24. Badaras, S.; Ruzauskas, M.; Gruzauskas, R.; Zokaityte, E.; Starkute, V.; Klupsaite, D.; Mockus, E.; Klementaviciute, J.; Vadopalas, L.; Zokaityte, G.; et al. Different Creep Compound Feed Formulations for New Born Piglets: Influence on Growth Performance and Health Parameters. Front. Vet. Sci. 2022, 9, 971783. [Google Scholar] [CrossRef] [PubMed]
  25. Bartkiene, E.; Vizbickiene, D.; Bartkevics, V.; Pugajeva, I.; Krungleviciute, V.; Zadeike, D.; Zavistanaviciute, P.; Juodeikiene, G. Application of Pediococcus Acidilactici LUHS29 Immobilized in Apple Pomace Matrix for High Value Wheat-Barley Sourdough Bread. LWT-Food Sci. Technol. 2017, 83, 157–164. [Google Scholar] [CrossRef]
  26. Bartkiene, E.; Bartkevics, V.; Lele, V.; Pugajeva, I.; Zavistanaviciute, P.; Mickiene, R.; Zadeike, D.; Juodeikiene, G. A Concept of Mould Spoilage Prevention and Acrylamide Reduction in Wheat Bread: Application of Lactobacilli in Combination with a Cranberry Coating. Food Control 2018, 91, 284–293. [Google Scholar] [CrossRef]
  27. Cai, H.-L.; Zhu, R.-H.; Li, H.-D. Determination of Dansylated Monoamine and Amino Acid Neurotransmitters and Their Metabolites in Human Plasma by Liquid Chromatography–Electrospray Ionization Tandem Mass Spectrometry. Anal. Biochem. 2010, 396, 103–111. [Google Scholar] [CrossRef] [PubMed]
  28. Ben-Gigirey, B.; Vieites Baaptista de Sousa, J.M.; Villa, T.G.; Barros-Velazquez, J. Histamine and Cadaverine Production by Bacteria Isolated from Fresh and Frozen Albacore (Thunnus alalunga). J. Food Prot. 1999, 62, 933–939. [Google Scholar] [CrossRef]
  29. Evans, J.D. Straightforward Statistics for the Behavioral Sciences; Thomson Brooks/Cole Publishing Co: Belmont, CA, USA, 1996; pp. xxii, 600. ISBN 0-534-23100-4. [Google Scholar]
  30. Kati, K.; Kaisa, P.; Karin, A. Influence and Interactions of Processing Conditions and Starter Culture on Formation of Acids, Volatile Compounds, and Amino Acids in Wheat Sourdoughs. Cereal Chem. 2004, 81, 598–610. [Google Scholar] [CrossRef]
  31. Zhu, F. Anthocyanins in Cereals: Composition and Health Effects. Food Res. Int. 2018, 109, 232–249. [Google Scholar] [CrossRef]
  32. Enaru, B.; Drețcanu, G.; Pop, T.D.; Stǎnilǎ, A.; Diaconeasa, Z. Anthocyanins: Factors Affecting Their Stability and Degradation. Antioxidants 2021, 10, 1967. [Google Scholar] [CrossRef]
  33. Suo, B.; Chen, X.; Wang, Y. Recent Research Advances of Lactic Acid Bacteria in Sourdough: Origin, Diversity, and Function. Curr. Opin. Food Sci. 2021, 37, 66–75. [Google Scholar] [CrossRef]
  34. De Vuyst, L.; Van Kerrebroeck, S.; Harth, H.; Huys, G.; Daniel, H.-M.; Weckx, S. Microbial Ecology of Sourdough Fermentations: Diverse or Uniform? Food Microbiol. 2014, 37, 11–29. [Google Scholar] [CrossRef] [PubMed]
  35. Tomičić, Z.; Pezo, L.; Spasevski, N.; Lazarević, J.; Cabarkapa, I.; Tomicic, R. Diversity of Amino Acids Composition in Cereals. Food Feed Res. 2022, 49, 11–22. [Google Scholar] [CrossRef]
  36. Ferreira, R.R.; Varisi, V.A.; Meinhardt, L.W.; Lea, P.J.; Azevedo, R.A. Are High-Lysine Cereal Crops Still a Challenge? Braz. J. Med. Biol. Res. 2005, 38, 985–994. [Google Scholar] [CrossRef] [PubMed] [Green Version]
  37. Ramadas, S.; Kumar, T.M.K.; Singh, G.P. Wheat Production in India: Trends and Prospects; IntechOpen: London, UK, 2019; ISBN 978-1-78985-450-3. [Google Scholar]
  38. Ufaz, S.; Galili, G. Improving the Content of Essential Amino Acids in Crop Plants: Goals and Opportunities. Plant Physiol. 2008, 147, 954–961. [Google Scholar] [CrossRef] [PubMed] [Green Version]
  39. Caire-Juvera, G.; Vázquez-Ortíz, F.A.; Higuera-Ciapara, I.; Hernández, G. Composición de aminoácidos, calificación química y digestibilidad. Nutr. Hosp. 2013, 28, 365–371. [Google Scholar] [CrossRef]
  40. Siddiqi, R.A.; Singh, T.P.; Rani, M.; Sogi, D.S.; Bhat, M.A. Diversity in Grain, Flour, Amino Acid Composition, Protein Profiling, and Proportion of Total Flour Proteins of Different Wheat Cultivars of North India. Front. Nutr. 2020, 7, 141. [Google Scholar] [CrossRef]
  41. Food and Agriculture Organization of the United Nations (Ed.) Dietary Protein Quality Evaluation in Human Nutrition: Report of an FAO Expert Consultation, 31 March–April 2011, Auckland, New Zealand; FAO food and nutrition paper; Food and Agriculture Organization of the United Nations: Rome, Italy, 2013; ISBN 978-92-5-107417-6. [Google Scholar]
  42. Knežević, D.; Đukić, N.; Madic, M.; Paunović, A.; Zecevic, V. Comparison of Amino Acids Contents in Barley and Wheat. Res. J. Agric. Sci. 2007, 39, 71–76. [Google Scholar]
  43. Wilson, D.C.; Rafii, M.; Ball, R.O.; Pencharz, P.B. Threonine Requirement of Young Men Determined by Indicator Amino Acid Oxidation with Use of L-[1-13C]Phenylalanine. Am. J. Clin. Nutr. 2000, 71, 757–764. [Google Scholar] [CrossRef] [Green Version]
  44. Zafar, S.; Naz, N.; Nazir, S.; Abbas, M.; Khan, A.M. Analysis of Selected Amino Acids in Different Varieties of Wheat Available in Punjab, Pakistan. Chromatogr. Res. Int. 2014, 2014, e867070. [Google Scholar] [CrossRef] [Green Version]
  45. Gheller, M.; Bender, E.; Thalacker-Mercer, A. Safety of Graded-Doses of Histidine in Healthy Adults (P08-062-19). Curr. Dev. Nutr. 2019, 3, nzz044.P08-062-19. [Google Scholar] [CrossRef] [Green Version]
  46. Moro, J.; Tomé, D.; Schmidely, P.; Demersay, T.-C.; Azzout-Marniche, D. Histidine: A Systematic Review on Metabolism and Physiological Effects in Human and Different Animal Species. Nutrients 2020, 12, 1414. [Google Scholar] [CrossRef] [PubMed]
  47. Laze, A.; Arapi, V.; Ceca, E.; Gusho, K.; Pezo, L.; Brahushi, F.; Kneževic, D. Chemical Composition and Amino Acid Content in Different Genotypes of Wheat Flour. Period. Polytech. Chem. Eng. 2019, 63, 618–628. [Google Scholar] [CrossRef]
  48. Jackman, S.R.; Witard, O.C.; Philp, A.; Wallis, G.A.; Baar, K.; Tipton, K.D. Branched-Chain Amino Acid Ingestion Stimulates Muscle Myofibrillar Protein Synthesis Following Resistance Exercise in Humans. Front. Physiol. 2017, 8, 390. [Google Scholar] [CrossRef] [PubMed]
  49. Jiang, X.; Tian, J.; Hao, Z.; Zhang, W. Protein Content and Amino Acid Composition in Grains of Wheat-Related Species. Agric. Sci. China 2008, 7, 272–279. [Google Scholar] [CrossRef]
  50. Bandegan, A.; Golian, A.; Kiarie, E.; Payne, R.L.; Crow, G.H.; Guenter, W.; Nyachoti, C.M. Standardized Ileal Amino Acid Digestibility in Wheat, Barley, Pea and Flaxseed for Broiler Chickens. Can. J. Anim. Sci. 2011, 91, 103–111. [Google Scholar] [CrossRef]
  51. Mayer, R.R.; Cherry, J.H.; Rhodes, D. Effects of Heat Shock on Amino Acid Metabolism of Cowpea Cells 1. Plant Physiol. 1990, 94, 796–810. [Google Scholar] [CrossRef] [Green Version]
  52. Aurisano, N.; Bertani, A.; Reggiani, R. Anaerobic Accumulation of 4-Aminobutyrate in Rice Seedlings; Causes and Significance. Phytochemistry 1995, 38, 1147–1150. [Google Scholar] [CrossRef]
  53. Diana, M.; Quílez, J.; Rafecas, M. Gamma-Aminobutyric Acid as a Bioactive Compound in Foods: A Review. J. Funct. Foods 2014, 10, 407–420. [Google Scholar] [CrossRef]
  54. Di Cagno, R.; De Angelis, M.; Lavermicocca, P.; De Vincenzi, M.; Giovannini, C.; Faccia, M.; Gobbetti, M. Proteolysis by Sourdough Lactic Acid Bacteria: Effects on Wheat Flour Protein Fractions and Gliadin Peptides Involved in Human Cereal Intolerance. Appl. Environ. Microbiol. 2002, 68, 623–633. [Google Scholar] [CrossRef] [Green Version]
  55. Gänzle, M.G.; Loponen, J.; Gobbetti, M. Proteolysis in Sourdough Fermentations: Mechanisms and Potential for Improved Bread Quality. Trends Food Sci. Technol. 2008, 19, 513–521. [Google Scholar] [CrossRef]
  56. Gobbetti, M.; Rizzello, C.G.; Di Cagno, R.; De Angelis, M. How the Sourdough May Affect the Functional Features of Leavened Baked Goods. Food Microbiol. 2014, 37, 30–40. [Google Scholar] [CrossRef] [PubMed]
  57. Paterson, A.; Piggott, J.R. Flavour in Sourdough Breads: A Review. Trends Food Sci. Technol. 2006, 17, 557–566. [Google Scholar]
  58. Bhanwar, S.; Bamnia, M.; Ghosh, M.; Ganguli, A. Use of Lactococcus Lactis to Enrich Sourdough Bread with γ-Aminobutyric Acid. Int. J. Food Sci. Nutr. 2013, 64, 77–81. [Google Scholar] [CrossRef] [PubMed]
  59. Diana, M.; Rafecas, M.; Quílez, J. Free Amino Acids, Acrylamide and Biogenic Amines in Gamma-Aminobutyric Acid Enriched Sourdough and Commercial Breads. J. Cereal Sci. 2014, 60, 639–644. [Google Scholar] [CrossRef]
  60. Okada, T.; Sugishita, T.; Murakami, T.; Murai, H.; Saikusa, T.; Horino, T.; Onoda, A.; Kajimoto, O.; Takahashi, R.; Takahashi, T. Effect of the Defatted Rice Germ Enriched with GABA for Sleeplessness, Depression, Autonomic Disorder by Oral Administration. Nippon Shokuhin Kagaku Kogaku Kaishi J. Jpn. Soc. Food Sci. Technol. 2000, 47, 596–603. [Google Scholar] [CrossRef] [Green Version]
  61. Rizzello, C.G.; Cassone, A.; Di Cagno, R.; Gobbetti, M. Synthesis of Angiotensin I-Converting Enzyme (ACE)-Inhibitory Peptides and γ-Aminobutyric Acid (GABA) during Sourdough Fermentation by Selected Lactic Acid Bacteria. J. Agric. Food Chem. 2008, 56, 6936–6943. [Google Scholar] [CrossRef]
  62. Villegas, J.M.; Brown, L.; de Giori, G.S.; Hebert, E.M. Optimization of Batch Culture Conditions for GABA Production by Lactobacillus Brevis CRL 1942, Isolated from Quinoa Sourdough. LWT-Food Sci. Technol. 2016, 67, 22–26. [Google Scholar] [CrossRef]
  63. Apetrei, I.M.; Apetrei, C. Amperometric Biosensor Based on Diamine Oxidase/Platinum Nanoparticles/Graphene/Chitosan Modified Screen-Printed Carbon Electrode for Histamine Detection. Sensors 2016, 16, 422. [Google Scholar] [CrossRef] [Green Version]
  64. Biji, K.B.; Ravishankar, C.N.; Venkateswarlu, R.; Mohan, C.O.; Gopal, T.K. Biogenic Amines in Seafood: A Review. J. Food Sci. Technol. 2016, 53, 2210–2218. [Google Scholar] [CrossRef]
  65. Askar, A.; Treptow, H. Biogene Amine in Lebensmitteln: Vorkommen, Bedeutung Und Bestimmung; E. Ulmer: Stuttgart, Germany, 1986; ISBN 3-8001-2132-8. [Google Scholar]
  66. Glória, M.B.A.; Tavares-Neto, J.; Labanca, R.A.; Carvalho, M.S. Influence of Cultivar and Germination on Bioactive Amines in Soybeans (Glycine max L. Merril). J. Agric. Food Chem. 2005, 53, 7480–7485. [Google Scholar] [CrossRef]
  67. Thamm, M.; Scholl, C.; Reim, T.; Grübel, K.; Möller, K.; Rössler, W.; Scheiner, R. Neuronal Distribution of Tyramine and the Tyramine Receptor AmTAR1 in the Honeybee Brain. J. Comp. Neurol. 2017, 525, 2615–2631. [Google Scholar] [CrossRef] [PubMed]
  68. Izquierdo, C.; Gómez-Tamayo, J.C.; Nebel, J.-C.; Pardo, L.; Gonzalez, A. Identifying Human Diamine Sensors for Death Related Putrescine and Cadaverine Molecules. PLoS Comput. Biol. 2018, 14, e1005945. [Google Scholar] [CrossRef] [PubMed] [Green Version]
  69. Cardozo, M.; Lima, K.S.; Franca, T.C.; Lima, A.L.S. Aminas Biogênicas: Um Problema de Saúde Pública. Rev. Virtual Quím. 2013, 5, 149–168. [Google Scholar]
  70. Montet, D.; Ray, R.C. Fermented Foods, Part I: Biochemistry and Biotechnology; Taylor & Francis Group: New York, NY, USA, 2020; ISBN 978-0-367-73745-0. [Google Scholar]
  71. Silva, T.M.; Sabaini, P.S.; Evangelista, W.P.; Gloria, M.B.A. Occurrence of Histamine in Brazilian Fresh and Canned Tuna. Food Control 2011, 22, 323–327. [Google Scholar] [CrossRef]
  72. Oliveira, R.B.A.; Evangelista, W.P.; Sena, M.J.; Gloria, M.B.A. Tuna Fishing, Capture and Post-Capture Practices in the Northeast of Brazil and Their Effects on Histamine and Other Bioactive Amines. Food Control 2012, 25, 64–68. [Google Scholar] [CrossRef]
  73. Gomes, M.B.; Pires, B.A.D.; Fracalanzza, S.A.P.; Marin, V.A. The Risk of Biogenic Amines in Food. Cienc. Saude Colet. 2014, 19, 1123. [Google Scholar] [CrossRef] [Green Version]
  74. Gomes Müller, D.; Quadro Oreste, E.; Grazielle Heinemann, M.; Dias, D.; Kessler, F. Biogenic Amine Sensors and Its Building Materials: A Review. Eur. Polym. J. 2022, 175, 111221. [Google Scholar] [CrossRef]
  75. Dabrowski, W.M.; Sikorski, Z.E. Toxins in Food; CRC Press: Boca Raton, FL, USA, 2004; ISBN 0-203-50235-3. [Google Scholar]
  76. U.S. Department of Health and Human Services Food and Drug Administration. Fish and Fishery Products Hazards and Controls Guidance; US Department of Health and Human Services: Rockville, MD, USA, 2011.
  77. Santos, M.H.S. Biogenic Amines: Their Importance in Foods. Int. J. Food Microbiol. 1996, 29, 213–231. [Google Scholar] [CrossRef]
  78. Jākobsone, I.; Kantāne, I.; Zute, S.; Jansone, I.; Bartkevičs, V. Macro-Elements and Trace Elements in Cereal Grains Cultivated in Latvia. Proc. Latv. Acad. Sci. Sect. B Nat. Exact Appl. Sci. 2015, 69, 152–157. [Google Scholar] [CrossRef] [Green Version]
  79. Underwood, B.A.; Smitasiri, S. Micronutrient Malnutrition: Policies and Programs for Control and Their Implications. Annu. Rev. Nutr. 1999, 19, 303–324. [Google Scholar] [CrossRef] [Green Version]
  80. Pietola, L.; Salo, T. Response of P, K, Mg and NO3-N Contents of Carrots to Irrigation, Soil Compaction, and Nitrogen Fertilisation. Agric. Food Sci. Finl. 2000, 9, 319–331. [Google Scholar] [CrossRef]
  81. Hattori, H.; Chino, M. Growth, Cadmium, and Zinc Contents of Wheat Grown on Various Soils Enriched with Cadmium and Zinc. In Plant Nutrition: Food Security and Sustainability of Agro-Ecosystems through Basic and Applied Research; Horst, W.J., Schenk, M.K., Bürkert, A., Claassen, N., Flessa, H., Frommer, W.B., Goldbach, H., Olfs, H.-W., Römheld, V., Sattelmacher, B., et al., Eds.; Developments in Plant and Soil Sciences; Springer: Dordrecht, The Netherlands, 2001; pp. 462–463. ISBN 978-0-306-47624-2. [Google Scholar]
  82. Kashian, S.; Fathivand, A.A. Estimated Daily Intake of Fe, Cu, Ca and Zn through Common Cereals in Tehran, Iran. Food Chem. 2015, 176, 193–196. [Google Scholar] [CrossRef] [PubMed]
  83. Guo, Z.; Zhang, Z.; Xu, P.; Guo, Y. Analysis of Nutrient Composition of Purple Wheat. Cereal Res. Commun. 2012, 41, 293–303. [Google Scholar] [CrossRef]
  84. Kapur, D.; Nath Agarwal, K.; Kumari Agarwal, D. Nutritional Anemia and Its Control. Indian J. Pediatr. 2002, 69, 607–616. [Google Scholar] [CrossRef]
  85. Welch, R.M.; Graham, R.D. Breeding for Micronutrients in Staple Food Crops from a Human Nutrition Perspective. J. Exp. Bot. 2004, 55, 353–364. [Google Scholar] [CrossRef]
  86. Choi, Y.; Jeong, H.-S.; Lee, J. Antioxidant Activity of Methanolic Extracts from Some Grains Consumed in Korea. Food Chem. 2007, 103, 130–138. [Google Scholar] [CrossRef]
  87. Milder, I.E.; Arts, I.C.; van de Putte, B.; Venema, D.P.; Hollman, P.C. Lignan Contents of Dutch Plant Foods: A Database Including Lariciresinol, Pinoresinol, Secoisolariciresinol and Matairesinol. Br. J. Nutr. 2005, 93, 393–402. [Google Scholar] [CrossRef]
  88. Hosseinian, F.S.; Beta, T. Saskatoon and Wild Blueberries Have Higher Anthocyanin Contents than Other Manitoba Berries. J. Agric. Food Chem. 2007, 55, 10832–10838. [Google Scholar] [CrossRef]
  89. Li, W.; Beta, T. Flour and Bread from Black-, Purple-, and Blue-Colored Wheats. In Flour and Breads and Their Fortification in Health and Disease Prevention; Elsevier: Amsterdam, The Netherlands, 2011; pp. 59–67. [Google Scholar]
  90. He, Y.Z.; Ning, J.F. Analysis of Nutrition Composition in the Special Purple Grain Wheat “Qinhei 1” Containing Rich Fe and Zn. J. Northwest Agric. For. Univ. 2003, 31, 87–90. [Google Scholar]
  91. Blanco, A. Quimica Biologica/Biological Chemistry; AbeBooks: Victoria, BC, Canada, 2006; ISBN 13: 9789500204224. [Google Scholar]
  92. Hurley, S.W.; Johnson, A.K. The Biopsychology of Salt Hunger and Sodium Deficiency. Pflüg. Arch.-Eur. J. Physiol. 2015, 467, 445–456. [Google Scholar] [CrossRef] [Green Version]
  93. Moll, R.; Davis, B. Iron, Vitamin B12 and Folate. Medicine 2017, 45, 198–203. [Google Scholar] [CrossRef]
  94. Weaver, C.M.; Heaney, R.P. Calcium and Human Health, 1st ed.; Humana Press Inc: Totowa, NJ, USA, 2006. [Google Scholar]
  95. EFSA Dietary Reference Values|EFSA. Available online: https://www.efsa.europa.eu/en/topics/topic/dietary-reference-values (accessed on 27 September 2022).
  96. Fotedar, A.; Bhasin, J.S.; Chakravarty, A.; Kulkarni, A.; Bhalla, G.; Anwar, F.; Rao, S. Effectiveness of Iron-Fortified Infant Cereals on Hemoglobin Levels of Children Aged 12–24 Months: A Cross-Sectional Study from New Delhi, India. J. Fam. Med. Prim. Care 2018, 7, 77. [Google Scholar]
  97. Banerjee, P.; Bhattacharya, P. Investigating Cobalt in Soil-Plant-Animal-Human System: Dynamics, Impact and Management. J. Soil Sci. Plant Nutr. 2021, 21, 2339–2354. [Google Scholar] [CrossRef]
  98. Chasapis, C.T.; Ntoupa, P.-S.A.; Spiliopoulou, C.A.; Stefanidou, M.E. Recent Aspects of the Effects of Zinc on Human Health. Arch. Toxicol. 2020, 94, 1443–1460. [Google Scholar] [CrossRef]
  99. Rosentrater, K.A.; Evers, A.D. Chapter 4—Chemical Components and Nutrition. In Kent’s Technology of Cereals, 5th ed.; Rosentrater, K.A., Evers, A.D., Eds.; Woodhead Publishing Series in Food Science, Technology and Nutrition; Woodhead Publishing: Cambridge, UK, 2018; pp. 267–368. ISBN 978-0-08-100529-3. [Google Scholar]
  100. Lafiandra, D.; Masci, S.; Sissons, M.; Dornez, E.; Delcour, J.; Courtin, C.; Caboni, M.F. Kernel Components of Technological Value. In Durum Wheat Chemistry and Technology; AACC International Press: Washington, DC, USA, 2012; pp. 85–124. [Google Scholar]
  101. Russo, G.L. Dietary N-6 and n-3 Polyunsaturated Fatty Acids: From Biochemistry to Clinical Implications in Cardiovascular Prevention. Biochem. Pharmacol. 2009, 77, 937–946. [Google Scholar] [CrossRef]
  102. Mozaffarian, D.; Wu, J.H.Y. Omega-3 Fatty Acids and Cardiovascular Disease: Effects on Risk Factors, Molecular Pathways, and Clinical Events. J. Am. Coll. Cardiol. 2011, 58, 2047–2067. [Google Scholar] [CrossRef] [Green Version]
  103. Armanino, C.; De Acutis, R.; Rosa Festa, M. Wheat Lipids to Discriminate Species, Varieties, Geographical Origins and Crop Years. Anal. Chim. Acta 2002, 454, 315–326. [Google Scholar] [CrossRef]
  104. Beleggia, R.; Platani, C.; Nigro, F.; De Vita, P.; Cattivelli, L.; Papa, R. Effect of Genotype, Environment and Genotype-by-Environment Interaction on Metabolite Profiling in Durum Wheat (Triticum durum Desf.) Grain. J. Cereal Sci. 2013, 57, 183–192. [Google Scholar] [CrossRef]
  105. Nejadsadeghi, L.; Maali-Amiri, R.; Zeinali, H.; Ramezanpour, S.; Sadeghzade, B. Membrane Fatty Acid Compositions and Cold-Induced Responses in Tetraploid and Hexaploid Wheats. Mol. Biol. Rep. 2015, 42, 363–372. [Google Scholar] [CrossRef]
  106. Bottari, E.; De Acutis, R.; Festa, M.R. On the Lipid Constituents of Wheat of Different Species, Variety, Origin and Crop Year. Ann. Chim. 1999, 89, 849–862. [Google Scholar]
  107. Upchurch, R.G. Fatty Acid Unsaturation, Mobilization, and Regulation in the Response of Plants to Stress. Biotechnol. Lett. 2008, 30, 967–977. [Google Scholar] [CrossRef]
  108. Rocha, J.M.; Kalo, P.J.; Malcata, F.X. Fatty acid composition of non-starch and starch neutral lipid extracts of portuguese sourdough bread. J. Am. Oil Chem. Soc. 2012, 89, 2025–2045. [Google Scholar] [CrossRef]
  109. Rocha, J.M.; Kalo, P.J.; Malcata, F.X. Composition of neutral lipid classes and content of fatty acids throughout sourdough breadmaking. Eur. J. Lipid Sci. Technol. 2012, 114, 294–305. [Google Scholar] [CrossRef]
  110. Rocha, J.M.; Kalo, P.J.; Malcata, F.X. Neutral lipids in free, bound and starch lipid extracts of flours, sourdough and portuguese sourdough bread, determined by NP-HPLC-ELSD. Cereal Chem. 2011, 88, 400–408. [Google Scholar] [CrossRef]
  111. Rocha, J.M.; Kalo, P.J.; Malcata, F.X. Neutral lipids in non-starch lipid and starch lipid extracts from portuguese sourdough bread. Eur. J. Lipid Sci. Technol. 2010, 112, 1138–1149. [Google Scholar] [CrossRef]
  112. Rocha, J.M.; Kalo PJOllilainen, V.; Malcata, F.X. Separation and identification of neutral cereal lipids by normal phase high-performance liquid chromatography, using evaporative light-scattering and electrospray mass spectrometry for detection. J. Chromatogr. A 2010, 1217, 3013–3025. [Google Scholar] [CrossRef] [PubMed]
Figure 1. Experimental design of this study.
Fermentation 08 00563 g001
Figure 2. Total biogenic amine content (mg/kg) of the wholemeal wheat flour samples (non-fermented flours and fermented baking doughs). Pa—fermented with Pediococcus acidilactici; Li.u—fermented with Liquorilactobacillus uvarum; La.p—fermented with Lactiplantibacillus plantarum.
Fermentation 08 00563 g002
Figure 3. Fatty acid profile of the wholemeal wheat flour samples (non-fermented flours and fermented baking doughs). Pa—fermented with Pediococcus acidilactici; Li.u—fermented with Liquorilactobacillus uvarum; La.p—fermented with Lactiplantibacillus plantarum.
Fermentation 08 00563 g003
Table 1. pH, total titratable acidity (TTA), colour and microbiological characteristics of the wholemeal wheat flour samples (non-fermented flours and fermented baking doughs).
Wholemeal Wheat SamplespHTTA, °NColour Coordinates, NBSLAB Viable Counts, log10 CFU/g
L*a*b*
Traditional Wheat
‘Gaja’6.01 ± 0.01 d,A1.23 ± 0.11 a,B41.94 ± 0.12 a,A4.39 ± 0.09 a,C9.07 ± 0.11 a,A4.54 ± 0.32 a,A
‘Gaja’ Pa4.44 ± 0.02 c,B4.91 ± 0.09 b,A44.11 ± 0.14 b,B4.86 ± 0.07 b,C9.16 ± 0.09 a,C8.48 ± 0.18 b,A,B
‘Gaja’ Li.u4.37 ± 0.02 b,D4.90 ± 0.06 b,A52.11 ± 0.23 c,D4.88 ± 0.06 b,C16.01 ± 0.13 b,D8.52 ± 0.21 b,A,B
‘Gaja’ La.p4.01 ± 0.01 a,C5.00 ± 0.05 b,A54.78 ± 0.15 d,C5.89 ± 0.08 c,C18.93 ± 0.14 c,D8.63 ± 0.14 b,A
Waxy Wheat
DS8888-3-66.11 ± 0.03 d,B1.20 ± 0.03 a,B52.29 ± 0.21 c,D3.06 ± 0.03 a,A14.78 ± 0.22 c,D4.19 ± 0.27 a,A
DS8888-3-6 Pa4.09 ± 0.02 b,A5.22 ± 0.05 b,B48.48 ± 0.35 a,C3.36 ± 0.05 b,A10.77 ± 0.18 a,D8.08 ± 0.14 b,A
DS8888-3-6 Li.u4.20 ± 0.01 c,B5.43 ± 0.04 c,B49.06 ± 0.21 b,C3.54 ± 0.06 c,B11.79 ± 0.21 b,C8.48 ± 0.11 c,A
DS8888-3-6 La.p3.99 ± 0.02 a,C5.61 ± 0.09 d,B52.29 ± 0.19 c,B3.06 ± 0.09 a,A14.78 ± 0.16 c,C8.61 ± 0.16 c,A
Blue Wheat
DS8548-76.18 ± 0.02 d,C1.02 ± 0.11 a,A49.51 ± 0.14 d,C4.10 ± 0.05 d,B12.68 ± 0.15 d,C4.69 ± 0.31 a,A
DS8548-7 Pa4.13 ± 0.02 b,A5.23 ± 0.06 b,B44.04 ± 0.23 b,B3.76 ± 0.11 c,B7.09 ± 0.09 a,B8.16 ± 0.23 b,A
DS8548-7 Li.u4.27 ± 0.02 c,C5.42 ± 0.10 c,B48.21 ± 0.17 c,B2.93 ± 0.09 a,A8.76 ± 0.08 c,B8.49 ± 0.16 b,A
DS8548-7 La.p3.55 ± 0.01 a,A6.10 ± 0.14 d,C41.69 ± 0.25 a,A3.34 ± 0.04 b,B7.65 ± 0.11 b,A8.94 ± 0.22 c,A
Purple Wheat
DS8535-25.98 ± 0.02 d,A1.00 ± 0.05 a,A45.14 ± 0.16 d,B5.93 ± 0.12 b,D11.16 ± 0.12 d,B4.41 ± 0.13 a,A
DS8535-2 Pa4.40 ± 0.02 c,B5.52 ± 0.07 b,C38.68 ± 0.22 b,A6.08 ± 0.08 b,D6.55 ± 0.07 b,A8.74 ± 0.19 b,B
DS8535-2 Li.u3.72 ± 0.03 b,A6.21 ± 0.05 c,C38.00 ± 0.13 a,A5.67 ± 0.06 a,D5.08 ± 0.08 a,A8.92 ± 0.21 b,B
DS8535-2 La.p3.61 ± 0.01 a,B6.30 ± 0.11 c,C41.98 ± 0.16 c,A5.95 ± 0.09 b,C8.10 ± 0.11 c,B8.99 ± 0.17 b,A
TTA—total titratable acidity; L*—lightness; a*—redness (−a* greenness); b*—yellowness (−b* blueness); LAB—lactic acid bacteria; CFU—colony forming units; Pa—fermented with Pediococcus acidilactici; Li.u—fermented with Liquorilactobacillus uvarum; La.p—fermented with Lactiplantibacillus plantarum. The data of pH, TTA and colour coordinates are represented as means (n = 3) ± SE. The data of LAB viable counts are represented as means (n = 5) ± SE. a–d Means with different letters in the column are significantly different between the same variety of the non-treated and fermented samples (p ≤ 0.05). A–D Means with different letters in the column are significantly different between the different variety of samples (between non-treated and between with the same LAB strain treated samples) (p ≤ 0.05).
Table 2. Essential amino acid concentration of the wholemeal wheat flour samples (non-fermented flours and fermented baking doughs).
Wholemeal Wheat SamplesConcentration Essential of Amino Acids in Sample, µmol/g
ThreonineMethionineValinePhenylalanineLeucine/
Isoleucine
LysineHistidine
Traditional Wheat
‘Gaja’0.460 ± 0.026 a,A<0.0200.385 ± 0.020 a,A<0.0200.185 ± 0.010 a,B,C0.360 ± 0.021 a,C<0.020
‘Gaja’ Pa0.823 ± 0.077 d,C0.303 ± 0.014 c,C2.43 ± 0.16 d,C1.18 ± 0.07 b,C5.71 ± 0.22 d,C1.51 ± 0.14 d,B0.169 ± 0.007 b,C
‘Gaja’ Li.u0.624 ± 0.034 b,A0.043 ± 0.003 a,A1.95 ± 0.10 c,C1.25 ± 0.10 b,C4.17 ± 0.25 c,B1.16 ± 0.05 c,B<0.020
‘Gaja’ La.p0.780 ± 0.074 c,A0.146 ± 0.008 b,B1.21 ± 0.04 b,A0.767 ± 0.034 a,B2.95 ± 0.17 b,B0.839 ± 0.044 b,B0.083 ± 0.008 a,A
Waxy Wheat
DS8888-3-60.423 ± 0.040 a,A<0.0200.343 ± 0.034 a,A<0.0200.188 ± 0.012 a,C0.285 ± 0.020 a,B<0.020
DS8888-3-6 Pa0.768 ± 0.029 c,B0.117 ± 0.010 a,A2.01 ± 0.17 d,B0.813 ± 0.058 b,A4.67 ± 0.26 c,B1.07 ± 0.06 c,A0.024 ± 0.001 a,A
DS8888-3-6 Li.u0.591 ± 0.035 b,A0.146 ± 0.008 b,C1.65 ± 0.06 b,B0.788 ± 0.065 a,b,A3.53 ±0.32 b,A1.02 ± 0.04 c,B0.031 ± 0.003 b,A
DS8888-3-6 La.p0.715 ± 0.054 c,A<0.0201.99 ± 0.08 c,C0.695 ± 0.065 a,A3.01 ± 0.26 b,B,C0.583 ± 0.045 b,A<0.020
Blue Wheat
DS8548-70.420 ± 0.019 a,A<0.0200.422 ± 0.019 a,B<0.0200.162 ± 0.013 a,B0.224 ± 0.014 a,A<0.020
DS8548-7 Pa0.656 ± 0.024 c,A0.154 ± 0.009 b,B1.63 ± 0.13 c,A0.857 ± 0.078 b,A,B3.73 ± 0.14 d,A0.946 ± 0.056 d,A0.093 ± 0.004 b,B
DS8548-7 Li.u0.593 ± 0.044 b,A0.061 ± 0.005 a,B1.37 ± 0.09 b,A0.743 ± 0.074 a,b,A3.20 ± 0.11 c,A0.702 ± 0.059 c,A0.027 ± 0.002 a,A
DS8548-7 La.p0.685 ± 0.060 c,A<0.0201.49 ± 0.13 c,B0.641 ± 0.028 a,A2.47 ± 0.22 b,A0.671 ± 0.065 b,A<0.020
Purple Wheat
DS8535-20.440 ± 0.021 a,A<0.0200.430± 0.035 a,B<0.0200.103 ± 0.006 a,A0.321 ± 0.028 a,B,C<0.020
DS8535-2 Pa1.23 ± 0.09 d,D0.477 ± 0.015 c,D3.28 ± 0.31 c,D0.978 ± 0.083 b,B5.46 ± 0.20 c,C2.23 ± 0.20 d,C0.297 ± 0.013 c,D
DS8535-2 Li.u0.791 ± 0.025 b,B0.135 ± 0.007 b,C1.76 ± 0.08 b,B1.07 ± 0.10 b,B3.47 ± 0.30 b,A1.16 ± 0.06 c,B0.145 ± 0.005 b,B
DS8535-2 La.p0.909 ± 0.038 c,B0.100 ± 0.006 a,A1.87 ± 0.11 b,C0.853 ± 0.030 a,C3.54 ± 0.35 b,C0.629 ± 0.049 b,A0.116 ± 0.008 a,B
Pa—fermented with Pediococcus acidilactici; Li.u—fermented with Liquorilactobacillus uvarum; La.p—fermented with Lactiplantibacillus plantarum. The data are represented as means (n = 3) ± SE. a–d Means with different letters in the column are significantly different between the same variety of the non-treated and fermented samples (p ≤ 0.05). A–D Means with different letters in the column are significantly different between the different variety of samples (between non-treated and between with the same LAB strain treated samples) (p ≤ 0.05).
Table 3. Nonessential amino acid and γ-aminobutyric acid concentrations of the wholemeal wheat flour samples (non-fermented flours and fermented baking doughs).
Wholemeal Wheat SamplesConcentration Nonessential of Amino Acids in Sample, µmol/gGABA, µmol/g
ArginineGlutamineSerineAspartic AcidGlutamic AcidGlycineAlanineProlineTyrosine
Traditional Wheat
‘Gaja’0.521 ± 0.018 b,C1.95 ± 0.14 c,A0.971 ± 0.061 a,A0.793 ± 0.068 b,A0.581 ± 0.057 b,D0.895 ± 0.040 a,C1.74 ± 0.16 a,A0.285 ± 0.015 a,A<0.0202.43 ± 0.13 a,C
‘Gaja’ Pa0.221 ± 0.013 a,B3.07 ± 0.15 d,C1.47 ± 0.05 b,B1.38 ± 0.09 c,C0.780 ± 0.023 c,C1.84 ± 0.12 c,B5.98 ± 0.32 c,C1.55 ± 0.06 d,B0.246 ± 0.010 b,B5.32±0.30 b,C
‘Gaja’ Li.u1.09 ± 0.10 c,C1.12±0.05 b,A1.16 ± 0.08 a,B0.686 ± 0.066 a,B0.477 ± 0.016 a,B1.56 ± 0.13 b,B4.28 ± 0.16 b,A1.31 ± 0.07 c,A0.279 ± 0.019 b,B6.37 ± 0.41 c,D
‘Gaja’ La.p0.987 ± 0.071 c,D0.452 ± 0.023 a,B1.42 ± 0.13 a,b,B0.626 ± 0.020 a,C0.470 ± 0.038 a,C1.76 ± 0.11b, c,B4.54 ± 0.40 b,C0.972 ± 0.042 b,A0.055 ± 0.003 a,A6.51 ± 0.42 c,B
Waxy Wheat
DS8888-3-60.578 ± 0.047 b,C1.81 ± 0.10 a,A1.49 ± 0.11 a,b,B0.906 ± 0.036 c,B0.199 ± 0.019 a,A0.527a ± 0.033 A2.11 ± 0.10 a,B0.300 ± 0.025 a,A,B<0.0202.51 ± 0.09 a,C
DS8888-3-6 Pa0.236 ± 0.015 a,B2.66 ± 0.18 b,B1.35 ± 0.11 a,b,B1.15 ± 0.09 c,B0.585 ± 0.045 c,A1.39b ± 0.07 A4.27 ± 0.18 b,B1.39 ± 0.07 b,A0.246 ± 0.007 c,B4.53 ± 0.39 b,B
DS8888-3-6 Li.u0.722 ± 0.054 c,B1.75 ± 0.11 a,B1.26 ± 0.09 a,B0.546 ± 0.051 b,A0.409 ± 0.030 b,A1.33b ± 0.07 A4.07 ± 0.31 b,A1.35 ± 0.05 b,A0.225 ± 0.007 b,A4.87 ± 0.17 b,C
DS8888-3-6 La.p0.227 ± 0.007 a,B1.97 ± 0.18 a,C1.30 ± 0.11 a,b,B0.425 ± 0.027 a,B0.392 ± 0.033 b,B2.06 ± 0.17 c,C4.51 ± 0.31 b,C2.22 ± 0.17 c,C0.191 ± 0.007 a,C7.60 ± 0.24 c,C
Blue Wheat
DS8548-70.370 ± 0.033 b,A2.52 ± 0.23 b,C1.03 ± 0.09 b,A0.893 ± 0.057 c,B0.368 ± 0.024 b,C0.494 ± 0.020 a,A3.03 ± 0.25 a,C0.330 ± 0.028 a,B<0.0202.27 ± 0.21 a,B
DS8548-7 Pa0.337 ± 0.011 a,C2.32 ± 0.22 b,A0.919 ± 0.031 a,A0.954 ± 0.043 d,A0.677 ± 0.048 c,B1.25 ± 0.12 b,A3.56 ± 0.21 a,b,A1.26 ± 0.08 b,A0.198 ± 0.008 b,A3.25 ± 0.29 b,A
DS8548-7 Li.u0.352 ± 0.035 a,b,A2.37 ± 0.08 b,C0.960 ± 0.038 a, b,A0.782 ± 0.07 b,C0.621 ± 0.026 c,D1.18 ± 0.10 b,A3.73 ± 0.37 b,A1.33 ± 0.07 b,A0.210 ± 0.010 b,A3.35 ± 0.13 b,A
DS8548-7 La.p0.846 ± 0.048 c,C0.134 ± 0.004 a,A1.13 ± 0.05 b,A0.147 ± 0.013 a,A0.154 ± 0.009 a,A1.30 ± 0.047 b,A4.15 ± 0.13 c,B1.65 ± 0.15 c,B0.108 ± 0.009 a,B6.06 ± 0.47 c,B
Purple Wheat
DS8535-20.475 ± 0.041 c,B2.01 ± 0.11 a,B1.05 ± 0.06 a,A0.739 ± 0.036 a,A0.245 ± 0.008 a,B0.663 ± 0.054 a,B1.72 ± 0.06 a,A0.336 ± 0.031 a,B<0.0201.56 ± 0.14 a,A
DS8535-2 Pa0.192 ± 0.007 b,A4.31 ± 0.37 d,D1.85 ± 0.11 c,C1.72 ± 0.09 c,D1.22 ± 0.114 d,D2.41 ± 0.12 c,C8.08 ± 0.31 d,D2.16 ± 0.13 c,C0.243 ± 0.023 a,B5.61 ± 0.56 d,C
DS8535-2 Li.u1.21 ± 0.05 d,C3.26 ± 0.30 c,D1.22 ± 0.06 b,B0.894 ± 0.059 b,D0.522 ± 0.021 b,C1.72 ± 0.16 b,B4.28 ± 0.16 c,A1.72 ± 0.15 b,B0.268 ± 0.008 b,B3.97 ± 0.34 c,B
DS8535-2 La.p0.105 ± 0.007 a,A2.77 ± 0.17 b,D1.10 ± 0.10 a,b,A0.849 ± 0.062 b,D0.783 ± 0.055 c,D1.78 ± 0.11 b,B2.68 ± 0.21 b,A1.58 ± 0.15 b,B0.227 ± 0.009 a,D2.82 ± 0.24 b,A
Pa—fermented with Pediococcus acidilactici; Li.u—fermented with Liquorilactobacillus uvarum; La.p—fermented with Lactiplantibacillus plantarum. GABA—γ-aminobutyric acid. The data are represented as means (n = 3) ± SE. a–d Means with different letters in the column are significantly different between the same variety of the non-treated and fermented samples (p ≤ 0.05). A–D Means with different letters in the column are significantly different between the different variety of samples (between non-treated and between with the same LAB strain treated samples) (p ≤ 0.05).
Table 4. Biogenic amine concentration of the wholemeal wheat flour samples (non-fermented flours and fermented baking doughs).
Wholemeal Wheat SamplesBiogenic Amines, mg/kg
TryptaminePhenyl-
ethylamine
PutrescineCadaverineHistamineTyramineSpermidineSpermine
Traditional Wheat
‘Gaja’<0.158.5 ± 3.7 b,B19.9 ± 1.1<0.1<0.1<0.131.8 ± 2.9 B<0.1
‘Gaja’ Pa<0.146.1 ± 2.9 a,A<0.1<0.1<0.1<0.1<0.1<0.1
‘Gaja’ Li.u<0.152.6 ± 4.1 a,b,B<0.194.4 ± 5.4 a,C<0.1<0.1<0.1<0.1
‘Gaja’ La.p<0.152.0 ± 4.8 a,b,C<0.1116.3 ± 8.1 b,B<0.1<0.1<0.1<0.1
Waxy Wheat
DS8888-3-6<0.157.3 ± 4.5 b,B<0.1<0.1<0.1<0.122.7 ± 1.6 A<0.1
DS8888-3-6 Pa<0.142.9 ± 3.8 a,A<0.1<0.1<0.1<0.1<0.1<0.1
DS8888-3-6 Li.u<0.145.9 ± 4.1 a,A,B103.8 ± 7.2a63.6 ± 4.9 a,B<0.1<0.1<0.1<0.1
DS8888-3-6 La.p<0.141.8 ± 3.5 a,B226.2 ± 14.1 b,C127.9 ± 8.2 b,B20.1 ± 1.7 A<0.1<0.1<0.1
Blue Wheat
DS8548-7<0.155.9 ± 4.8 b,B<0.1<0.1<0.1<0.130.9 ± 2.5 a,B<0.1
DS8548-7 Pa<0.140.5 ± 3.1 a,A<0.1<0.1<0.1<0.129.5 ± 2.2 a,B<0.1
DS8548-7 Li.u<0.142.0 ± 2.9 a,A<0.152.4 ± 4.7 a,A<0.1<0.140.6 ± 3.1 b,B<0.1
DS8548-7 La.p<0.139.7 ± 3.0 a,B27.2 ± 1.7 A84.1 ± 5.3 b,A49.9 ± 3.8 B<0.125.7 ± 1.3 a,A<0.1
Purple Wheat
DS8535-2<0.144.1 ± 3.5 b,A<0.1<0.1<0.1<0.1<0.1<0.1
DS8535-2 Pa<0.144.1 ± 4.2 b,A<0.1<0.1<0.1<0.124.5 ± 2.2 a,A<0.1
DS8535-2 Li.u<0.150.9 ± 4.7 b,B<0.1122.6 ± 8.4 a,D<0.1<0.129.8 ± 2.8 b,A<0.1
DS8535-2 La.p<0.130.9 ± 2.9 a,A87.3 ± 6.3 B115.1 ± 9.1 a,B66.3 ± 5.1 C35.6 ± 3.251.8 ± 4.9 c,B20.2 ± 1.3
Pa—fermented with Pediococcus acidilactici; Li.u—fermented with Liquorilactobacillus uvarum; La.p—fermented with Lactiplantibacillus plantarum. The data are represented as means (n = 3) ± SE. a–c Means with different letters in the column are significantly different between the same variety of the non-treated and fermented samples (p ≤ 0.05). A–D Means with different letters in the column are significantly different between the different variety of samples (between non-treated and between with the same LAB strain treated samples) (p ≤ 0.05).
Table 5. Macroelement concentrations of the wholemeal wheat flour samples (non-fermented flours and fermented baking doughs).
Wholemeal Wheat SamplesMacroelements, Dry Matter (d.m.)
Na, g/100gMg, g/kgK, g/kgCa, g/kg
Traditional Wheat
‘Gaja’<0.0020.682 ± 0.053 2.54 ± 0.22 a,B0.210 ± 0.019 a,B
‘Gaja’ Pa0.010 ± 0.002 a,C0.638 ± 0.051 a,B2.32 ± 0.19 a,C0.199 ± 0.018 a,B
‘Gaja’ Li.u0.008 ± 0.001 a,B0.669 ± 0.042 a,C2.38 ± 0.13 a,B0.192 ± 0.019 a,A,B
‘Gaja’ La.p0.007 ± 0.002 a,A0.641 ± 0.050 a,C2.37 ± 0.21 a,B0.189 ± 0.020 a,A
Waxy Wheat
DS8888-3-6<0.0020.448 ± 0.045 a,A1.98 ± 0.17 a,A0.345 ± 0.031 a,C
DS8888-3-6 Pa0.013 ± 0.001 a,C0.501 ± 0.041 a,A2.38 ± 0.23 a,C0.310 ± 0.026 a,C
DS8888-3-6 Li.u0.011 ± 0.002 a,B0.438 ± 0.040 a,A2.20 ± 0.18 a,B0.321 ± 0.027 a,C
DS8888-3-6 La.p0.014 ± 0.001 a,B0.509 ± 0.051 a,A,B2.37 ± 0.23 a,B0.322 ± 0.030 a,C
Blue Wheat
DS8548-7<0.0020.510 ± 0.048 a,A1.93 ± 0.16 a,A0.213 ± 0.018 a,B
DS8548-7 Pa0.003 ± 0.001 a,A0.511 ± 0.027 a,A1.84 ± 0.11 a,A0.205 ± 0.014 a,B
DS8548-7 Li.u0.002 ± 0.002 a,A0.513 ± 0.022 a,A,B1.88 ± 0.09 a,A0.210 ± 0.016 a,B
DS8548-7 La.p0.004 ± 0.001 a,A0.534 ± 0.043 a,B1.82 ± 0.10 a,A0.214 ± 0.012 a,B
Purple Wheat
DS8535-2<0.0020.482 ± 0.041 a,A1.75 ± 0.16 a,A0.173 ± 0.016 a,A
DS8535-2 Pa0.006 ± 0.001 a,B0.458 ± 0.039 a,A1.86 ± 0.20 a,B0.162 ± 0.015 a,A
DS8535-2 Li.u0.006 ± 0.002 a,A,B0.495 ± 0.036 a,A1.77 ± 0.14 a,A0.163 ± 0.012 a,A
DS8535-2 La.p0.006 ± 0.001 a,A0.438 ± 0.034 a,A1.84 ± 0.11 a,A0.162 ± 0.013 a,A
Pa—fermented with Pediococcus acidilactici; Li.u—fermented with Liquorilactobacillus uvarum; La.p—fermented with Lactiplantibacillus plantarum. The data are represented as means (n = 3) ± SE. a Means with different letters in the column are significantly different between the same variety of the non-treated and fermented samples (p ≤ 0.05). A–C Means with different letters in the column are significantly different between the different varieties of samples (between non-treated and between the same LAB strain treated samples) (p ≤ 0.05).
Table 6. Essential microelement concentrations of the wholemeal wheat flour samples (non-fermented flours and fermented baking doughs).
Wholemeal Wheat SamplesEssential Microelements, Dry Matter (d.m.)
CrMnFe CuZn
mg/100 gmg/kg
Traditional Wheat
‘Gaja’<0.01012.8 ± 1.3 a,B24.8 ± 2.1 a,B2.19 ± 0.22 a,C6.56 ± 0.61 a,A
‘Gaja’ Pa<0.01011.7 ± 1.2 a,B22.4 ± 2.0 a,C2.01 ± 0.18 a,C6.46 ± 0.59 a,A
‘Gaja’ Li.u<0.01011.7 ± 1.2 a,B25.0 ± 2.3 a2.14 ± 0.16 a,C6.03 ± 0.42 a,A,B
‘Gaja’ La.p<0.01011.5 ± 1.2 a,B24.8 ± 2.2 a,B2.23 ± 0.18 a,D6.21 ± 0.42 a,A
Waxy Wheat
DS8888-3-60.151 ± 0.014 a7.54 ± 0.71 a,A15.6 ± 1.4 a,A1.14 ± 0.11 a,A,B5.51 ± 0.55 a,A
DS8888-3-6 Pa0.161 ± 0.007 a7.77 ± 0.80 a,A14.6 ± 1.3 a,A1.27 ± 0.13 a,B5.81 ± 0.57 a,A
DS8888-3-6 Li.u0.145 ± 0.025 a7.69 ± 0.92 a,A15.2 ± 1.7 a,A1.23 ± 0.12 a,A,B5.87 ± 0.42 a,A
DS8888-3-6 La.p0.158 ± 0.014 a7.71 ± 1.0 a,A15.9 ± 1.6 a,A1.22 ± 0.19 a,C5.74 ± 0.53 a,A
Blue Wheat
DS8548-7<0.01015.6 ± 1.3 a,C16.2 ± 1.6 a,A0.973 ± 0.097 a,A6.65 ± 0.63 a,A
DS8548-7 Pa<0.01015.4 ± 1.2 a,C15.0 ± 1.1 a,A0.926 ± 0.073 a,A,B6.73 ± 0.50 a,A
DS8548-7 Li.u<0.01014.1 ± 1.1 a,C16.7 ± 1.2 a,A0.938 ± 0.074 a,A6.38 ± 0.51 a,A,B
DS8548-7 La.p<0.01015.3 ± 1.0 a,C16.5 ± 1.2 a,A0.921 ± 0.071 a,B6.43 ± 0.58 a,A,B
Purple Wheat
DS8535-2<0.01017.8 ± 1.5 a,C16.6 ± 1.7 a,A0.805 ± 0.081 a,A8.31 ± 0.79 a,B
DS8535-2 Pa<0.01016.1 ± 1.3 a,C17.3 ± 1.8 a,A,B0.797 ± 0.080 a,A7.94 ± 0.75 a,A,B
DS8535-2 Li.u<0.01017.9 ± 1.2 a,D16.7 ± 1.5 a,A0.775 ± 0.078 a,A7.57 ± 0.72 a,B
DS8535-2 La.p<0.01017.4 ± 1.2 a,C17.0 ± 1.3 a,A0.764 ± 0.070 a,A7.54 ± 0.61 a,B
Pa—fermented with Pediococcus acidilactici; Li.u—fermented with Liquorilactobacillus uvarum; La.p—fermented with Lactiplantibacillus plantarum. The data are represented as means (n = 3) ± SE. a Means with different letters in the column are significantly different between the same variety of the non-treated and fermented samples (p ≤ 0.05). A–D Means with different letters in the column are significantly different between the different variety of samples (between non-treated and between with the same LAB strain treated samples) (p ≤ 0.05).
Table 7. Non-essential microelement concentrations of the wholemeal wheat flour samples (non-fermented flours and fermented baking doughs).
Wholemeal Wheat SamplesNon-Essential Microelements, mg/kg (d.m.)
AsRbSrCdBaPb
Traditional Wheat
‘Gaja’0.007 ± 0.001 a1.44 ± 0.14 a0.963 ± 0.091 a,A0.054 ± 0.005 a,C2.35 ± 0.24 a,A0.012 ± 0.001 a,A
‘Gaja’ Pa0.009 ± 0.002 a1.36 ± 0.12 a0.976 ± 0.083 a,A0.053 ± 0.006 a,D2.21 ± 0.19 a,A0.014 ± 0.002 a,A
‘Gaja’ Li.u0.008 ± 0.001 a1.41 ± 0.10 a0.984 ± 0.074 a,A0.057 ± 0.004 a,D2.33 ± 0.22 a,A0.013 ± 0.001 a,A
‘Gaja’ La.p0.008 ± 0.002 a1.43 ± 0.11 a0.962 ± 0.087 a,A0.058 ± 0.005 a,D2.36 ± 0.23 a,A0.012 ± 0.001 a,A
Waxy Wheat
DS8888-3-6<0.005<11.50 ± 0.13 a,B0.029 ± 0.003 a,B2.22 ± 0.21 a,A<0.010
DS8888-3-6 Pa<0.005<11.46 ± 0.12 a,A0.033 ± 0.003 a,C2.45 ± 0.25 a,A,B<0.010
DS8888-3-6 Li.u<0.005<11.42 ± 0.13 a,B0.035 ± 0.004 a,C2.23 ± 0.22 a,A<0.010
DS8888-3-6 La.p<0.005<11.52 ± 0.14 a,B0.034 ± 0.004 a,C2.35 ± 0.26 a,A<0.010
Blue Wheat
DS8548-7<0.005<12.58 ± 0.26 D0.021 ± 0.002 a,A2.90 ± 0.29 a,B<0.010
DS8548-7 Pa<0.005<12.59 ± 0.20 C0.020 ± 0.001 a,B2.78 ± 0.26 a,B<0.010
DS8548-7 Li.u<0.005<12.66 ± 0.19 D0.022 ± 0.001 a,B2.83 ± 0.20 a,B<0.010
DS8548-7 La.p<0.005<12.63 ± 0.21 D0.023 ± 0.002 a,B2.69 ± 0.25 a,A<0.010
Purple Wheat
DS8535-2<0.005<12.00 ± 0.20 a,C0.019 ± 0.003 a,A<20.032 ± 0.003 a,B
DS8535-2 Pa<0.005<11.97 ± 0.19 a,B0.016 ± 0.002 a,A<20.029 ± 0.002 a,B
DS8535-2 Li.u<0.005<11.90 ± 0.14 a,C0.017 ± 0.003 a,A<20.031 ± 0.003 a,B
DS8535-2 La.p<0.005<11.87 ± 0.17 a,C0.016 ± 0.002 a,A<20.028 ± 0.003 a,B
Pa—fermented with Pediococcus acidilactici; Li.u—fermented with Liquorilactobacillus uvarum; La.p—fermented with Lactiplantibacillus plantarum. The data are represented as means (n = 3) ± SE. a Means with different letters in the column are significantly different between the same variety of the non-treated and fermented samples (p ≤ 0.05). A–D Means with different letters in the column are significantly different between the different variety of samples (between non-treated and between with the same LAB strain treated samples) (p ≤ 0.05).
Table 8. Fatty acid composition (% from the total fatty acid content) of the wholemeal wheat flour samples (non-fermented flours and fermented baking doughs).
Wholemeal Wheat SamplesFatty Acid Composition, % from the Total Fatty Acid Content
SFAMUFAPUFAOmega-3 (ω-3)Omega-6 (ω-6)Omega-9 (ω-9)
Traditional Wheat
‘Gaja’29.85 ± 0.09 c,A16.07 ± 0.08 a,B54.08 ± 0.25 c,D3.22 ± 0.06 a,A50.86 ± 0.32 c,C16.07 ± 0.11 a,A
‘Gaja’ Pa26.38 ± 0.06 b,C17.51 ± 0.05 b,C56.11 ± 0.21 d,B4.48 ± 0.11 b,C51.63 ± 0.29 d,B17.51 ± 0.06 b,C
‘Gaja’ Li.u26.31 ± 0.04 b,C21.34 ± 0.12 c,D52.35 ± 0.17 b,B11.85 ± 0.23 d,D40.50 ± 0.25 a,A21.34 ± 0.14 c,D
‘Gaja’ La.p24.73 ± 0.11 a,A24.84 ± 0.14 d,D50.44 ± 0.22 a,C6.20 ± 0.10 c,D44.24 ± 0.23 b,B24.84 ± 0.13 d,D
Waxy Wheat
DS8888-3-634.54 ± 0.12 c,C16.54 ± 0.11 b,C48.92 ± 0.11 b,C3.39 ± 0.09 b,B45.53 ± 0.26 b,B16.54 ± 0.14 b,B
DS8888-3-6 Pa22.26 ± 0.08 b,A15.10 ± 0.10 a,A62.64 ± 0.23 c,D4.78 ± 0.11 c,D57.86 ± 0.19 d,D15.10 ± 0.13 a,A
DS8888-3-6 Li.u21.06 ± 0.14 a,A15.23 ± 0.12 a,A63.71 ± 0.35 d,D8.18 ± 0.14 d,C55.52 ± 0.22 c,C15.23 ± 0.10 a,A
DS8888-3-6 La.p37.73 ± 0.25 d,D23.91 ± 0.15 c,C38.37 ± 0.28 a,A2.17 ± 0.08 a,A36.20 ± 0.14 a,A23.91 ± 0.19 c,C
Blue Wheat
DS8548-738.14 ± 0.32 c,D16.81 ± 0.22 c,C45.04 ± 0.26 b,A3.46 ± 0.13 c,B41.58 ± 0.21 a,A16.81 ± 0.14 c,B
DS8548-7 Pa24.77 ± 0.18 a,B16.31 ± 0.12 b,B58.92 ± 0.33 d,C3.80 ± 0.09 d,B55.12 ± 0.19 c,C16.31 ± 0.12 b,B
DS8548-7 Li.u38.97 ± 0.15 d,D17.23 ± 0.09 d,B43.80 ± 0.19 a,A2.53 ± 0.07 a,A41.27 ± 0.22 a,B17.23 ± 0.15 d,B
DS8548-7 La.p33.87 ± 0.12 b,B15.12 ± 0.10 a,A51.02 ± 0.17 c,D2.90 ± 0.14 b,B48.11 ± 0.25 b,C15.12 ± 0.10 a,A
Purple Wheat
DS8535-232.01 ± 0.03 c,B21.33 ± 0.13 c,A46.66 ± 0.15 b,B4.71 ± 0.15 c,C41.95 ± 0.15 a,A21.33 ± 0.11 c,C
DS8535-2 Pa31.99 ± 0.14 b,D22.38 ± 0.09 d,D45.63 ± 0.21 a,A2.80 ± 0.10 a,A42.83 ± 0.22 b,A22.38 ± 0.13 d,D
DS8535-2 Li.u21.86 ± 0.12 a,B19.16 ± 0.15 b,C58.99 ± 0.16 d,C3.73 ± 0.09 b,B55.26 ± 0.31 d,C19.15 ± 0.18 b,C
DS8535-2 La.p34.30 ± 0.24 d,C17.98 ± 0.13 a,B47.72 ± 0.32 c,B3.66 ± 0.07 b,C44.06 ± 0.14 c,B17.98 ± 0.15 a,B
Pa—fermented with Pediococcus acidilactici; Li.u—fermented with Liquorilactobacillus uvarum; La.p—fermented with Lactiplantibacillus plantarum. SFA—saturated fatty acids, MUFA—monounsaturated fatty acids, PUFA—polyunsaturated fatty acids. The data are represented as means (n = 3) ± SE. a–d Means with different letters in the column are significantly different between the same variety of the non-treated and fermented samples (p ≤ 0.05). A–D Means with different letters in the column are significantly different between the different variety of samples (between non-treated and between with the same LAB strain treated samples) (p ≤ 0.05).
Publisher’s Note: MDPI stays neutral with regard to jurisdictional claims in published maps and institutional affiliations.

