Article

A Molecular Dynamic Model of Tryptophan Overproduction in Escherichia coli

by
Diego Andrés Castro-López
1,
Luis E. González de la Vara
2,
Moises Santillán
3 and
Agustino Martínez-Antonio
1,*
1
Laboratorio de Ingeniería Biológica, Departamento de Ingeniería Genética, Centro de Investigación y de Estudios Avanzados del Instituto Politécnico Nacional (CINVESTAV-Unidad Irapuato), Km 9.6 Carr. Irapuato-León, Irapuato 36824, Gto, Mexico
2
Laboratorio de Bioenergética y Biomembranas, Departamento de Bioquímica y Biotecnología, Cinvestav Irapuato, Irapuato 36824, Gto, Mexico
3
Cinvestav Unidad Monterrey, Vía del Conocimiento 201, Parque de Investigación e Innovación Tecnológica, Apodaca 66600, NL, Mexico
*
Author to whom correspondence should be addressed.
Fermentation 2022, 8(10), 560; https://doi.org/10.3390/fermentation8100560
Submission received: 6 September 2022 / Revised: 4 October 2022 / Accepted: 9 October 2022 / Published: 20 October 2022

Abstract

:
Several deterministic models simulate the main molecular biology interactions among the numerous mechanisms controlling the dynamics of the tryptophan operon in native strains. However, no models exist to investigate bacterial tryptophan production from a biotechnological point of view. Here, we modified tryptophan models for native production to propose a biotechnological working model that incorporates the activity of tryptophan secretion systems and genetic modifications made in two reported E. coli strains. The resultant deterministic model could emulate the production of tryptophan in the same order of magnitude as those quantified experimentally by the genetically engineered E. coli strains GPT1001 and GPT1002 in shake flasks. We hope this work may contribute to the rational development of biological models that define and include the main parameters and molecular components for designing and engineering efficient biotechnological chassis to produce valuable chemicals.

1. Introduction

L-tryptophan (tryptophan) is an essential amino acid for humans, being one of the three aromatic amino acids (AAAs) that are part of proteins (proteinogenic amino acids) [1]. It is a neutrally charged molecule whose final biosynthesis in bacteria and plants involves condensing an indole molecule and an L-serine. The three aromatic amino acids, L-phenylalanine, L-tyrosine, and L-tryptophan, share a common biosynthetic pathway known as the AAAs general pathway or the pre-chorismate pathway [2]. This common precursor pathway begins with D-erythrose 4-phosphate and phosphoenolpyruvate. It ends with synthesizing chorismate, which gives place to any of the three AAAs [3]. The specific pathway of tryptophan biosynthesis is highly regulated, so the higher the intracellular concentration of tryptophan, the stronger the inhibition of tryptophan synthesis. Three mechanisms are sensitive to the intracellular concentration of tryptophan and exert specific inhibitions: the transcription factor tryptophan repressor (TrpR), transcription attenuation (att), and enzyme feedback inhibition [4] (Figure 1). This over-regulation is probably related to the chemical complexity of the tryptophan molecule, which, requires considerable resources to be biosynthesized [5].
The tryptophan operon is one of the most extensively studied biological control systems, maybe only behind the lac operon. Several models describe the dynamics of the tryptophan operon [6,7,8,9,10,11,12]. Most of them include one or several of the regulatory mechanisms of the tryptophan operon, while few include the dynamics of tryptophan transport from and to the extracellular milieu [13,14,15,16]. Outstandingly, the models proposed by Santillán and Mackey [17] and Santillán and Zeron [18] include all the known mechanisms of regulation of the tryptophan operon. Both models successfully reproduced the enzymatic activity of anthranilate synthase during derepression experiments. The anthranilate synthase activity, TrpE, represents the six reactions for tryptophan synthesis, starting from chorismate. This assumption is reasonable since TrpE is the only enzyme subject to feedback inhibition and thus is the bottleneck of the biosynthetic pathway. Few models include elements for importing tryptophan from the media [7,11] or their secretion from the cell to the milieu [13,16]. The authors usually utilize a previously proposed expression to represent the transport dynamics [6]. Until very recently, we did not know the magnitude of the contribution of passive and active transport to the overall flux of tryptophan. Based on the thermodynamic and chemical characteristics of tryptophan, authors speculated that tryptophan should be able to passively cross the cell membrane and that such flux could be considerable [19,20,21,22,23]. However, more recently, new information suggests that tryptophan transport is a secondary active process [24,25,26].
Thus, in this work, we adopted one of the existing models to account for the dynamics of tryptophan expulsion for overproducing strains. We further adapted the model to include genetic modifications of a couple of overproducing E. coli strains. In such a way, we reproduced the same order of magnitude in the final tryptophan production that was experimentally observed. Below, we briefly address the natural mechanisms of tryptophan regulation. Then, we explain the central elements included in the model proposed by Santillán and Zeron [18] (our base model). Afterward, we describe the approaches and modifications applied to this base model. Finally, we show the results compared to experimentally reported data and make some concluding remarks.

2. Materials and Methods

2.1. The Tryptophan Operon

In E. coli, the tryptophan operon is subject to negative control by three different mechanisms whose grade of repression is proportional to the intracellular tryptophan concentration, either directly or indirectly. The TrpR transcription factor exerts trp operon repression by blocking the beginning of its transcription. TrpR is a homodimer of 25 kDa each that is unbinding to DNA unless they bind to a pair of tryptophan molecules, which act as corepressors [27]. At least five different transcriptional units make up the TrpR regulon, namely trpLEDCBA, mtr, aroL, aroH, and trpR [28]. The homodimer concentration within the cell varies from 120 to 375 dimers per cell at any moment, capable of repressing the expression of the trp operon by about 80-fold when tryptophan is >10 µM [29,30].
The second element regulating tryptophan production is transcriptional attenuation. Kasai introduced this term to refer to a new regulatory mechanism found in the leader region of his operon [31]. By that time, Yanofski also had trouble explaining how it was possible that mutants lacking TrpR still exhibited severe repression over the trp operon. He arrived at the same conclusion as Kasai: there had to be a “regulated transcription termination site…” in the leader region of these operons [32]. The trp operon has a leader sequence of 162 base pairs preceding the structural genes. Within the leader region, another “attenuator“ subregion is responsible for forming the terminator and anti-terminator structures. These secondary structures are mutually exclusive when the mRNA grows during the transcription of the leader region. These loop mechanisms are sensitive to the concentration of charged tRNATrp within the cell so that transcription halts in the order of eight folds under circumstances of unlimited tRNATrp. Together, transcription and attenuation repress the trp operon expression by about 600 folds [33].
The third element regulating tryptophan biosynthesis is anthranilate synthase feedback inhibition [34]. The terminal pathway of tryptophan biosynthesis begins with this enzyme. Although this is the first reaction of the path, it occurs in conjunction with the second reaction, which consists of the conversion of anthranilate to N-(5-phosphoribosyl)-anthranilate. The same heterotetramer comprises four polypeptides, two units of each trpE and trpD [35]. The tryptophan molecule induces structural changes affecting the aggregate, thus inhibiting the anthranilate synthase at a concentration of >10 µM tryptophan.

2.2. The Tryptophan Biosynthesis Mathematical Models

As previously mentioned, all the models proposed to date that describe the dynamics of the tryptophan operon do not consider or simplify tryptophan transport. Thus, we started working with a model previously proposed by Santillán and Zeron [18]. The overall model comprises three differential Equations (1)–(3), with Equation (2) containing a slight delay (MτE) (see below).
Fermentation 08 00560 i001
d M d t = k M O t o t P K P 1 + P K P + R t o t K R T T + K T 2 1 + 2 α T K G + T 1 + α T K G + T 2 γ M + μ M
d E t o t d t = 1 2 k E M τ E γ E + μ E t o t
d T t o t d t = k T E ρ T K ρ + T μ T t o t
E = E t o t K I T + K I 2
Equation (1) models the change in concentration of mRNA from the tryptophan operon. In Component A in Equation (1), “M” is the concentration of mRNA from trpE. kM is the rate at which RNA polymerase (RNAP) molecules join the promoter to start transcription. Otot is the total concentration of operator-promoter regions. P represents the concentration of RNAP. KP is the dissociation constant of the binding reaction between RNAP and the tryptophan operon promoter. Rtot is the total concentration of active repressor molecules. T is the intracellular tryptophan concentration. KT is the dissociation constant of the binding reaction between TrpR and its corepressor tryptophan. Otot, P, and Rtot are assumed to be constant. Thus, Component B in Equation (1) accounts for TrpR repression of the tryptophan operon and the occupation of the tryptophan operon promoter by RNAP molecules. Component C in Equation (1) was formulated by Santillán and Zeron [18] from theoretical considerations and accounts for transcription attenuation. α is the proportion of the concentrations of total tRNAtrp and the dissociation constant of the binding reaction between a charged tRNAtrp and one of the tryptophan codons in the trpL chain. KG is the dissociation constant of the binding reaction between tRNA and tryptophan. Lastly, in Component D in Equation (1), γMM is the rate of mRNA degradation and μM is the dilution of mRNA due to cell volume variation.
Equation (2) models the change in intracellular TrpE concentration. E represents the concentration of TrpE. The “1/2” comes from the fact that two polypeptides catalyze the first reaction of the pathway. Hence, modeling the dynamics of one of those polypeptides (TrpE) accounts for half of the enzymes required to catalyze the first reaction. KE is the translation initiation rate of trpE. Since the half-life of trpE mRNA is 1 min, MτE is the concentration of mRNA with a 1 min delay. This delay represents the time in which each mRNA molecule can be translated before degrading. γEETot is the rate of TrpE degradation and μEtot stands for the dilution of the enzyme. In Equation (3), Ttot is the concentration of intracellular tryptophan. kT is the rate of tryptophan production per anthranilate synthase. This model assumes that tryptophan production is proportional to the availability of free TrpE. r is the maximum rate of metabolic tryptophan consumption, as Bliss initially determined [36]. Kr is analogous to the Michaelis constant and is equal to or less than one-tenth of the intracellular concentration of tryptophan at a steady-state [13]. μTtot is the dilution of tryptophan due to variations in the intracellular volume. Finally, Equation (4) describes the concentration of free, active, anthranilate synthase (E), i.e., the proportion of enzymes that have not been inhibited by interacting with tryptophan molecules.

2.3. Model Implementation

We started by implementing the model proposed by Santillán and Zeron [18] in MATLAB R2020b (education license) and named this our base model. To solve the system of equations, we used the fourth order Runge–Kutta method with a step size of 0.01. The complete implemented code in this work is available in File S1.

2.4. Inclusion of TnaAB Enzymes and Transmembranal Transporters in the Model

We modified the base model code to fit it with the model proposed by Orozco-Gómez et al. [37], mainly to introduce the function of the tnaAB operon. TnaA is the tryptophanase that degrades tryptophan and TnaB is an importer system that introduces tryptophan from the milieu. Additionally, we incorporated the collective activity of the various endogenous tryptophan export systems. We considered that they work with the mixed-activation model consistent with those proposed by Cornish-Bowden [38,39]. In addition, we included the effects of increased carbon flux in the aromatic amino acid pathway through the (C/(C + kmc)) term (see below).

2.5. Adjusting Parameters of Trp Transmembranal Transport

We determined that the effects predicted by the model refer to the degradation and export of tryptophan by the transmembrane transport fluxes and the activity of the TrpE, TrpR, and TnaA enzymes. An additional differential equation was added to the model to quantify changes in the concentration of external tryptophan (see below).

2.6. Model Validation with Experimental Reports

To simulate tryptophan synthesis, we used data reported for the GPT1001 and GPT1002 strains [40] by adjusting the respective equations. The GPT1001 E. coli strain was subjected to various genetic modifications to increase tryptophan production. To estimate the cell concentration in the cultures of GPT1001 and GPT1002, we made use of the cell calculator (OD600 to Bacterial Cell Number) provided by Agilent® (Santa Clara, CA, USA) (https://www.agilent.com/store/bioCalcs.jsp#ncc (Last accessed on 19 March 2021)), supplemented with data from Sezonov et al. [41]. From these data, we calculated the specific growth rate for the culture of each mutant strain according to the methodology used by Maier [42]. The code of the model can be reached at: https://gitlab.com/amalib/trp-biot-dynmod (Last accessed on 19 March 2021).

3. Results

3.1. Modifications to the Based Model

The first change introduced to the base model was to replace Component B in Equation (1), which accounts for tryptophan attenuation, with an expression that represents a model of attenuation already used by Santillán and Mackey [17] (Equation (5)). Both models return similar outputs, but using the term in Equation (5) returns results slightly closer to those experimentally observed. Equation (5) represents the probability that the transcript is attenuated as a function of the concentration of intracellular tryptophan; hence, the likelihood that the tryptophan operon will be fully transcribed is equal to 1-A(T). The constants “b” and “c” have approximate values of 0.85 and 0.04 μM, respectively. The following modification introduces the contributions of the tnaAB operon to the model, i.e., the effects of tryptophanase and the tryptophan-uptake permease TnaB. So, we propose the equations proposed by Orozco-Gómez et al. [37], describing the tnaAB operon dynamic. That original model consists of six equations. The tnaAB operon is subject to catabolite repression via extracellular glucose, while intracellular tryptophan induces their expression. Furthermore, tryptophanase activity is subject to forming aggregates (foci) inside the cell [43]. Thus, Equation (6) describes the inhibition of the tnaAB operon by extracellular glucose. Equation (7) is analogous to Equation (6); however, it describes tnaAB induction by intracellular tryptophan. Equations (8) and (9) illustrate the behavior of tryptophanase, including the fraction of active tryptophanase, that is, tryptophanase out of the foci. Equations (10) and (11) represent the rate of change in the concentration of tryptophanase and TnaB, respectively. All the values for the constants used in this study are shown in Table 1. The γA, γB, KA, and KB values are unknown; hence, we estimated them. γA and γB are the degradation rates of tnaAB. Since it is a single transcriptional unit, both values must be equal; therefore, γA = γB. According to Orozco-Gómez et al. [37], (γA + μ) ≈ μ; thus, γA = γB ≈ 0. With similar reasoning, KA = KB. Both constants are unknown and comparable to the transcription product and the translation rates of tnaAB. The wild-type promoter of the tryptophan operon is relatively strong. Thus, we suppose that the values of KA and KB should not be higher than that of the tryptophan operon, which turns into an upper limit. Bhartiya et al. [11] adjusted an equivalent value for the tryptophan operon to 65 min−1; consequently, KA = KB ≤ 65 min−1. Orozco-Gómez et al. [37] set the value of Kw to 60,000 μM; however, to fit the simulation values with the flux values through TnaB reported by Zhao et al. [44], the value of Kw was set to 60 μM.
A T = b 1 e T c
P G G e = K G n G K G n G + G E n G
P w w = T n w K w n w + T n w
x = λ G e + W e
P A G e , W e = 1 ( x K 1 ) 3   e x K 2
d A d t = K A O A B P G G e P w w γ A + μ A
d B d t = K B O A B P G G e P w w γ B + μ B
As previously mentioned, the original model assumes that tryptophan production is only conditional on the concentration of active TrpE. However, Michaelis–Menten kinetics indicate that enzymatic activity also depends on substrate concentration: chorismate, in this case. Thus, the first element in Equation (3) (kTE) should be further multiplied by (C/C + kmc), where C is the chorismate concentration, and kmc is the Michaelis–Menten constant of the reaction carried out by TrpE (hereafter represented as (C/C + kmc) = ω (Equation (12)). The value of kmc is 5.5 µM, as previously estimated [46]. No model has been proposed for the dynamics of chorismate concentration. Accordingly, for simplicity, we decided to keep “C” as a constant, indicating the steady-state concentration of chorismate. To the best of our knowledge, that value is also unknown; however, a value that fits the results with experimental data is C = 8.5 µM. Substituting “C” and kmc for their numerical values, ω = 0.607.
Furthermore, it is necessary to add transport elements to the original model. We added the elements of transport used by Santillán and Mackey [17] and Sun et al. [16] to the model (Equation (12), components A and B). Water transport flux through TnaB was modeled using pure Michaelis–Menten kinetics (Equation (12), Component C). TnaB’s tryptophan transport (β) rate has not been experimentally defined; however, a value of 1750 min−1 fits the experimental data. A similar gap happens with the tryptophanase rate for indole production. However, judging by the specific activity reported for commercial tryptophanase (t.ly/g37Q), this value (ktnaA) should be less than the maximum rate of metabolic tryptophan consumption; the upper bound should be 240 µM min−1. Consequently, ktnaA ≤ 240 µM min−1. The original model does not include any term or equation accounting for extracellular tryptophan dynamics; therefore, we added Equation (13) to the model. This equation represents a mass balance of tryptophan in the extracellular media; it includes all transport elements in Equation (12). Signs are inverted because of a loss of tryptophan in bacteria (Equation (12)) and represent a gain of tryptophan for the extracellular media (Equation (13)). Even with all the elements previously mentioned, the model cannot reproduce an extracellular tryptophan production of 0.58 µM, a value previously reported for wild-type E. coli [40]. Thus, we needed to consider additional transport elements to be included in the model. Modeling transport systems that follow pure Michaelis–Menten kinetics could not reproduce experimental data, and systems modeled uncompetitively inhibited transport systems, as did components A and B in Equation (12). We introduced three terms accounting for transport systems displaying mixed-activation kinetics [38,39] in Equations (12) and (13). Components D and E are activated by extracellular tryptophan, while Component F is activated by intracellular tryptophan. Only in this way was it possible to reproduce the experimental results. The values of the constants in Components D, E, and F were determined by trial and error, looking for the result that best fits the experimental observations (Table S1).
d T t o t d t = k T E ω ρ T K ρ + T + d W e e + W e 1 + T f d T e + T 1 + W e f k T n a A P A G e , W e A T + k T n a B β W e W e + K m b V m a x T T 1 + K x W e + k m 1 1 + K x W e V m a x 2 T T 1 + K 2 x W e + k m 2 1 + K 2 x W e V m a x 3 T T 1 + K 3 x T + k m 3 1 + K 3 x T μ T t o t
d W e d t = d W e e + W e 1 + T f + d T e + T 1 + W e f k t n a B B W e W e + K m b + V m a x T T 1 + K W e W e + k m 1 1 + K W e W e + V m a x 1 T T 1 + K 1 W e W e + k m 2 1 + K 2 W e W e + V m a x 2 T T 1 + K 1 T T + k m 3 1 + K 2 T T
In Equation (12), A refers to d W e e + W e 1 + T f ; B refers to d T e + T 1 + W e f ; Tryptophanase refers to k T n a A P A G e , W e A T ; C refers to k T n a B β W e W e + K m b ; D refers to V m a x T T 1 + K x W e + k m 1 1 + K x W e ; E refers to V m a x 2 T T 1 + K 2 x W e + k m 2 1 + K 2 x W e ; F refers to V m a x 3 T T 1 + K 3 x T + k m 3 1 + K 3 x T .
Then, we chose two overproducer E. coli strains as a reference to adapt the equations developed so far. These strains were named GPT1001 and GPT1002; their tryptophan production, rate of operon expression, specific growth rate, and other characteristics were reported by the authors of [40]. The strain GPT1001 carries a deletion of the trpR gene (ΔtrpR). Furthermore, it was transformed with the plasmid pTAT, containing extra copies of the genes trpE, aroG, and tktA. In vitro mutagenesis was also completed to modify the TrpE and AroG proteins to eliminate enzyme feedback inhibition. All of these genes were controlled by the lactose operon promoter (lac). Researchers made further modifications to this strain. The ptsG and tnaA genes were deleted. In addition, the expression of genes that catalyze pathway precursors, such as PRPP (phosphoribosyl pyrophosphate) and L-serine, were increased. Finally, the product of the ptsG gene, the IIBC subunit of the PTS system, consumes around 50% of the PEP produced by the cell [47]. Therefore, in this strain, ptsG elimination is accompanied by an increase in the expression of tktA, which increases the flux through the general aromatic amino acid pathway. The strain GPT1002, in addition to all the characteristics described for GPT1001, carries a deletion of the sequence encoding the tryptophan attenuator. Moreover, the native promoter of the genomic tryptophan operon of GPT1002 was replaced by a tandem arrangement of five Ptac synthetic strong promoter sequences.
These modifications were introduced to the dynamic model as follows. We simulated the increased flux through the pathway by increasing the chorismate concentration (Component C in Equation (12)) from 8.5 to 297.5 µM. That resulted from assuming that PEP that was not being spent by the PTS system would be redirected to the pre-chorismate pathway. The plasmid pTAT was built using pCL1920 as the backbone; according to their creators, this plasmid contains the lac operon promoter [48]. Consequently, the lac promoter controls the genes cloned into the pTAT plasmid. Thus, we introduce the effects of the pTAT plasmid to the original model through a set of equations that were previously proposed [45], which model the dynamics of the lac operon (Equations (14) and (15)). Equation (14) models the carbon catabolite repression, exerted by extracellular glucose, affecting the expression of the lac promoter. Such repression is related to the catabolite activator protein (CAP) effects. Equation (15) is a Hill function describing a reaction inhibited by glucose. Equations (14) and (15) were introduced in Equation (1), leading to Equation (16). Kmlac is the rate of lac promoter expression, which is 0.18 min−1 [49]. OP stands for the concentration of pTAT. According to Lerner and Inouye [48], E. coli cells transformed with pCL1920 contain five copies per cell. Thus, OP ≈ 0.0125 μM. PR (A) in Equation (16) is a term initially introduced to account for the probability of the lac operon not being repressed by the lac repressor. However, this term was originally modeled by Santillán [45] to describe the behavior of a wild-type lac promoter, that is, a promoter including an operator sequence together with two operator sequences. However, pTAT lacks operator sequences. Therefore, this term was simplified considering the following: (1) A wild-type lac promoter is repressed by a factor of 1300 due to the effects of the lac repressor. (2) Tryptophan production by GPT1001 and GPT1002 was carried out under the presence of IPTG; according to previous results, lac promoter activity is increased by a factor of 6 under IPTG concentrations similar to those used by Gu et al. [40]. (3) Repression exerted over a lac operon lacking the two pseudo-operator sequences is 1.4% of that of the wild-type operon. Under the culture conditions described by the author, the lac promoter in pTAT is repressed by a factor of 3 (1300 × 0.014 × 1/6). Thus, the probability that the lac operon will not be repressed is reversed to the repression factor; here, PR (A) has a constant value of 1/3.
P D G e = Ρ p 1 + P c G e k p c 1 1 + Ρ p P c G e k p c 1
P c G e = K G 2 n h K G 2 n h + G e n h
d M d t = k m O t o t P K P 1 + P K P + R t o t K R T T + K T 2 1 A T + k m l a c O P P D G e P R A γ M + μ
Equation (16) represents the rate of change in trpE mRNA concentration for the GPT1001 mutant. In the case of mutant GPT1002, Equation (16) was further modified, eliminating the term for transcription attenuation (1-A(T)). Then, the effect of the 5Ptac promoter tandem was introduced, considering that the author reported an overall two-fold increase, compared to GPT1001, in the expression of the entire transcriptional unit of the tryptophan operon after such modification. TrpE production in GPT1001 is equal to the product of km and (1 − A(T)). A(T) is 0.85 for almost any concentration of tryptophan, except for tryptophan concentrations near starvation. Thus, the actual value of expression of the tryptophan operon in GPT1001 is 0.765 min−1 (15% times 5.1 min−1). Therefore, we replaced the original value of km for GPT1002 by two times 0.765 (Equation (17)).
d M d t = 1.53   O t o t P K P 1 + P K P + R t o t K R T T + K T 2 + k m l a c O P P D G e P R A γ M + μ

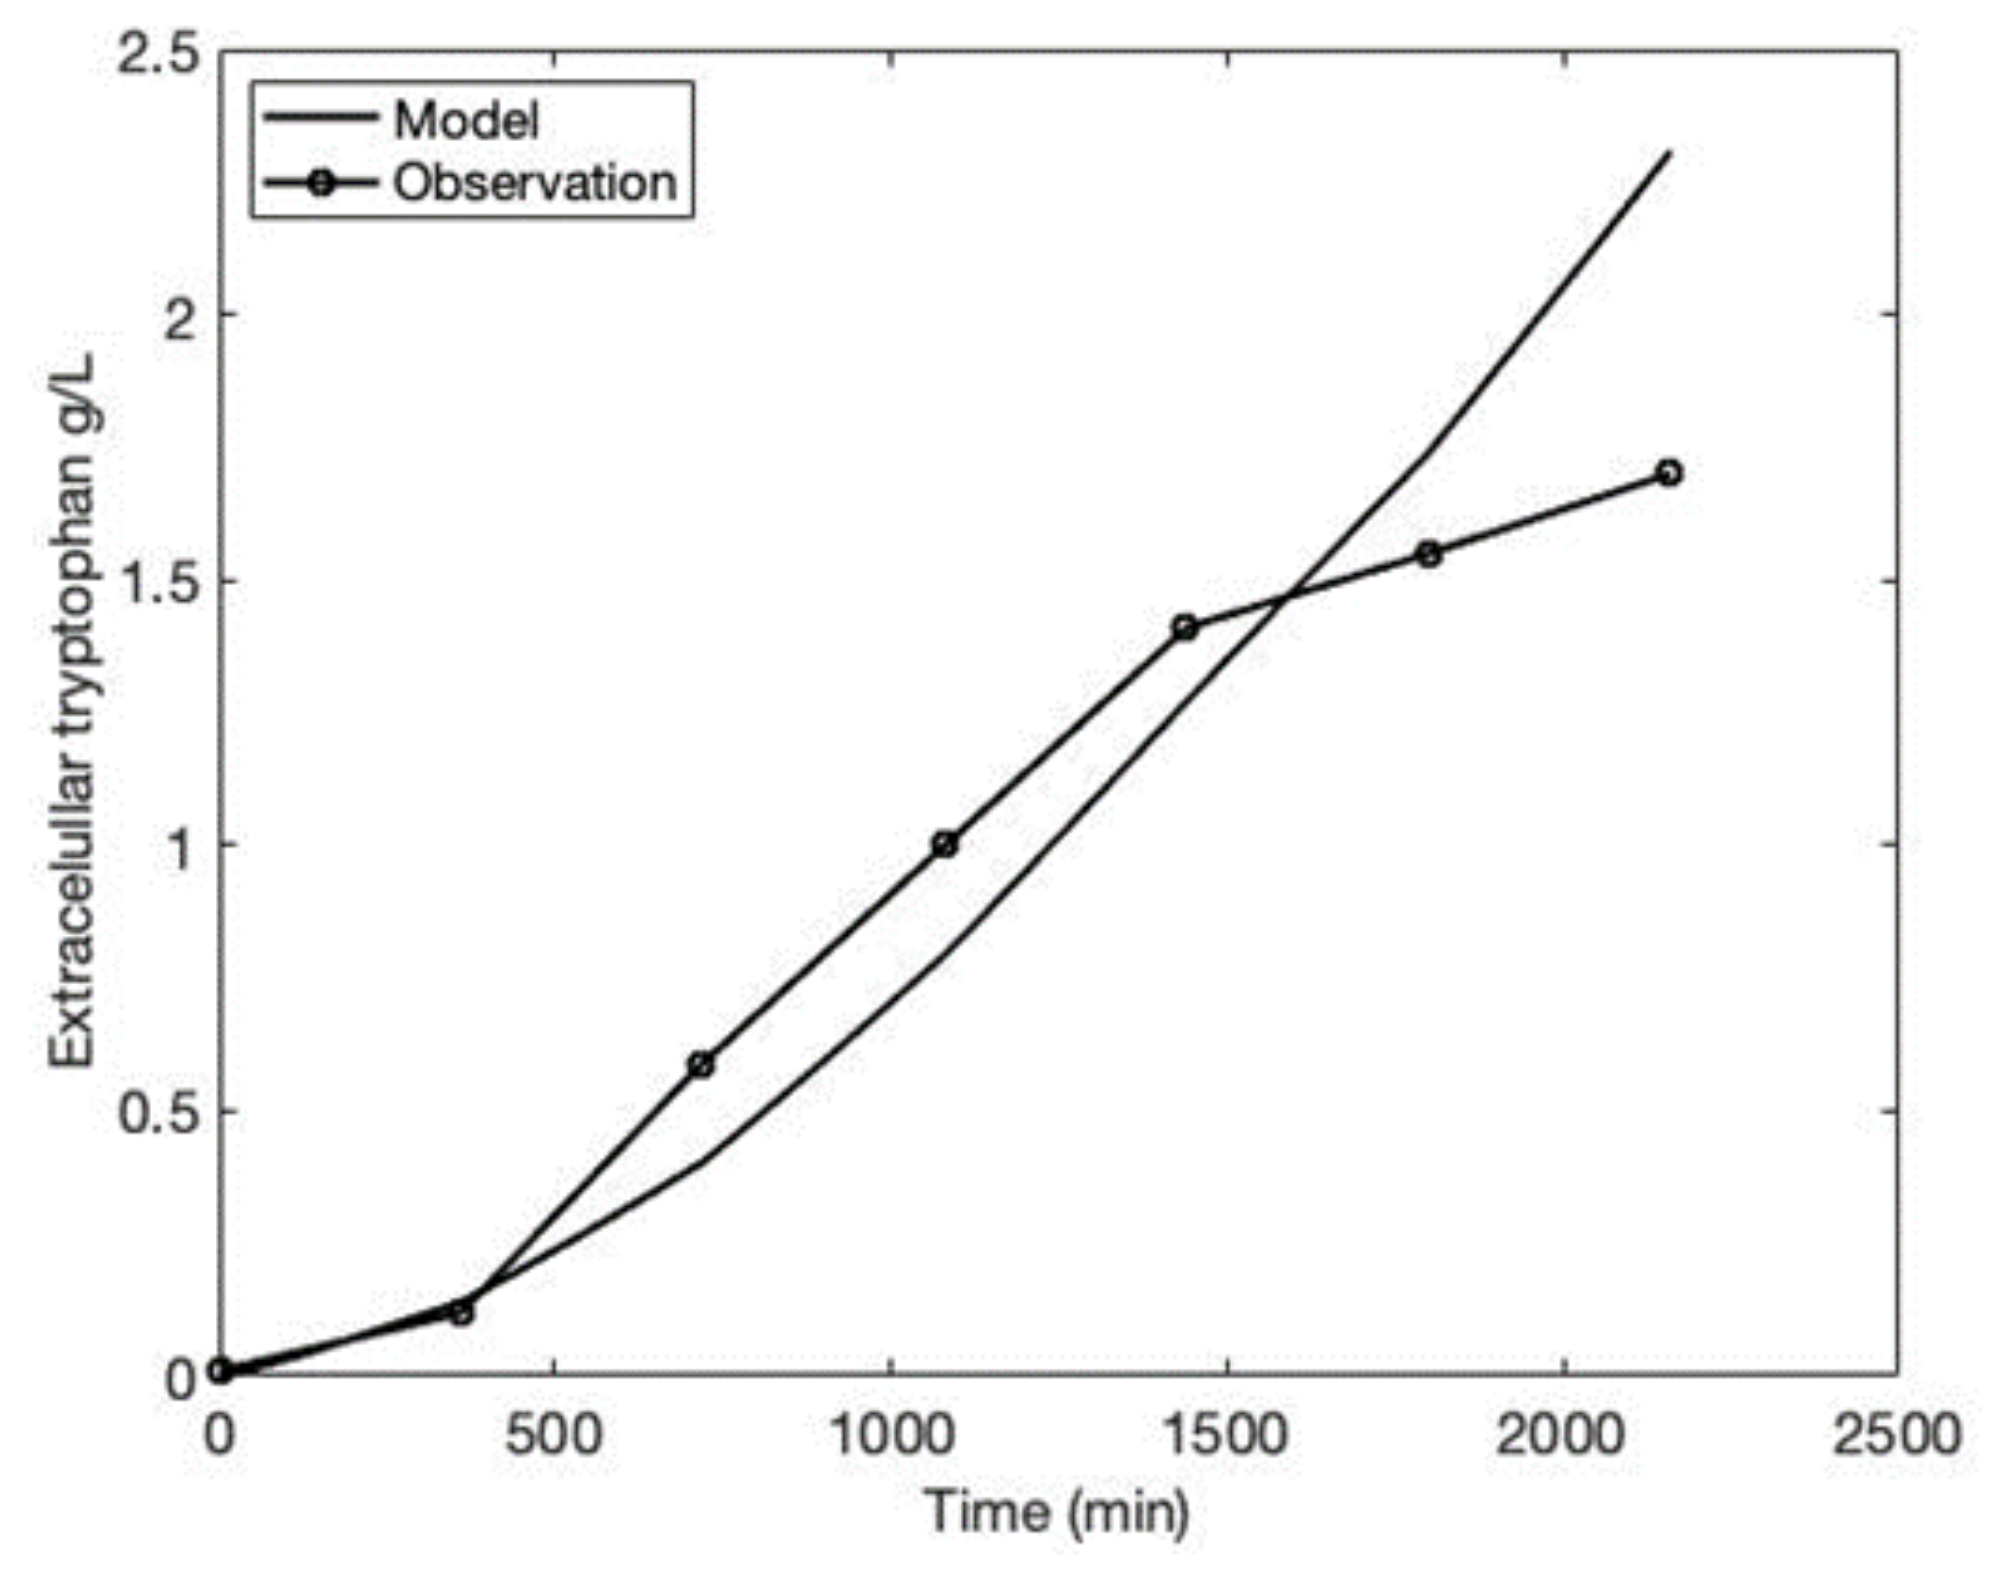
3.2. Comparing the Model to Experimental Data

In a complex medium, Gu et al. [40] reported a final tryptophan titer of 0.58 μM by wild-type E. coli. However, they did not register the culture-specific growth rate and cell concentration. Thus, the optical density reported elsewhere [50] for this same E. coli growing on the same complex media and with the same conditions (Table S1) was used to calculate the culture-specific growth rate and cell concentration using the Agilent® “OD600 to bacterial cell number” calculator (https://www.agilent.com/store/bioCalcs.jsp#ncc (Last accessed on 19 March 2021)). We calculated the specific growth rate from the cell-density data sample points [41]. These data in Supplementary Tables S1–S3 were introduced into the model to obtain growth and glucose consumption curves. Parts 8–10 of the code in Supplementary File S1 state how we include the specific growth rates to simulate tryptophan production (also shown in the final parts of the program codes for GPT1001 and GPT 1002 at (https://gitlab.com/amalib/trp-biot-dynmod (Last accessed on 19 March 2021)). The system representing a wild-type strain growing on 50 mL media consists of Equations (2), (3) and (10)–(13). We simulated the culture for 8 h (Figure 2), which is the time in which culture in complex media reaches a steady state (Table S1). As seen in Figure 2, the final tryptophan production indicated by the model is close to 0.58 μM. It was remarked that we could only reproduce exogenous tryptophan dynamics by introducing transport systems that follow mixed-activation dynamics. When simulations were carried out using transport systems following pure Michaelis–Menten dynamics or uncompetitively inhibited dynamics, the system displayed high-frequency oscillations even at steady state. At the same time, external tryptophan concentration never reached more than 0.1 μM without showing high-frequency oscillations (not shown).
After introducing a mixed-activation transport, we simulated the models describing tryptophan overproducing in mutants GPT1001 and GPT1002. The GPT1001 model includes Equations (2), (3), (10), (11), (13) and (16). In this case, we used the optical density data provided by the authors to calculate cell density and specific growth rate using the same strategy described before. A dynamic for extracellular glucose concentration was also introduced to the model, according to Table S2. The model was adjusted to simulate a 300 mL culture. The resulting curve describes extracellular tryptophan concentration close to 1.3 g/L obtained by Gu et al. [40] after a 36 h culture (Figure 3). For GPT1002, the model includes the same equations, except for Equation (16), which is replaced by Equation (17). We calculated the specific growth rate and cell concentration from the reported data (Table S3) and we inferred a dynamic for glucose concentration (not shown). The resulting curve fits the first stages of the tryptophan dynamic (Figure 4); however, the last two points differ significantly from that experimentally defined. In the discussion section, we speculate about the possible causes of this discrepancy.

4. Discussion

In this work, we adapted a working dynamic model that includes the primary molecular components involved in bacteria’s last part of the tryptophan biosynthetic pathway. Our approach was from a biotechnological point of view; thus, we reflect in the model mRNA, attenuator, transport, regulators, and enzymatic genes whose activity is known to control tryptophan production. The model introduces the genetic and regulatory changes experimentally described in developing two E. coli strains (GPT1001 and GPT1002) [40]. Although the authors performed additional genetic modifications in those strains, such as sugar transport and pathway precursors, these were not directly included in our model since their effect could be more general in bacterial physiology. Another critical declaration is that we did not intend to reproduce what happens in a controlled bioreactor. Although it increases metabolite production, the way the production rises is possibly at the physiological level or due to the extensive residency time of bacteria in bioreactors, giving place to adaptive modifications in the population. For instance, in the referred study [40], when culturing in a 5 L bioreactor, a 20 h reaction occurred before bacteria grew and produced tryptophan. Hence, we focus on reproducing that which was obtained in that study in shake flasks. An interesting approach that may provide insight into physiology’s contribution is coupling the effects of oscillations in the central metabolism and tryptophan production [51,52].
Even with our effort, we had a discrepancy in the last two points of the culture, particularly on the GPT1002 strain (Figure 4), where the latest points fell and did not recuperate as in GPT1001 (Figure 3). We speculate that the difference between the model and the experimental observation seen in Figure 4 could be due to several reasons. Since this is a simplified model, many things may be happening in the overall E. coli metabolism that may cause a decrease in tryptophan production. A possible cause is that, according to previous results [53], intracellular RNAP and ribosomal concentrations decrease at low specific growth rates, as could happen in entering the stationary phase [54]. The last two points of the simulation in Figure 4 are also the slowest growing points of the bacterial population. Hence, it is possible to think that such diminution might be related to lower transcription and translation rates of the genes in the tryptophan operon. That condition is especially true for a strain with an increased metabolic burden. Thus, decreasing the value of the average number of ribosomes translating each mRNA (kE), from 30 min−1 to 15 min−1 starting in the minute 1440, results in extracellular tryptophan dynamics that fit closer to those experimentally observed, i.e., 1.7 g L−1 (Figure 5A).
Furthermore, as mentioned earlier, previous tryptophan operon models assume that tryptophan production is proportional to the concentration of free TrpE since it is considered the operon bottleneck. However, it was necessary to take a different perspective in the case of mutant GPT1002. As mentioned, Gu et al. [40] reported an overall two-fold increase in the expression of the tryptophan operon transcriptional unit. However, such an increase was not equal for all the genes in the transcriptional unit since trpE displayed a nine-fold increase, while the expression of trpD showed a two-fold increase. The differentiated expression of genes in operons has been previously reported [55]. Thus, if we had stuck to the considerations of the original model, we should have added a nine-fold increase in the expression of TrpE for mutant GPT1002. However, we reasoned that since an enzymatic aggregate carries out the first reaction of the tryptophan pathway (TrpED) and TrpE cannot catalyze the path’s first reaction in the absence of TrpD [35], the effect of the increased expression of trpE would be minimal if it is not accompanied by an increase of the same magnitude of trpD. Since such an increase did not occur, the expression of trpD would be the new bottleneck. That is why a two-fold increase in operon expression was applied in Equation (17). It appears that it was a correct deduction since a nine-fold increase in the operon expression used in Equation (17) results in tryptophan dynamics that fall far from the experimental results (Figure 5B).
Other phenomena also may not be considered here, such as the diminution of mRNA concentration during the different growth phases. However, summing the possible causes that may produce discrepancies may not be the best approach when working with a deterministic model, neglecting the stochastic nature of these interactions. So, further analysis will be needed to determine the precise causes of this discrepancy. In cultures near or on the stationary phase, the apparition of alternative phenotypes, such as dormant or persistent cells, may contribute to a less productive population [56,57].

5. Conclusions

This work shows the first approach to achieving a dynamic working model for biotechnological tryptophan production in E. coli. This model includes the contributions of the main genetic modifications and speculates the performance of the bulk of transport reactions to fit the quantity of this metabolite as measured in the culture media. There are many opportunity areas to improve the model; we think one main grey area to experimentally discern is the specific contributions of the different transport systems to obtain tryptophan in the extracellular concentrations as experimentally measured. Other unspecific or unconsidered transport systems may participate in the secretion of tryptophan when produced at high cellular rates. There is also consideration of how to include physiological changes and apparitions of additional genetic modifications in long-time cultures. Controlled conditions and feedback bioreactors can maintain optimal conditions that contribute to optimal physiology and sustain highly productive populations. We hope this work can contribute to more precise working biotechnological models to produce valuable chemicals.

Supplementary Materials

The following supporting information can be downloaded at: https://www.mdpi.com/article/10.3390/fermentation8100560/s1, File S1: Implemented MATLAB code; Table S1: Growth parameters of E. coli cultures growing on LB medium; Table S2: Growth parameters of E. coli GPT1001 growing in complex medium with glucose; Table S3: Growth parameters of E. coli GPT1002 growing in complex medium with glucose.

Author Contributions

Conceptualization, D.A.C.-L. and A.M.-A.; methodology, D.A.C.-L.; software, D.A.C.-L.; validation, D.A.C.-L., L.E.G.d.l.V. and M.S.; formal analysis, D.A.C.-L.; investigation, D.A.C.-L.; resources, A.M.-A.; writing—original draft preparation, D.A.C.-L. and A.M.-A.; writing—review, and editing, L.E.G.d.l.V. and M.S.; supervision, A.M.-A.; project administration, A.M.-A.; funding acquisition, A.M.-A. All authors have read and agreed to the published version of the manuscript.

Funding

This research and the APC were funded by Consejo Nacional de Ciencia y Tecnología, grant number 319,732 (2021).

Informed Consent Statement

Not applicable.

Data Availability Statement

Not applicable.

Acknowledgments

Authors thank Jorge Ibarra for the discussions and Ana Lilia Hernández and Tomas Tiburcio for technical support.

Conflicts of Interest

The authors declare no conflict of interest.

References

  1. Richard, D.M.; Dawes, M.A.; Mathias, C.W.; Acheson, A.; Hill-Kapturczak, N.; Dougherty, D.M. L-tryptophan: Basic metabolic functions, behavioral research and therapeutic indications. Int. J. Tryptophan Res. 2009, 2, S2129. [Google Scholar] [CrossRef] [PubMed] [Green Version]
  2. Gosset, G. Production of aromatic compounds in bacteria. Curr. Opin. Biotechnol. 2009, 20, 651–658. [Google Scholar] [CrossRef] [PubMed]
  3. Ikeda, M. Towards bacterial strains overproducing L-tryptophan and other aromatics by metabolic engineering. Appl. Microbiol. Biotechnol. 2006, 69, 615–626. [Google Scholar] [CrossRef] [PubMed] [Green Version]
  4. Crawford, I.P. Evolution of a biosynthetic pathway: The tryptophan paradigm. Annu. Rev. Microbiol. 1989, 43, 567–600. [Google Scholar] [CrossRef]
  5. Kaleta, C.; Schäuble, S.; Rinas, U.; Schuster, S. Metabolic costs of amino acid and protein production in Escherichia coli. Biotechnol. J. 2013, 8, 1105–1114. [Google Scholar] [CrossRef]
  6. Xiu, Z.L.; Zeng, A.P.; Deckwer, W.D. Model analysis concerning the effects of growth rate and intracellular tryptophan level on the stability and dynamics of tryptophan biosynthesis in bacteria. J. Biotechnol. 1997, 58, 125–140. [Google Scholar] [CrossRef]
  7. Bhartiya, S.; Rawool, S.; Venkatesh, K.V. Dynamic model of Escherichia coli tryptophan operon shows an optimal structural design. Eur. J. Biochem. 2003, 270, 2644–2651. [Google Scholar] [CrossRef]
  8. Sen, A.K.; Liu, W.M. Dynamic analysis of genetic control and regulation of amino acid synthesis: The tryptophan operon in Escherichia coli. Biotechnol. Bioeng. 1990, 35, 185–194. [Google Scholar] [CrossRef]
  9. Sinha, S. Theoretical study of tryptophan operon: Application in microbial technology. Biotechnol. Bioeng. 1988, 31, 117–124. [Google Scholar] [CrossRef]
  10. Xiu, Z.L.; Chang, Z.Y.; Zeng, A.P. Nonlinear dynamics of regulation of bacterial trp operon: Model analysis of integrated effects of repression, feedback inhibition, and attenuation. Biotechnol. Progr. 2002, 18, 686–693. [Google Scholar] [CrossRef]
  11. Simao, E.; Remy, E.; Thieffry, D.; Chaouiya, C. Qualitative modelling of regulated metabolic pathways: Application to the tryptophan biosynthesis in E. coli. Bioinformatics 2005, 21, ii190–ii196. [Google Scholar] [CrossRef] [PubMed]
  12. Nguyen, L.K.; Kulasiri, D. On multiple regulatory mechanisms in the tryptophan operon system in Escherichia coli: In silico study of perturbation dynamics. In Silico Biol. 2008, 8, 485–510. [Google Scholar] [PubMed]
  13. Marín-Sanguino, A.; Torres, N.V. Optimization of tryptophan production in bacteria. Design of a strategy for genetic manipulation of the tryptophan operon for tryptophan flux maximization. Biotechnol. Progr. 2000, 16, 133–145. [Google Scholar] [CrossRef] [PubMed]
  14. Deal, I.; Macauley, M.; Davies, R. Boolean models of the transport, synthesis, and metabolism of tryptophan in Escherichia Coli. arXiv 2022, arXiv:2022.11182. [Google Scholar]
  15. Schmid, J.W.; Mauch, K.; Reuss, M.; Gilles, E.D.; Kremling, A. Metabolic design based on a coupled gene expression—Metabolic network model of tryptophan production in Escherichia coli. Metab. Eng. 2004, 6, 364–377. [Google Scholar] [CrossRef]
  16. Sun, Y.; Mu, X.; Li, Z.; Teng, H.; Xiu, Z. Robustness and Nonlinear Dynamic Analysis for Trp Operon and Optimization of Tryptophan Production: An Integrated Model Considering Gene Regulation, Genes Interaction and Product Excretion. In Proceedings of the 2010 4th International Conference on Bioinformatics and Biomedical Engineering, Chengdu, China, 18–20 June 2010; pp. 1–7. [Google Scholar]
  17. Santillán, M.; Mackey, M.C. Dynamic regulation of the tryptophan operon: A modeling study and comparison with experimental data. Proc. Natl. Acad. Sci. USA 2001, 98, 1364–1369. [Google Scholar] [CrossRef] [Green Version]
  18. Santillan, M.; Zeron, E.S. Dynamic influence of feedback enzyme inhibition and transcription attenuation on the tryptophan operon response to nutritional shifts. J. Theor. Biol. 2004, 231, 287–298. [Google Scholar] [CrossRef]
  19. Drozdov-Tikhomirov, L.N.; Skurida, G.I. Mathematical model of tryptophan synthesis and excretion into the environment by E. coli cells. Mol. Biol. 1977, 11, 843–853. [Google Scholar]
  20. Boezi, J.A.; De Moss, R.D. Properties of a tryptophan transport system in Escherichia coli. Biochim. Biophys. Acta 1961, 49, 471–484. [Google Scholar] [CrossRef]
  21. Burrous, S.E.; DeMoss, R.D. Studies on tryptophan permease in Escherichia coli. Biochim. Biophys. Acta 1963, 73, 623–637. [Google Scholar] [CrossRef]
  22. Burkovski, A.; Krämer, R. Bacterial amino acid transport proteins: Occurrence, functions, and significance for biotechnological applications. Appl. Microbiol. Biotechnol. 2002, 58, 265–274. [Google Scholar] [PubMed]
  23. Doroshenko, V.; Airich, L.; Vitushkina, M.; Kolokolova, A.; Livshits, V.; Mashko, S. YddG from Escherichia coli promotes export of aromatic amino acids. FEMS Microbiol. Lett. 2007, 275, 312–318. [Google Scholar] [CrossRef] [PubMed]
  24. Forrest, L.R.; Krämer, R.; Ziegler, C. The structural basis of secondary active transport mechanisms. Biochim. Biophys. Acta 2011, 1807, 167–188. [Google Scholar] [CrossRef] [PubMed] [Green Version]
  25. Heinz, E.; Geck, P.; Wilbrandt, W. Coupling in secondary active transport: Activation of transport by co-transport and/or counter-transport with the fluxes of other solutes. Biochim. Biophys. Acta 1972, 255, 442–461. [Google Scholar] [CrossRef]
  26. Geck, P.; Heinz, E. Coupling in secondary transport Effect of electrical potentials on the kinetics of ion linked co-transport. Biochim. Biophys. Acta 1976, 443, 49–63. [Google Scholar] [CrossRef]
  27. Somerville, R. The Trp repressor, a ligand-activated regulatory protein. Prog. Nucleic Acid Res. Mol. Biol. 1992, 42, 1–38. [Google Scholar]
  28. Merino, E.; Jensen, R.A.; Yanofsky, C. Evolution of bacterial trp operons and their regulation. Curr. Opin. Microbiol. 2008, 11, 78–86. [Google Scholar] [CrossRef] [Green Version]
  29. Klig, L.S.; Crawford, I.P.; Yanofsky, C. Analysis of trp repressor-operator interaction by filter binding. Nucleic Acids Res. 1987, 15, 5339–5351. [Google Scholar] [CrossRef] [Green Version]
  30. Gunsalus, R.P.; Miguel, A.G.; Gunsalus, G.L. Intracellular Trp repressor levels in Escherichia coli. J. Bacteriol. 1986, 167, 272–278. [Google Scholar] [CrossRef] [Green Version]
  31. Kasai, T. Regulation of the expression of the histidine operon in Salmonella typhimurium. Nature 1974, 249, 523–527. [Google Scholar] [CrossRef]
  32. Yanofsky, C. Transcription attenuation: Once viewed as a novel regulatory strategy. J. Bacteriol. 2000, 182, 1–8. [Google Scholar] [CrossRef] [PubMed] [Green Version]
  33. Henkin, T.M.; Yanofsky, C. Regulation by transcription attenuation in bacteria: How RNA provides instructions for transcription termination/antitermination decisions. Bioessays 2002, 24, 700–707. [Google Scholar] [CrossRef] [PubMed]
  34. Baker, T.I.; Crawford, I.P. Anthranilate synthetase: Partial purification and some kinetic studies on the enzyme from Escherichia coli. J. Biol. Chem. 1966, 241, 5577–5584. [Google Scholar] [CrossRef]
  35. Pittard, J.; Yang, J. Biosynthesis of the aromatic amino acids. EcoSal Plus 2008, 3, 1. [Google Scholar] [CrossRef] [PubMed]
  36. Bliss, R.D.; Painter, P.R.; Marr, A.G. Role of feedback inhibition in stabilizing the classical operon. J. Theor. Biol. 1982, 97, 177–193. [Google Scholar] [CrossRef]
  37. Orozco-Gómez, D.I.; Sosa-Hernández, J.E.; Gallardo-Navarro, Ó.A.; Santana-Solano, J.; Santillán, M. Bistable behaviour and medium-dependent post-translational regulation of the tryptophanase operon regulatory pathway in Escherichia coli. Sci. Rep. 2019, 9, 1–13. [Google Scholar] [CrossRef] [Green Version]
  38. Balcells, C.; Pastor, I.; Vilaseca, E.; Madurga, S.; Cascante, M.; Mas, F. Macromolecular crowding effect upon in vitro enzyme kinetics: Mixed activation–diffusion control of the oxidation of NADH by pyruvate catalyzed by lactate dehydrogenase. J. Phys. Chem. B. 2014, 118, 4062–4068. [Google Scholar] [CrossRef] [Green Version]
  39. Cornish-Bowden, A. Fundamentals of Enzyme Kinetics, 1st ed.; John Wiley & Sons: London, UK, 2013; pp. 76–89. [Google Scholar]
  40. Gu, P.; Yang, F.; Kang, J.; Wang, Q.; Qi, Q. One-step of tryptophan attenuator inactivation and promoter swapping to improve the production of L-tryptophan in Escherichia coli. Microb. Cell Fact. 2012, 11, 30. [Google Scholar] [CrossRef] [Green Version]
  41. Sezonov, G.; Joseleau-Petit, D.; d’Ari, R. Escherichia coli physiology in Luria-Bertani broth. J. Bacteriol. 2007, 189, 8746–8749. [Google Scholar] [CrossRef] [Green Version]
  42. Maier, R.M. Bacterial growth. In Environmental Microbiology, 2nd ed.; Maier, R.M., Pepper, I.L., Gerba, C.P., Eds.; Academic Press: London, UK, 2015; pp. 37–56. [Google Scholar]
  43. Ito, J.; Yanofsky, C. The nature of the anthranilic acid synthetase complex of Escherichia coli. J. Biol. Chem. 1966, 241, 4112–4114. [Google Scholar] [CrossRef]
  44. Zhao, Z.; Chen, S.; Wu, D.; Wu, J.; Chen, J. Effect of gene knockouts of L-tryptophan uptake system on the production of L-tryptophan in Escherichia coli. Process Biochem. 2012, 47, 340–344. [Google Scholar] [CrossRef]
  45. Santillán, M.; Mackey, M.C.; Zeron, E.S. Origin of bistability in the lac operon. Biophys. J. 2007, 92, 3830–3842. [Google Scholar] [CrossRef] [PubMed] [Green Version]
  46. Ito, J.; Yanofsky, C. Anthranilate synthetase, an enzyme specified by the tryptophan operon of Escherichia coli: Comparative studies on the complex and the subunits. J. Bacteriol. 1969, 97, 734–742. [Google Scholar] [CrossRef] [PubMed]
  47. Gosset, G. Improvement of Escherichia coli production strains by modification of the phosphoenolpyruvate: Sugar phosphotransferase system. Microb. Cell Fact. 2005, 4, 1–11. [Google Scholar] [CrossRef] [PubMed] [Green Version]
  48. Lerner, C.G.; Inouye, M. Low copy number plasmids for regulated low-level expression of cloned genes in Escherichia coli with blue/white insert screening capability. Nucleic Acids Res. 1990, 18, 4631. [Google Scholar] [CrossRef] [Green Version]
  49. Malan, T.P.; Kolb, A.; Buc, H.; McClure, W.R. Mechanism of CRP-cAMP activation of lac operon transcription initiation activation of the P1 promoter. J. Mol. Biol. 1984, 180, 881–909. [Google Scholar] [CrossRef]
  50. Baev, M.V.; Baev, D.; Radek, A.J.; Campbell, J.W. Growth of Escherichia coli MG1655 on LB medium: Determining metabolic strategy with transcriptional microarrays. Appl. Microbiol. Biotechnol. 2006, 71, 323–328. [Google Scholar] [CrossRef]
  51. Maria, G.; Gijiu, C.L.; Maria, C.; Tociu, C. Interference of the oscillating glycolysis with the oscillating tryptophan synthesis in the E. coli cells. Comput. Chem. Eng. 2018, 108, 395–407. [Google Scholar] [CrossRef]
  52. Maria, G.; Renea, L. Tryptophan Production Maximization in a Fed-Batch Bioreactor with Modified E. coli Cells, by Optimizing Its Operating Policy Based on an Extended Structured Cell Kinetic Model. Bioengineering 2021, 8, 210. [Google Scholar] [CrossRef]
  53. Bremer, H.; Dennis, P.P. Modulation of chemical composition and other parameters of the cell at different exponential growth rates. EcoSal Plus 2008, 3. [Google Scholar] [CrossRef]
  54. Yoshida, H.; Shimada, T.; Ishihama, A. Coordinated hibernation of transcriptional and translational apparatus during growth transition of Escherichia coli to stationary phase. mSystems 2018, 3, e00057-18. [Google Scholar] [CrossRef] [PubMed] [Green Version]
  55. Lim, H.N.; Lee, Y.; Hussein, R. Fundamental relationship between operon organization and gene expression. Proc. Natl. Acad. Sci. USA 2011, 108, 10626–10631. [Google Scholar] [CrossRef] [PubMed] [Green Version]
  56. Finkel, S.E. Long-term survival during stationary phase: Evolution and the GASP phenotype. Nat. Rev. Microbiol. 2006, 4, 113–120. [Google Scholar] [CrossRef] [PubMed]
  57. Balaban, N.Q.; Merrin, J.; Chait, R.; Kowalik, L.; Leibler, S. Bacterial persistence as a phenotypic switch. Science 2004, 305, 1622–1625. [Google Scholar] [CrossRef]
Figure 1. Schematic representation of the regulatory mechanisms of the tryptophan and tnaAB operons. All entities represented in the process are defined in the square at the bottom of the figure.
Fermentation 08 00560 g001
Figure 2. Extracellular concentration of tryptophan when executing the model as described in Equations (2), (3) and (10)–(13). The final concentration of extracellular tryptophan is close to 0.58 μM.
Fermentation 08 00560 g002
Figure 3. Result of the dynamical model for tryptophan production of E. coli GPT1001 strain. The flat line represents the result obtained when executing the model described by Equations (2), (3), (10), (11), (13) and (16). Specific growth rate and cell concentration were introduced to the model according to Table S2. The circled line describes the experimental results obtained by Gu et al. [40].
Fermentation 08 00560 g003
Figure 4. Result of the dynamical model for tryptophan production of E. coli GPT1002 strain. The flat line represents the result obtained when executing the model described by Equations (2), (3), (10), (11), (13) and (17). Specific growth rate and cell concentration were introduced to the model according to Table S3. The circled line describes the experimental results obtained by Gu et al. [40].
Fermentation 08 00560 g004
Figure 5. The results of executing the model are described by Equations (2), (3), (10), (11), (13) and (17), which describe tryptophan production by GPT1002 overproducer strain [40]. Specific growth rate and cell concentration were introduced to the model according to Table S3. (A) The value of kE was decreased from 30 min−1 to 15 min−1 starting at minute 1440. (B) The trp operon expression rate was increased by a factor of nine (6.885 min−1).
Fermentation 08 00560 g005
Table 1. Value parameters that are used in the model.
Estimated byKinetic Constants Rate ConstantsDimensionless Constants
Santillán and Zeron [18]Rtot ≈ 0.8 μMρ ≈ 2.4 × 10² μM min−1
KP ≈ 4.5 × 10⁻² μMKM ≈ 5.1 min−1
KI≈ 4.1 μMγM ≈ 0.69 min−1
P ≈ 3 μMkE ≈ 30 min−1
Kρ ≈ 10 μMγE ≈ 0 min−1
Otot ≈ 4 × 10⁻³ μMkT ≈ 7.4 × 10⁴ min−1
KR ≈ 2 × 10⁻⁴ μM
τE ≈ 1 min
KT ≈ 40 μM
Santillán and Mackey [17]c ≈ 0.04 μM b ≈ 0.85
Santillán et al. [45]KG2 = 2.6 μM# kmlac = 0.18 min−1Pp = 0.127
kpc = 30
nh = 1.3
Orozco-Gómez et al. [37]KG =11 μM nG = 4
nW = 4
K1 = 14
λ = 7
K2 = 9
This work C ≈ 8.5 μMktnaA ≈ 8.7066 min−1
K’x ≈ 168 μMktnaB ≈ 1750 min−1
K2′x = 762.6 mMVmax ≈ 161.96 mM min−1
K3′x ≈ 135.3 mMVmax2 ≈ 522.2 M min−1
Kx ≈ 700 μMVmax3 ≈ 21,609 mM min−1
K2x ≈ 41 mM
K3x ≈ 16.4 mM
km1′ ≈ 0.2 μM
km2′ ≈ 10 mM
km3′ ≈ 12.3 mM
OP = 0.0125 μM
OAB ≈ 4 × 10⁻³ μM
KW = 60 μM
Publisher’s Note: MDPI stays neutral with regard to jurisdictional claims in published maps and institutional affiliations.

