1. Introduction
Despite the variations in wine volume, approximately 270 million hectoliters are produced each year [
1], along with the unavoidable generation of wastes. The main byproducts from the wine industry are grape stems, pomace, marc, and lees, which are mainly utilized for landfills, incineration, or animal feed [
2]. Yeast is one of the lees’ components and contains proteins and carbohydrates, resulting in a potential source of nutrients for the general purposes of the food industry [
3]. A wide spectrum of applications of inactive dry yeast preparations in winemaking has been reviewed by Pozo-Bayón et al. [
4]. An attractive alternative to increase the bioavailability of the components of yeasts is cell lysis and the enzymatic hydrolysis of proteins [
3,
5,
6]. This process increases the bioavailability of proteins by generating assimilable nitrogen in the form of peptides. Nitrogen supplementation is a key aspect to attempt an effective and profitable fermentation process by affecting the fermentative activity and the formation of metabolites [
7] and represents the challenge of achieving an organoleptic profile to satisfy consumers. Four components contribute to the assimilable nitrogen for yeasts during fermentation: ammonium, amino acids, oligopeptides, and proteins [
8]. During the fermentation process, nitrogen is required for the synthesis of cell metabolites and structures such as proteins, cell walls, nucleic acids, and, in general, biomass. The assimilation of organic nitrogen in the form of amino acids and peptides allows the direct availability of these molecules, lowering energy consumption [
8,
9,
10].
The concentration and nature of the nitrogen source directly affect biomass generation and the fermentation rate [
11]. Additionally, nitrogen plays a fundamental role in the generation of secondary metabolites, which confer the characteristic flavors and taste to wine. These metabolites are higher alcohols and esters. Higher alcohols are formed in amino acid catabolism by the Ehrlich pathway. Some of these amino acids are direct precursors of higher alcohols, such as isoamyl alcohol from leucine, 2-phenylethanol from phenylalanine, and methionol from methionine [
12]. The odors of these compounds are not desirable when isolated. However, they have a minor contribution to the vinous nature of wine and an important role in the formation of esters and aldehydes [
8]. Therefore, the production of esters is not directly affected by the nitrogen source. However, nitrogen availability affects the redox balance of the cell and could modify the concentration of acetyl-CoA [
13]. Surely, we can conclude that nitrogen has a primary and a secondary role in yeast metabolism and, consequently, in the organoleptic profile of wine.
The most used nitrogen source in the wine industry is diammonium phosphate (DAP), which is an inorganic compound with high bioavailability. It is well documented that nitrogen supplementation with organic sources, such as amino acids, allows an increase in the generation of volatile compounds, enhancing the sensorial perception of wine [
13,
14,
15,
16,
17]. However, yeasts recovered from the same fermentation are a more economically suitable organic nitrogen source.
A few studies have evaluated the effect of yeast lysates on wine must fermentation. González–Marco et al. [
18] studied the generation of biogenic amines after the addition of yeast autolysate to wine. Kevvai et al. [
19] studied the growth of
Saccharomyces cerevisiae in synthetic medium supplemented with yeast hydrolysate. They determined that 40% of the total nitrogen in the fermenting yeasts originated from the yeast hydrolysate. Supplementation with organic nitrogen sources has been studied in more detail in the fermentation of malt worts, especially high-gravity worts. Protein hydrolysates from wheat gluten [
20,
21,
22,
23,
24], soy [
25], and walnut meal [
26] were used as supplements. All these studies have confirmed the improvement of fermentation performance in a variety of aspects: increased biomass growth, increased cell viability, increased ethanol content, increased wort fermentability, enhancement of cell membrane integrity, a decrease in radical oxygen species, and increased osmotic and ethanol stress tolerance. In addition, Li et al. [
26] observed an improved formation of alcohols and esters and an increased ratio of higher alcohols to esters, which means a better-balanced taste of final beers.
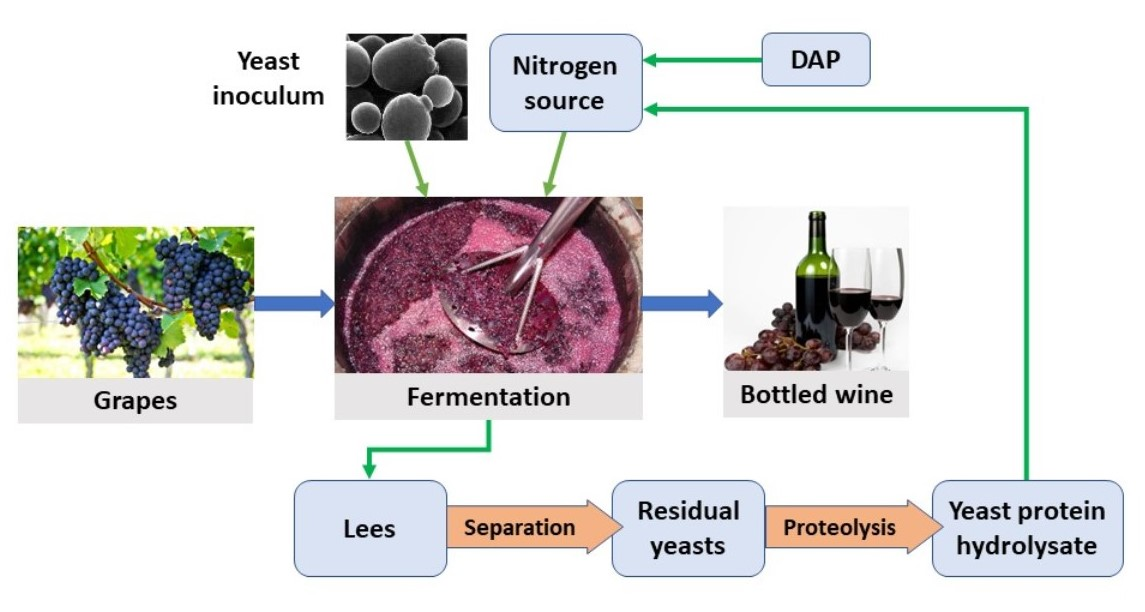
To the best of our knowledge, the protein hydrolysate from recovered yeasts is still unevaluated as a nitrogen source for winemaking. Therefore, we recovered yeasts from previous batches of wine fermentation, hydrolyzed them by enzymatic proteolysis, and used them as a nitrogen supplement for grape must fermentation in a winemaking process involving the whole cycle of yeast usage. The wine production process was conducted in the laboratory; however, the procedure emulated each stage of winemaking in the commercial winery, including bottling before chemical and sensorial analyses. This article evaluates the use of yeast protein hydrolysate (YPH) as a nitrogen source for fermentation and its effect on the molecular and sensorial profiles of wine.
2. Materials and Methods
2.1. Materials
Wine lees were obtained from Villaseñor winery (Maule, Chile; 35°08′37″ S 71°21′35.2″ W), recovered from the fermentation of a Syrah wine. The yeast for fermentation was Lalvin EC1118 (Danstar Ferment AG, Fredericia, Denmark). Alcalase protease manufactured by Novozymes (Bagsvaerd, Denmark) was used in the protein hydrolysis, corresponding to the endoprotease subtilisin with 24 AU/g. Cabernet Sauvignon grapes obtained from Indomita winery (Casablanca Valley, Chile; 33°21′34.8″ S 71°20′37.8″ W) were used for wine production. Reagents HCl, NaOH, diammonium phosphate (DAP), potassium metabisulfite, and formaldehyde were analytical grade and obtained from Winkler (Santiago, Chile).
2.2. Preparation of the Nitrogen Source
2.2.1. Yeast Recovery from Lees
The solid phase from the lees was separated by gravitation and filtration. The wet solid phase was mixed with an equal mass of 1.5% v/v HCl for 45 min at 50 °C with constant stirring by IKA agitator (Cole Parmer, IL, USA) to dissolve the tartaric salts. Yeasts were recovered by gravitation and filtration, and the liquid phase was discarded. The remaining yeasts were suspended in water at a 1:1 ratio and autoclaved at 121 °C for 15 min in an AMILAB autoclave (Laboratory Instruments, Santiago, Chile). Thermal treatment was used as an inactivating treatment to avoid living yeasts interfering with the fermentation process and as a primary lysate treatment.
2.2.2. Yeast Protein Hydrolysis
Autoclaved yeast suspensions contained 95 g/L dried yeast, corresponding to 31 g/L protein, previously quantified by the Kjeldahl method (AOAC). Next, 300 g of yeast suspension was stirred in a 0.5-L vessel in a water bath at 50 °C (Julabo ED, Seelbach, Germany). The suspension pH was adjusted to 8 with 1.5 N NaOH. The hydrolysis reaction was started by the addition of 15 mAU of Alcalase per g of suspension. The pH was controlled by the addition of 1.5 N NaOH with the G20 Mettler-Toledo auto titrator (Schwerzenbach, Switzerland). Two hydrolysates were prepared at different degrees of hydrolysis (DH), 3.5% and 10%. The DH was controlled based on the volume of NaOH solution added, according to a previous publication [
27]. The reaction was stopped by inactivating the protease in a water bath at 85 °C for 30 min. The resulting hydrolysates were aliquoted in 50-mL tubes and frozen at −15 °C (Freezer Daewoo FF09) for later use as a nitrogen source.
2.3. Wine Production
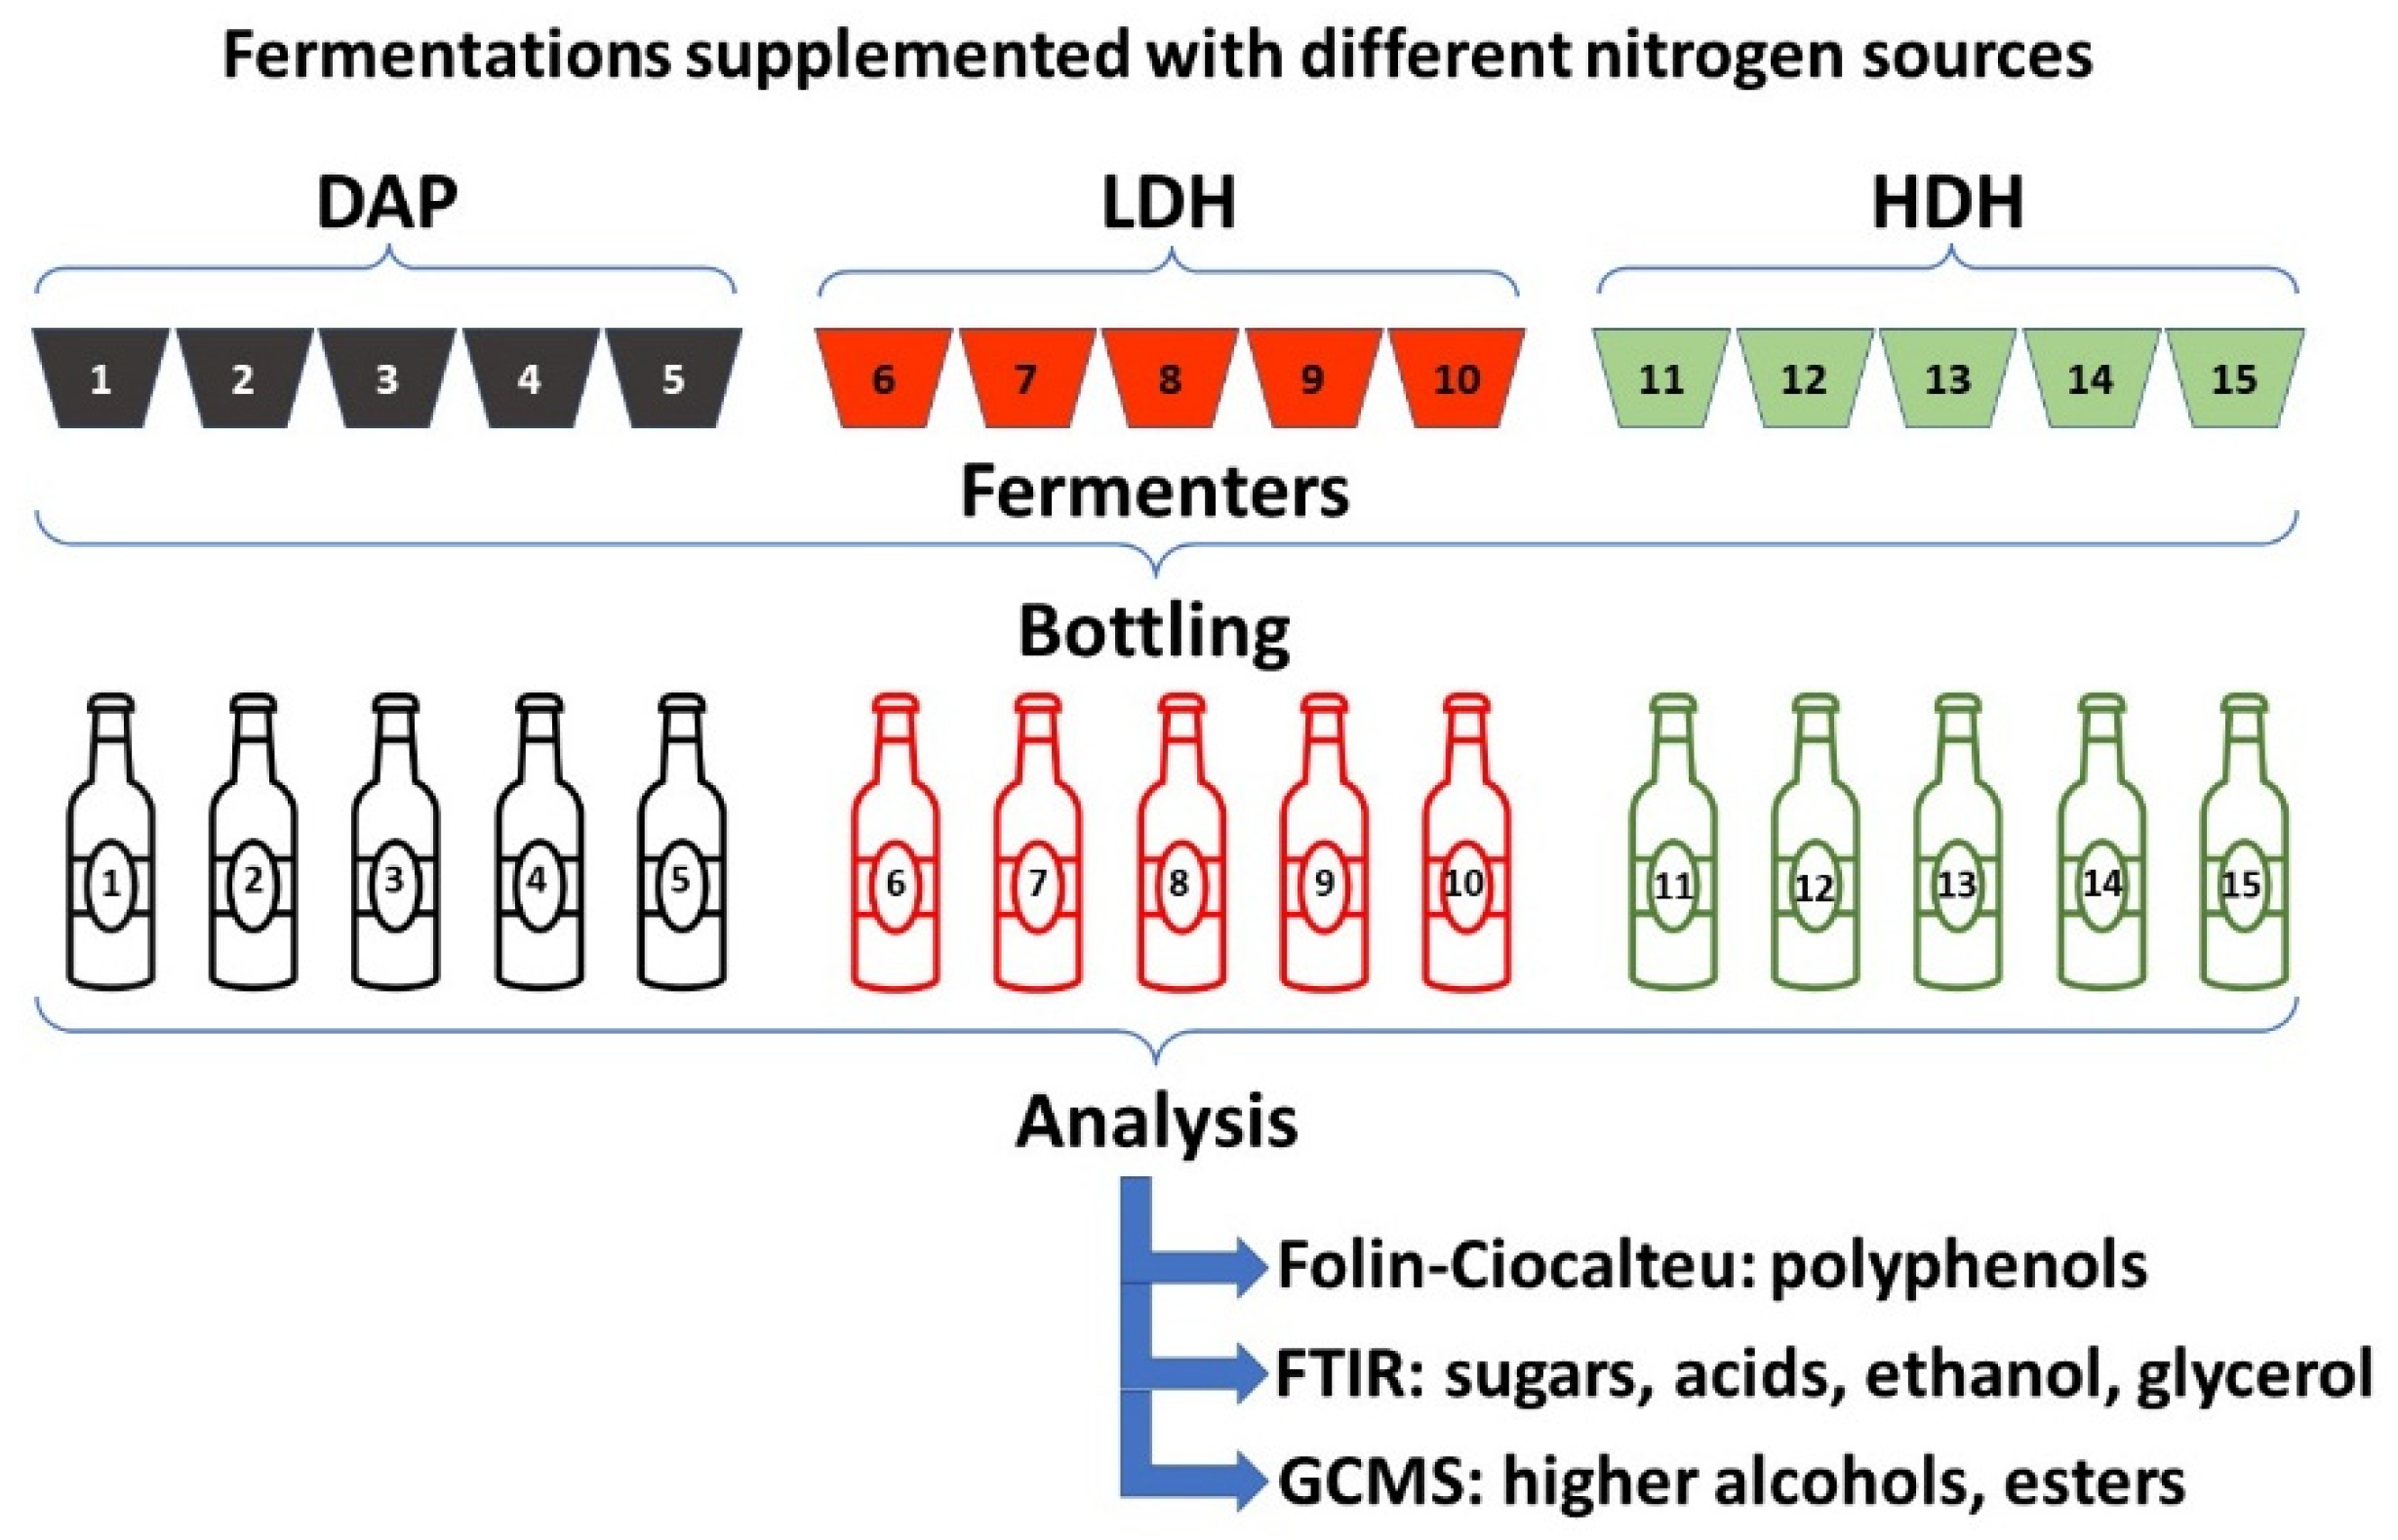
The experiments were designed to test the effects of 3 nitrogen sources: diammonium phosphate (DAP), yeast hydrolysate DH 3.5% (LDH), and yeast hydrolysate DH 10% (HDH). Experiments supplemented with DAP were designed as controls, while those supplemented with LDH and HDH corresponded to treatments with low and high degrees of hydrolysis hydrolysates, respectively. Fermentation experiments were performed with 5 replicates for each nitrogen source, resulting in a total of 15 experiments.
2.3.1. Fermentation
Each fermentation replicate consisted of 5 kg of destemmed and crushed Cabernet Sauvignon grapes conditioned with 70 ppm potassium metabisulfite and kept in 6-l open vessels until the first racking. The must contained 219 mg/L nitrogen quantified as free amino groups by the formaldehyde method [
28]. Nitrogen sources were added as the necessary amount to achieve 250 mg/L of total nitrogen. The must pH was adjusted to 3.45 with tartaric acid. A total of 4 grams of EC1118 yeast was hydrated with 40 mL of equal volumes of must and water at 35 °C and left unstirred for 10 min. Then, the mixture was gently hand-stirred and left to rest for another 15 min. The hydrated yeasts were left at room temperature to let them cool. An adequate aliquot of this suspension was added to each fermentation batch to obtain an initial yeast concentration of 0.05 g/L. The fermentation was followed up for 5 days with withdrawal samples to quantify the specific gravity and sugar concentration using a glass densimeter (TrueBrew, TX, USA) and a digital refractometer Hanna HI96811 (Woonsocket, RI, USA), respectively.
2.3.2. Post-Fermentation
After 8 days of fermentation, each batch was racked individually. The fermentation content was filtered, and the pomace was pressed. The fermented must was kept in closed glass bottles with an airlock for a month. The lees were separated in the second racking, and the fermented must was again kept in closed glass bottles with an airlock for 10 weeks at outdoor temperatures between 8 °C and 12 °C. Tartaric salts precipitated under this condition. After the third racking, tartaric salts were separated, and the wine was corked in 750-mL bottles and maintained at room temperature until molecular characterization was performed.
2.4. Analytical Techniques
The fermentation progress was characterized by the quantification of sugars, acids, and alcohols measured by Alpha Bruker FTIR equipment (Billerica, MA, USA). The working parameters were spectral range 4000–400 cm
−1 and spectral resolution of 2 cm
−1. FTIR equipment was previously calibrated for wine samples, and the analyses were performed by the software Opus 7.0. The Folin–Ciocalteu method was used to quantify the concentration of polyphenols in bottled wines using gallic acid standards between 25 and 125 mg/L [
29]. The calibration curve was made measuring absorbance at 760 nm in a Thermo Scientific Orion AquaMate 8000 UV-Vis Spectrophotometer (Fisher Scientific, Göteborg, Sweden). Results of gallic acid calibration are shown in
Figure S2 (Supplementary Material). The concentrations of volatile compounds, such as higher alcohols and esters, were quantified to characterize the bottled wines prepared with different nitrogen sources. The procedure consisted of solid-phase microextraction and injection of samples in Shimadzu GCMS QP2010 Ultra gas chromatography-mass spectrometry equipment (Suzhou, China). The mass spectrum of each sample was compared with a NIST-EPA-NIH library consisting of 130,000 spectrums. The quantification was carried out by the internal standard method considering a response factor equal to 1. A total of 23 higher alcohols and 57 esters were analyzed in 15 samples of bottled wines (5 for each supplementation). An analysis scheme is represented in
Figure 1.
2.5. Sensory Evaluation
A wine tasting session was conducted with 43 participants who were volunteer wine consumers and not wine experts. This test was performed as an initial approach to wine tasting with the objective of obtaining a mere perception of consumers. Three attributes were considered for the sensorial characterization of the wines: sweetness, acidity, and astringency. The first stage consisted of training, where the participants identified the 3 attributes by tasting solutions of glucose, tartaric acid, and tannic acid at concentrations of 20, 0.75, and 1.0 g/L, respectively. The second stage consisted of ordering the attribute intensity of glucose solutions with concentrations of 2, 10, 20, and 30 g/L; tartaric acid solutions with concentrations of 0.25, 0.50, 0.75, and 1.0 g/L; and tannic acid solutions with concentrations of 0.50, 0.75, 1.00, and 1.25 g/L. The aroma was also included as a wine attribute in the test. However, it was not trained and remained as a pure consumer’s perception attribute. The third stage consisted of tasting the three wines with different nitrogen supplementation. Two randomly distributed blind samples of each wine were given to the panelists. Finally, the participants were asked to qualify each wine in order of intensity for the three attributes previously trained, the aroma (not trained), and order the wine samples according to their preference. All the processes were performed individually and without contact between participants.
2.6. Statistical Analysis of The Results
The results for chemical analyses performed by FTIR (acids, sugars, ethanol, and glycerol), GCMS (higher alcohols and esters), and polyphenols by the Folin–Ciocalteu method were evaluated for significant differences between 2 samples at 95% confidence. The results from these analytical techniques consisted of 5 replicates for each supplementation. A detailed list of results can be checked in the
supplementary material Figures S1 and S2.
Principal component analysis (PCA) was performed to detect the effects of the treatments with different nitrogen sources on the molecular profile based on volatile compounds, including higher alcohols and esters. The raw data for higher alcohols and esters from the 15 wine samples was used as an entry. Higher alcohols and esters were analyzed by PCA in separated procedures for better visualization of the results.
The results obtained with the sensorial panel for each nitrogen source were analyzed through Friedman analysis for a nonparametric statistic [
30]. This simple ranking test consisted of the evaluation of the effects of the three nitrogen sources according to H
0: all the effects of the nitrogen source are zero; and H
1: not all the effects of the nitrogen source are zero. Each wine sample was ranked by the panelists, and the ranked sum was compared between samples to evaluate significance at 95%.
3. Results
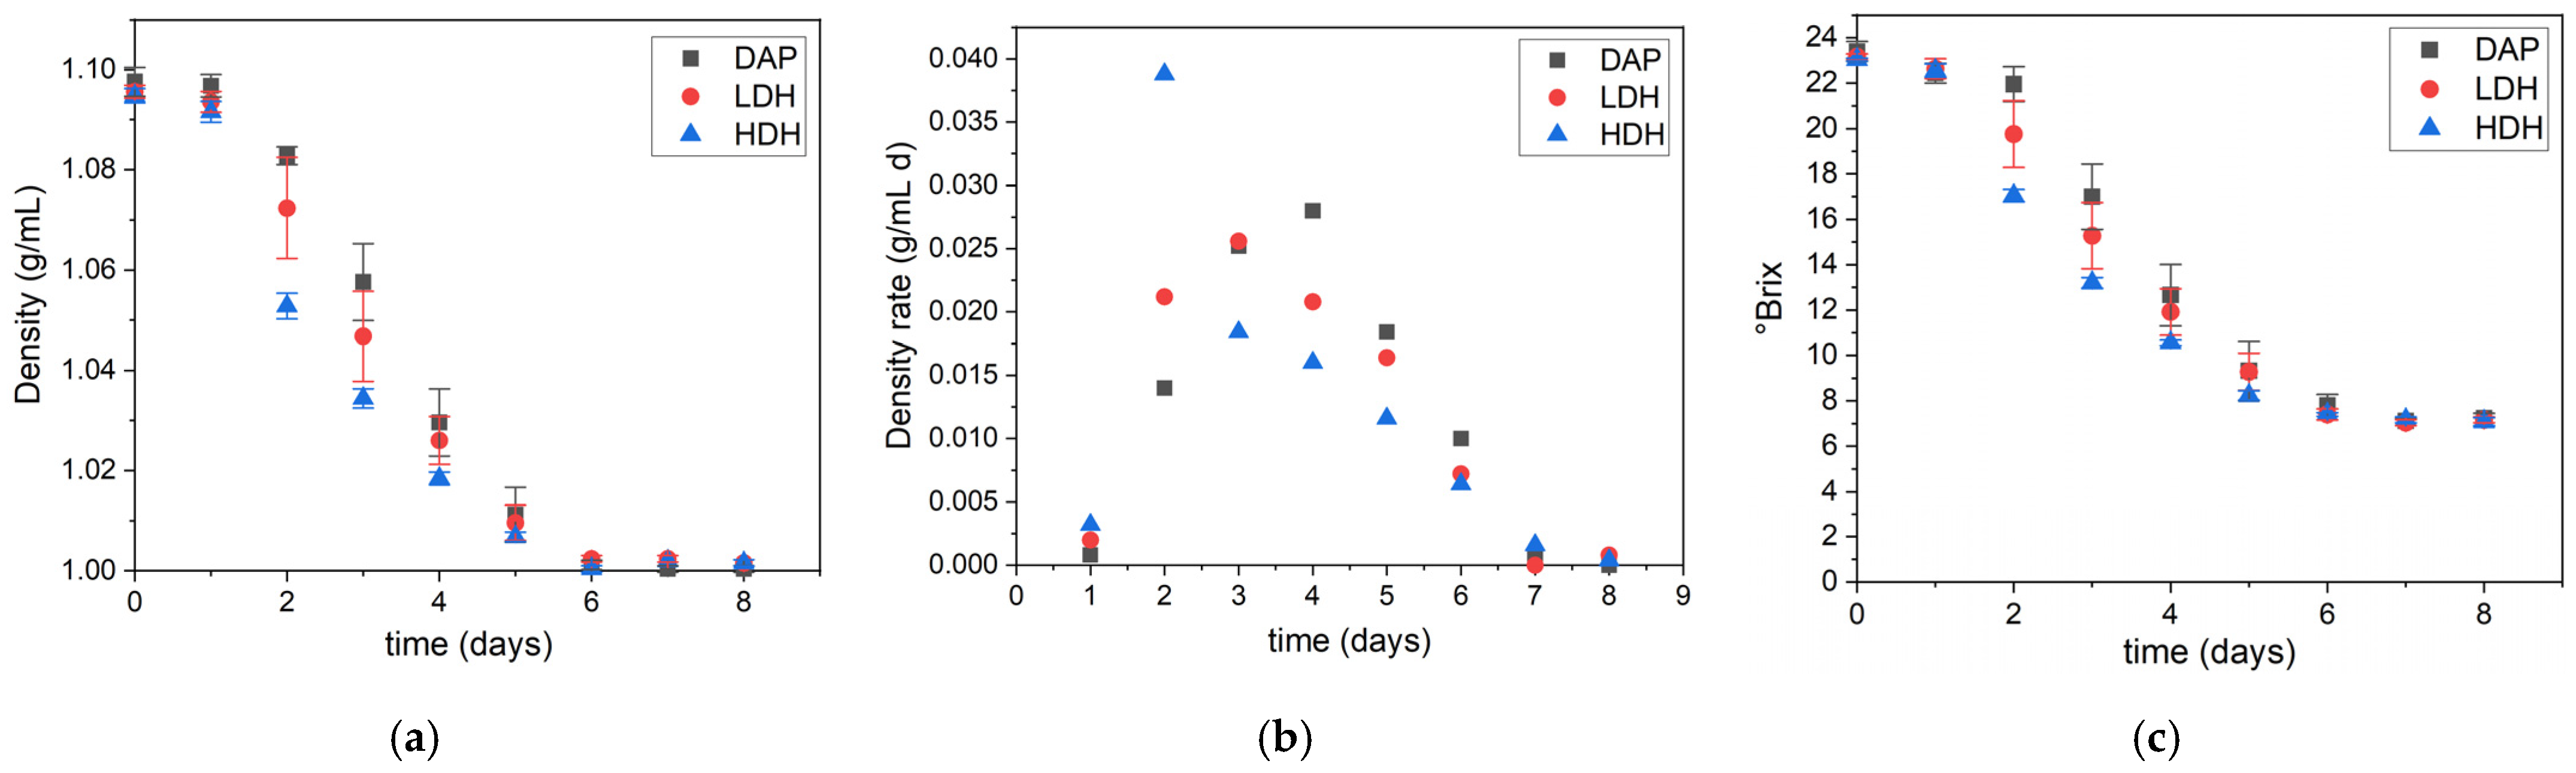
The progress of fermentation presented in
Figure 2 indicated that all batches involving the different nitrogen sources resulted in sugar consumption. The progress profiles and the final density of the musts were similar, as observed in
Figure 2a. However, a pattern in the fermentation rate was observed in
Figure 2b. The batch supplemented with YPH and HDH had the highest rate, followed by the LDH- and DAP-supplemented batches (
Figure 2b). In all cases, fermentation was performed on the sixth day. The same observations were made by measuring °Brix, as shown in
Figure 2c. At this point, we can infer that all nitrogen supplementations allowed proper fermentation of the must. The higher the DH, the shorter the lag phase and the faster the fermentation rate.
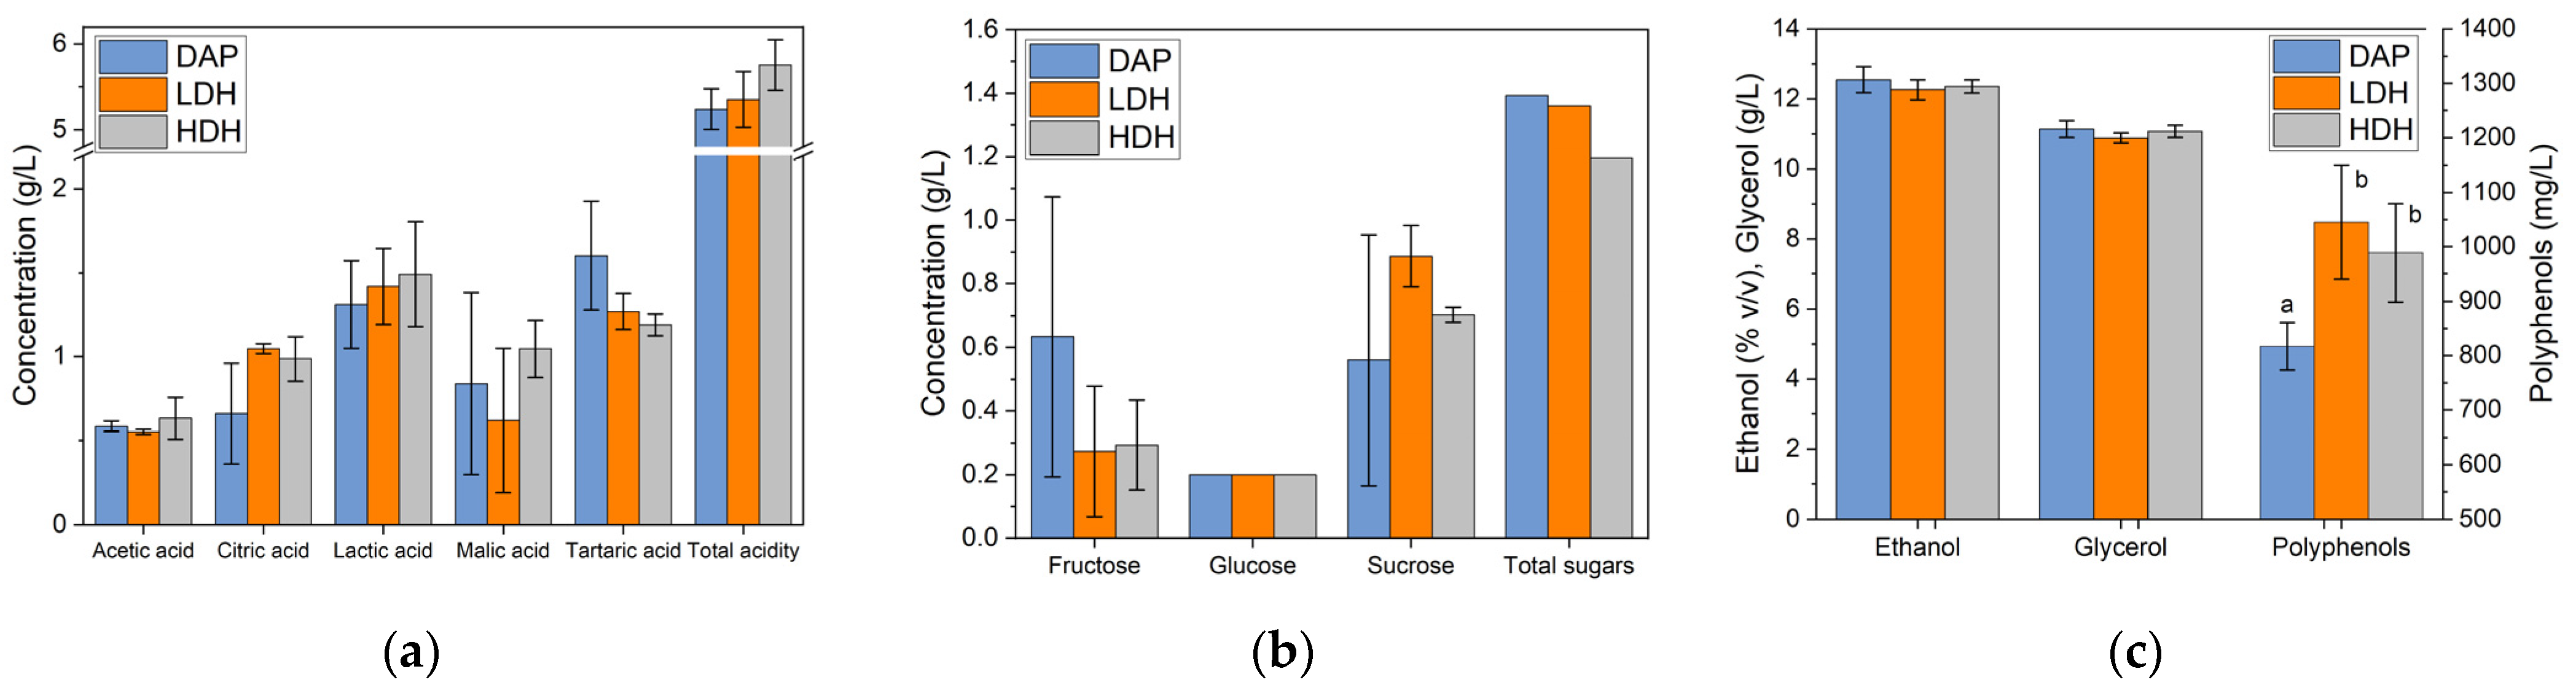
The bottled wines were characterized by the quantification of acids, sugars, alcohols, and polyphenols. Results were plotted in
Figure 3. The highest concentration of acids corresponded to lactic and tartaric acids. High variations in replicates (error bars) were observed for malic and lactic acids. The variations can be attributed to variations in malolactic fermentation, suggesting a lack of homogeneity among replicates. The variations in tartaric acid can be explained by a nonhomogeneous precipitation of this acid among the replicates. The highest acidity was obtained in the wine supplemented with HDH, followed by the LDH- and DAP-supplemented wines. The residual sugars were between 1.2 and 1.4 g/L in the different wines. Glucose presented the same residual concentration, while fructose was different depending on the experiment. The highest fructose concentration was obtained in batches supplemented with DAP. A lower concentration was obtained in the wines supplemented with YPH, consisting of the same value for LDH- and HDH-supplemented wines. Ethanol and glycerol production levels were similar among the different nitrogen supplementations. Polyphenols resulted in different concentrations, depending on the nitrogen source supplemented. Both YPH supplementation, LDH, and HDH resulted in higher concentrations of polyphenols compared with the DAP-supplemented wine. The only difference observed during fermentation was the sugar uptake rate. Faster production of ethanol in batches supplemented with YPH could cause a higher extraction of polyphenols. This inference is not supported by our evidence or by antecedents. Fermentations supplemented with YPH were faster, consumed more sugars, and obtained higher acidity and polyphenols compared to DAP supplementation. After the characterization of wines, analysis of volatile compounds was performed.
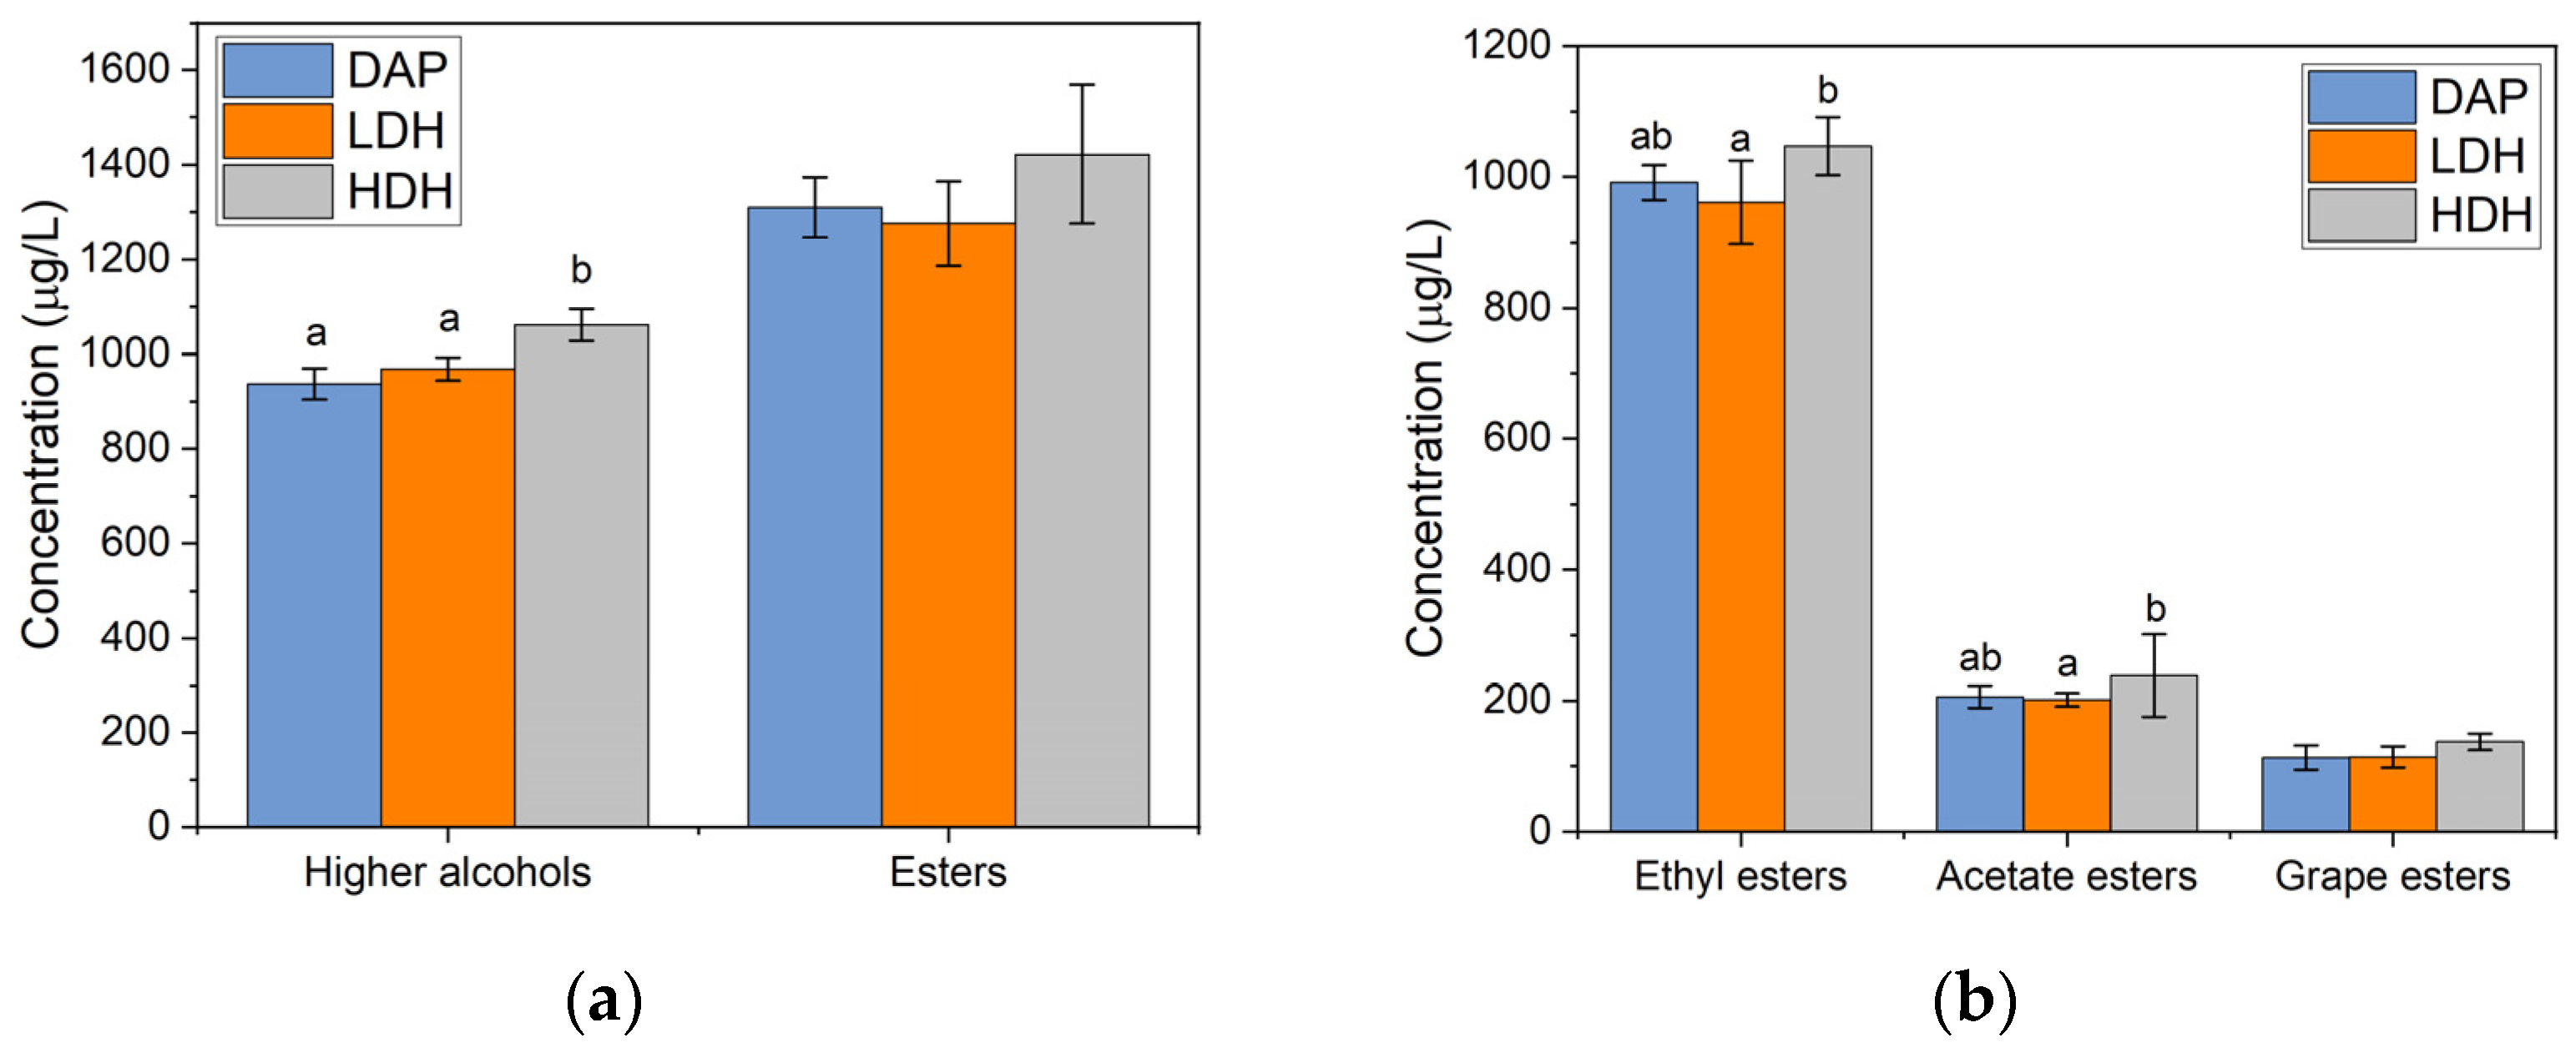
The concentrations of higher alcohols and esters are presented in
Figure 4. The highest concentration of higher alcohols and esters was obtained in the HDH-supplemented wine. The results agree with previously published data. The production of higher alcohols depends on the availability of amino acids. This evidence shows the feasibility of using YPH as a nitrogen source to promote the formation of higher alcohols. The esters were classified according to their origin, as shown in
Figure 4b. In all cases, supplementation with HDH achieved higher concentrations of esters. Comparisons between the pairs DAP/HDH and LDH/HDH resulted in significant differences. Supplementation with LDH resulted in an equal or lower generation of esters compared to DAP-supplemented wine. The necessity of a DH threshold for the hydrolysate to cause an increase in ester production is inferred from this evidence. The requirement of yeast proteases to hydrolyze low-DH peptides means a higher energy cost for yeast, which could impede an improvement of ester production compared to DAP supplementation.
A total of 23 higher alcohols and 57 esters were quantified by gas chromatography. The complete list of higher alcohols and esters can be checked in the worksheet file “Higher alcohols and esters” in the
Supplemental Material. A total of 11 higher alcohols and 18 esters presented significant differences among the different supplementations. The list of these volatile compounds is presented in
Table 1. The wines supplemented with YPH presented higher volatile compound concentrations than control (DAP) in just 6 higher alcohols and 13 esters. In the rest of the cases, the control (DAP) presented higher values of the compounds. The isoamyl alcohol was the only volatile compound which concentration increased in the order of DAP-, LDH- and HDH-supplementations, presenting 443, 484, and 547 μg/L, respectively. The 2-phenyl ethanol presented a significantly higher concentration in the HDH-supplementation compared to both LDH- and DAP-supplementations. In the case of esters, the compounds ethyl 2-hydroxyhexanoate and ethyl dodecanoate were higher in both YPH-supplementations compared to the control, while isoamyl decanoate was significantly higher in HDH-supplementation compared to both LDH- and DAP-supplementations. The concentrations of all volatile compounds were compared to their odor threshold. Those compounds with concentrations higher than the odor threshold are listed in
Table 2. One higher alcohol and 8 esters presented an odor activity value (OAV) higher than 1, which means that these compounds present significant odor among the total aroma components of the sample.
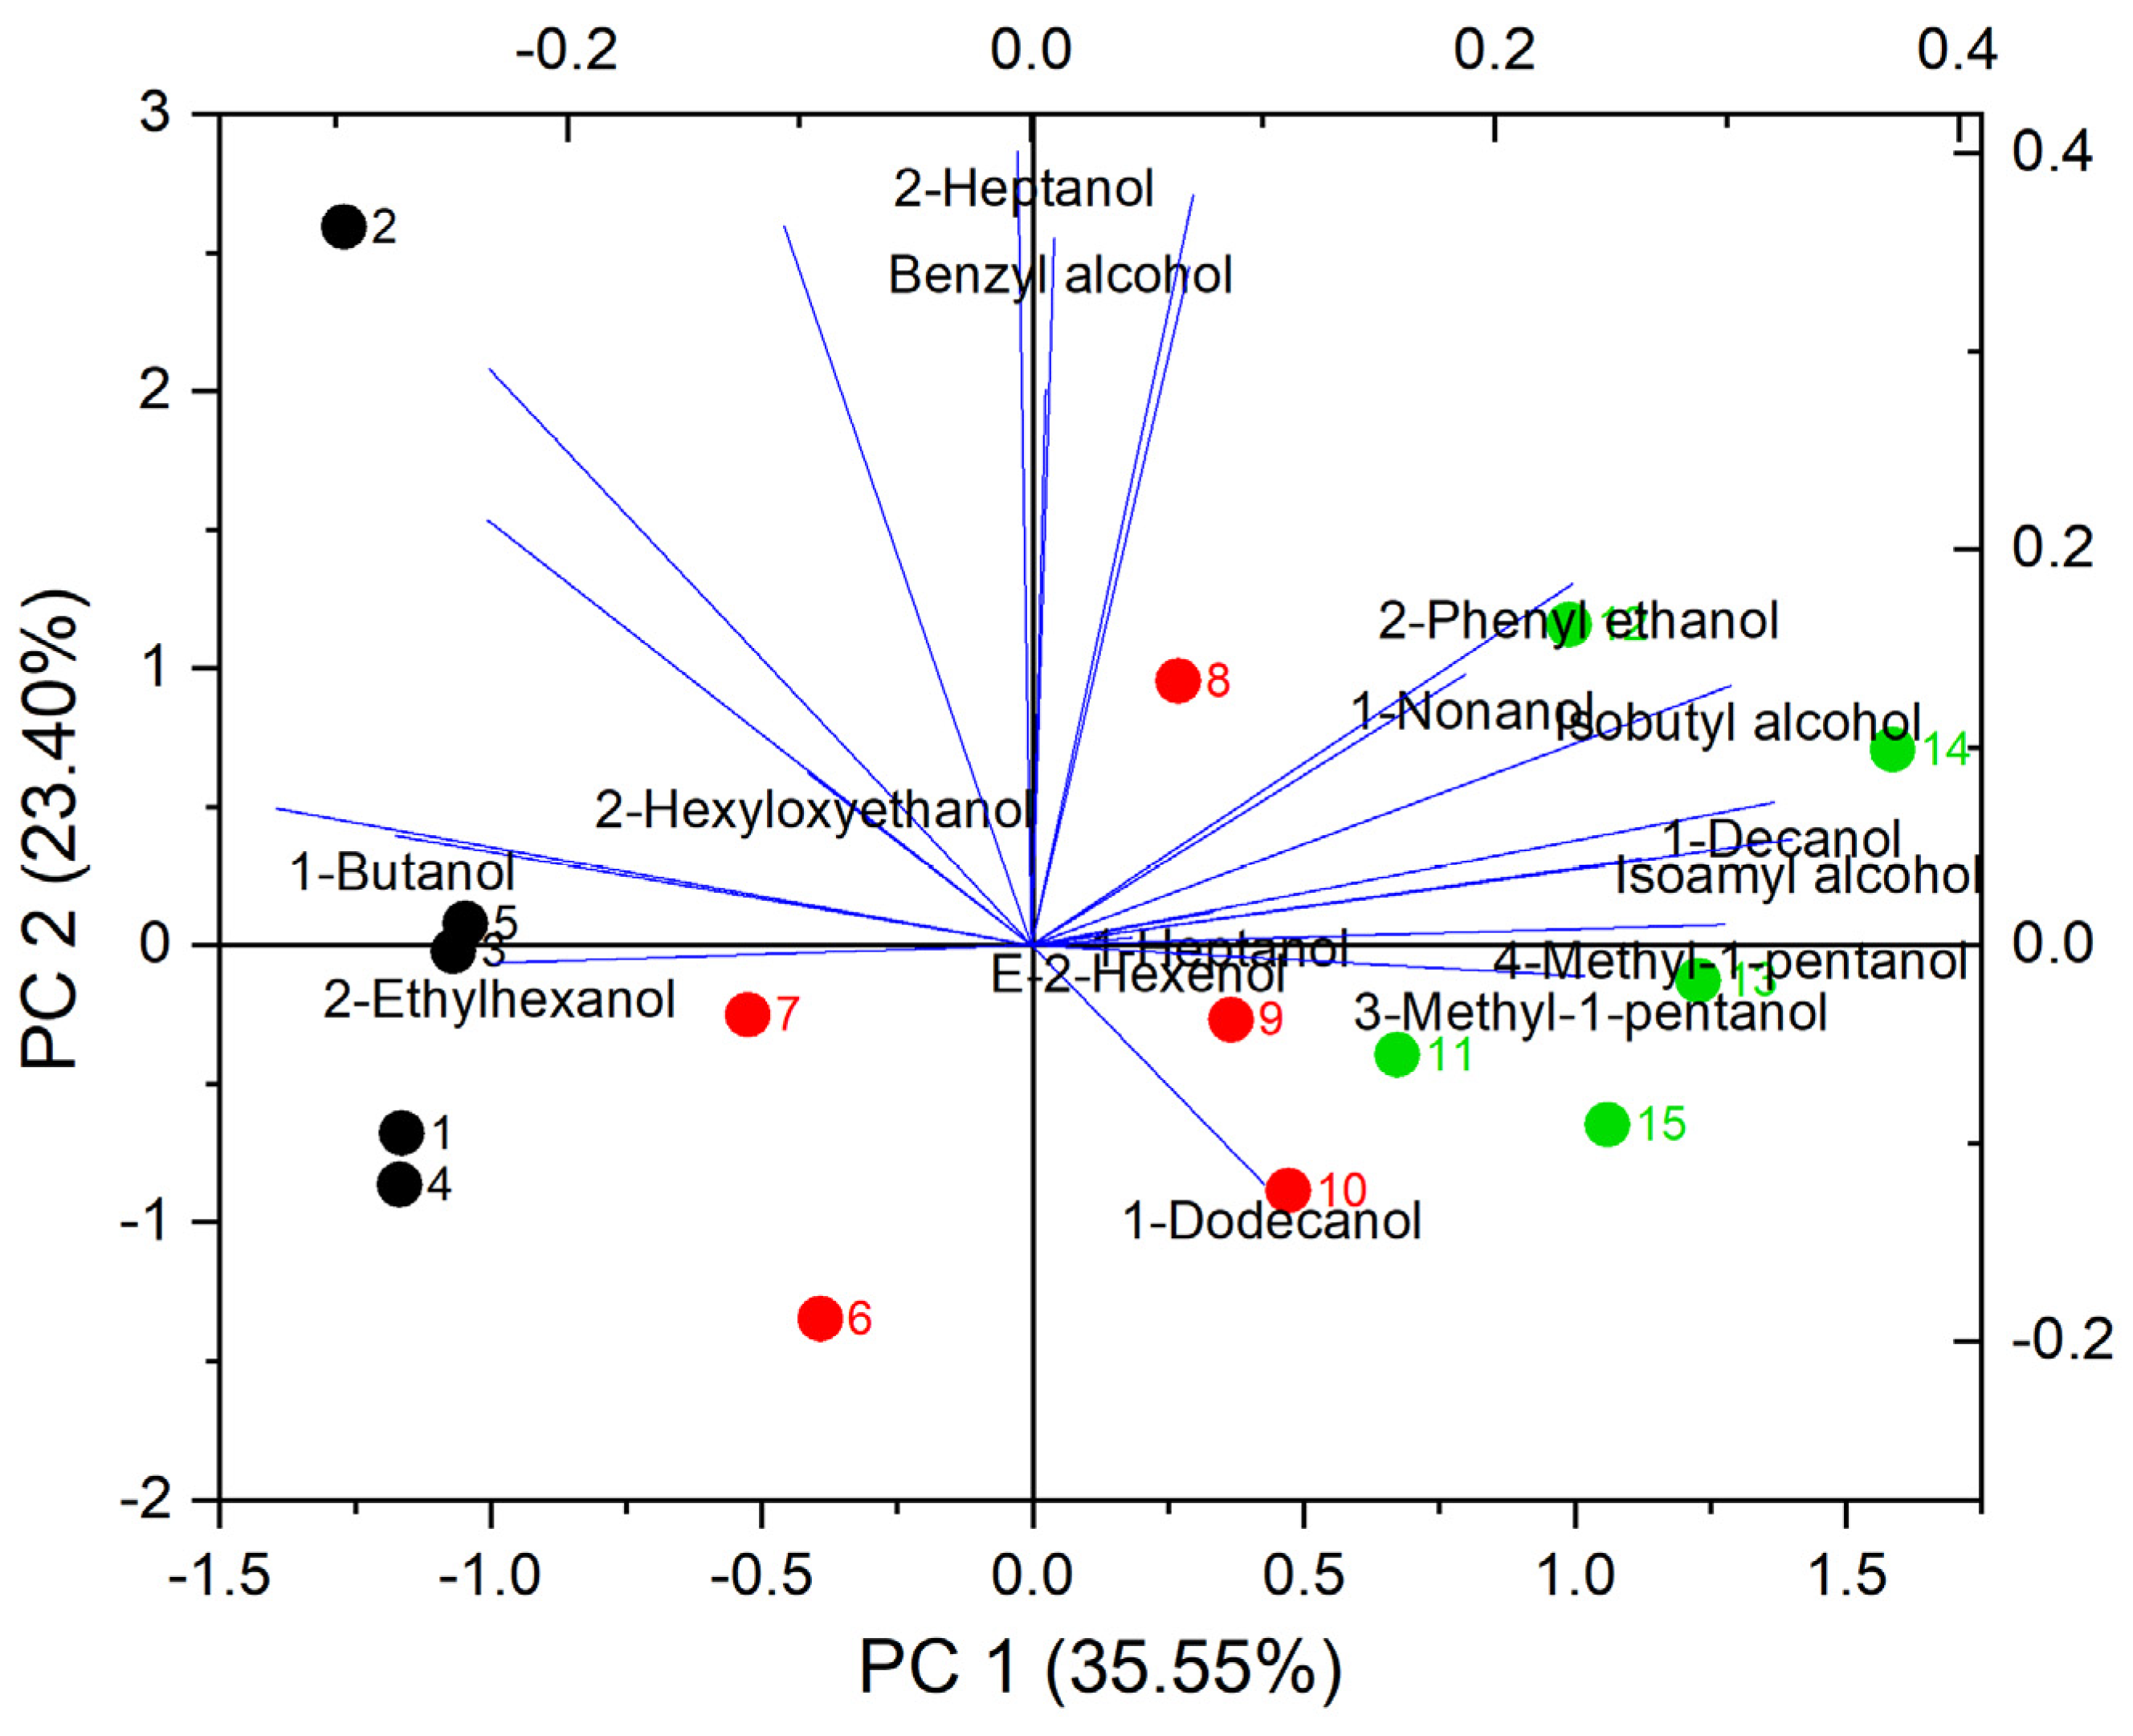
Principal component analysis (PCA) was performed to evaluate the effect of each treatment on each volatile compound.
Figure 5 and
Figure 6 show the results of PCA for all the treatments and volatile compounds explored. A total of 15 samples were analyzed, corresponding to 5 samples for each nitrogen supplementation. The PCA plot for higher alcohols in
Figure 5 presents the component in the
x-axis with 35.6% of the variance, and in the
y-axis, the other component with 23.4% of the variance. Both represent 59% of the total variance. A difference in the sample’s distribution was observed for higher alcohols: samples 1 to 5 (DAP) at the left, samples 6 to 10 (LDH) at the center, and samples 11 to 15 (HDH) at the right. The samples with DAP obtained the highest variability and dispersed along the
y-axis but not along the
x-axis. Various higher alcohols are located to the right due to their influence contained in PC 1. One of these higher alcohols is the 3-methyl-1-pentanol, which presented a significantly higher concentration in HDH-supplemented wines and significant OAV (
Table 1 and
Table 2).
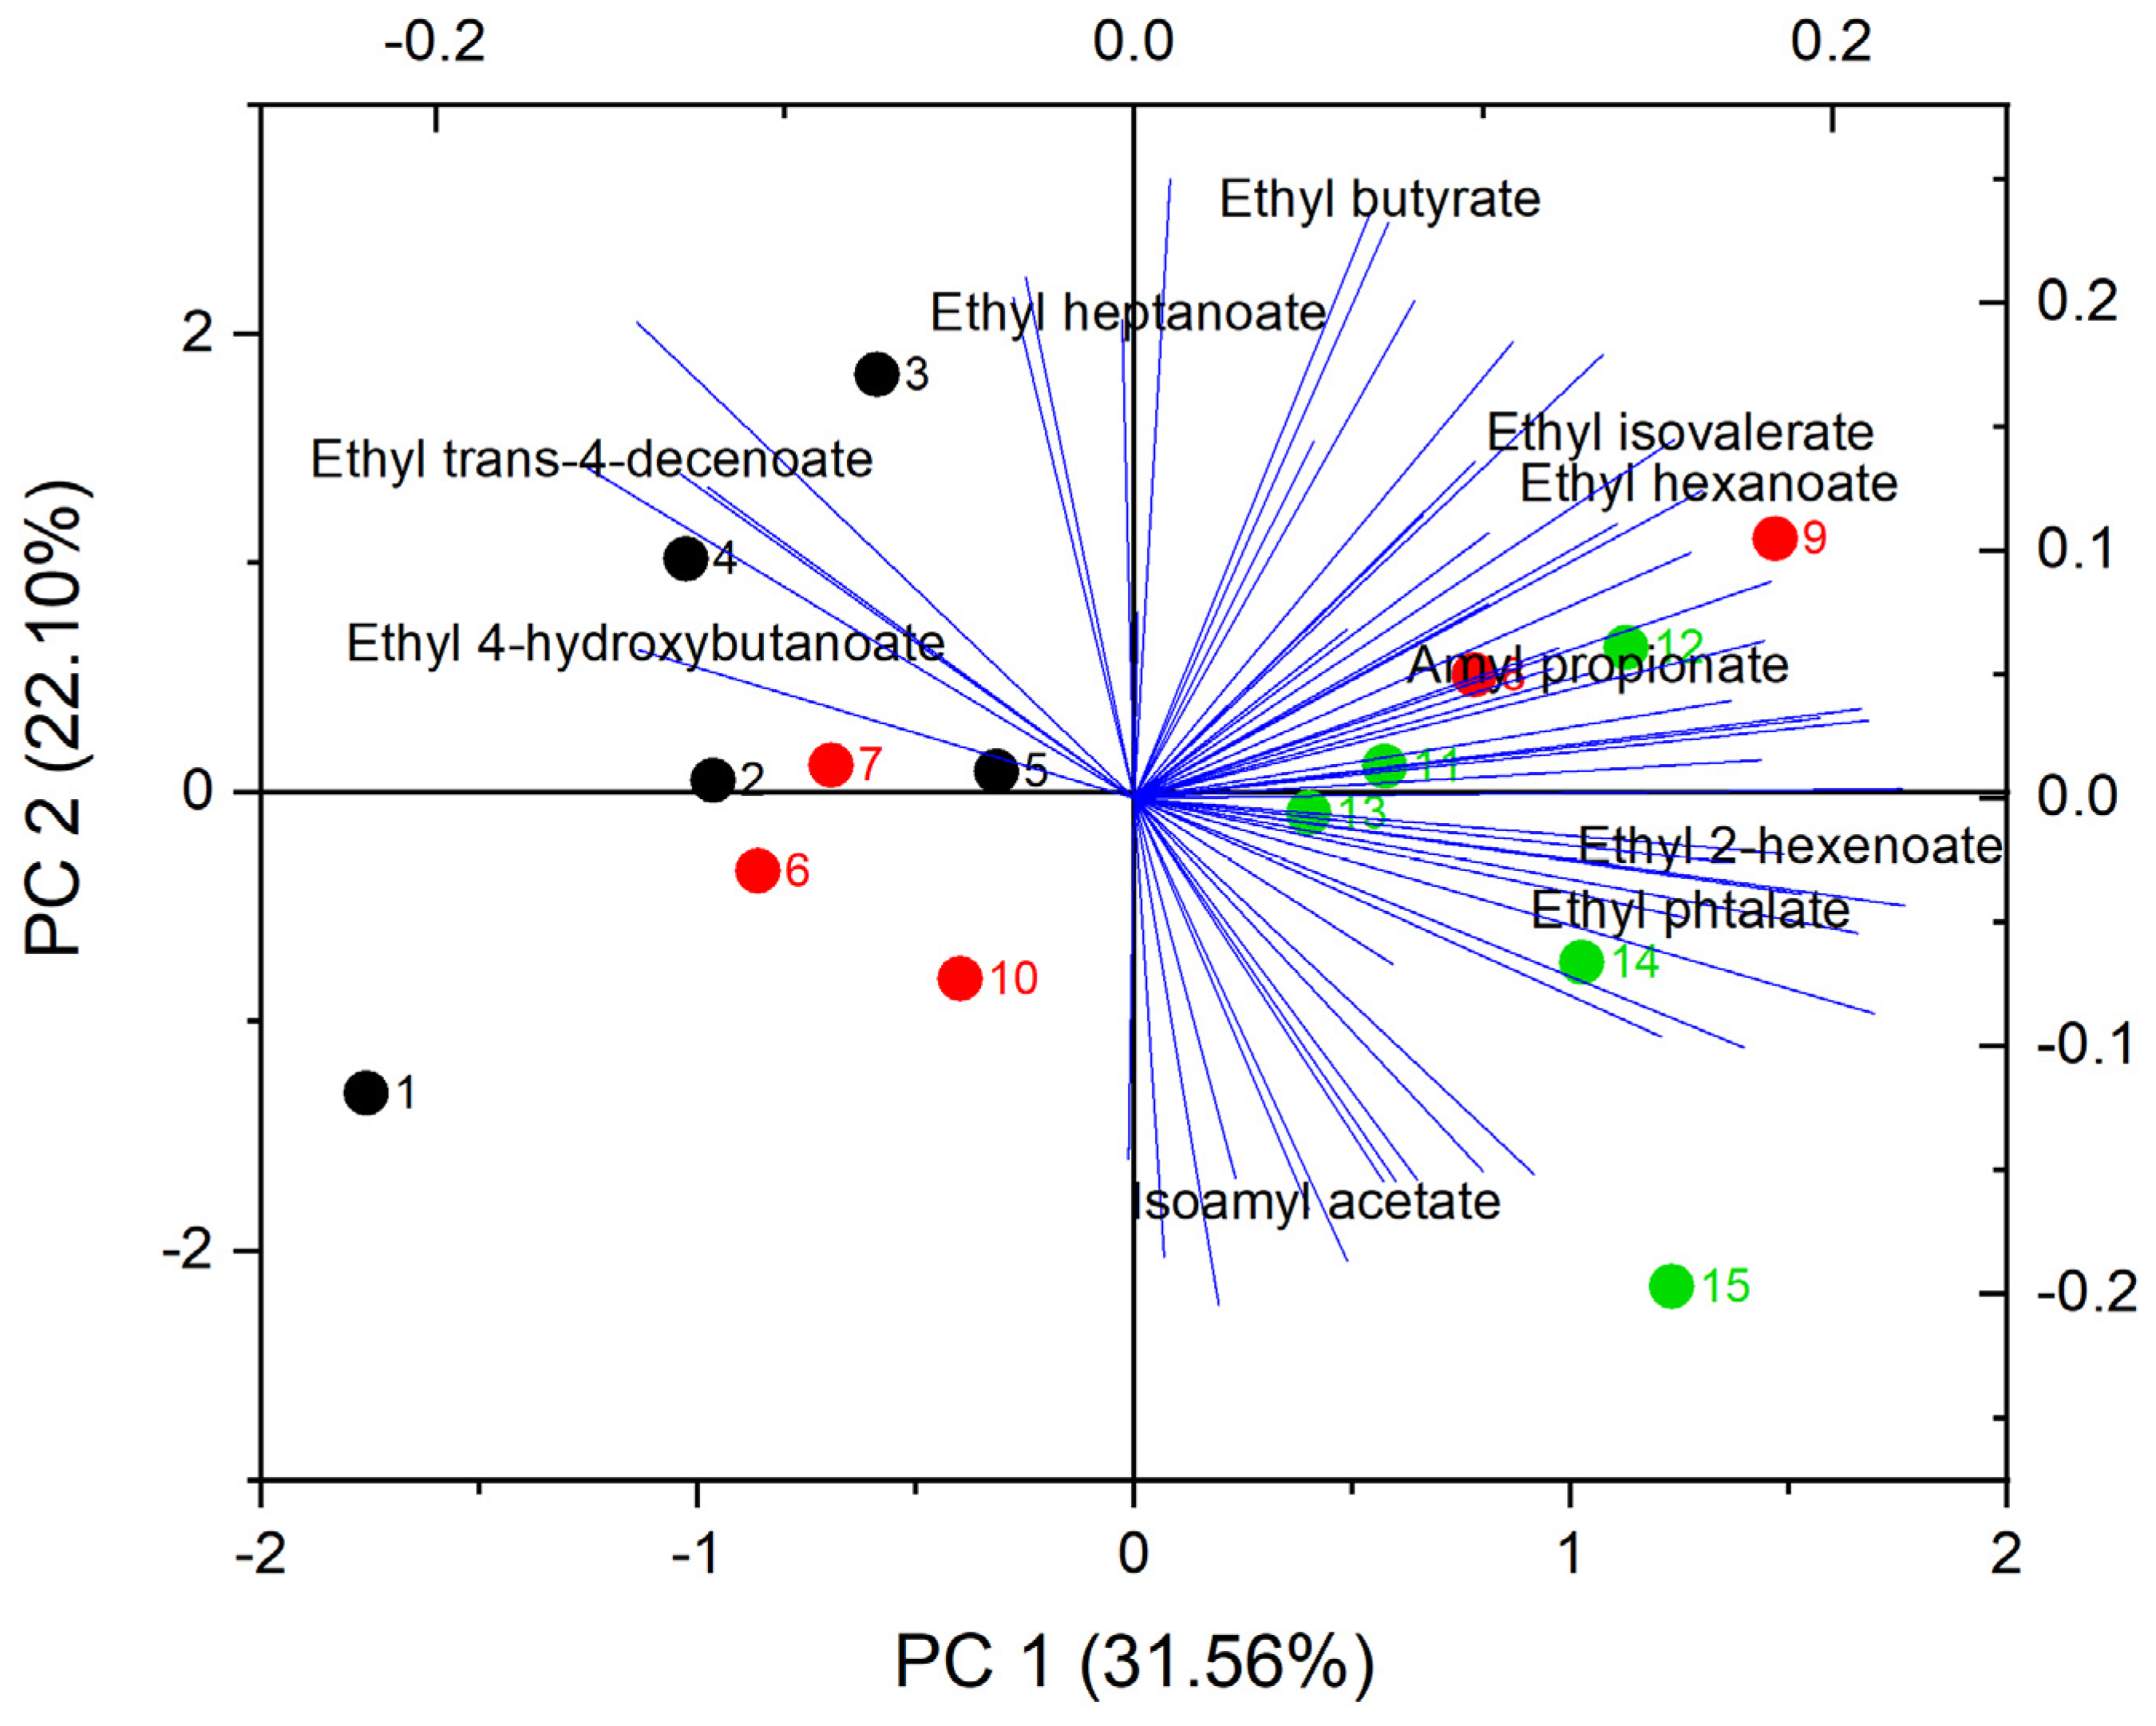
Other relevant higher alcohols are isoamyl alcohol, isobutanol, and 2-phenylethanol. These are located on the right, together with the HDH samples. The PCA results suggest an influence of HDH treatment on the formation of these compounds. The PCA for esters is plotted in
Figure 6. Almost all analyzed esters are located to the right of the plot, where they overlap with the points corresponding to the HDH and LDH samples. Except for citronellyl acetate, all acetate esters are in this zone and are generated by the amino acid metabolism of the yeasts. Regarding other compounds, the variability of isoamyl acetate is mainly involved in PCA 2, which also occurs for ethyl butyrate to a lesser extent. Except for isoamyl acetate, these compounds are ethyl esters generated by fatty acid metabolism. This suggests some correlation between the nitrogen source and the metabolism of these esters.
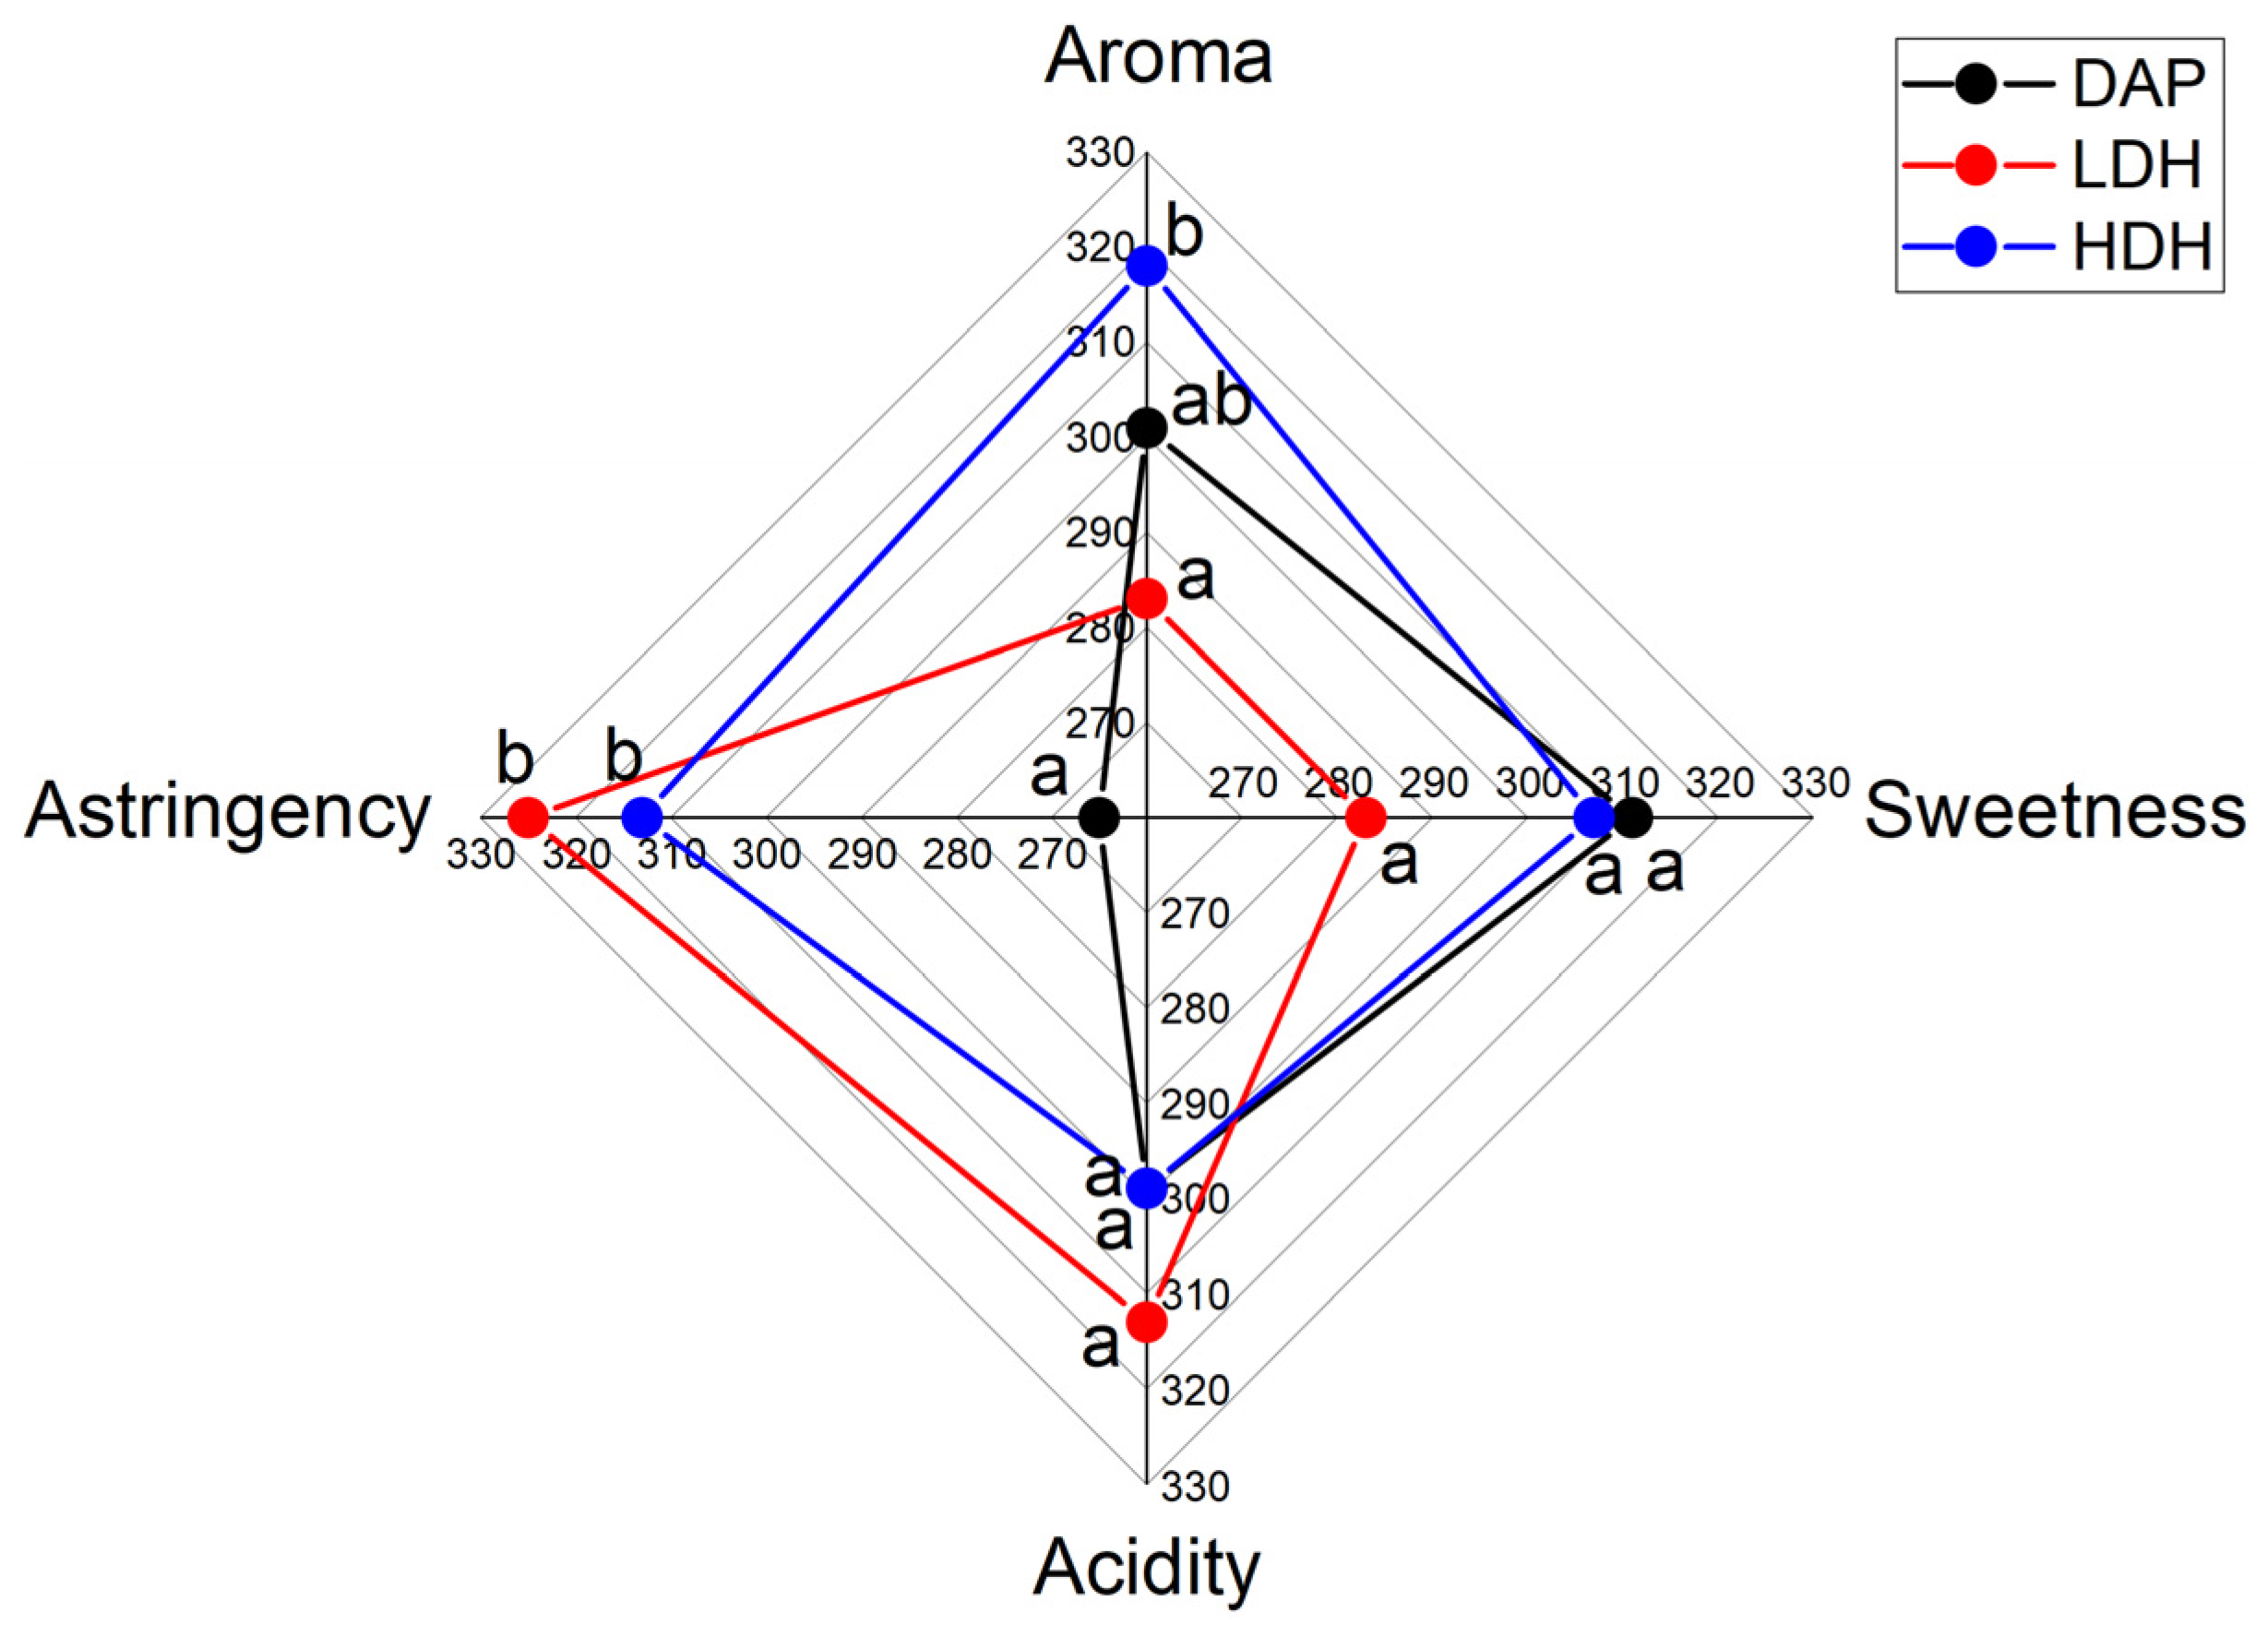
The evaluation of sensory attributes by the sensorial panel provided information about consumers’ preferences and qualifications of attributes of the different wines. The results for ranked sensory attributes are plotted in
Figure 7. Significant differences between the wines were detected in aroma and astringency. A significant difference in aroma was detected between both YPHs. Astringency differences were detected between DAP- and both YPH-supplemented wines.
The highest qualification in aroma was assigned to HDH supplementation, while both YPH-supplemented wines were qualified with the highest astringency. The attributes of sweetness and acidity did not present significant differences among the different supplemented wines. The panelists were asked for their preference among the wine samples. The results are presented in
Table 3. The preference was significantly different between all treatment comparisons. The panelists’ preference for wine samples in decreasing order was DAP-, HDH-, and LDH-supplemented.
4. Discussion
Overall, the YPH-supplemented fermentations performed similarly to the DAP-supplemented fermentations. However, differences were noted in the initial fermentation rate, where the HDH-supplemented fermentation was faster than the others. We inferred that shorter-length peptides were more rapidly assimilated by the yeasts. This finding agrees with previous studies on the availability and assimilation of nitrogen sources, especially with Kevvai et al. [
19], where a preference for nitrogen assimilation from YPH was detected. For the substrate utilization, residual sugar concentrations were similar among the different nitrogen supplementations and did not present significant differences. Nevertheless, a more interesting and significant impact was observed in the production of higher alcohols and esters. Increased concentrations of higher alcohols and esters compounds were observed in wines produced with YPH-supplementation. The influence of the YPH-supplementations was observed in individual volatile compounds (
Table 1) and in the results of PCA (
Figure 5 and
Figure 6). These findings suggest a metabolic impact by the presence of peptides from organic nitrogen sources. These observations also agreed with previous studies on the effect of organic nitrogen sources on the volatile compounds of wine [
13,
14,
15,
16,
17]. However, studies on the metabolic effects caused by the rapid-assimilated nitrogen sources are required to evidence the changes in the metabolic fluxes directed to the production of higher alcohols and esters. Some studies reported that higher alcohols are produced by amino acid metabolism [
31]. Isoamyl alcohol, isobutyl alcohol, and 2-phenyl ethanol are produced from leucine, valine, and phenyl alanine, respectively. These higher alcohols were detected in the wine samples and presented significant differences between the YPH- and the DAP-supplemented wines. Among the esters, the group formed by ethyl isovalerate, ethyl 2-methyl butyrate, and ethyl isobutyrate display an odorant synergy that could contribute to a red fruit aroma in red wines [
32,
33]. From the group of volatile compounds presenting higher significant concentrations, the 3-methyl-1-pentanol and the ethyl-2-hexenoate obtained significant OAV. The olfactory descriptors associated with these compounds are fusel, cognac, wine, cocoa, fruit, and pungent for the higher alcohol, and sweet, fruity, and vegetable for the ester. The differences in aroma detected by the panelists could have been caused by the presence of these significant volatile compounds. The preference for the DAP-supplemented wine could be influenced by the higher astringency perceived in the YPH-supplemented wines.
The recycling and utilization of yeast protein hydrolysates as a nitrogen source for wine fermentation is justified by the observed increase in higher alcohols and esters. The impact on wine tasting needs to be evaluated by experts and by a more extended consumers’ preference test.


 ,
, 


