Article

Optimization of Soybean Meal Fermentation for Aqua-Feed with Bacillus subtilis natto Using the Response Surface Methodology

1
The United Graduate School of Agriculture Sciences, Kagoshima University, Kagoshima 890-0056, Japan
2
Laboratory of Aquatic Animal Nutrition, Faculty of Fisheries, Kagoshima University, Kagoshima 890-0056, Japan
3
Laboratoire d’Hydrobiologie et Aquaculture, Faculté des Sciences Agronomiques’, Université d’Abomey Calavi, Cotonou 01 BP 526, Benin
4
Centre for Research on Environmental Ecology and Fish Nutrition of the Ministry of Agriculture, Shanghai Ocean University, Shanghai 201306, China
5
Laboratory of Nutritional Biochemistry and Feed Chemistry, Faculty of Agriculture, Kagoshima University, Kagoshima 890-0056, Japan
6
College of Agriculture and Forestry Technology and Bioengineering, Hanzhong Vocational and Technical College, Hanzhong 723002, China
*
Author to whom correspondence should be addressed.
Fermentation 2021, 7(4), 306; https://doi.org/10.3390/fermentation7040306
Submission received: 15 November 2021 / Revised: 6 December 2021 / Accepted: 8 December 2021 / Published: 10 December 2021
(This article belongs to the Topic Bioreactors: Control, Optimization and Applications)

Abstract

:
This study aimed to improve the nutritional value of soybean meal (SBM) by solid-state fermentation (SSF) using Bacillus subtilis natto (B. s. natto) to overcome the limitations of SBM usage in aquafeed. The response surface methodology (RSM) was employed to explore the relationships of fermentation conditions, such as temperature, time, water-substrate ratio, and layer thickness, on the degree of protein hydrolysis (DH) and the crude protein (CP) content. The optimum conditions for achieving the higher DH (15.96%) and CP (55.76%) were 43.82 °C, 62.32 h, 1.08 of water-substrate ratio, and a layer thickness of 2.02 cm. CP and DH in the fermented soybean meal (FSM) increased by 9.8% and 177.1%, respectively, and crude fiber decreased by 14.1% compared to SBM. The protein dispersibility index (PDI) decreased by 29.8%, while KOH protein solubility (KPS) was significantly increased by 17.4%. Flavonoids and total phenolic acid content in FSM were increased by 231.0% and 309.4%, respectively. Neutral protease activity (NPA) also reached a high level (1723.6 U g−1). Total essential amino acids (EAA) in FSM increased by 12.2%, higher than the 10.8% increase of total non-essential amino acids (NEAA), while the total free amino acids content was 12.76 times higher than that of SBM. Major anti-nutritional factors in SBM were significantly reduced during the process, and almost all SBM protein macromolecules were decomposed. Together with the cost-effectiveness of SSF, B. s. natto-fermented SBM products have great potential to improve the plant composition and replace high-cost ingredients in aquafeed, contributing to food security and environmental sustainability.

1. Introduction

For over 60 years, the growth rate of the global apparent food fish consumption has exceeded that of the world population, and it is estimated that about 59% of fish available for human consumption will come from aquaculture production by 2030, up from 52% in 2018 [1]. Fishmeal has been used for most of that period as the major aquafeed, especially for species with high nutritional needs (carnivores), due to the high quality and digestibility of its proteins, its balanced amino acid composition, and the quasi-inexistence of anti-nutritional factors (ANFs) [2,3,4]. However, the increasing demand for protein in the aquaculture industry has greatly affected the supply and price of fishmeal [5]. In addition, overuse of fishmeal may cause a series of environmental problems [6], and higher dependence of aquafeed on fishmeal undermines both marine biodiversity and human food security [7,8]. Therefore, the replacement of fishmeal in aquaculture is a major issue related to economic and environmental sustainability [9,10,11].
Widely used as one of the best alternatives to fishmeal, soybean meal (SBM) has partially or completely replaced fishmeal in animal feed [12,13] but shows imbalanced amino acid composition, high level of carbohydrate content, and potential ANFs, which may lead to adverse effects on digestion, nutrient utilization, and intestinal health [14,15,16,17]. Fish enteritis caused by SBM proteins has become one of the main challenges to sustainable aquaculture [18,19,20]. Proteins that are not fully digested or absorbed can be broken down into ammonia by E. coli, Aspergillus, Salmonella, and other microorganisms in the digestive tract or excreted in feces, resulting in protein waste and environmental pollution [21].
Current studies have shown that microbial fermentation is an effective method to reduce ANFs from SBM [22]. Fermentation improves the digestibility of amino acids and phosphorus in SBM [23], and the fermentation products contain beneficial growth factors, such as proteases, probiotics, organic acids, and small molecular peptides [24,25]. It can improve the nutritional performance of SBM, thus expanding the scope of its usage [26,27].
Solid-state fermentation (SSF) has a long history as a traditional method of food production using diverse organisms, and SSF has been reported to produce more metabolites, such as enzymes and antibiotics, than submerged fermentation [28,29]. SSF comes with many advantages. First, the culture conditions used in SSF are relatively extensive, and the culture medium only needs relatively simple pre-treatment; secondly, the capital investment in industrial production is relatively small, especially in the early stage of industrial production, which is conducive to large-scale production; in addition, the product performance with SSF is better, and the environmental pollution in industrial production is less, which is more conducive to the biological cycle [30,31,32]. SSF with Bacillus subtilis is used to produce traditional fermented soy food, Natto, in Japan. Natto contains functional compound enzymes, bioactive peptides, natto kinase, and γ-polyglutamic acid, as well as vitamins, soy-derived isoflavones, linoleic acid, dietary fiber, and many minerals [33]. Bacillus subtilis natto (B. s. natto) is the probiotic spore-forming bacterium in Natto, a kind of strain with a long history of human consumption known for its definite effect on human health and food safety [34,35]. B. s. natto has attracted much attention in the animal nutrition and feed industry due to its enzymatic, antioxidative, immunomodulatory, anti-inflammatory, and antimicrobial activities [36]. However, there are still only a few studies of the use of B. s. natto fermented soybean meal (FSM) in aquatic feed.
In the present study, SSF technology was used for the fermentation of SBM by B. s. natto. To improve the protein content and digestibility of SBM, the response surface methodology (RSM) based on Central Composite Design was used to evaluate and optimize the effects of temperature, fermentation time, the ratio of water, and bacterial inoculation quantity during the fermentation, targeting the degree of protein hydrolysis (DH) and the crude protein (CP). After completing the optimization of the fermentation factors, the nutrient composition of the SBM before and after fermentation was examined. The effects of fermentation on protein dispersibility index (PDI), KOH protein solubility (KPS), and active antioxidant substances were compared; the neutral protease activity (NPA) secreted by B. s. natto was also tracked over the SSF process. Changes to the amino acids’ profile were analyzed. Various soybean anti-nutritional factors were also determined, and the examination of the degradation of soybean antigenic proteins and the distribution of peptides by SDS-PAGE was carried out.

2. Materials and Methods

2.1. Plant Materials

Defatted SBM containing 50.72 ± 0.30% protein (dry matter basis) was obtained from J-OIL MILLS, Inc. (Tokyo, Japan).

2.2. Starter Culture Preparation

B. s. natto powder (product name: np1) was obtained from Yuzo Takahashi Laboratory, Co., Ltd. (Kaminoyama, Japan).
For inoculum preparation, B. s. natto was activated in Luria–Bertani (LB) liquid medium (pH 7.5) [37] for 24 h at 37 °C with shaking. The cells were adjusted to 109 colony forming units (CFU)/mL with sterilized physiological saline solution and used as inoculum for SSF.

2.3. Solid State Fermentation and Single Factor Tests

SSF was carried out with 100 g of crushed SBM in an aluminum plate after autoclaving (121 °C/20 min). Based on the basic SSF conditions (Table 1.), single-factor conventional optimizations were carried out with the inoculation quantities (107, 108,109,1010,1011 CFU/kg) of B. s. natto in fermentation substrate with the following conditions; culture temperature (31, 34, 37, 40, 43, 46 °C), fermentation time (24, 36, 48, 60, 72, 84 h), water–material ratio (0.4, 0.7, 1.0, 1.3, 1.6, 1.9 v/w), and SBM layer thickness (1.0, 1.5, 2.0, 3.0, 4.0, 5.0 cm). The selection of fermentation conditions using RSM was based on the DH.

2.4. Optimization of Fermentation Process by RSM

Two responses were selected to study the optimized conditions for fermentation. Using DH and CP as response target variables, RSM was applied to determine the optimum levels of four significant variables: culture temperature (A), fermentation time (B), water–material ratio (C), and layer thickness (D) [38]. A 24 factorial central composite design (CCD) with five coded levels (−α, −1, 0, +1, +α (α = 2)) and six replicates at the central point used to estimate the pure error was used to describe the nature of the response surface in the optimum region [39]. The minimum and maximum ranges of variables investigated are listed in Table 2 and Table 3, listing the whole design consisting of 30 experimental points, and the experiment was carried out at random [40].
The experimental results of the CCD were fit with a second-order polynomial equation by multiple regression techniques.
Y = β 0 + i = 1 4 β i X i + i = 1 4 β i i X i 2 + i < j = 2 4 β i j X i X j + e i
where Y is the predicted response, β0 is the model intercept coefficient, βi, βjj, and βij are regression coefficients of the linear, quadratic, and interactive terms, respectively, and ei is the error [41,42].
To validate the modeling results, three independent iterations of the experiment were carried out using optimized conditions representing the maximum points of DH and CP.

2.5. Samples

Samples were collected daily and stored at −20 °C pending the determination of their respective nutritive compositions. Before analysis, all SBMs and FBMs were ground in a rotary mill with a 0.2 mm mesh sieve.

2.6. Degree of Protein Hydrolysis Analysis

The DH was defined as the percentage of peptide bonds cleaved during a reaction and calculated from the ratio of free amino groups to the total number of peptide bonds in soluble factions [43]. DH was determined using the o-phthaldialdehyde (OPA) assay method, as described by Nielsen et al. [44]. The absorbance was measured at 340 nm with a spectrophotometer (HACH, DR/4000U) and using deionized water as the control. The DH was calculated using the formula below.
DH % = NH 2   sample   NH 2   ( acid )   × 100 %
where NH2 (sample) is the concentration of free amino groups of the samples, NH2 (acid) is the total amount of free amino groups in the samples after completely hydrolyzed in 6 M HCl, 110 °C for 24 h [45].

2.7. Nutritional Analysis

The analysis of the nutritional profile was performed according to the standard procedures of AOAC for the determination of the dry matter, CP, crude lipid, and fiber [46,47]. PDI, as an indicator of overprocessing of SBM, was determined using the method of Căpriţă et al. [48]. The KPS was determined according to the procedure of Araba and Dale [49]. The total phenol content of the samples was determined using Folin–Ciocalteau’s reagent with gallic acid as a standard phenolic compound [50]. Total flavonoids were analyzed according to Paolo et al. [51]. The NPA of FSM was determined according to the spectrophotometric method [52]. The obtained supernatant was designated enzyme extract and held at 4 °C for further use. Total amino acids and free amino acids were analyzed using high-performance liquid chromatography (HPLC, Shimadzu Corp. Kyoto, Japan) as described previously by Teshima et al. [53]. TAA and FAA samples were prepared according to Kader et al. [54]. All analyses were performed in triplicate.

2.8. ANFs Assays of SBM and FSM

Trypsin inhibitors were measured in this study using American Oil Chemists’ Society (AOCS) Official Method Ba 12–75 [55]. The concentration of β-conglycinin was measured using an ELISA procedure [56]. Glycinin was also measured using the Glycinin ELISA kit (Wuhan Unibiotest Co., Ltd., Wuhan, China). Lectin content was assayed according to the method of Pusztai and Grant using an enzyme-linked immunosorbent assay [57]. Raffinose and stachyose were extracted from bean flour using the method from Zacharie and Ronald [58], and the contents were quantified by using an HPLC system described previously [59] with an HPLC column Inertsil® NH2 (4.6 × 250 mm, 5 µm; GL Sciences Inc., Tokyo, Japan). Phytic acid content was determined spectrophotometrically based on the method from Reichwald and Hatzack [60]. All experiments were replicated three times.

2.9. SDS-Polyacrylamide Gel Electrophoresis (PAGE) for Protein Separation

Proteins in SBM and FSM were extracted by the method reported by Hong et al. [25]. Soluble proteins were analyzed by SDS-PAGE in the Tris-glycine method using a mini PAGE chamber AE-6530 and an AE-8750 electrophoresis system (ATTO, Tokyo, Japan) with e-PAGEL® HR precast gels (ATTO, Tokyo, Japan). A total of 10 µg of extracted protein was loaded for each well, and the samples were separated at 20 mA for 90 min. Precision Plus ProteinTM Dual Color Standards (Bio-Rad Cat# 161-0374; CA, USA) were used as molecular mass standards. After electrophoresis, the gels were stained for 40 min with 0.1% Coomassie brilliant blue R-250 in 40% methanol and 10% acetic acid and destained overnight in a solution made up of 40% methanol and 10% acetic acid [61].

2.10. Statistical Analysis

RSM was performed using the “rsm” package in R 3.6.1 [62]. Statistical analysis of the data from the CCD model was performed to evaluate the analysis of variance (ANOVA). The quality of the polynomial model equations was judged statistically by the coefficient of determination R2, and its statistical significance was determined by the F-test.
One-sample t-test for comparison between predicted and experimental responses at the optimum condition was performed using package “stats” in R. t-tests for all other comparison experiments were performed using package “stats” in R.
Principal Component Analysis plots were produced in R using the “FactoMineR” package and the “ggplot2” package to visually present the selected significant attributes [63].
All experiments were replicated three times unless stated otherwise. Data were presented as mean values ± standard deviation (SD).

3. Results and Discussion

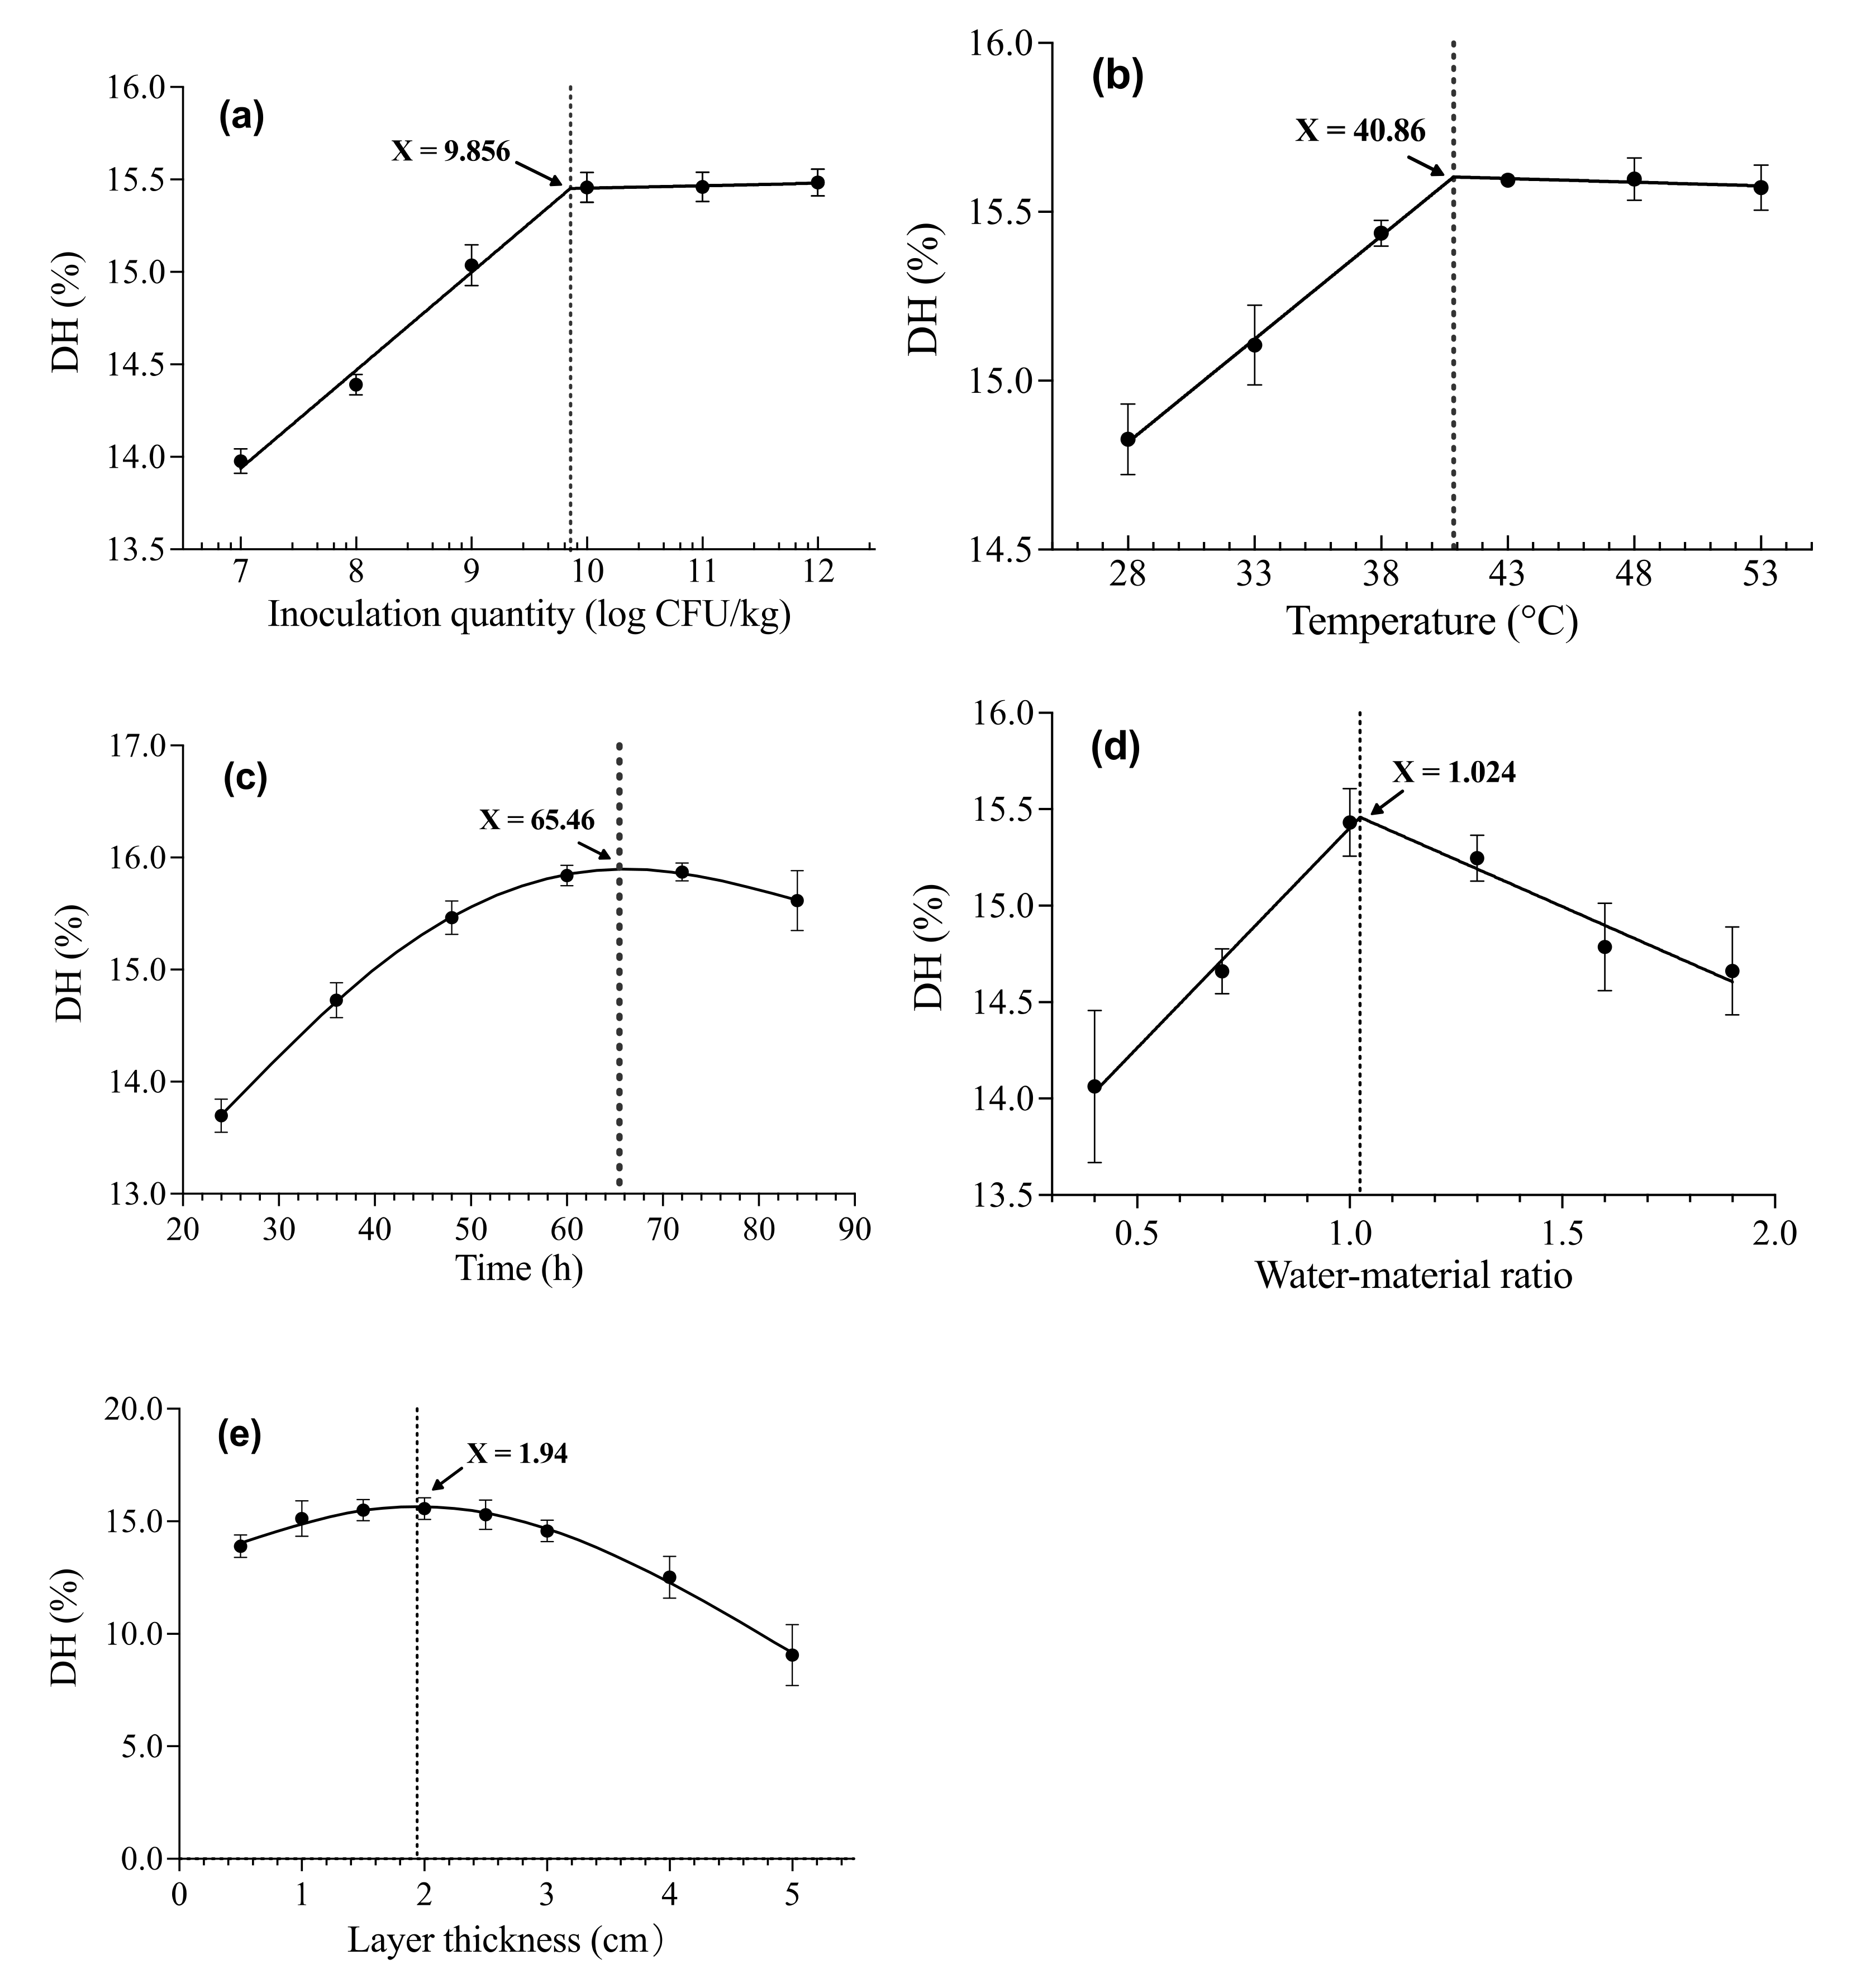
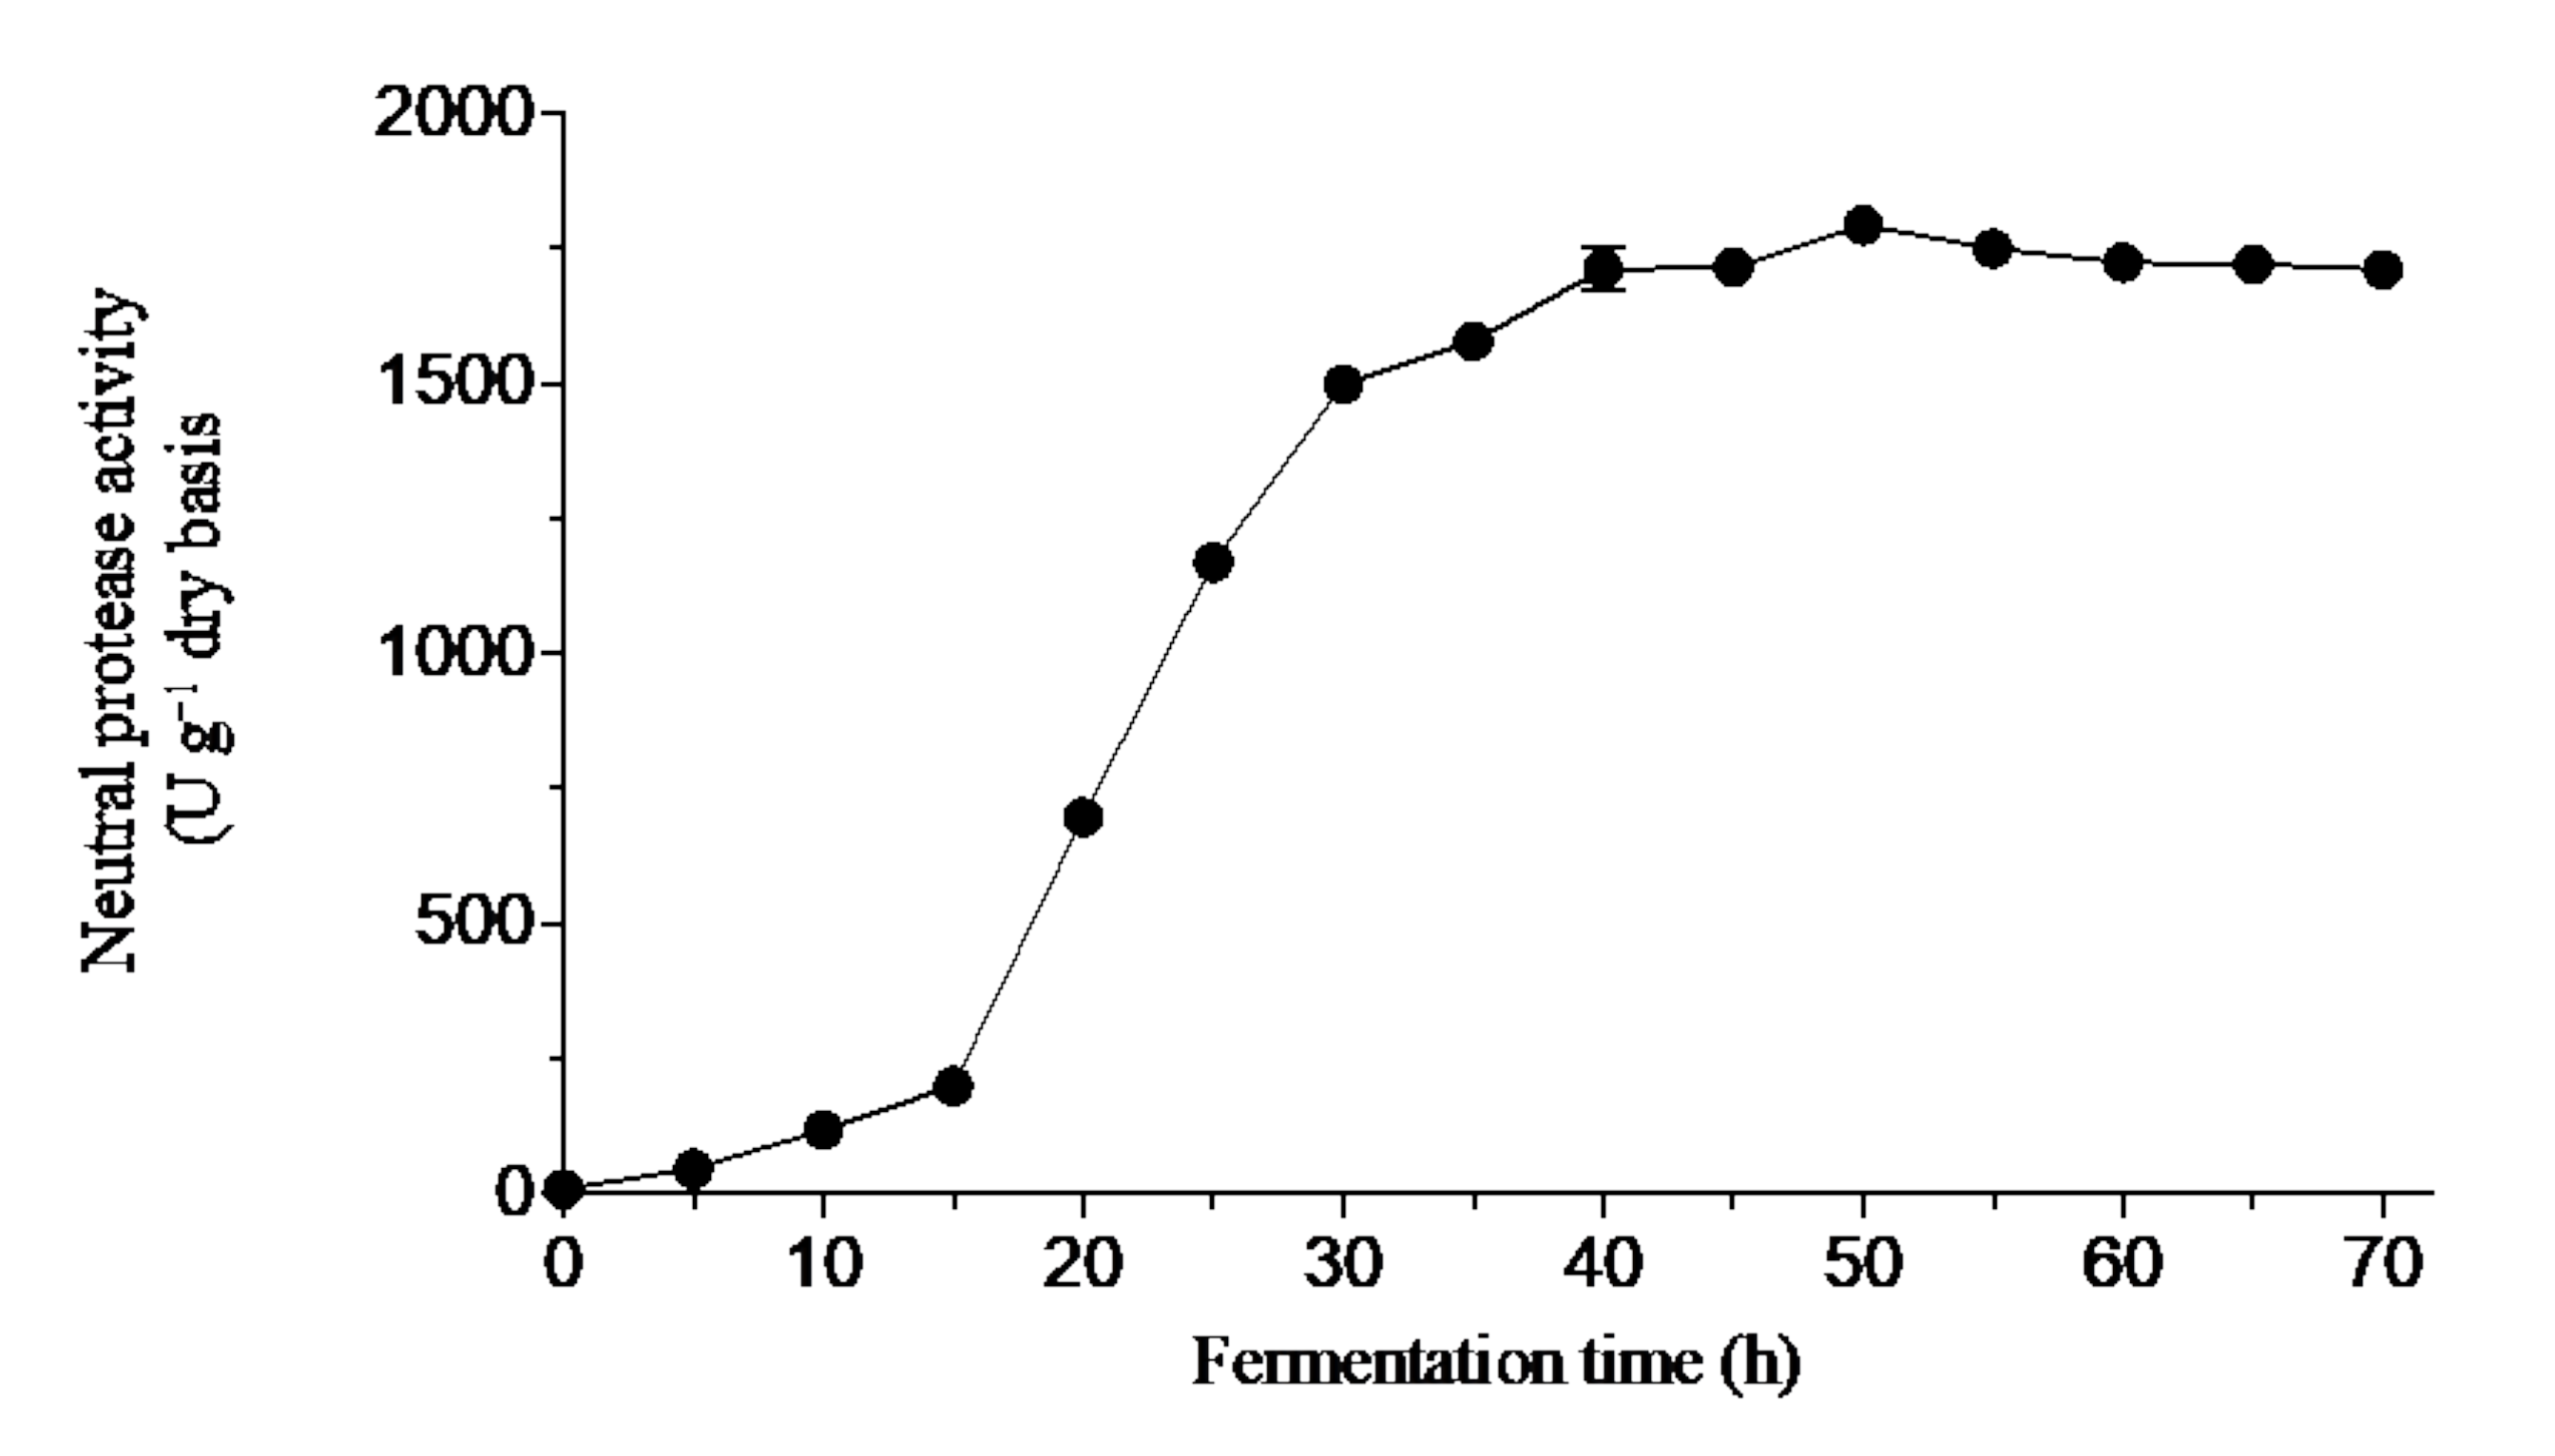
3.1. Single Factor Tests

Single-factor analysis was performed to establish the optimum DH (%) with a fermentation condition using the broken stick pairwise regression model. Considering the single factor in the fermentation process, the following optimum conditions were achieved for the establishment of the interactive effects, which could be useful when the target is only a single factor to maximize DH (%) and could be used to pilot optimum fermentation conditions using other related microbial species.

3.1.1. Effect of Inoculation Quantity of B. s. natto on the DH

As the initial B. s. natto inoculum increased (from 107 to 1010 CFU/kg), the DH presents an increasing trend, as shown in Figure 1a. With the inoculum levels exceeding 1010 CFU/kg, this increase does not continue. This shows that in the inoculation quantity of 1010 CFU per kg, fermentation substrates did not restrict the fermentation kinetics at the initial stage. Therefore, in this work, 1010 CFU/kg B. s. natto was selected as the initial optimal amount of inoculum for the following RSM experiments.

3.1.2. Effect of Fermentation Temperature on the DH

Previous studies have confirmed that temperature affects not only the growth of microorganisms but also the activity of enzymes [64]. As SSF is used for this experiment, it was particularly important to choose a suitable fermentation temperature. Based on the optimum fermentation temperature of B. s. natto [37], the starting point was set at 28 °C, followed by a subsequent increase of 5 °C at each experimental time point until 53 °C is reached. As shown in Figure 1b, the degree of hydrolysis of the fermented protein increases with increasing temperature from 28 to 43 °C, indicating that the activity and number of B. s. natto increased with the gradual increase of temperature, which led to the continuous increase of fermentation rate. However, the DH tends to decrease from 43 °C, which may be due to the fact that the fermentation temperature exceeds the optimum temperature for the growth or metabolism of B. s. natto, slowing down the fermentation activity. According to the broken-line analysis, 41 °C was selected as the 0 level of temperature factor for RSM.

3.1.3. Effect of Fermentation Time on the DH

As shown in Figure 1c, fermentation time has a positive effect on protein hydrolysis within 60 h. However, with the extension of fermentation time, the number of fermentation by-products increases, whereas the quality of fermentation products decreases, reflecting the growth rule of microorganisms, as B. s. natto gradually die out in the process. A time of 66 h was selected as the 0 level of time factor for RSM through curve-fitting analysis.

3.1.4. Effect of Water–Material Ratio on the DH

In the SBM fermentation experiment, the water content of the whole fermentation system is very important, as too high water content affects the transfer of oxygen and limits the growth of aerobic bacteria. Low water content cannot meet the water requirement for strain fermentation and inhibits the growth of bacteria. The experimental results (Figure 1d) showed that the best fermentation effect is achieved when the water–material ratio is 1.1. This was chosen as the 0 level for RSM.

3.1.5. Effect of SBM Layer Thickness on the DH

The experimental results by curve-fitting analysis show that the DH reached the maximum when the layer thickness was 2.0 cm (Figure 1e). This is because the solid matrix is porous and is affected by the low thermal conductivity as it grows. The heat generated by microbial growth and metabolism cannot be transferred to the environment in time, resulting in the increase of matrix temperature and affecting the further growth and metabolism of microorganisms.

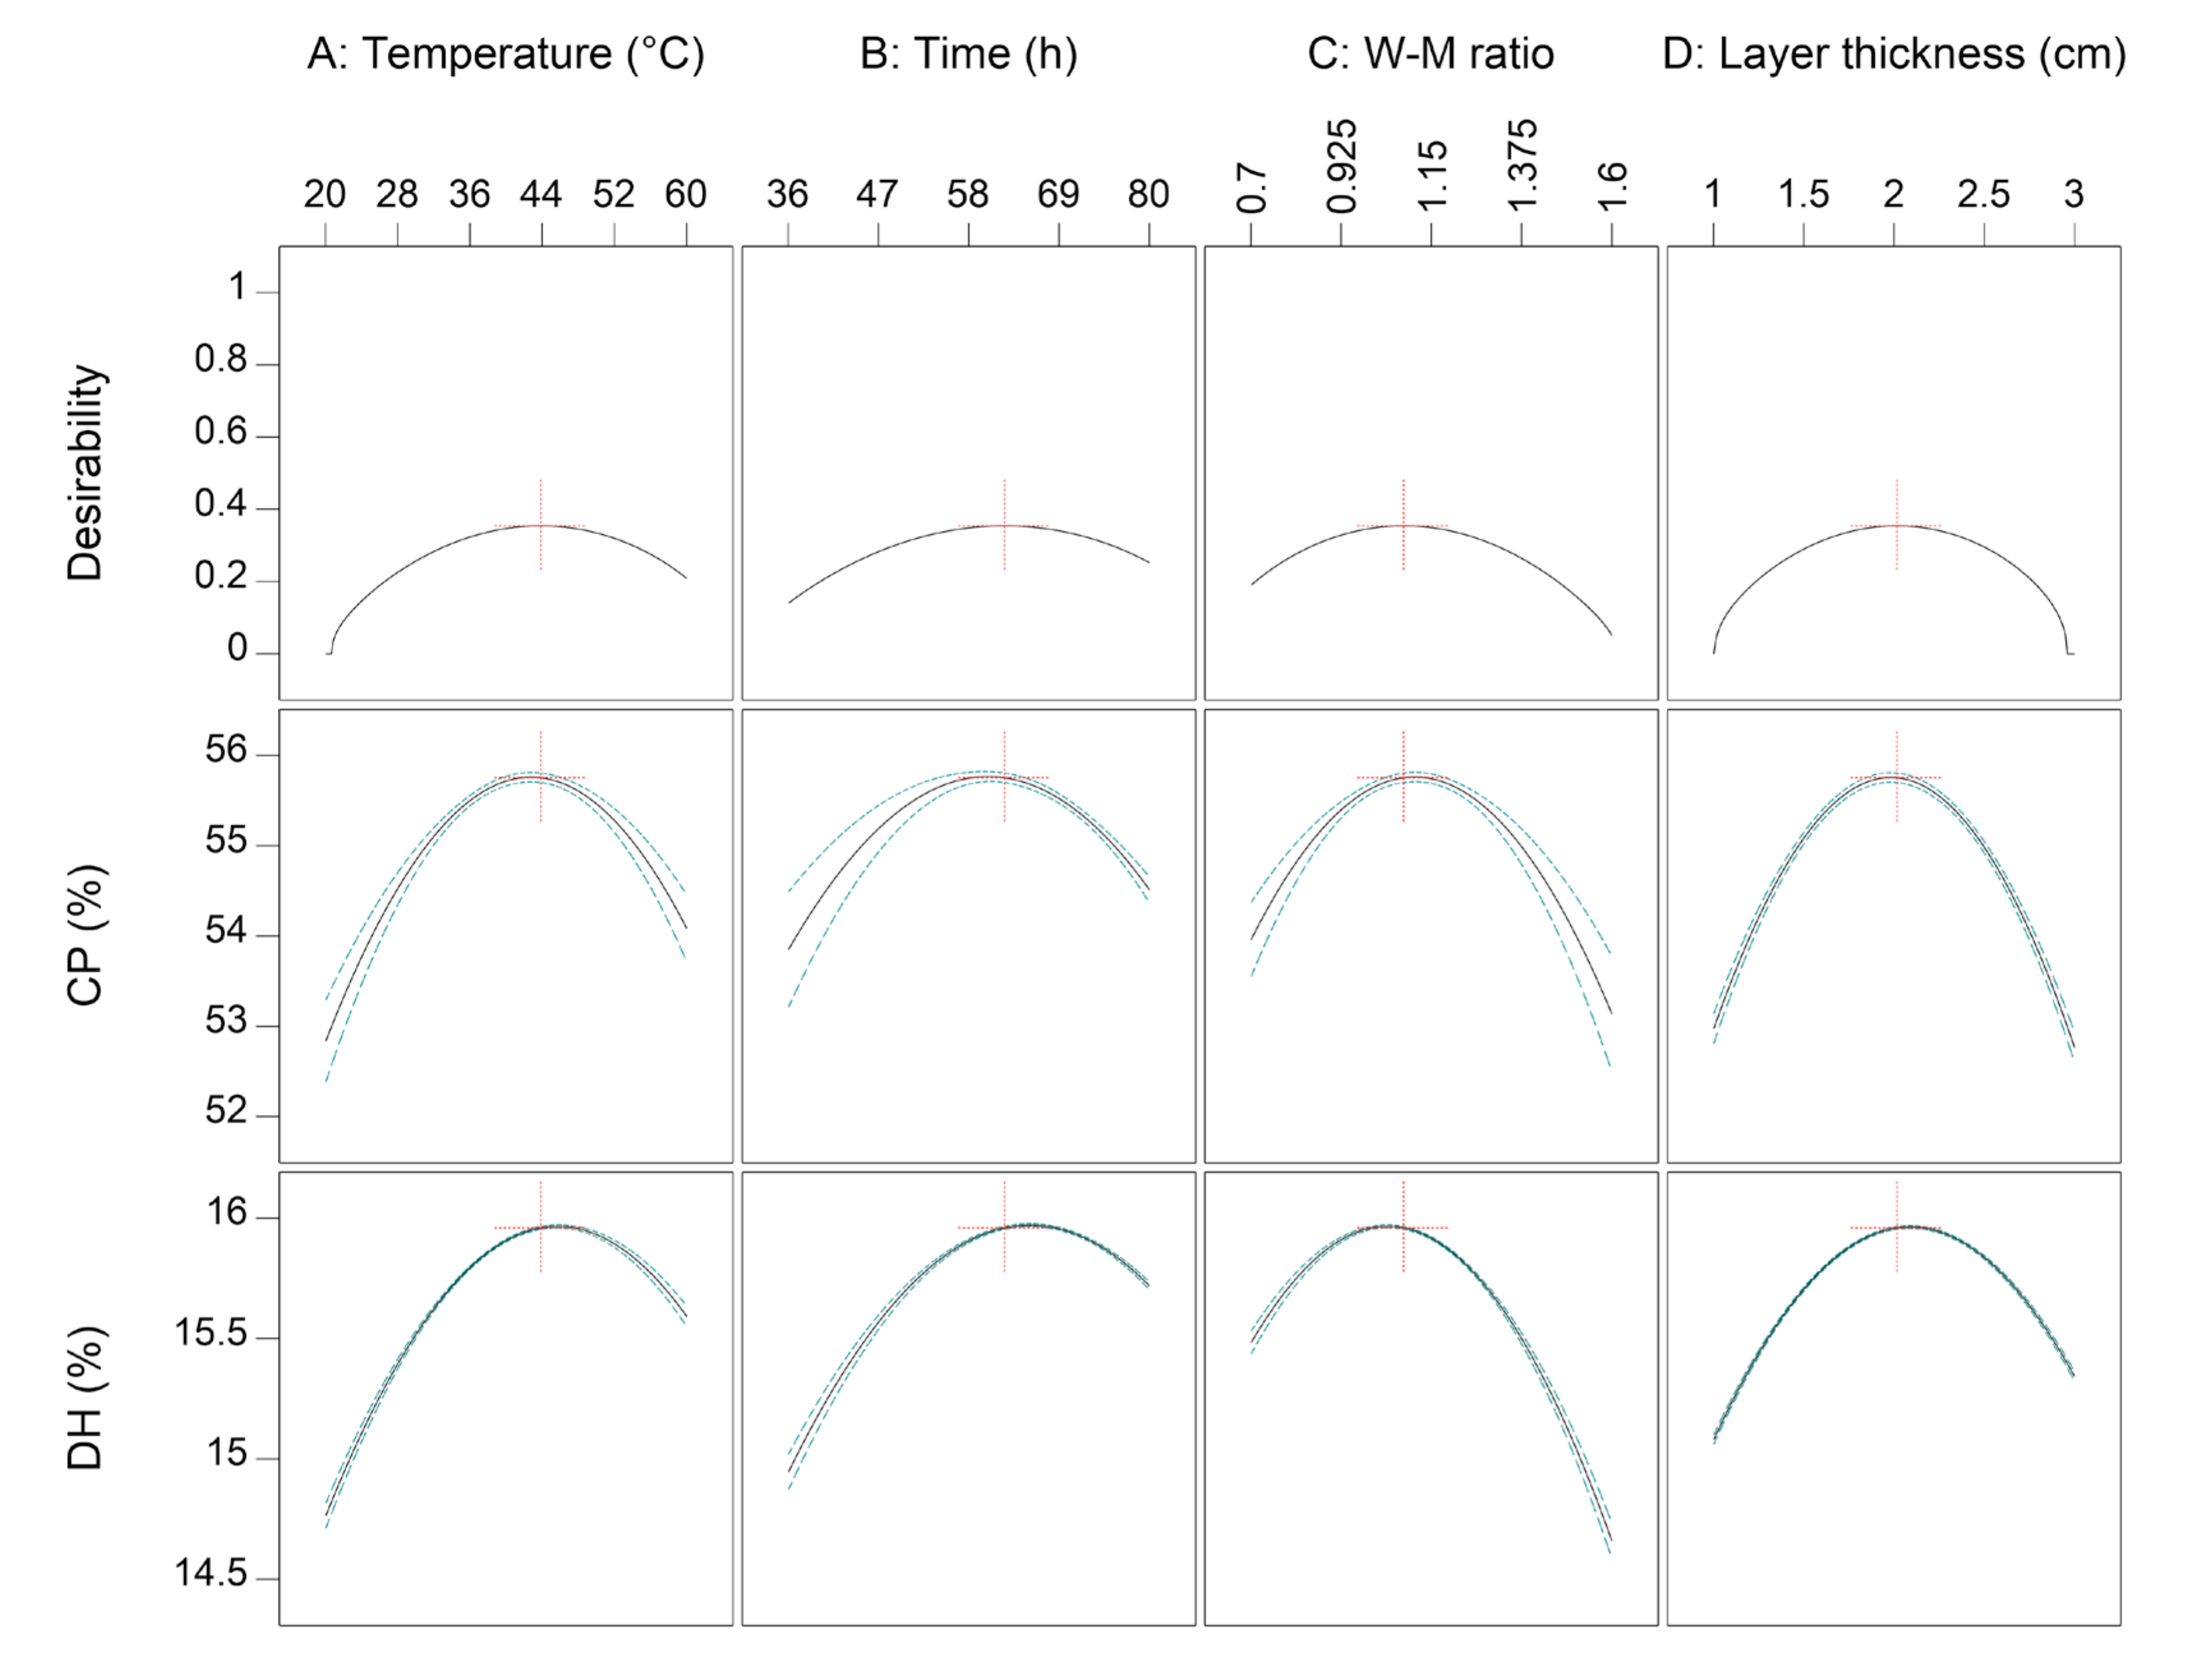
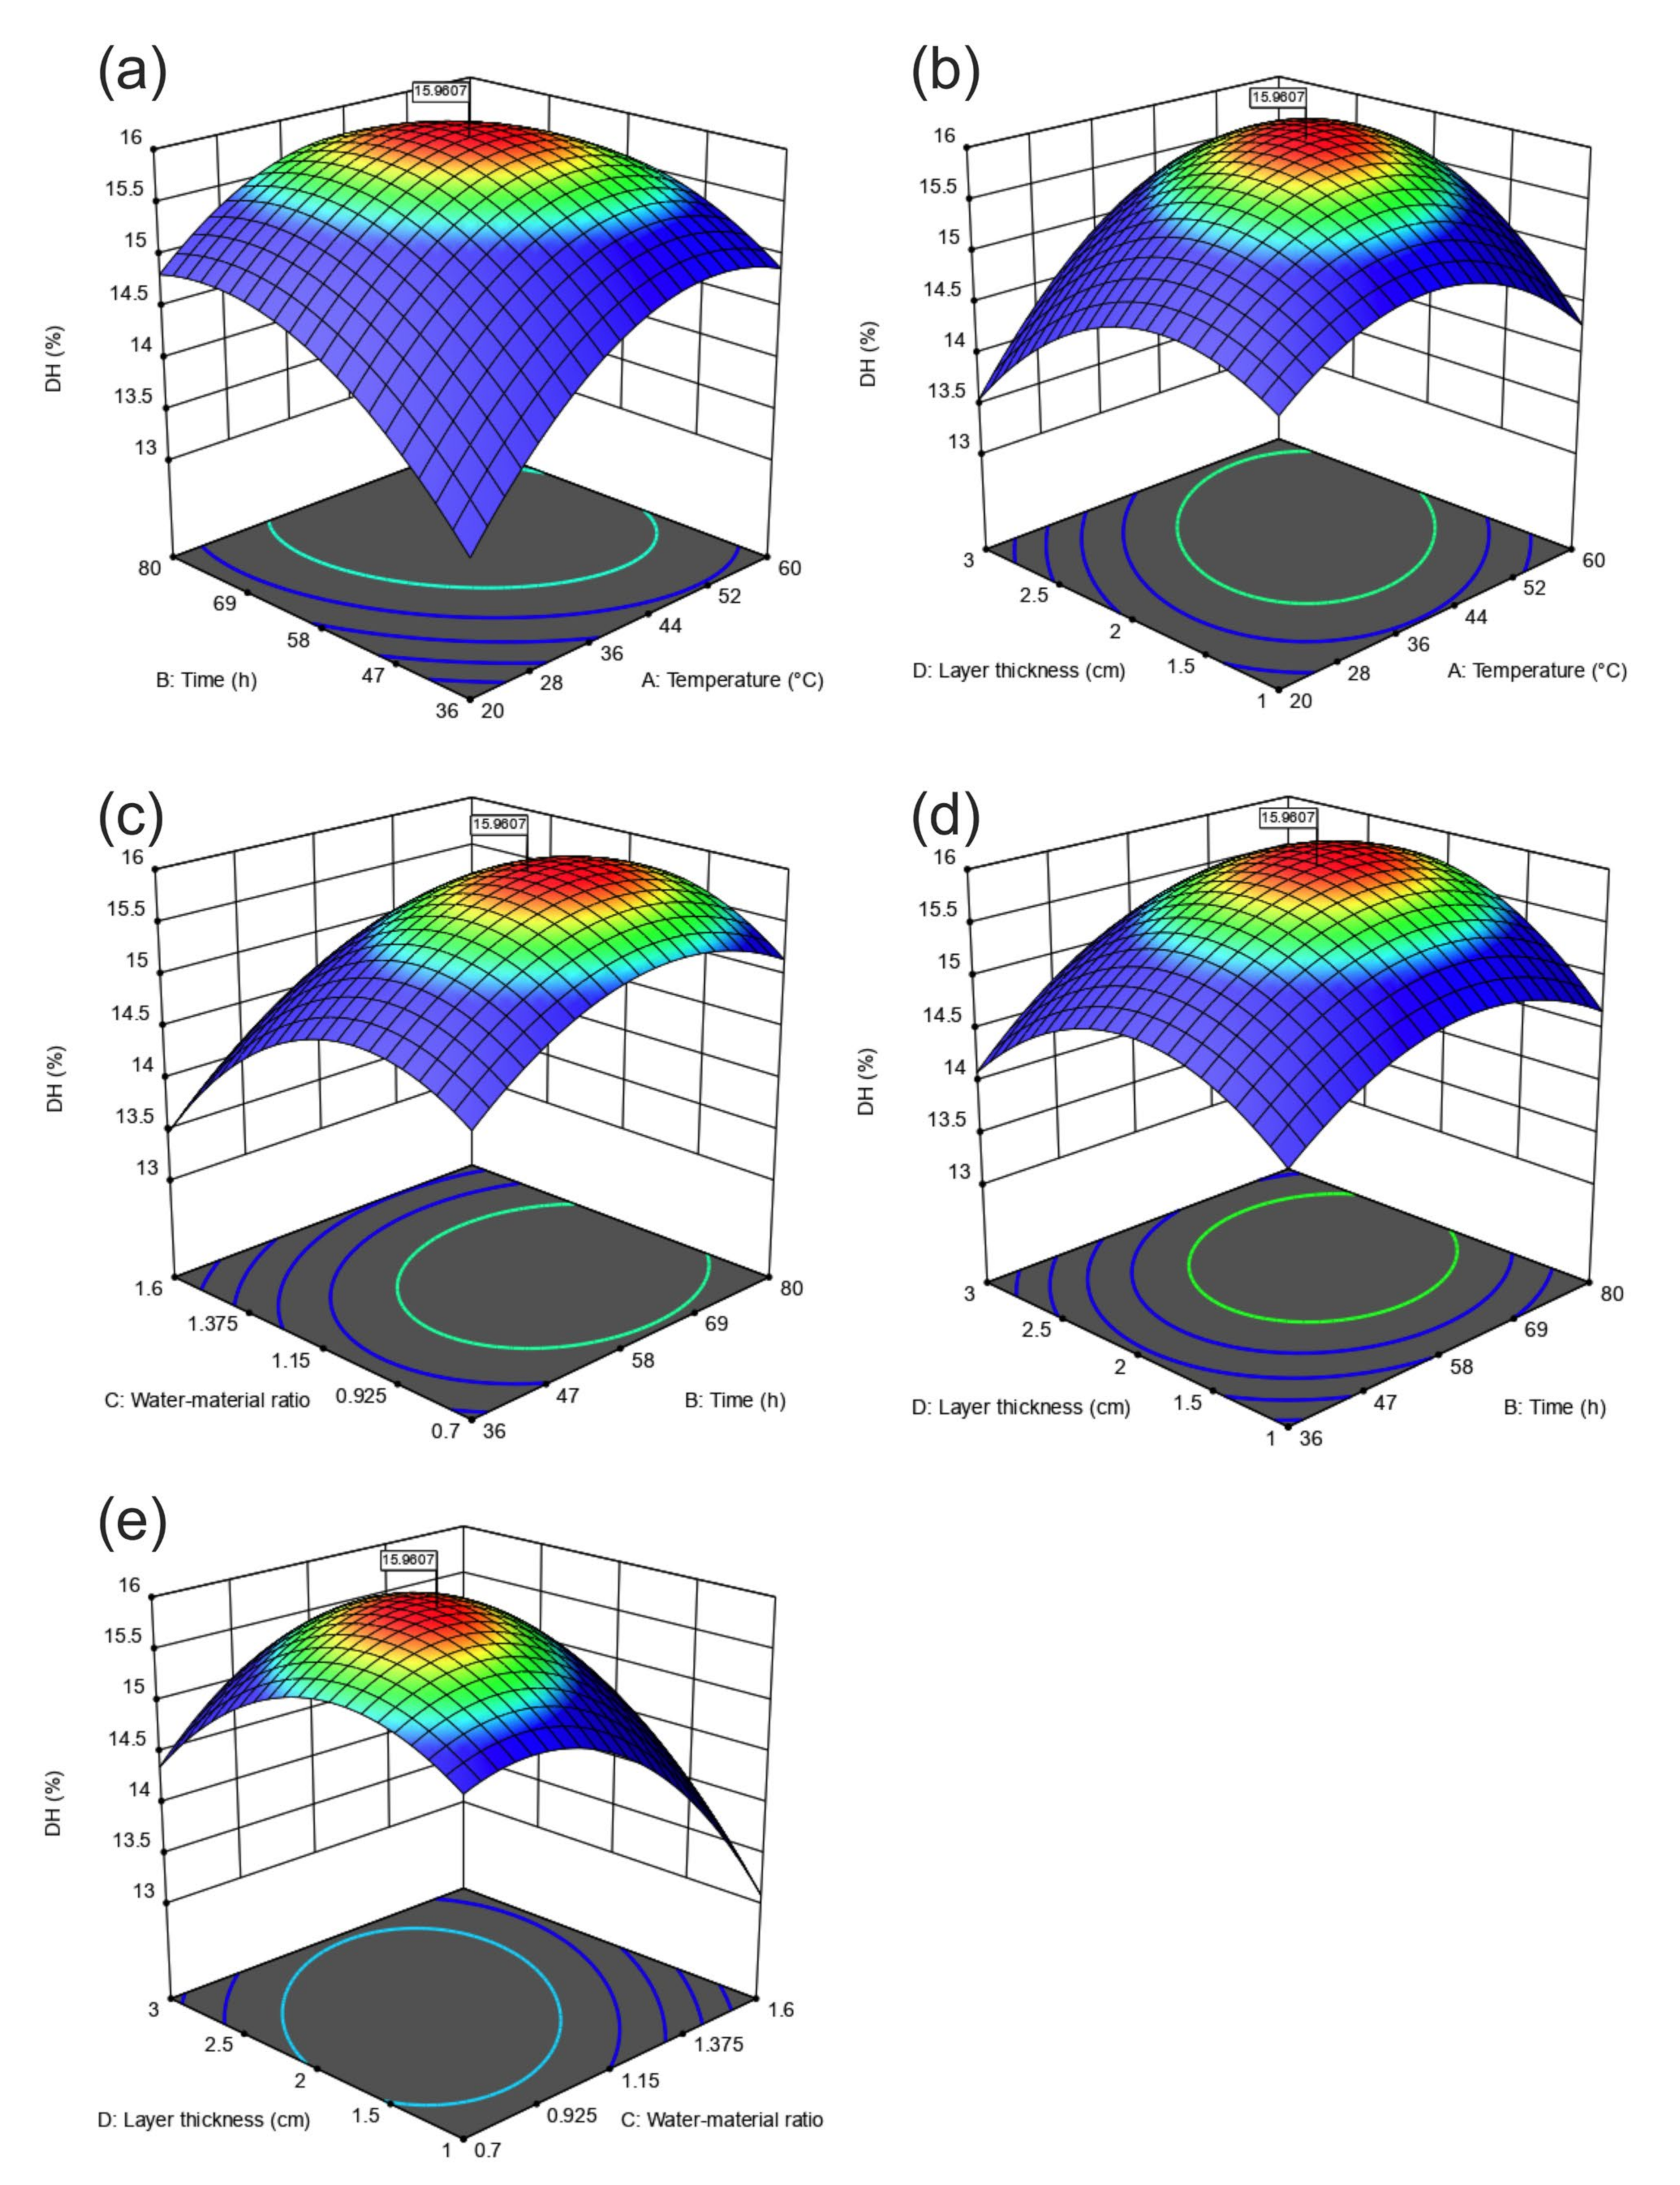
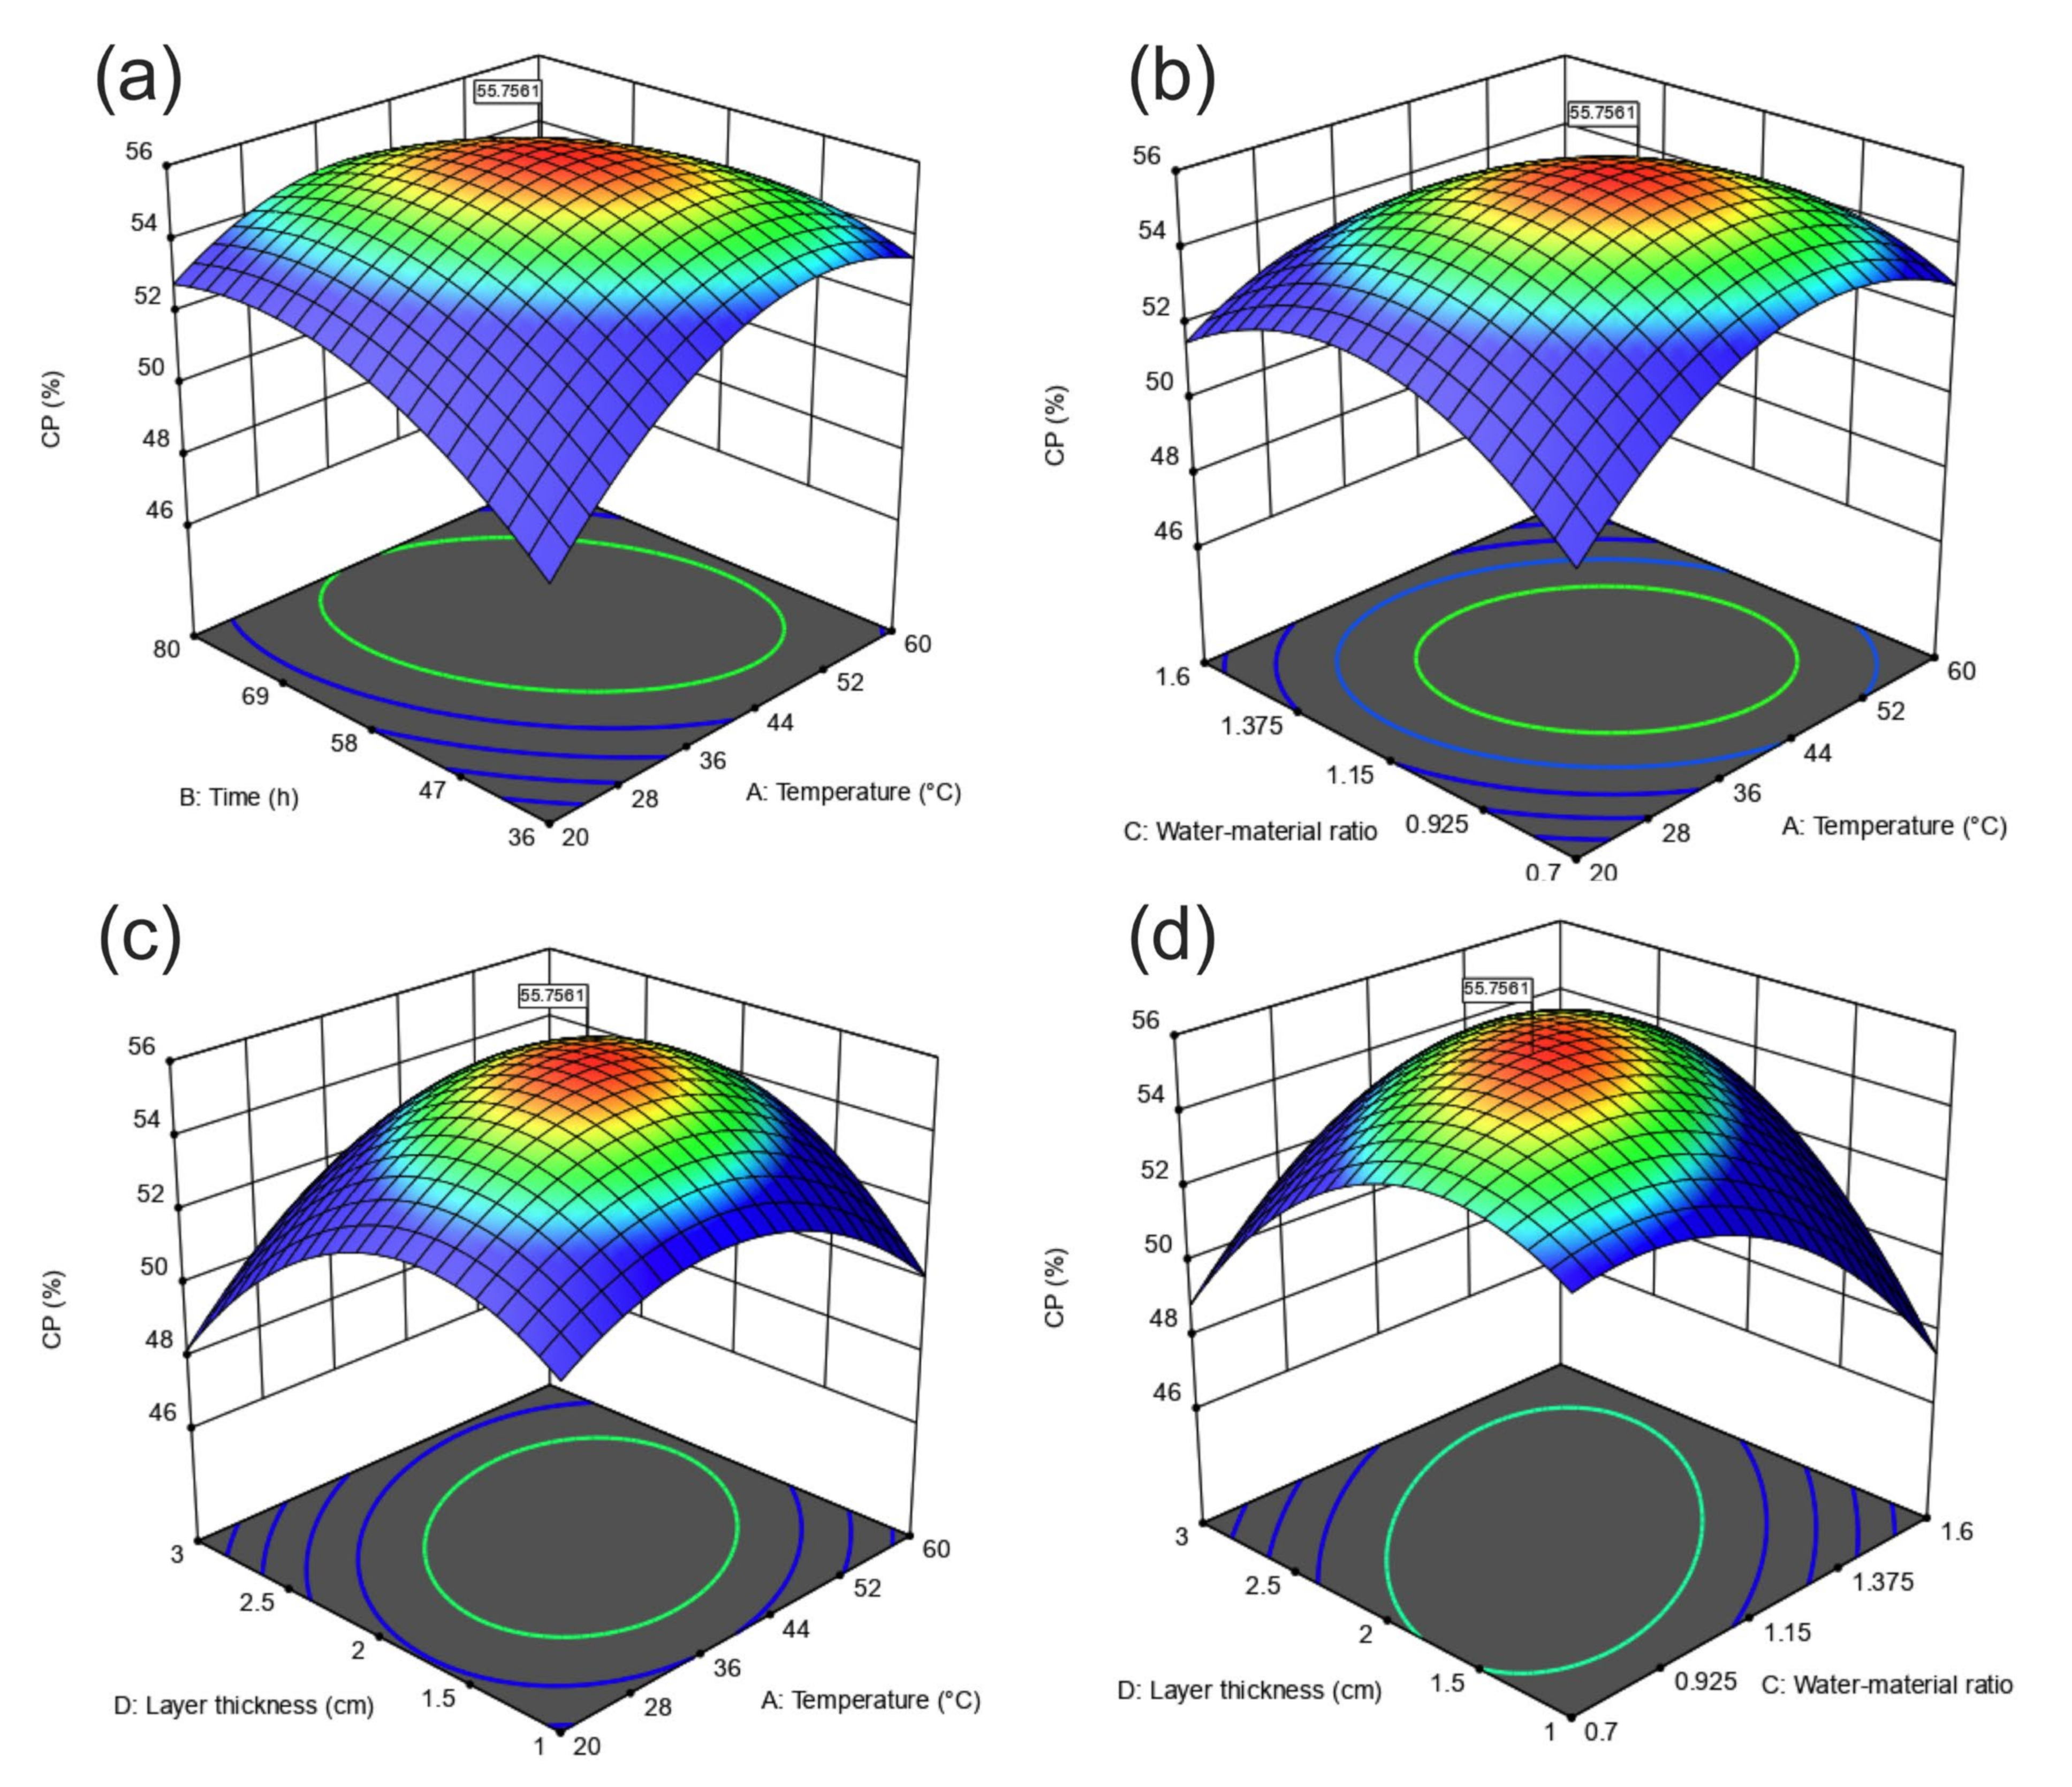
3.2. Further Optimization Using CCD

3.2.1. Variance and Regression Analysis of CCD Design

CCD was conducted to locate the true optimum culture temperature, fermentation time, water–material ratio, and SBM layer thickness for better DH and CP. The levels of the variables for the CCD experiments were selected according to the results of the single factor tests. The design matrix and the corresponding experimental data are given in Table 3. DH and CP data were performed via the “rsm” package in R and fit with second-order polynomial equations. ANOVA results for the full quadratic model of CCD design on the response of DH and CP were shown in Table 4 and Table 5, respectively. In order to simplify the model, the non-significant terms (p > 0.05) in the models were reduced. The regression analysis results of CCD are also summarized in Table 4 and Table 5.
The goodness of fit of the model based on RSM can be checked by the coefficient of determination (R2), which provides a measure of how much variability in the observed response values can be explained by the experimental factors and their interactions [65]. In this case, in the model of DH response, the coefficient of determination (adjusted R2 = 0.998) indicated that 99.8% of the variability in the response could be explained by the model. At the same time, the “lack of fit” was non-significant relative to the pure error (p = 0.8811). The model term, the coefficients of the linear term (A, B, C, and D), the quadratic term (A2, B2, C2, and D2), and the interaction term (AB, AD, BC, BD, and CD), with p-values of less than 0.05, demonstrated that they were significant for the DH.
In the model of CP response, the coefficient of determination R2 = 0.9917, which implied that the CP content was attributed to the given independent variables. The value of the adjusted determination coefficient (adjusted R2 = 0.9858) was also high to indicate a high significance of the model. The model also showed a statistically insignificant lack of fit, as the p = 0.9558. These measures indicated that the accuracy and general ability of the polynomial model were good and that analysis of the response trends using the model was reasonable. The model term, the coefficients of the linear term (A, B, C, and D), the quadratic term (A2, B2, C2, and D2), and the interaction term (AB, AC, AD, and CD), with p-values of less than 0.05, demonstrated that they were significant for the CP.
The polynomial models for the DH (YDH) and CP (YCP) were regressed by only considering the significant terms and were shown as below.
Y D H = 4.51035 + 0.159515 X A + 0.154623 X B + 5.21652 X C + 0.013533 X D 0.000712 X A X B + 0.025534 X A X D + 0.012823 X B X C + 0.008852 X B X D + 1.32859 X C X D 0.001824 X A 2 0.001186 X B 2 4.17802 X C 2 0.747142 X D 2
Y C P = 14.35734 + 0.640053 X A + 0.51865 X B + 17.44795 X C + 2.3107 X D 0.002912 X A X B 0.108325 X A X C + 0.069981 X A X D + 5.61969 X C X D 0.005642 X A 2 0.003241 X B 2 10.84542 X C 2 2.88839 X D 2
The typical analysis of the model was carried out by using the R3.6.1 package, and the optimum fermentation conditions for the maximum DH and CP of FSM were obtained as follows (Figure 2): fermentation temperature 43.82 °C, fermentation time 62.32 h, water–material ratio 1.08, and SBM layer thickness 2.02 cm. The theoretical maximum of DH was 15.96% and CP was 55.76%.

3.2.2. Response Surface Interaction Analysis

In order to intuitively study the interaction between the four factors and the response, models were plotted as a 3D surface representing the responses (DH and CP) as a function of two factors within the tested processing parameters. The shape of the response surface graph can reflect the interaction between the two factors and the steep slope of the figure, indicating that the interaction between the two factors is significant.
In Figure 3a and Figure 4a, the 3D response surface plots and contour plots were developed for the DH and CP with temperature (A) and time (B), with the other factors’ optimal values. The interactive effects between temperature and time revealed significant effects. Increasing the initial temperature can increase the initial efficiency of fermentation, but with the progress of fermentation, the heat production of fermentation accumulates in the SBM medium, which is not conducive to fermentation when it exceeds the optimum temperature of microorganisms. If the initial fermentation temperature is too low (such as room temperature), even if the fermentation time is prolonged, a good fermentation effect cannot be achieved. Therefore, the suitable combination of temperature and time is very important, which can get the best fermentation effect and have a better economy in terms of energy-saving and production speed. Maximum DH and CP were achieved when fermentation temperature and time were 43.8 °C and 62.3 h, respectively.
Figure 3b and Figure 4c show 3D response surface and contour plots at temperature (A) and SBM layer thickness (D), as well as at the optimal time and water–material ratio values. As can be seen from the figures, when the temperature is constant, the DH and CP content of FSM reaches the maximum when the layer thickness is about 2 cm. This is due to the porous structure of the solid matrix; when the material layer is very thin, the rapid evaporation of the water cannot meet the optimal water content of fermentation, and it is not conducive to maintaining the optimal bacterial growth temperature. If the substrate is too thick, the heat produced by microbial fermentation cannot be transferred to the environment in time, resulting in the increase of substrate temperature and affecting the fermentation efficiency of microorganisms. The elliptical nature of the contour plot in DH and CP indicates the interaction of fermentation temperature and layer thickness is considerable. The thickness of the material layer affects the fermentation temperature, and both the initial temperature and the layer thickness have a common effect on the water content in the SBM layer.
Figure 3c illustrates the interaction of fermentation time and water–material ratio on DH. The effect of fermentation time on the DH is as a quadratic curve, and the DH of FSM reaches the maximum when the ratio of water to material is about 1.08. This is because, with the increase of water content, the water activity on the surface of SBM particles increases, which is beneficial to the growth of microorganisms; however, if the water content is too high, the pores between SBM particles will decrease, which reduces the fluidity of air on the surface of solid medium particles, resulting in the slow growth of microorganisms. Elabona et al. [66] confirmed this view through experiments and found that the endoglucanase activity produced by Aspergillus Niger decreased with the increase of water content when the water content of the SBM matrix was high. Although the interaction between water–material ratio and time is obvious for DH, it is not significant for the model of CP. It shows that the interaction between water–material ratio and time has a greater effect on the activity of protein hydrolase due to the fact that DH is mainly affected by protease decomposition, while the increase of CP content is mainly caused by the concentration of the loss of H2O and CO2 after the decomposition of carbohydrate and lipid substances.
Figure 3d shows that DH increased with the increase of layer thickness and fermentation time up to a critical point. Their interaction affects the efficiency of protease hydrolysis through the change of the relative concentration of substrate and heat transfer in the process of fermentation. Similarly, there was no significant interaction on CP content.
Figure 3e and Figure 4d illustrate the interaction of layer thickness and water–material ratio on DH and CP, respectively. The 3D response surface plots show that the optimal response range of the two factors is in the shape of a ridge. As seen on the plot, the very steep slope indicated that the degree of interaction between the two factors is very strong. This phenomenon is caused by the evaporation of water in the substrate. In SSF, the growth and metabolism of microorganisms occur on the surface of the matrix particles, which is between the air (gas phase) and the matrix particles (solid phase). The water activity on the surface of the matrix is very important. The thicker the material layer of the matrix is at a certain temperature, the slower the rate of evaporation of water in the matrix with time, and the greater the water activity on the surface of the particles favoring the growth of microorganisms. However, after the matrix reaches a certain thickness, the rate of water evaporation in the matrix tends to drop; similarly, the exchange rate of air in the matrix decreases, which is not conducive to the growth of microorganisms.
The increment of CP with the increase of fermentation temperature and water–material ratio up to a critical point can be observed in Figure 4d. The elliptical nature of the contour plot in CP indicates an obvious interactive influence between fermentation temperature and water–material ratio. The effect of temperature on matrix water content is mainly caused by the evaporation of water. The higher the temperature, the faster the rate of matrix water evaporation, resulting in the decrease of matrix water content. The high specific heat capacity of water and the decrease of pores in SBM particles with the increased matrix water content exerts a combined influence on the temperature in the fermentation substrate. Temperature and water–material ratio significantly influenced the CP at the maximum degree within the experimental region. However, there was no significant interaction between these two factors on the DH in this study.

3.2.3. Validation of the Optimization Fermentation Medium

In Table 6, the observed and predicted DH and CP content are reported. Through a one-sample t-test, there was no significant difference between the observed value and the predicted value of DH and CP, and the predicted value falls into the 95% confidence interval. It was suggested that the errors between the predicted and verification values were to be considered small, and this means that the model is acceptable for optimization. The good correlation between predicted and experimental values after optimization justified the validity of the response model and the existence of an optimum point.

3.3. Comparison of Nutritional Values of FSM and SBM

3.3.1. Nutrient Composition

Results of the nutrient analysis of SBM and FSM are shown in Table 7. The average moisture content of the air-dried FSM was significantly lower than that of the SBM feedstock by 13.7%. In this study, it was found that the FSM samples could remain powdered after crushing at a moisture content of 8.2% or less, but if the moisture percentage increased, the FSM from Bacillus subtilis would become lumpy or even sticky, which would make it impossible to mix the feed effectively.
The protein content of FSM significantly increased by 9.8% compared with SBM after 62.3 h of fermentation. Meanwhile, crude lipid and crude fiber content significantly decreased by 14.9% and 14.1%, respectively. The increase in CP is mainly due to a relative change in the loss of dry matter as a result of microbial hydrolysis and the metabolism of carbohydrates and fats as a source of energy [67]. Microbial decomposition and synthesis by B. s. natto barely change the total nitrogen content, but it breaks down and utilizes carbohydrates and lipids.
PDI is the percentage of total protein dispersed in water under standard conditions and is related to the amount of heat to which the SBM is exposed during production. Compared to the SBM sample, the PDI decreased from 31.20 to 21.90. It was found that the feed conversion was best for fish fed SBM with a PDI of 20, intermediate for fish fed SBM with a PDI of 11 or 70, and worst for fish fed SBM with a PDI of 88 in the study on Brown Trout, which supplemented feed with SBM, and PDI values are a useful indicator of the nutritional value of SBM in fish feed [68]. In our study, the PDI of FSM was reduced by 29.8%, suggesting that the fermentation process mitigated thermal damage during the processing of SBM. Although the optimal PDI of SBM in feeds of different fish needs further study, 20 is a PDI worthy of reference.
During the processing of SBM, heat causes FAA and other compounds to form inter and intramolecular bonds that cannot be opened by digestive enzymes, thus reducing the solubility of the protein. The KPS method has been recognized in recent years as the best method for assessing the over and under-processing of soybeans. The study by Araba and Dale indicated that the KPS values below 70% suggested overprocessed SBM, and there is a need to add lysine, arginine, or methionine, either alone or in combination, to overcome growth inhibition in broiler chicks caused by over-processing [49]. For FSM, the detection of protein solubility is not only to evaluate the over and under-processing level of SBM but also to judge the degree of protein denaturation, detrimental for the effective utilization of protein. In our study, KPS was significantly increased by 17.4% after fermentation. This indicates that the FSM was not over-processed, and the protein was effectively degraded.
Flavonoids and phenols in fermentation products have antioxidant properties. The antioxidant properties of flavonoids are mainly achieved through the scavenging of superoxide anions [69]. The concentration of phenolic compounds in SBM also increases after fermentation, resulting in increased antioxidant and metal chelating activity [70]. The increase in phenolic acid in fermented soybeans may be due to the production of β-glucosidase during the fermentation process [71]. The results of this study showed that there was a 231.0% and 309.4% increase in flavonoids and total phenol content, respectively, in FSM. This indicates that the fermentation of B. s. natto increases the value of FSM in terms of antioxidant activity. Therefore, the ability of fermentation to enhance the antioxidant properties of SBM can be explored as a cost-effective way to reduce the oxidative stress of animals after the consumption of SBM.
Neutral proteases, a group of proteases with an optimum action pH between 6.0 and 7.5, are the main extracellular proteases produced by B. subtilis species. Neutral proteases are produced after the exponential growth period; when cultures enter the stationary phase and begin the sporulation process. The physiological role of the proteases is not well known. They are thought to play a role in spore formation, to be involved in regulating cell wall turnover, and to be scavenging enzymes [72]. Neutral proteases have high activity and play a dominant role among several proteases in hydrolyzing proteins [73]. Therefore, in the present study, the NPA over the SSF process was followed (Figure 5). The pattern of change in NPA was consistent with the different growth stages of B. s. natto: 0–15 h for spore germination, 15–45 h for cell growth, and after 45 h for sporulation. In the early stages of fermentation, the resting spores of B. s. natto germinate efficiently, and germination is favored in order to prepare for the secretion of enzymes. During the cell growth phase, B. s. natto is rapidly accompanied by rapid fermentation and the secretion of degradative enzymes that break down proteins, carbohydrates, etc., into absorbable micromolecules [36]. After 50 h of fermentation, the NPA decreased, probably due to water loss, reduction of substrates, and inhibition of catabolic products [74]. The results of this study confirm the importance of NPA for the growth, metabolism, and production of related enzymes of B. s. natto.

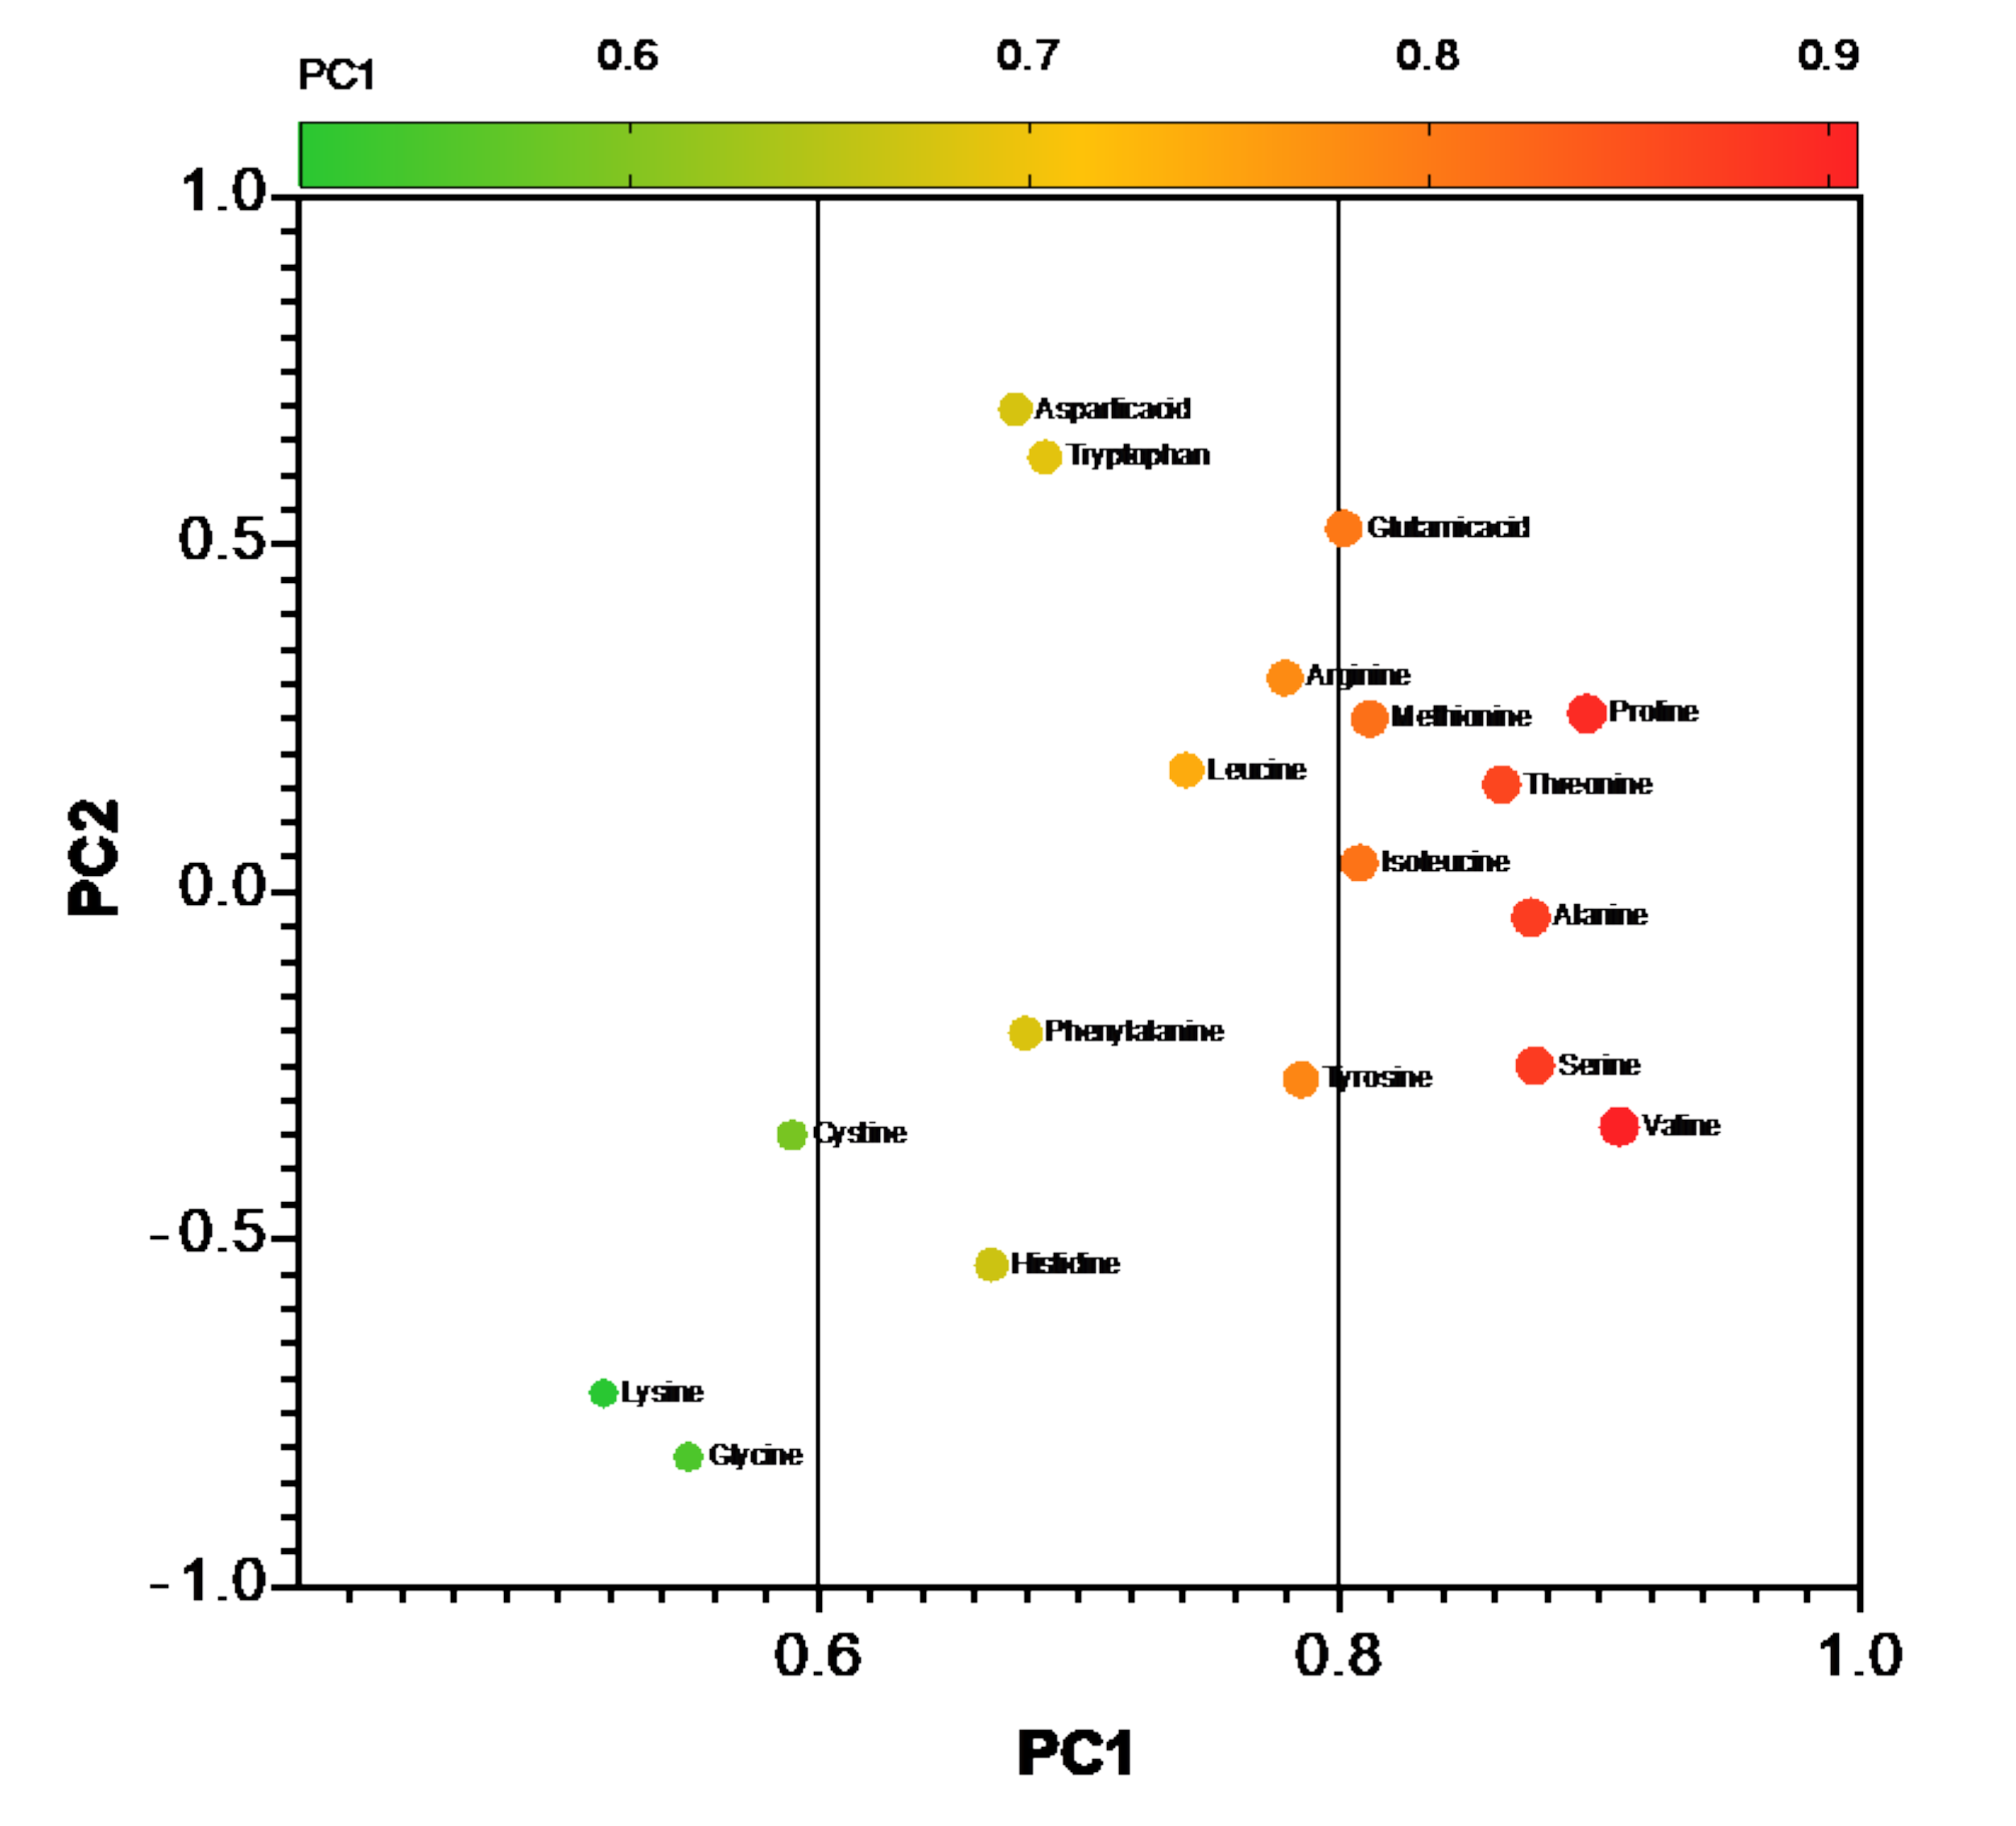
3.3.2. Amino Acid Composition of SBM and FSM

An increase of 11.6% of the TAA content was found in FSM compared with SBM (Table 8). After the fermentation process, the EAA, including methionine, isoleucine, valine, threonine, and tryptophan in FSM, significantly increased by 20.9%, 8.0%, 20.5%, 23.2%, and 14.9%, respectively. For non-EAA, serine, proline, and alanine contents in FSM significantly increased by 17.7%, 13.7%, and 11.2%, respectively, compared with SBM. Although fermentation concentrates the amino acids in SBM, it does not have a significant effect on the composition of amino acids.
The principal component analysis of amino acid of all samples (n = 30) after fermentation showed that the five amino acids with the greatest response to the fermentation variables (PC1) were valine, proline, serine, alanine, and threonine, in descending order, and where valine and threonine belong to EAA (Figure 6). However, fermentation did not significantly increase the content of lysine, regarded as one of the most limiting amino acids in fish feed.
After fermentation, all hydrolyzed amino acids increased. The increase of 12.2% of total EAA was higher than the increase of 10.8% of the total NEAA in FSM. Sarkar et al. reported a similar result [75]. The increased EAA of FSM produced with the B. s. natto is considered to be a good source of protein for aquafeed. Sulfur-containing amino acid methionine was improved by fermentation with B. s. natto in this study, which was the most critical amino acid in soya but was not improved with B. subtilis in some previous studies [76,77]. B. s. natto will be a microorganism for SBM fermentation that can produce methionine for the aqua-feed industry in the future.
The profile and content of FAA in FSM obviously increased with increasing total FAA content at 12.76-fold compared with the SBM. This may be due to the proteolytic activity of B. s. natto. Sarkar et al. showed that fermentation of soybeans with B. subtilis led to a 60-fold increase in FAA [75].

3.3.3. ANFs Composition

SBM contains a variety of ANFs. Protein-based ANFs include trypsin inhibitors, lectins, soybean allergens, and fat oxidase, while carbohydrate-based ANFs include soybean oligosaccharides (mainly includes raffinose and stachyose) and non-starch polysaccharide. Phytic acid and saponin are secondary metabolite anti-nutritional factors. Many studies have shown that antigens in soy and soy products are the main cause of allergic reactions in fish, causing gastrointestinal damage and digestive disorders [77].
Table 9 shows that the content of ANFs in FSM is lower than that in SBM samples before fermentation. The average content of trypsin inhibitor decreased by 53.7%, lectins decreased by 99.4%, glycinin decreased by 77.7%, β-conglycinin decreased by 71.6%, while the average content of stachyose decreased by 95.4%, raffinose decreased by 90.9%, and the average content of phytic acid decreased by 92.6%.
Protease inhibitor is the most important ANF in soybean. Trypsin inhibitory factor is a crystalline globulin that forms a stable complex with trypsin and deactivates the protease, thus decreasing the digestibility of protein in feed and reducing the availability of amino acids, resulting in growth inhibition. At the same time, the trypsin inhibitory factor can cause increased pancreatic secretion activity, resulting in the overproduction of trypsin and chymotrypsin. Because these proteins are rich in sulfur-containing amino acids, they can convert the amino acids originally used to synthesize tissue proteins to synthesize proteases, form complexes with inhibitors, and finally be excreted through feces, resulting in a large loss of endogenous nitrogen and sulfur-containing amino acids. Due to the lack of sulfur-containing amino acids in soybeans, the amino acids in the feed are not balanced, thus hindering the growth of fish. In the study of common carp by Anne [78], it was found that with the increase of the amount of fish meal replaced by soybean protein, the protease activity in the intestine and hepatopancreas decreased significantly.
Lectins are defined as proteins that bind to carbohydrates. The same features that lectins use to defend plants in nature may cause problems during animal digestion. They resist being broken down in the gut and are stable in acidic environments, features that protect lectin-containing plants in nature [79]. Soybean lectin adhesive binds to the small intestinal wall, which will affect the nutritional absorption of intestinal epithelial cells, resulting in changes in the activity of digestive enzymes, the loss of endogenous protein secretion, the increase of mucin, and other related activities. Studies have shown that the integrity of the hindgut villi of Atlantic salmon fed diets containing 3.5% soy lectin was significantly disrupted, as evidenced by mucosal detachment into the intestinal lumen, cellular infiltration into the lamina propria, and soy lectin binding to the epithelial cells of the small intestinal villi [80].
The antigenic proteins in SBM consist of two main types: glycinin (11S) and β-conglycinin (7S), which account for 70% of the total antigenic protein, with the 11S component being essentially a single protein, accounting for 25–35% of the total soybean protein, and the 7S component accounting for 30–35% [81]. The alpha subunit of β-conglycinin is one of the main allergens found in soybeans. The immune damage caused by allergic reactions to soybean antigenic proteins is mainly in the intestinal tract. Studies on the mechanisms of intestinal sensitization of fish by soy antigenic proteins are scarce. Soybean allergens can also damage the structure of the digestive organs when soy protein replacement in fish feed is increased to a certain level.
Soybean oligosaccharide or α-galactosides is the general name of soluble oligosaccharides in SBM; the total content in SBM is 12–15%, of which 5–6% is stachyose, 1–2% is raffinose, and 6–7% is sucrose [82]. The negative effect on fish may be due to the combination with bile acids or blocking the action of digestive enzymes and the movement of substrates in the intestine [83]. Soy carbohydrates led to reduced nutrient utilization in Atlantic salmon; however, soy oligosaccharides had little effect on protein utilization [84].
The presence of phytic acid in the diet can negatively affect the growth of commonly farmed fish, such as carp, tilapia, trout, and salmon. Due to the structural characteristics of phytic acid phosphorus itself and its strong chelation, phosphorus in the form of phytate cannot be used by fish; phytic acid also affects the utilization of other nutrients. Phytic acid can chelate with bivalent (Zn2+, Ca2+, Mg2+) or trivalent (Fe3+) metal ions to form insoluble complexes, thus reducing the biological potency of these metal ions. Fermentation has been shown to reduce the phytic acid content of grains due to the action of phytase produced by yeast or lactic acid bacteria [85]. In our study, B. s. natto was also found to be effective in reducing the phytic acid content.
Based on the results of the reduction in the content of various ANFs in FSM, the feasibility of further increasing the content of SBM in aquatic feed is provided.

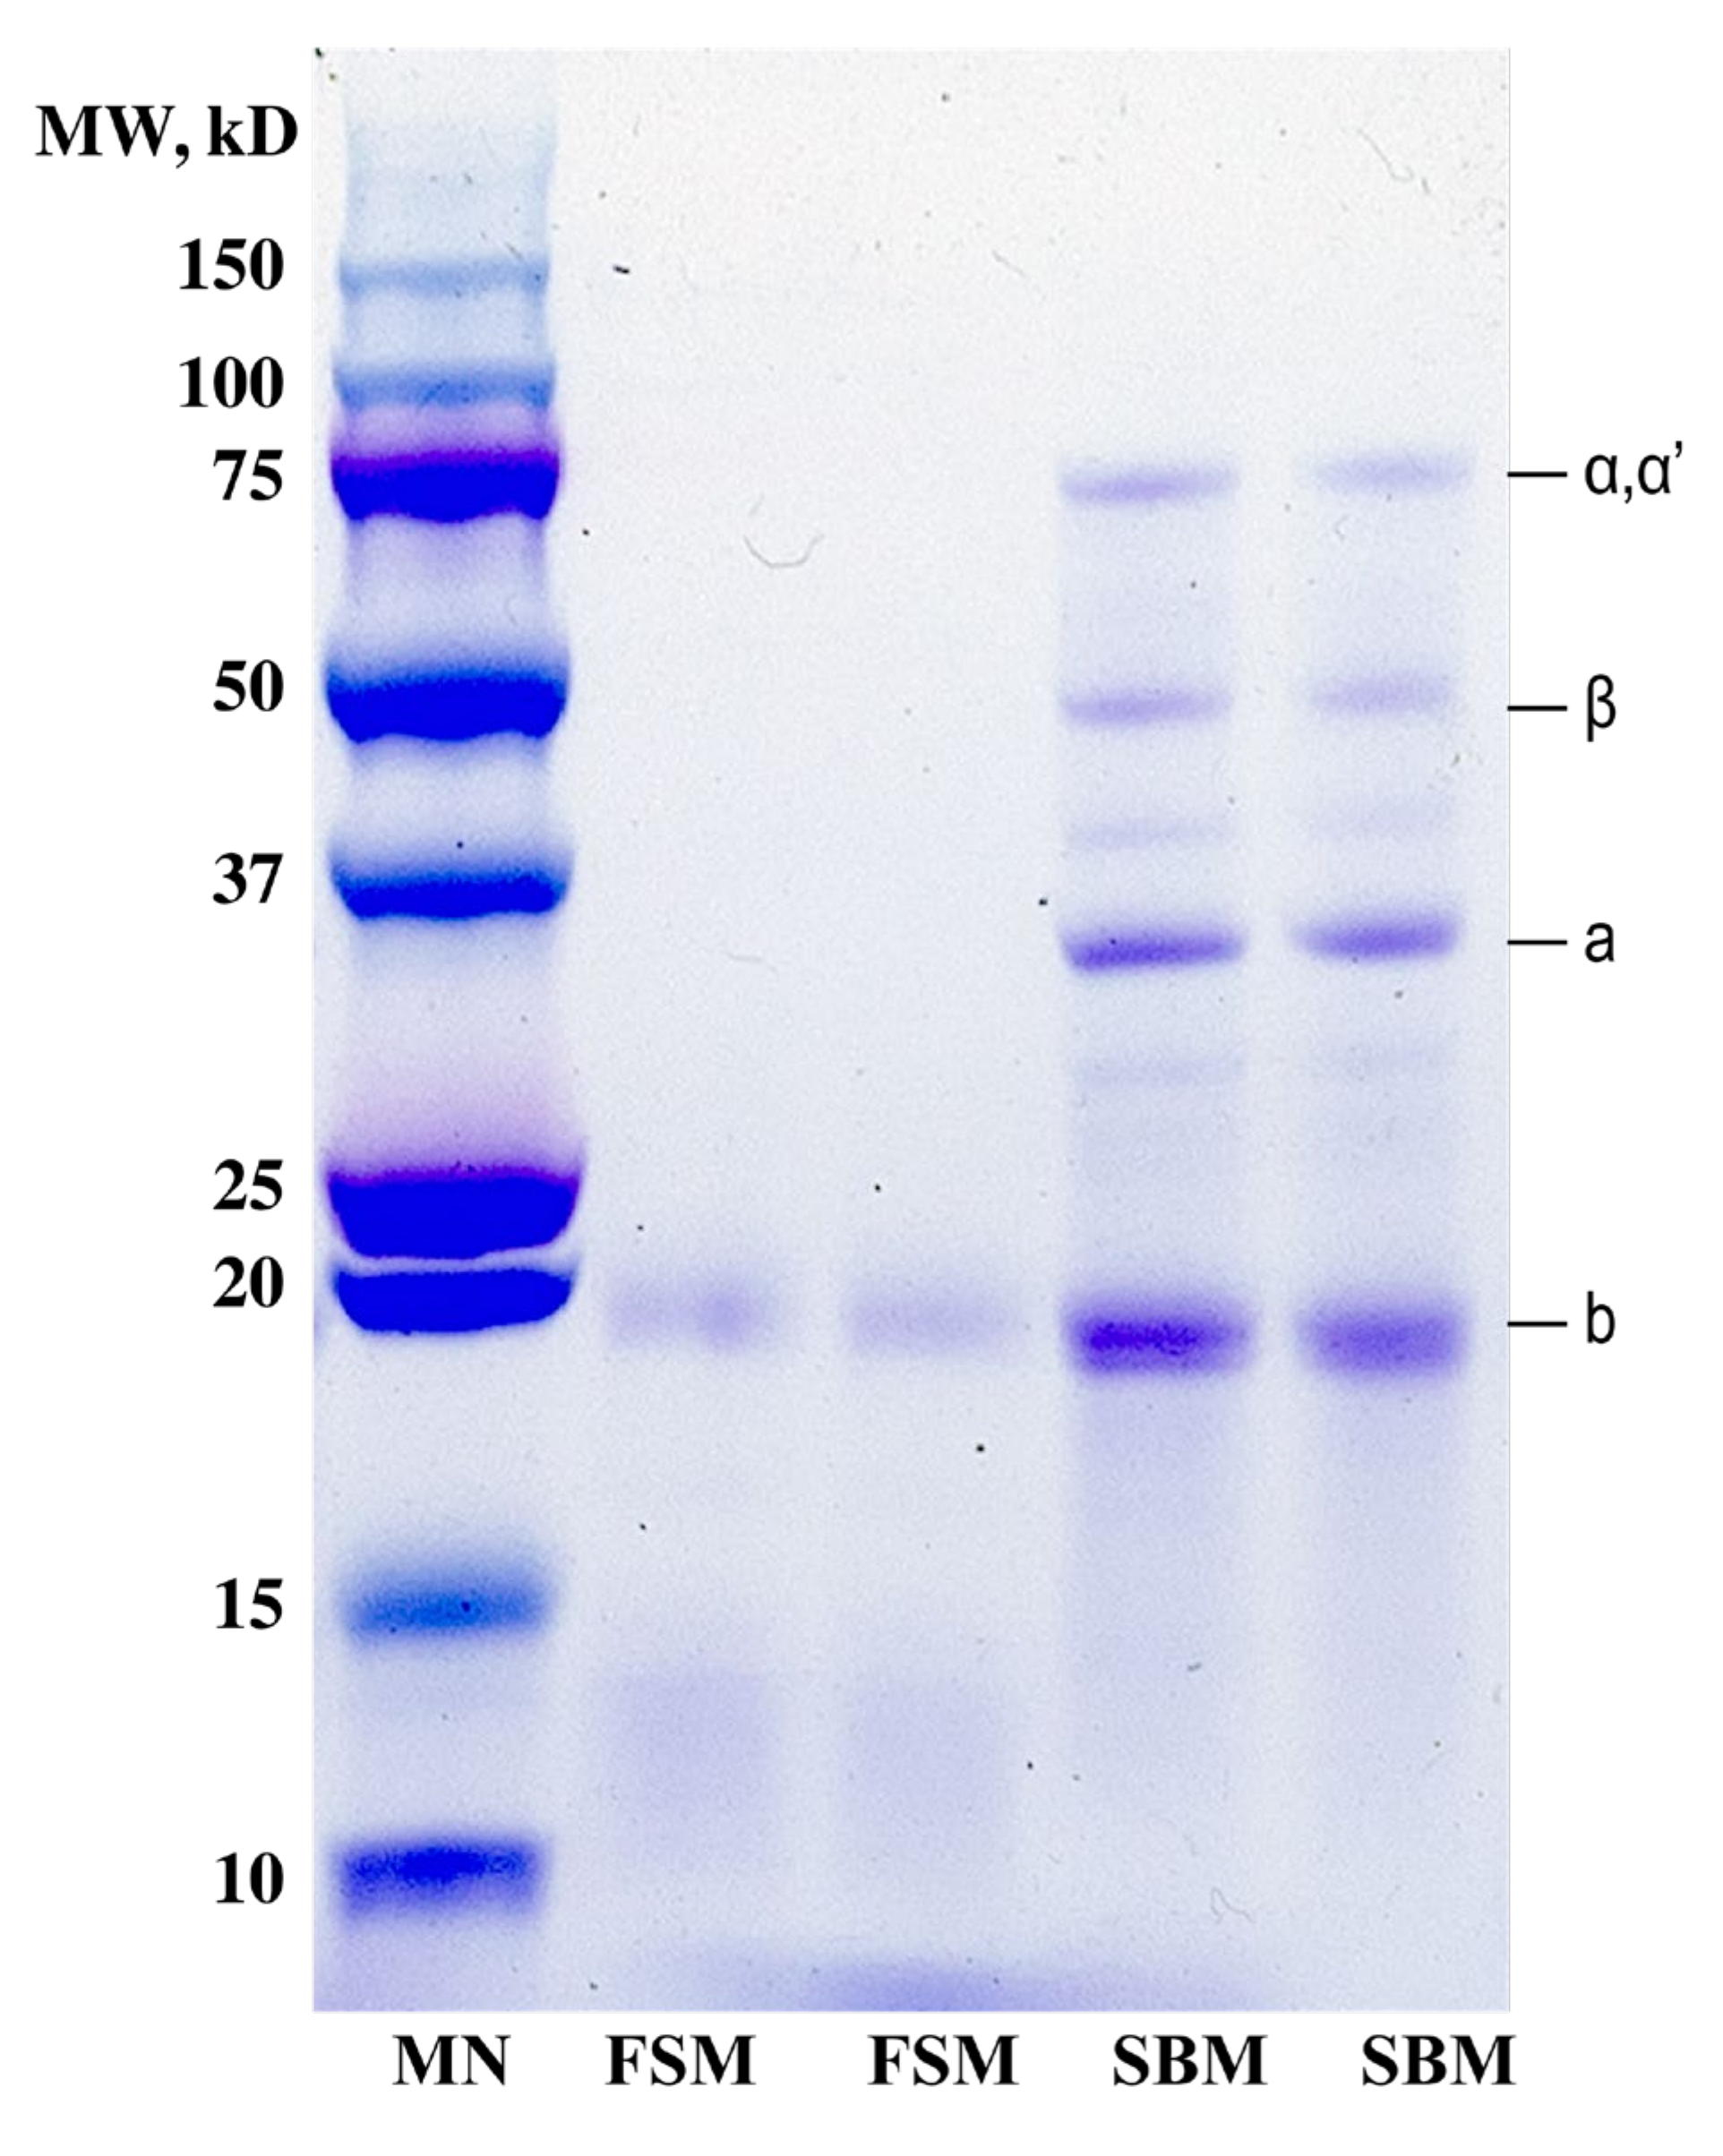
3.3.4. SDS-PAGE Analysis

Figure 7 shows the protein profiles of SBM and FSM analyzed by SDS-PAGE. SBM electrophoresis lanes show almost all soy protein bands, including α’-subunit (78 kDa), α-subunit (70 kDa), and β-subunit (47 kDa) of β-accompanying soy globulin, as well as the acidic subunits (32 kDa) and basic subunits (19 kDa) of soy glycinin. However, the FSM electrophoresis lanes only show a large number of proteins <25 kDa. All the β-conglycinin and 32 kDa glycinin in FSM samples were completely digested. However, there are still a few shadow bands of the 19 kDa glycinin, indicating that there is still a small amount of 19 kDa glycinin remaining in FSM.
It can be seen from the result that soybean protein has changed tremendously after fermentation, especially the content of anti-nutritional macromolecular proteins (glycinin, β-conglycinin, etc.), which decreases significantly after fermentation. The microbial fermentation of SBM not only degraded the anti-nutritional globulin but also broke down almost all the large molecules of SBM proteins, and the FSM mainly contained small molecule proteins or small molecule peptides with a molecular weight below 22 kDa.
SDS-PAGE analysis showed that FSM proteins, including the major soybean allergens, were hydrolyzed by B. s. natto after fermentation. Similar results were found for FSM from B. subtilis or other microorganisms [86,87]. B. s. natto produces a large number of extracellular proteases that secrete and degrade proteins in the culture medium [88].

4. Conclusions

This study demonstrates the feasibility of RSM to optimize the SSF technology of SBM for the widespread use of FSM in aquatic and livestock feeds and the effective enhancement of the nutritional value of SBM that can be achieved by B. s. natto under optimized fermentation parameters. The results showed that fermentation temperature 43.82 °C, fermentation time 62.32 h, water–material ratio 1.08, and SBM layer thickness 2.02 cm were the most suitable fermentation conditions for obtaining high protein content and DH. The FSM had low anti-nutritional factor levels, higher protein levels, higher free amino acid levels, relatively high antioxidant activity, and NPA. Given the desirable protein quality of the FSM, the significant reduction in anti-nutrients, and the cost-effectiveness of the process, SSF in general and SSF with B. s. natto in particular show great potential for the improvement of plant-based ingredients for aquafeed.
Based on this study, we will further conduct feeding experiments with different aquatic animals to provide data to support the amount of B. s. natto FSM to be used in aquatic feed.

Author Contributions

Conceptualization, Y.Z. and M.I.; methodology, Y.Z., S.Y., W.W., K.M., K.Z. and X.Z.; software, Y.Z. and R.S.S.; validation, Y.Z. and X.Z.; formal analysis, Y.Z., K.Z., S.S. and X.Z.; investigation, Y.Z., W.W. and X.Z.; resources, Y.Z., K.Z. and M.I.; data curation, K.M., R.S.S. and S.D.; writing—original draft preparation, Y.Z.; writing—review and editing, S.D. and M.I.; visualization, Y.Z.; supervision, M.I., S.K. and S.Y.; project administration, Y.Z. and M.I.; funding acquisition, S.K. and M.I. All authors have read and agreed to the published version of the manuscript.

Funding

This research received no external funding.

Institutional Review Board Statement

Not applicable.

Informed Consent Statement

Not applicable.

Data Availability Statement

Data is contained within the article.

Acknowledgments

The first author is grateful to the Ministry of Education, Culture, Sports, Science, and Technology (MEXT) scholarship under the Monbukagakusho of Japan for financing the research. We acknowledge the contribution of the Laboratory of Nutritional Biochemistry and Feed Chemistry, Faculty of Agriculture, Kagoshima University, Japan and Hanzhong Vocational and Technical College, Hanzhong, China, for technical assistance in this study.

Conflicts of Interest

The authors declare no conflict of interest.

References

  1. FAO. The State of World Fisheries and Aquaculture 2020: Sustainability in Action; FAO: Rome, Italy, 2020; ISBN 978-92-5-132692-3. [Google Scholar]
  2. Luthada-Raswiswi, R.; Mukaratirwa, S.; O’Brien, G. Animal protein sources as a substitute for fishmeal in aquaculture diets: A systematic review and meta-analysis. Appl. Sci. 2021, 11, 3854. [Google Scholar] [CrossRef]
  3. Ayadi, F.Y.; Rosentrate, K.A.; Muthukumar, K. Alternative protein sources for aquaculture feeds. J. Aquac. Feed. Sci. Nutr. 2012, 4, 1–26. [Google Scholar] [CrossRef]
  4. Zhou, Q.-C.; Tan, B.-P.; Mai, K.-S.; Liu, Y.-J. Apparent digestibility of selected feed ingredients for juvenile cobia Rachycentron canadum. Aquaculture 2004, 241, 441–451. [Google Scholar] [CrossRef]
  5. FAO. The State of World Fisheries and Aquaculture 2016. Contributing to Food Security and Nutrition for All; FAO: Rome, Italy, 2016; ISBN 9789251091852. [Google Scholar]
  6. Shao, J.; Wang, L.; Shao, X.; Liu, M. Dietary different replacement levels of fishmeal by fish silage could influence growth of Litopenaeus vannamei by regulating mTOR at transcriptional level. Front. Physiol. 2020, 11, 359. [Google Scholar] [CrossRef]
  7. Cashion, T.; Le Manach, F.; Zeller, D.; Pauly, D. Most fish destined for fishmeal production are food-grade fish. Fish Fish. 2017, 18, 837–844. [Google Scholar] [CrossRef]
  8. Tacon, A.G.J.; Metian, M. Fish matters: Importance of aquatic foods in human nutrition and global food supply. Rev. Fish. Sci. 2013, 21, 22–38. [Google Scholar] [CrossRef]
  9. Lim, C.; Webster, C.D.; Lee, C.S. Alternative Protein Sources in Aquaculture Diets; Haworth Press: New York, NY, USA, 2008; ISBN 978-0-367-38774-7. [Google Scholar]
  10. Roy, S.S.; Pal, R. Microalgae in aquaculture: A review with special references to nutritional value and fish dietetics. Proc. Zool. Soc. 2015, 68, 1–8. [Google Scholar] [CrossRef]
  11. Sarker, P.K.; Kapuscinski, A.R.; Bae, A.Y.; Donaldson, E.; Sitek, A.J.; Fitzgerald, D.S.; Edelson, O.F. Towards sustainable aquafeeds: Evaluating substitution of fishmeal with lipid-extracted microalgal co-product (Nannochloropsis oculata) in diets of juvenile Nile tilapia (Oreochromis niloticus). PLoS ONE 2018, 13, e0201315. [Google Scholar] [CrossRef] [PubMed]
  12. Miao, S.; Zhao, C.; Zhu, J.; Hu, J.; Dong, X.; Sun, L. Dietary soybean meal affects intestinal homoeostasis by altering the microbiota, morphology and inflammatory cytokine gene expression in northern snakehead. Sci. Rep. 2018, 8, 1–10. [Google Scholar] [CrossRef] [Green Version]
  13. Yaghoubi, M.; Mozanzadeh, M.T.; Marammazi, J.G.; Safari, O.; Gisbert, E. Dietary replacement of fish meal by soy products (soybean meal and isolated soy protein) in silvery-black porgy juveniles (Sparidentex hasta). Aquaculture 2016, 464, 50–59. [Google Scholar] [CrossRef]
  14. Perera, E.; Simó-Mirabet, P.; Shin, H.S.; Rosell-Moll, E.; Naya-Catalá, F.; Heras, V.D.L.; Martos-Sitcha, J.A.; Karalazos, V.; Armero, E.; Arizcun, M.; et al. Selection for growth is associated in gilthead sea bream (Sparus aurata) with diet flexibility, changes in growth patterns and higher intestine plasticity. Aquaculture 2019, 507, 349–360. [Google Scholar] [CrossRef]
  15. Krogdahl, Å.; Penn, M.; Thorsen, J.; Refstie, S.; Bakke, A.M. Important antinutrients in plant feedstuffs for aquaculture: An update on recent findings regarding responses in salmonids. Aquac. Res. 2010, 41, 333–344. [Google Scholar] [CrossRef]
  16. Bakke, A.M.; Chikwati, E.M.; Venold, F.F.; Sahlmann, C.; Holm, H.; Penn, M.H.; Oropeza-Moe, M.; Krogdahl, Å. Bile enhances glucose uptake, reduces permeability, and modulates effects of lectins, trypsin inhibitors and saponins on intestinal tissue. Comp. Biochem. Physiol. Part A Mol. Integr. Physiol. 2014, 168, 96–109. [Google Scholar] [CrossRef] [PubMed]
  17. Marjara, I.S.; Chikwati, E.M.; Valen, E.C.; Krogdahl, A.; Bakke, A.M. Transcriptional regulation of IL-17A and other inflammatory markers during the development of soybean meal-induced enteropathy in the distal intestine of Atlantic salmon (Salmo salar L.). Cytokine 2012, 60, 186–196. [Google Scholar] [CrossRef]
  18. Refstie, S.; Korsøen, Ø.J.; Storebakken, T.; Baeverfjord, G.; Lein, I.; Roem, A.J. Differing nutritional responses to dietary soybean meal in rainbow trout (Oncorhynchus mykiss) and Atlantic salmon (Salmo salar). Aquaculture 2000, 190, 49–63. [Google Scholar] [CrossRef]
  19. Gu, M.; Bai, N.; Xu, B.; Xu, X.; Jia, Q.; Zhang, Z. Protective effect of glutamine and arginine against soybean meal-induced enteritis in the juvenile turbot (Scophthalmus maximus). Fish Shellfish Immunol. 2017, 70, 95–105. [Google Scholar] [CrossRef]
  20. Liu, Y.; Chen, Z.; Dai, J.; Yang, P.; Xu, W.; Ai, Q.; Zhang, W.; Zhang, Y.; Zhang, Y.; Mai, K. Sodium butyrate supplementation in high-soybean meal diets for turbot (Scophthalmus maximus L.): Effects on inflammatory status, mucosal barriers and microbiota in the intestine. Fish Shellfish Immunol. 2019, 88, 65–75. [Google Scholar] [CrossRef]
  21. Rist, V.T.; Weiss, E.; Sauer, N.; Mosenthin, R.; Eklund, M. Effect of dietary protein supply originating from soybean meal or casein on the intestinal microbiota of piglets. Anaerobe 2014, 25, 72–79. [Google Scholar] [CrossRef]
  22. Morales-Mena, A.; Martínez-González, S.; Teague, K.D.; Graham, L.E.; Señas-Cuesta, R.; Vuong, C.N.; Lester, H.; Hernandez-Patlan, D.; Solis-Cruz, B.; Fuente-Martinez, B.; et al. Assessment of fermented soybean meal on Salmonella typhimurium infection in neonatal turkey poults. Animals 2020, 10, 1849. [Google Scholar] [CrossRef] [PubMed]
  23. Lu, J.; Zhu, M.; Cao, H.; Zhang, X.; Wang, Z.; Zhang, X.; Li, X.; Hu, J.; Yang, G.; Shi, X. Impact of fermented corn–soybean meal on gene expression of immunity in the blood, level of secretory immunoglobulin A, and mucosa-associated bacterial community in the intestine of grower–finisher pigs. Front. Vet. Sci. 2020, 7, 246. [Google Scholar] [CrossRef] [PubMed]
  24. Mukherjee, R.; Chakraborty, R.; Dutta, A. Role of fermentation in improving nutritional quality of soybean meal—A review. Asian-Australas. J. Anim. Sci. 2016, 29, 1523–1529. [Google Scholar] [CrossRef] [PubMed] [Green Version]
  25. Hong, K.-J.; Lee, C.-H.; Kim, S.W. Aspergillus oryzaeGB-107 Fermentation Improves Nutritional Quality of Food Soybeans and Feed Soybean Meals. J. Med. Food 2004, 7, 430–435. [Google Scholar] [CrossRef] [PubMed]
  26. Heng, X.; Chen, H.; Lu, C.; Feng, T.; Li, K.; Gao, E. Study on synergistic fermentation of bean dregs and soybean meal by multiple strains and proteases. LWT 2022, 154, 112626. [Google Scholar] [CrossRef]
  27. Teleky, B.-E.; Martău, G.A.; Vodnar, D.C. Physicochemical effects of Lactobacillus plantarum and Lactobacillus casei cocultures on soy-wheat flour dough fermentation. Foods 2020, 9, 1894. [Google Scholar] [CrossRef] [PubMed]
  28. Hölker, U.; Lenz, J. Solid-state fermentation—Are there any biotechnological advantages? Curr. Opin. Microbiol. 2005, 8, 301–306. [Google Scholar] [CrossRef]
  29. Rosales, E.; Pazos, M.; Ángeles Sanromán, M. Chapter 15—Solid-state fermentation for food applications. In Current Developments in Biotechnology and Bioengineering; Pandey, A., Larroche, C., Soccol, C.R., Eds.; Elsevier: Amsterdam, The Netherlands, 2018; pp. 319–355. ISBN 978-0-444-63990-5. [Google Scholar]
  30. Dos Santos, M.M.; da Rosa, A.S.; Dal’Boit, S.; Mitchell, D.A.; Krieger, N. Thermal denaturation: Is solid-state fermentation really a good technology for the production of enzymes? Bioresour. Technol. 2004, 93, 261–268. [Google Scholar] [CrossRef]
  31. Pandey, A.; Soccol, C.R.; Mitchell, D. New developments in solid state fermentation: I-bioprocesses and products. Process. Biochem. 2000, 35, 1153–1169. [Google Scholar] [CrossRef]
  32. Martău, G.-A.; Unger, P.; Schneider, R.; Venus, J.; Vodnar, D.C.; López-Gómez, J.P. Integration of solid state and submerged fermentations for the valorization of organic municipal solid waste. J. Fungi 2021, 7, 766. [Google Scholar] [CrossRef]
  33. Weng, T.M.; Chen, M.T. Changes of protein in natto (a fermented soybean food) affected by fermenting time. Food Sci. Technol. Res. 2010, 16, 537–542. [Google Scholar] [CrossRef] [Green Version]
  34. Shurtleff, W.; Aoyagi, A. History of Nattō and Its Relatives (1405–2012): Extensively Annotated Bibliography and Sourcebook; Soyinfo Center: Lafayette, CA, USA, 2012; ISBN 978-1-928914-42-6. [Google Scholar]
  35. Esaki, H.; Onozaki, H.; Osawa, T. Antioxidative activity of fermented soybean products. In Food Phytochemicals for Cancer Prevention I; ACS Symposium Series; American Chemical Society: Washington, DC, USA, 1993; Volume 546, pp. 353–360. ISBN 978-0-8412-2768-2. [Google Scholar]
  36. Sella, S.R.B.R.; Bueno, T.; de Oliveira, A.A.B.; Karp, S.G.; Soccol, C.R. Bacillus subtilis natto as a potential probiotic in animal nutrition. Crit. Rev. Biotechnol. 2021, 41, 355–369. [Google Scholar] [CrossRef]
  37. Ju, S.; Cao, Z.; Wong, C.; Liu, Y.; Foda, M.F.; Zhang, Z.; Li, J. Isolation and optimal fermentation condition of the Bacillus subtilis subsp. natto strain WTC016 for nattokinase production. Fermentation 2019, 5, 92. [Google Scholar] [CrossRef] [Green Version]
  38. Berikten, D.; Kivanç, M. Optimization of solid-state fermentation for phytase production by Thermomyces lanuginosus using response surface methodology. Prep. Biochem. Biotechnol. 2014, 44, 834–848. [Google Scholar] [CrossRef]
  39. Xiong, Y.-H.; Liu, J.-Z.; Song, H.-Y.; Ji, L.-N. Enhanced production of extracellular ribonuclease from Aspergillus niger by optimization of culture conditions using response surface methodology. Biochem. Eng. J. 2004, 21, 27–32. [Google Scholar] [CrossRef]
  40. Xu, L.; Yu, J.-Q.; Wang, X.-Y.; Xu, N.; Liu, J.-L. Microwave extraction optimization using the response surface methodology of Fructus Meliae toosendan polysaccharides and its antioxidant activity. Int. J. Biol. Macromol. 2018, 118, 1501–1510. [Google Scholar] [CrossRef]
  41. Sridhar, R.; Sivakumar, V.; Immanuel, V.P.; Maran, J.P. Development of model for treatment of pulp and paper industry bleaching effluent using response surface methodology. Environ. Prog. Sustain. Energy 2012, 31, 558–565. [Google Scholar] [CrossRef]
  42. Maran, J.P.; Manikandan, S. Response surface modeling and optimization of process parameters for aqueous extraction of pigments from prickly pear (Opuntia ficus-indica) fruit. Dye. Pigment. 2012, 95, 465–472. [Google Scholar] [CrossRef]
  43. Leni, G.; Soetemans, L.; Caligiani, A.; Sforza, S.; Bastiaens, L. Degree of hydrolysis affects the techno-functional properties of lesser mealworm protein hydrolysates. Foods 2020, 9, 381. [Google Scholar] [CrossRef] [PubMed] [Green Version]
  44. Nielsen, P.M.; Petersen, D.; Dambmann, C. Improved method for determining food protein degree of hydrolysis. J. Food Sci. 2001, 66, 642–646. [Google Scholar] [CrossRef]
  45. Schasteen, C.S.; Wu, J.; Schulz, M.G.; Parsons, C.M. Correlation of an immobilized digestive enzyme assay with poultry true amino acid digestibility for soybean meal. Poult. Sci. 2007, 86, 343–348. [Google Scholar] [CrossRef] [PubMed]
  46. Latimer, G.W. Official Methods of Analysis of AOAC International, 21st ed.; AOAC International: Rockville, MD, USA, 2019; ISBN 978-0-935584-89-9. [Google Scholar]
  47. Thiex, N.J.; Manson, H.; Anderson, S.; Persson, J.; Bogren, E.; Bolek, G.; Budde, D.; Ellis, C.; Eriksson, S.; Field, G.; et al. Determination of crude protein in animal feed, forage, grain, and oilseeds by using block digestion with a copper catalyst and steam distillation into boric acid: Collaborative study. J. AOAC Int. 2002, 85, 309–317. [Google Scholar] [CrossRef] [PubMed] [Green Version]
  48. Căpriţă, R.; Căpriţă, A.; Creţescu, I. Protein solubility as quality index for processed soybean. Anim. Sci. Biotechnol. 2010, 43, 375–378. [Google Scholar]
  49. Araba, M.; Dale, N. Evaluation of protein solubility as an indicator of overprocessing soybean meal. Poult. Sci. 1990, 69, 76–83. [Google Scholar] [CrossRef]
  50. Singleton, V.L.; Orthofer, R.; Lamuela-Raventós, R.M. Analysis of total phenols and other oxidation substrates and antioxidants by means of folin-ciocalteu reagent. In Methods in Enzymology; Oxidants and Antioxidants Part A; Academic Press: Cambridge, MA, USA, 1999; Volume 299, pp. 152–178. [Google Scholar]
  51. Governa, P.; Cusi, M.G.; Borgonetti, V.; Sforcin, J.M.; Terrosi, C.; Baini, G.; Miraldi, E.; Biagi, M. Beyond the biological effect of a chemically characterized poplar propolis: Antibacterial and antiviral activity and comparison with flurbiprofen in cytokines release by LPS-stimulated human mononuclear cells. Biomedicines 2019, 7, 73. [Google Scholar] [CrossRef] [Green Version]
  52. Zhao, Y.; Sun-Waterhouse, D.; Zhao, M.; Zhao, Q.; Qiu, C.; Su, G. Effects of solid-state fermentation and proteolytic hydrolysis on defatted soybean meal. LWT 2018, 97, 496–502. [Google Scholar] [CrossRef]
  53. Teshima, S.-I.; Kanazawa, A.; Yamashita, M. Dietary value of several proteins and supplemental amino acids for larvae of the prawn Penaeus japonicus. Aquaculture 1986, 51, 225–235. [Google Scholar] [CrossRef]
  54. Kader, A.; Koshio, S.; Ishikawa, M.; Yokoyama, S.; Bulbul, M. Supplemental effects of some crude ingredients in improving nutritive values of low fishmeal diets for red sea bream, Pagrus Major. Aquaculture 2010, 308, 136–144. [Google Scholar] [CrossRef]
  55. Chen, J.; Wedekind, K.; Escobar, J.; Vazquez-Añón, M. Trypsin inhibitor and urease activity of soybean meal products from different countries and impact of trypsin inhibitor on ileal amino acid digestibility in pig. J. Am. Oil Chem. Soc. 2020, 97, 1151–1163. [Google Scholar] [CrossRef]
  56. Hei, W.; Li, Z.; Ma, X.; He, P. Determination of beta-conglycinin in soybean and soybean products using a sandwich enzyme-linked immunosorbent assay. Anal. Chim. Acta 2012, 734, 62–68. [Google Scholar] [CrossRef] [PubMed]
  57. Pusztai, A.; Grant, G. Assessment of lectin inactivation by heat and digestion. In Lectin Methods and Protocols; Rhodes, J.M., Milton, J.D., Eds.; Methods in Molecular MedicineTM; Humana Press: Totowa, NJ, USA, 1998; pp. 505–514. ISBN 978-1-59259-593-8. [Google Scholar]
  58. Barampama, Z.; Simard, R.E. Nutrient composition, protein quality and antinutritional factors of some varieties of dry beans (Phaseolus vulgaris) grown in Burundi. Food Chem. 1993, 47, 159–167. [Google Scholar] [CrossRef]
  59. Kvasnicka, F.; Ahmadová-Vavrousová, R.; Frias, J.; Price, K.R.; Kadlec, P. A Rapid HPLC method for the determination of raffinose family of oligosaccharides in pea seeds. J. Liq. Chromatogr. Relat. Technol. 1996, 19, 135–147. [Google Scholar] [CrossRef]
  60. Reichwald, K.; Hatzack, F. Application of a modified Haug and Lantzsch method for the rapid and accurate photometrical phytate determination in soybean, wheat, and maize meals. J. Agric. Food Chem. 2008, 56, 2888–2891. [Google Scholar] [CrossRef] [PubMed]
  61. Shiu, Y.-L.; Wong, S.-L.; Guei, W.-C.; Shin, Y.-C.; Liu, C.-H. Increase in the plant protein ratio in the diet of white shrimp, Litopenaeus vannamei (Boone), using Bacillus subtilis E20-fermented soybean meal as a replacement. Aquac. Res. 2015, 46, 382–394. [Google Scholar] [CrossRef]
  62. Lenth, R.V. Response-surface methods in R, using rsm. J. Stat. Softw. 2020, 32, 1–17. [Google Scholar]
  63. R Core Team. R: A Language and Environment for Statistical Computing; R Foundation for Statistical Computing: Vienna, Austria, 2019. [Google Scholar]
  64. Zhang, J.; Xu, C.; Chen, X.; Ruan, X.; Zhang, Y.; Xu, H.; Guo, Y.; Xu, J.; Lv, P.; Wang, Z. Engineered Bacillus subtilis harbouring gene of d-tagatose 3-epimerase for the bioconversion of d-fructose into d-psicose through fermentation. Enzym. Microb. Technol. 2020, 136, 109531. [Google Scholar] [CrossRef]
  65. Wang, Y.-H.; Feng, J.-T.; Zhang, Q.; Zhang, X. Optimization of fermentation condition for antibiotic production by Xenorhabdus nematophila with response surface methodology. J. Appl. Microbiol. 2008, 104, 735–744. [Google Scholar] [CrossRef] [PubMed]
  66. Delabona, P.D.S.; Pirota, R.D.P.B.; Codima, C.A.; Tremacoldi, C.R.; Rodrigues, A.; Farinas, C.S. Effect of initial moisture content on two Amazon rainforest Aspergillus strains cultivated on agro-industrial residues: Biomass-degrading enzymes production and characterization. Ind. Crop. Prod. 2013, 42, 236–242. [Google Scholar] [CrossRef]
  67. Nkhata, S.G.; Ayua, E.; Kamau, E.H.; Shingiro, J.-B. Fermentation and germination improve nutritional value of cereals and legumes through activation of endogenous enzymes. Food Sci. Nutr. 2018, 6, 2446–2458. [Google Scholar] [CrossRef] [Green Version]
  68. Reinitz, G. Protein Dispersibility Index (PDI) as a quality control measure for soy flour used in brown trout starter feed. Progress. Fish-Cult. 1984, 46, 161–164. [Google Scholar] [CrossRef]
  69. Robak, J.; Gryglewski, R.J. Flavonoids are scavengers of superoxide anions. Biochem. Pharmacol. 1988, 37, 837–841. [Google Scholar] [CrossRef]
  70. Moktan, B.; Saha, J.; Sarkar, P.K. Antioxidant activities of soybean as affected by Bacillus-fermentation to kinema. Food Res. Int. 2008, 41, 586–593. [Google Scholar] [CrossRef]
  71. Bhanja, T.; Kumari, A.; Banerjee, R. Enrichment of phenolics and free radical scavenging property of wheat koji prepared with two filamentous fungi. Bioresour. Technol. 2009, 100, 2861–2866. [Google Scholar] [CrossRef] [PubMed]
  72. Yang, M.Y.; Ferrari, E.; Henner, D.J. Cloning of the neutral protease gene of Bacillus subtilis and the use of the cloned gene to create an in vitro-derived deletion mutation. J. Bacteriol. 1984, 160, 15–21. [Google Scholar] [CrossRef] [PubMed] [Green Version]
  73. Chou, C.-C.; Ling, M.-Y. Biochemical changes in soy sauce prepared with extruded and traditional raw materials. Food Res. Int. 1998, 31, 487–492. [Google Scholar] [CrossRef]
  74. Klapper, B.F.; Jameson, D.M.; Mayer, R.M. Factors affecting the synthesis and release of the extracellular protease of Aspergillus oryzae NRRL. Biochim. Biophys. Acta BBA Gen. Subj. 1973, 304, 513–519. [Google Scholar] [CrossRef]
  75. Sarkar, P.; Jones, L.; Craven, G.; Somerset, S.; Palmer, C. Amino acid profiles of kinema, a soybean-fermented food. Food Chem. 1997, 59, 69–75. [Google Scholar] [CrossRef]
  76. Han, X.; Nagano, H.; Phromraksa, P.; Tsuji, M.; Shimoyamada, M.; Kasuya, S.; Suzuki, T.; Khamboonruang, C. Hydrolysis of soybean 7S and 11S globulins using Bacillus subtilis. Food Sci. Technol. Res. 2012, 18, 651–657. [Google Scholar] [CrossRef] [Green Version]
  77. Bone, R. Pathological Effects of Soybean Anti-Nutritional Factors on Summer Flounder (Paralichthys dentatus) Tissues. Master’s Thesis, University of Rhode Island, Kingston, RI, USA, 2013. [Google Scholar]
  78. Escaffre, A.M.; Zambonino-Infante, J.L.; Cahu, C.L.; Mambrini, M.; Bergot, P.; Kaushik, S. Nutritional value of soy protein concentrate for larvae of common carp (Cyprinus carpio) based on growth performance and digestive enzyme activities. Aquaculture 1997, 153, 63–80. [Google Scholar] [CrossRef]
  79. Peumans, W.J.; Van Damme, E. Lectins as plant defense proteins. Plant Physiol. 1995, 109, 347–352. [Google Scholar] [CrossRef]
  80. Buttle, L.; Burrells, A.; Good, J.; Williams, P.; Southgate, P. The binding of soybean agglutinin (SBA) to the intestinal epithelium of Atlantic salmon, Salmo salar and Rainbow trout, Oncorhynchus mykiss, fed high levels of soybean meal. Vet. Immunol. Immunopathol. 2001, 80, 237–244. [Google Scholar] [CrossRef]
  81. He, L.; Han, M.; Qiao, S.; He, P.; Li, D.; Li, N.; Ma, X. Soybean antigen proteins and their intestinal sensitization activities. Curr. Protein Pept. Sci. 2015, 16, 613–621. [Google Scholar] [CrossRef] [PubMed]
  82. Francis, G.; Makkar, H.P.S.; Becker, K. Antinutritional factors present in plant-derived alternate fish feed ingredients and their effects in fish. Aquaculture 2001, 199, 197–227. [Google Scholar] [CrossRef]
  83. Storebakken, T.; Shearer, K.; Roem, A. Availability of protein, phosphorus and other elements in fish meal, soy-protein concentrate and phytase-treated soy-protein-concentrate-based diets to Atlantic salmon, Salmo salar. Aquaculture 1998, 161, 365–379. [Google Scholar] [CrossRef]
  84. Carter, C.; Hauler, R. Fish meal replacement by plant meals in extruded feeds for Atlantic salmon, Salmo salar L. Aquaculture 2000, 185, 299–311. [Google Scholar] [CrossRef] [Green Version]
  85. Mukhopadhyay, N.; Ray, A.K. Effect of fermentation on the nutritive value of sesame seed meal in the diets for rohu, Labeo rohita (Hamilton), fingerlings. Aquac. Nutr. 1999, 5, 229–236. [Google Scholar] [CrossRef]
  86. Zhao, S.; Hu, N.; Huang, J.; Liang, Y.; Zhao, B. High-yield spore production from Bacillus licheniformis by solid state fermentation. Biotechnol. Lett. 2008, 30, 295–297. [Google Scholar] [CrossRef] [PubMed]
  87. Teng, D.; Gao, M.; Yang, Y.; Liu, B.; Tian, Z.; Wang, J. Bio-modification of soybean meal with Bacillus subtilis or Aspergillus oryzae. Biocatal. Agric. Biotechnol. 2012, 1, 32–38. [Google Scholar] [CrossRef]
  88. Msadek, T. When the going gets tough: Survival strategies and environmental signaling networks in Bacillus subtilis. Trends Microbiol. 1999, 7, 201–207. [Google Scholar] [CrossRef]
Figure 1. Single-factor test results of (a) inoculation quantity, (b) temperature, (d) water–material ratio by broken-line analysis and (c) fermentation time, and (e) soybean meal (SBM) layer thickness by curve fitting analysis. The value of the horizontal axis corresponding to the maximum DH value is the optimal state of the fermentation factor.
Fermentation 07 00306 g001
Figure 2. The optimization results of RSM with all responses. Factor A: Temperature = 43.82; B: Time = 62.32; C: Water–material ratio = 1.08; D: Layer thickness = 2.02. Responses DH = 15.96; CP = 55.76; Overall Desirability = 0.35.
Fermentation 07 00306 g002
Figure 3. Optimization of the DH using CCD. Interaction of time and temperature (a); interaction of temperature and water–material ratio (b); interaction of time and water–material ratio (c); interaction of time and layer thickness (d); interaction of water–material ratio and layer thickness (e). The green layer of the surface plot represents the optimum condition.
Fermentation 07 00306 g003
Figure 4. Optimization of CP using CCD. Interaction of time and temperature (a); interaction of temperature and water–material ratio (b); interaction of temperature and layer thickness (c); interaction of water–material ratio and layer thickness (d). The green layer of the surface plot represents the optimum condition.
Fermentation 07 00306 g004
Figure 5. Neutral protease activity (NPA) as a function of SSF time.
Fermentation 07 00306 g005
Figure 6. The principal component analysis loadings of amino acid changes between FSM and SBM. The PC1 and PC2 axis explained 59.31% and 17.58% of the total variation, respectively. PC1 is mainly generated by fermentation treatment; PC2 is caused by systematic and analytical errors. Higher amino acid PC1 scores indicate greater influence by fermentation.
Fermentation 07 00306 g006
Figure 7. SDS-PAGE profile of SBM before and after SSF. MN: standard molecular-weight marker; FSM: fermented soybean meal; SBM: unfermented soybean meal; α’: α’-subunit; α: α-subunit; β: β-subunit; a: acidic subunits; b: basic subunit.
Fermentation 07 00306 g007
Table 1. Basic solid-state fermentation (SSF) conditions.
Fermentation StrainInoculation Quantity
(log CFU/kg)
Temperature
(°C)
Time
(h)
Water–Material RatioLayer Thickness
(cm)
Initial pH
B.s. natto10.040.048.01.02.07.5
Table 2. Ranges of the four independent variable variations used in response surface methodology (RSM).
CodeIndependent VariablesLevels
−α−10+1
ATemperature (°C)31.0036.0041.0046.0051.00
BTime (h)54.0060.0066.0072.0078.00
CWater–material ratio0.901.001.101.201.30
DLayer thickness (cm)1.601.802.002.202.40
Code A: fermentation temperature; code B: fermentation time; code C: water–material ratio; code D: layer thickness.
Table 3. Experimental designs used in RSM studies for optimization of fermented soybean meal (FSM).
RunsABCDResponse 1: CP (%)Response 2: DH (%)
136.0072.001.201.8054.8615.53
236.0060.001.001.8055.2415.73
341.0066.001.102.0055.5915.94
441.0066.001.102.4053.6415.56
541.0066.001.102.0055.6415.93
646.0060.001.202.2055.4915.86
746.0072.001.201.8054.3615.53
846.0072.001.202.2054.9115.87
951.0066.001.102.0055.1515.89
1041.0054.001.102.0055.5315.76
1136.0072.001.202.2054.8115.67
1241.0066.001.101.6053.9915.36
1331.0066.001.102.0055.0515.62
1441.0066.000.902.0055.1615.87
1541.0066.001.102.0055.8315.92
1646.0060.001.002.2055.0315.85
1736.0072.001.002.2054.2515.65
1846.0072.001.002.2054.5315.85
1946.0060.001.001.8055.3415.80
2036.0072.001.001.8055.1515.71
2141.0066.001.102.0055.7515.94
2236.0060.001.002.2054.4015.56
2341.0078.001.102.0054.8715.78
2446.0060.001.201.8054.8715.59
2546.0072.001.001.8054.8415.72
2641.0066.001.102.0055.7515.93
2736.0060.001.202.2055.1115.56
2841.0066.001.102.0055.6515.95
2941.0066.001.302.0055.3015.68
3036.0060.001.201.8055.0115.50
Code A: fermentation temperature; code B: fermentation time; code C: water–material ratio; code D: layer thickness. CP: crude protein; DH: degree of protein hydrolysis.
Table 4. Variance and regression analysis of central composite design (CCD) on the response of degree of protein hydrolysis (DH).
ANOVA for Quadratic ModelANOVA for Reduced Quadratic Model
SourceSum of SquaresdfMean SquareF-valuep-valueSourceSum of SquaresdfMean SquareF-valuep-value
Model0.7664140.0547972.72<0.0001Model0.7664130.0591111.15<0.0001
A0.118510.11852106.2<0.0001A0.118510.11852234.09<0.0001
B0.000510.00058.650.0101B0.000510.00059.180.008
C0.053410.0534948.5<0.0001C0.053410.05341006.1<0.0001
D0.05310.053942.48<0.0001D0.05310.053999.71<0.0001
AB0.007310.0073129.66<0.0001AB0.007310.0073137.53<0.0001
AC4.73 × 10−614.73 × 10−60.08410.7758
AD0.041710.0417741.42<0.0001AD0.041710.0417786.44<0.0001
BC0.000910.000916.830.0009BC0.000910.000917.850.0006
BD0.007210.0072128.3<0.0001BD0.007210.0072136.09<0.0001
CD0.045210.0452802.89<0.0001CD0.045210.0452851.65<0.0001
A20.05710.0571013.04<0.0001A20.05710.0571074.56<0.0001
B20.0510.05887.75<0.0001B20.0510.05941.66<0.0001
C20.047910.0479850.7<0.0001C20.047910.0479902.36<0.0001
D20.39210.3926964.4<0.0001D20.39210.3927387.3<0.0001
Residual0.0008150.0001 Residual0.0008160.0001
Lack of Fit0.00041000.4780.85Lack of Fit0.00041100.43950.8811
Pure Error0.000450.0001 Pure Error0.000450.0001
Cor Total0.767329 Cor Total0.767329
Credibility analysis of the regression equations for Quadratic modelCredibility analysis of the regression equations for
Reduced Quadratic model
Std. Dev.0.0075 R20.9989 Std. Dev.0.0073 R20.9989
Mean15.74 Adjusted R20.9979 Mean15.74 Adjusted R20.998
C.V. %0.0477 Predicted R20.9961 C.V. %0.0463 Predicted R20.9967
Code A: fermentation temperature; code B: fermentation time; code C: water–material ratio; code D: layer thickness.
Table 5. Variance and regression analysis of CCD on the response of crude protein (CP).
ANOVA for Quadratic ModelANOVA for Reduced Quadratic Model
SourceSum of SquaresdfMean SquareF-valuep-valueSourceSum of SquaresdfMean SquareF-valuep-value
Model8.29140.5924148.94<0.0001Model8.28120.6903168.99<0.0001
A0.021410.02145.390.0348A0.021410.02145.240.0351
B0.70610.706177.52<0.0001B0.70610.706172.85<0.0001
C0.035810.035890.009C0.035810.03588.760.0088
D0.141510.141535.58<0.0001D0.141510.141534.64<0.0001
AB0.122210.122230.71<0.0001AB0.122210.122229.91<0.0001
AC0.046910.046911.80.0037AC0.046910.046911.490.0035
AD0.313410.313478.81<0.0001AD0.313410.313476.74<0.0001
BC0.005410.00541.350.2633
BD0.004410.00441.110.3091
CD0.808510.8085203.28<0.0001CD0.808510.8085197.93<0.0001
A20.545710.5457137.22<0.0001A20.545710.5457133.61<0.0001
B20.373410.373493.89<0.0001B20.373410.373491.42<0.0001
C20.322610.322681.12<0.0001C20.322610.322678.99<0.0001
D25.8615.861472.95<0.0001D25.8615.861434.18<0.0001
Residual0.0597150.004 Residual0.0694170.0041
Lack of Fit0.0198100.0020.24770.9711Lack of Fit0.0295120.00250.30860.9558
Pure Error0.039950.008 Pure Error0.039950.008
Cor Total8.3529 Cor Total8.3529
Credibility analysis of the regression equations for Quadratic modelCredibility analysis of the regression equations for
Reduced Quadratic model
Std. Dev.0.0631 R20.9929 Std. Dev.0.0639 R20.9917
Mean55.04 Adjusted R20.9862 Mean55.04 Adjusted R20.9858
C.V. %0.1146 Predicted R20.9795 C.V. %0.1161 Predicted R20.9781
Code A: fermentation temperature; code B: fermentation time; code C: water–material ratio; code D: layer thickness.
Table 6. Comparison between predicted and experimental responses at the optimum condition.
ResponsePredicted ValueObserved Valuep-Value95% Confidence Interval
LowerUpper
CP (%)55.7655.71 ± 0.170.67355.3056.12
DH (%)15.9615.85 ± 0.080.13715.6616.04
CP: crude protein; DH: degree of protein hydrolysis.
Table 7. Nutrient and amino acid composition of SBM and FSM (% dry matter basis).
ItemsSBMFSMp-ValueChange (%)
Dry matter (%)90.56 ± 0.0991.85 ± 0.08<0.0011.4
CP (%)50.72 ± 0.3055.71 ± 0.17<0.0019.8
CL (%)2.08 ± 0.071.77 ± 0.050.004−14.9
CF (%)5.80 ± 0.214.98 ± 0.330.022−14.1
CA (%)6.33 ± 0.126.68 ± 0.050.0105.4
PDI (% of CP)31.20 ± 0.7021.90 ± 0.79<0.001−29.8
KPS (% of CP)80.43 ± 1.9694.47 ± 0.81<0.00117.5
DH (%)5.81 ± 0.1816.01 ± 0.11<0.001175.3
Total phenol (mg·g−1)3.25 ± 0.1813.32 ± 1.13<0.001309.4
Flavonoids (mg·g−1) 1.36 ± 0.184.49 ± 0.27<0.001231.0
SBM: soybean meal; FSM: fermented soybean meal. CP: crude protein; CL: crude lipid; CF: crude fiber; CA: crude ash; PDI: protein dispersibility index; KPS: KOH protein solubility; DH: degree of protein hydrolysis.
Table 8. Amino acid composition of SBM and FSM (% dry matter basis).
ItemsSBMFSMp-ValueChange (%)
EAA
Lysine2.93 ± 0.123.18 ± 0.210.1498.5
Methionine0.70 ± 0.060.85 ± 0.040.02820.9
Isoleucine2.37 ± 0.082.56 ± 0.060.0258.0
Leucine3.87 ± 0.154.25 ± 0.250.0869.8
Valine2.10 ± 0.112.53 ± 0.130.01220.5
Arginine3.54 ± 0.253.90 ± 0.050.07010.2
Threonine1.91 ± 0.132.35 ± 0.200.03223.2
Tryptophan0.65 ± 0.040.75 ± 0.030.02914.9
Histidine1.45 ± 0.101.59 ± 0.070.1039.9
Phenylalanine2.49 ± 0.152.74 ± 0.120.08610.1
NEAA
Cystine0.84 ± 0.070.92 ± 0.020.1579.1
Tyrosine1.84 ± 0.102.01 ± 0.100.0989.2
Serine2.17 ± 0.112.55 ± 0.130.01817.7
Glutamic acid8.17 ± 0.629.18 ± 0.090.04912.3
Proline2.51 ± 0.142.85 ± 0.050.01613.7
Glycine2.00 ± 0.172.17 ± 0.180.2978.3
Alanine2.11 ± 0.112.34 ± 0.060.03311.2
Aspartic acid5.70 ± 0.206.05 ± 0.250.1286.1
EAA22.01 ± 0.4124.70 ± 0.20<0.00112.2
NEAA25.34 ± 0.5428.07 ± 0.280.00110.8
Total Amino Acids47.35 ± 0.6852.77 ± 0.11<0.00111.4
Total free amino acid0.46 ± 0.006.33 ± 0.09<0.0011276.1
SBM: soybean meal; FSM: fermented soybean meal. EAA: essential amino acids; NEAA: non-essential amino acids.
Table 9. Anti-nutritional factors (ANFs) of SBM and FSM (mg·g−1).
ItemsSBMFSMp-ValueChange (%)
Trypsin inhibitor3.50 ± 0.101.62 ± 0.09<0.001−53.67
Glycinin79.20 ± 0.4417.63 ± 1.68<0.001−77.74
β-Conglycinin106.38 ± 4.1530.17 ± 6.91<0.001−71.64
Lectins3.35 ± 0.200.02 ± 0.01<0.001−99.40
Raffinose18.43 ± 1.051.67 ± 0.23<0.001−90.94
Stachyose11.92 ± 1.550.55 ± 0.08<0.001−95.38
Phytic acid1.73 ± 0.110.13 ± 0.01<0.001−92.62
SBM: soybean meal; FSM: fermented soybean meal.
Publisher’s Note: MDPI stays neutral with regard to jurisdictional claims in published maps and institutional affiliations.

