Article

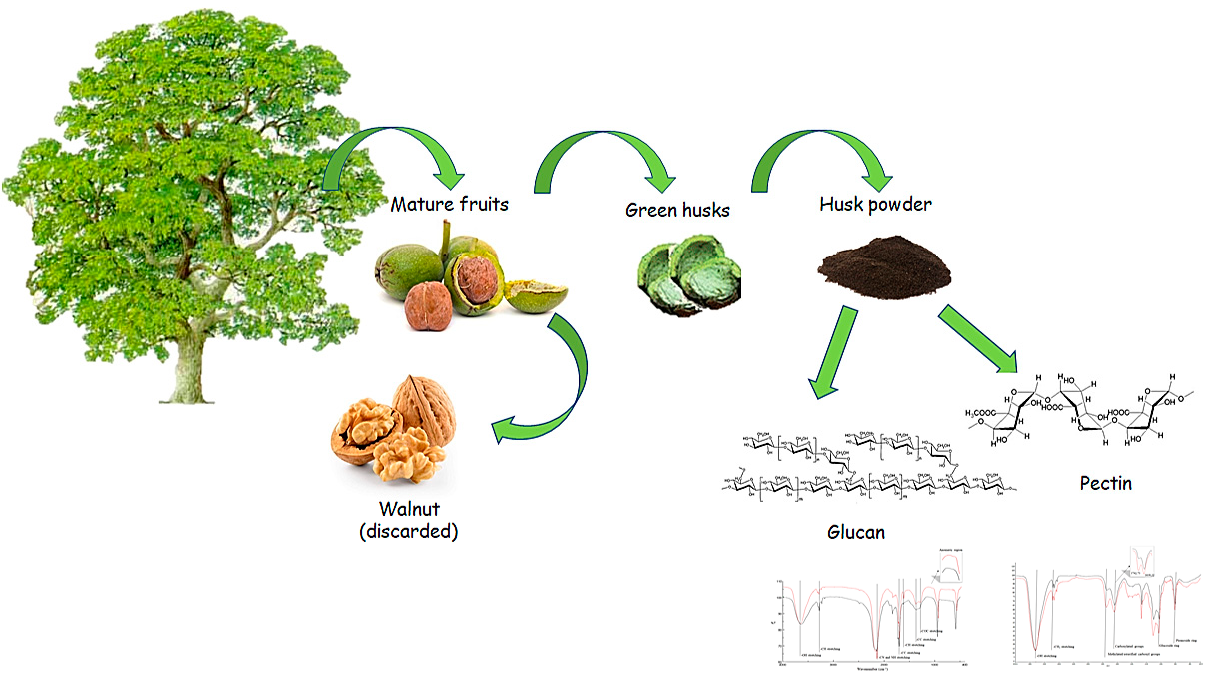
Green Husk of Walnuts (Juglans regia L.) from Southern Italy as a Valuable Source for the Recovery of Glucans and Pectins

1
Department of Pharmacy, Health and Nutritional Sciences, University of Calabria, Edificio Polifunzionale, 87036 Rende, CS, Italy
2
Department of Chemistry and Chemical Technologies, University of Calabria, 87036 Rende, CS, Italy
*
Author to whom correspondence should be addressed.
Fermentation 2021, 7(4), 305; https://doi.org/10.3390/fermentation7040305
Submission received: 18 October 2021 / Revised: 3 December 2021 / Accepted: 6 December 2021 / Published: 10 December 2021
(This article belongs to the Special Issue Food Waste Valorization)

Abstract

:
Walnut green husk is an agricultural waste produced during the walnut (Juglans regia L.) harvest, that could be valued as a source of high-value compounds. In this respect, walnut green husks from two areas of Southern Italy (Montalto Uffugo and Zumpano), with different soil conditions, were investigated. Glucans and pectins were isolated from dry walnut husks by carrying out alkaline and acidic extractions, respectively, and then they were characterized by FT-IR, scanning electron microscopy (SEM) and differential scanning calorimetry (DSC). The colorimetric method for the enzymatic measurement of α- and β-glucans was performed. The maximum total glucan yield was recovered from Montalto walnut husks (4.6 ± 0.2 g/100 g DM) with a β-glucan percentage (6.3 ± 0.4) higher than that calculated for Zumpano walnut husks (3.6 ± 0.5). Thermal analysis (DSC) confirmed the higher degree of crystallinity of glucans from Zumpano. The pectin content for Montalto husks was found to be 2.6 times that of Zumpano husks, and the esterification degree was more than 65%. The results suggested that J. regia L. green husks could be a source of glucans and pectins, whose content and morphological and thermal characteristics were influenced by different soil and climate conditions.

Graphical Abstract

1. Introduction

The walnut husk is the fleshy part of the fruit of the walnut fruit (Juglans regia L.) that covers the shell enclosing the edible kernel. When ripe, walnut husk has a green color that darkens over time. Shell and husk are discarded, causing environmental pollution. The green husks of the walnut fruit are the basic material for the traditional walnut liqueur, a wholesome alcoholic drink, which is rich in phenolic compounds and vitamins [1,2]. Additionally, the husks have been used since ancient times in traditional medicine and for the treatment of various diseases such as microbial infections, stomachache, thyroid dysfunctions, heart diseases and sinusitis [3,4]. Recently, scientific attention towards the valuable active constituents of walnut husks has been increasing. The potential of this low-cost natural material as a source of phenolic compounds with antiradical and antimicrobial activities has been demonstrated by several studies [5]. The influence of solvents of varying polarity on the extraction yields of phenolic extracts from walnut husks has been described in the literature [6] and the effects of geographical and climatic conditions on their phenolic and flavonoids contents were studied [7]. The walnut husk contains natural dyes, such as juglone which is a brown pigment [8], but also a potent antimicrobial and anticancer agent [9,10,11]. Several agricultural food wastes, such as pomegranate Akko peels [12], Vicia faba L. [13], banana peels [14], coffee pulp waste [15], mango peel and cocoa pod husk [16], were found to be potential sources of glucans and pectins. To the best of our knowledge, there are no reports on the recovery of nutraceuticals such as glucans and pectins from walnut husks for the valorization of these agricultural waste products. Therefore, with the aim of providing additional added value to these residual sources and basic support for their functional uses, the present study investigated glucan and pectin contents from the green husks of walnuts grown in two different soil and climate areas of Southern Italy (Montalto Uffugo e Zumpano). Further spectroscopic, morphological and thermal characterizations of the extracted high-value compounds were performed in order to determine if the effect of the different pedoclimatic conditions of the two areas could lead to significant differences both in the content of glucans and pectins and their characteristics, which could affect their functional uses.

2. Materials and Methods

2.1. Standards and Chemicals
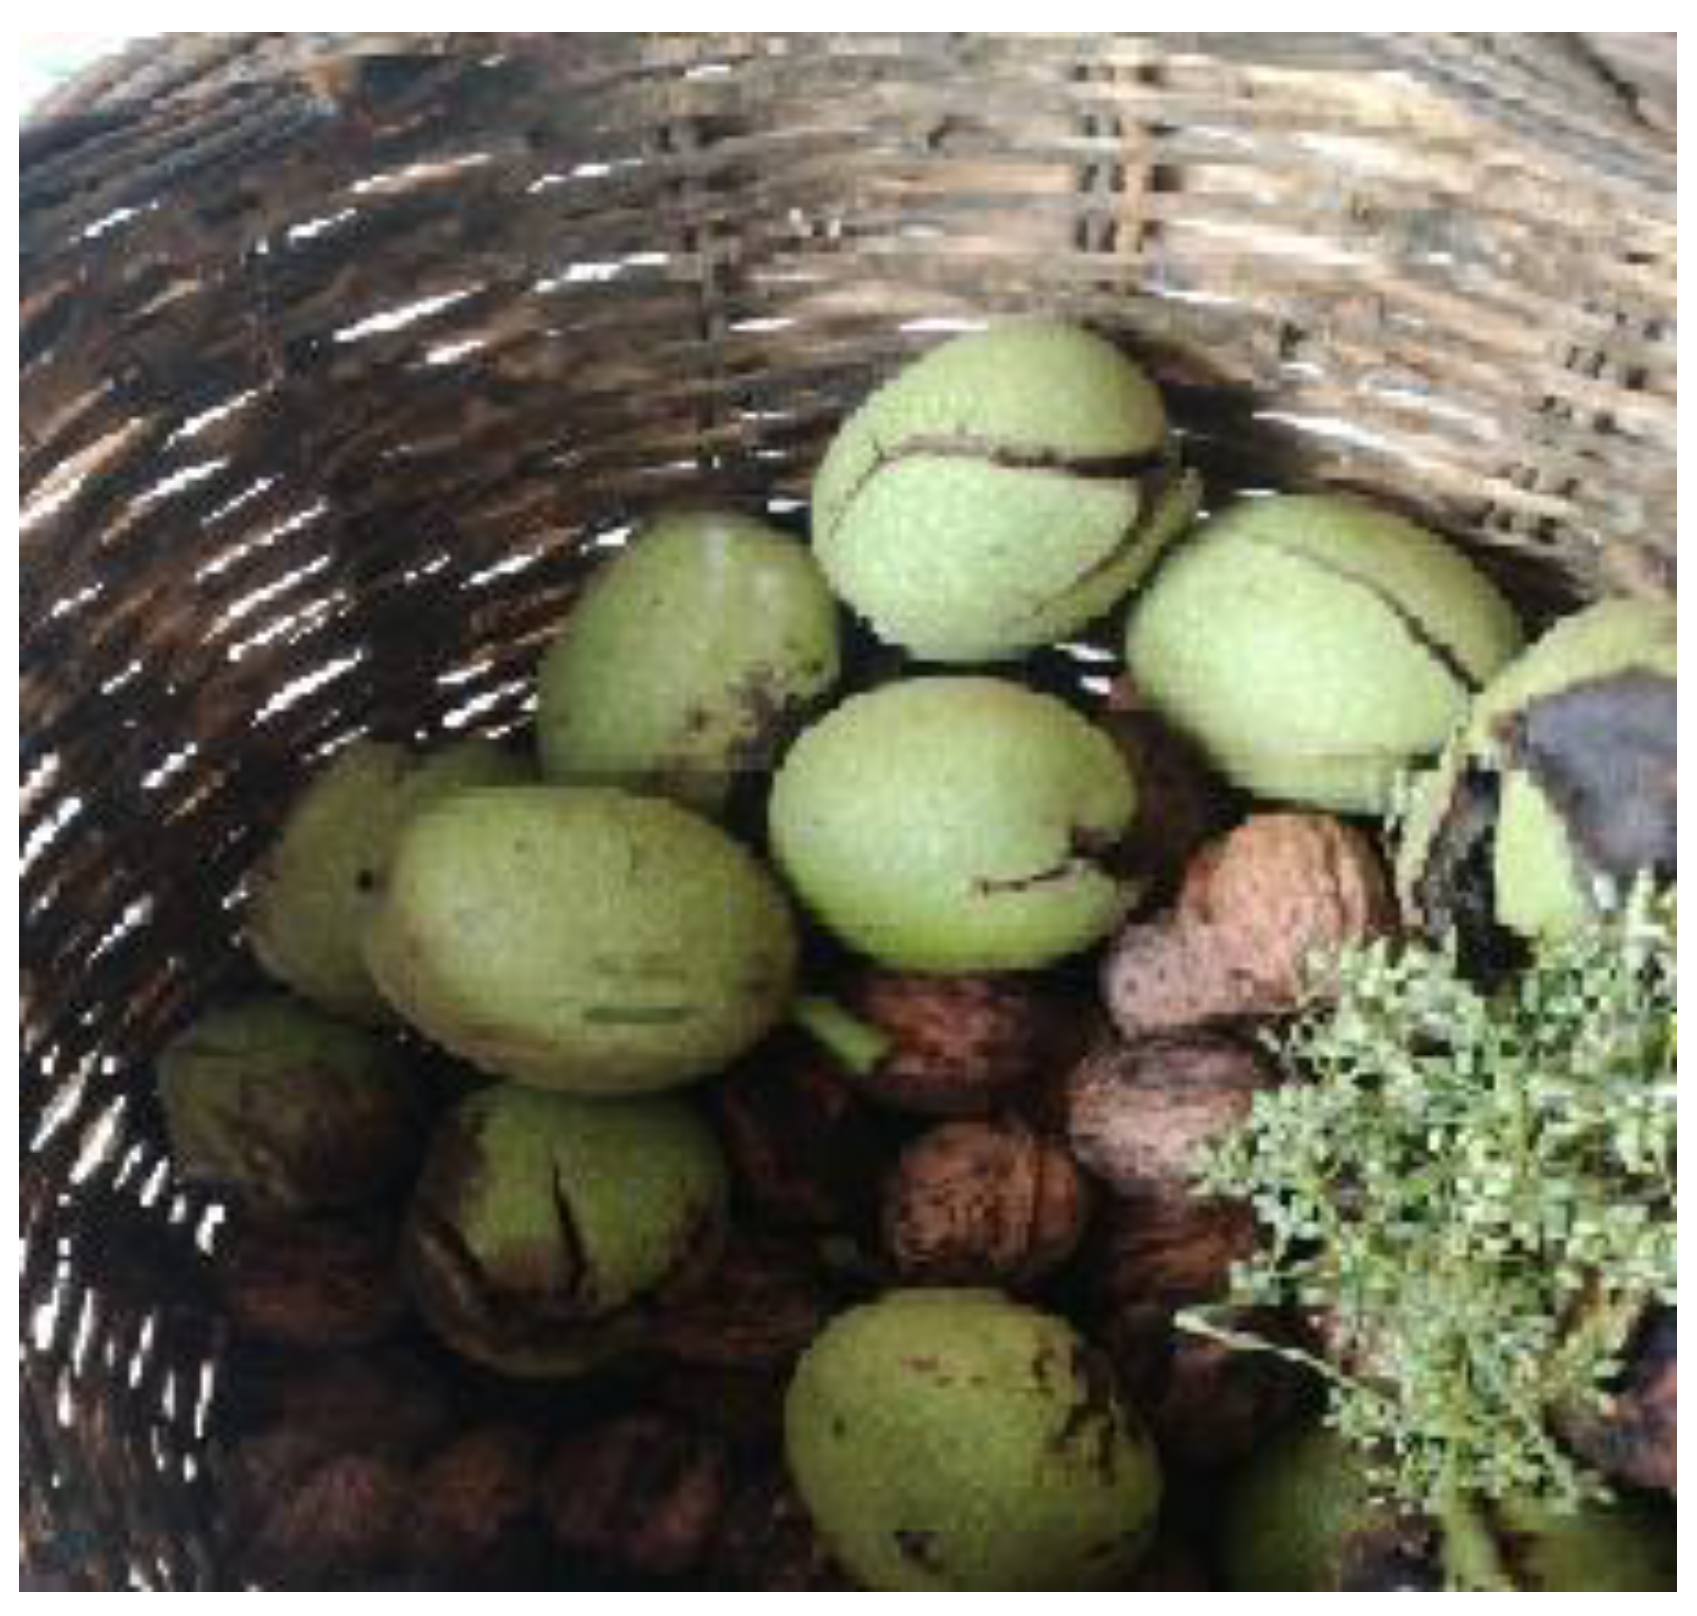
Analytical grade solvents were purchased from Carlo Erba. Sodium carbonate, hydrochloric acid and citric acid were from Sigma-Aldrich (Milan, Italy). The glucan contents were determined by the method published by McCleary and Codd [17] using a mushroom and yeast β-glucan kit (Cat. No. K-YBGL). The kit was obtained from Megazyme International (Bray, County Wicklow, Ireland).

2.2. Agri-Wastes

Walnut fruits with green hulls (Juglans regia L., Figure 1) were harvested from trees grown in two different agroclimatic localities of Calabria, in the south of Italy, which were Montalto Uffugo (latitude: 39°24′20″88 N, longitude: 16°9′31″68 E) and Zumpano (latitude: 39°18′42″84 N, longitude: 16°17′34″44 E). Altitudes, geographical and climatic conditions of gathering areas are summarized in Table 1.
The whole fruits were collected in the period of October 2017, when the walnut fruits were mature while the husks (mesocarp) were green and firm. The husks were manually separated from the walnut, freeze-dried (Telstar freeze-dryer, mod. Cryodos) after freezing at −20 °C and then reduced to powder using a pestle and mortar. The powder was sieved through a 60-mesh (250 μm) screen and then kept in screw-cap vials under nitrogen at −20 °C, before any extraction. Three samples per area were used, and all the extractions were carried out in triplicate. The data were expressed on a dry matter basis as mean ± standard deviation.

2.3. Extraction of Glucans

The employed extraction procedure was a conventional method involving two stages to sequentially remove starch and proteins from the powder, namely an aqueous alkali extraction at pH 10 and 55 °C and acidic precipitation, respectively [12,18,19,20].
Preliminary treatments of this method involve sequential extractions with three solvents in order of increasing polarity, to remove lipids and soluble material such as vitamins, polyphenols, monosaccharides, disaccharides, and others [21]. The flour (3 g) was first extracted with acetone (3 × 30 mL each), then with methanol (3 × 30 mL each) and finally with 70% aqueous ethanol (3 × 30 mL each). All the extractions were performed at room temperature (t = 2 h). For starch precipitation, residue solid was added to a solution of 20%, w/v sodium carbonate in distilled water (pH 10, 30 mL), and the obtained suspension was warmed at 55 °C in a water bath with stirring for 30 min and then was centrifuged (Model J2–21, Beckman Instrument Co., Mississauga, ON, Canada) at 5000× g for 30 min. The solid was removed, and the pH of the supernatant was added to HCl 2 M until a pH of 4.5 was reached (isoelectric point of proteins), and centrifuged at 5000× g for 30 min to separate proteins [22,23], which were discarded. An equal volume of absolute ethanol was added to the supernatant in order to precipitate glucans. After 12 h at 4 °C, the solution was centrifuged at 5000× g for 30 min. The precipitate was resuspended in ethanol, filtered, rinsed with ethanol and freeze-dried. The extractions were performed in triplicate on three samples of husk powder from each agroclimate locality and the results were expressed as mean ± standard deviation. The crude glucans were measured and characterized by FT-IR, SEM and DSC.

2.4. α- and β-Glucan Content

β-glucan content of husks was determined in triplicate using β-glucan assay kit from Megazyme Ltd., Bray, Co. Wicklow, Ireland [17]. The dry sample (100 mg) was weighed into a 25 mL flask and 12 M ice-cold sulphuric acid solution (2 mL) was added. The solution was vortexed and left to incubate for 2 h in an ice-water bath, and then it was diluted with distilled water (12 mL) and left for 2 h in a boiling-water bath (T = 100 °C). After cooling the temperature, 10 M KOH solution (6 mL) and 200 mM sodium acetate buffer (pH 5) were added. After centrifugation (1500× g, t = 10 min), an aliquot (0.1 mL) of the supernatant was mixed with 0.1 mL of a mixture of exo-1,3-β-glucanase (20 U/mL) plus β-glucosidase (4 U/mL) at 40 °C for 60 min. Finally, the content of glucose in the solutions was determined by incubating the solution with glucose-oxidase/peroxidase (GOPOD, 3.0 mL) at 40 °C for 20 min.
For obtaining total glucan content, the solution was analysed by the spectrophotometer at λ = 510 nm (Model UV-vis, JASCO, V-550) against the blank and the D-glucose standard solution (1 mg/mL), incubated with GOPOD reagent. The blank was prepared by adding 0.2 mL of 200 mM sodium acetate buffer at pH 5.0 to 3 mL of GOPOD. For obtaining α-glucan content, the husk flour (0.1 g) was added with 2 M KOH (2 mL), 1.2 M sodium acetate buffer (pH 3.8, 8 mL) and incubated with 0.2 mL of amyloglucosidase plus invertase for 30 min at 40 °C. After centrifugation (1500× g, t = 10 min), the supernatant (0.1 mL) was mixed with sodium acetate buffer (200 mM, pH 5.0, 0.1 mL) and GOPOD (3 mL). The difference between total and α-glucan contents gave the β-glucan content.

2.5. Extraction of Pectins

Pectins from husk flour were extracted according to the experimental conditions reported by Fazio et al. [24]. The employed procedure was the conventional heating extractive method with citric acid [25,26].
Next, 10% (w/v) citric acid solution was added to husk flour (2 g) until pH of 2 was reached, creating a mixture which was magnetically stirred for 1 h at 90 °C. After cooling and centrifugation (5000× g, t = 30 min), the supernatant was added with an equal volume of absolute ethanol and then kept for 16 h at 4 °C in order to allow for pectin flotation. After centrifugation (Universal 320, Hettich Zentrifugen, Merck, Italy), the floating pectins were rinsed with absolute ethanol, solubilized in distilled water, added to an equal volume of acetone to decolourise the pectins [18], and left to stand at 4 °C for 12 h. Afterwards, the supernatant was separated by centrifugation at 5000× g, t = 15 min, and the gelatinous residue was dried under a vacuum. The extraction procedure was repeated three times and data expressed as mean ± standard deviation. All samples were characterized by FTIR, and SEM and DSC.

2.6. Determination of Esterification Degree

The esterification degree of pectins, defined as the ratio of esterified carboxy groups to the total number of carboxy groups was determined by the potentiometric titration method (DE)] and confirmed by the instrumental FT-IR method (DM) [13].

2.6.1. Potentiometric Titration Method

The esterification degree of pectins was determined by titrimetric method, as previously described by Fazio et al. [24]. The dried pectin (20 mg) sample was weighed in a beaker, wetted with ethanol and dissolved in 5 mL of distilled water. For complete dissolution of pectins, the suspension was heated at 45 °C under magnetic stirring for 20 min. The resulting solution was titrated with 0.01 N NaOH in the presence of three drops of phenolphthalein. The initial titration volume (V1) was recorded once a pale pink colour appeared, and it indicated the number of free carboxy groups. Then, 3 mL of 0.01 N NaOH was added to neutralize polygalacturonic acid, and the solution was stirred at room temperature for 2 h in order to saponify the esterified carboxy groups of the polymer. Then, 3 mL of 0.01 N hydrochloric acid (HCl) was added to neutralize the sodium hydroxide NaOH, followed by titration of excess HCl with 0.01 N NaOH in the presence of phenolphthalein. The volume of titration required for pale pink colouring of the sample was recorded as final titration volume (V2, representing the esterified group number). The DE was determined as follows:
%DE = [V2 (mL)/V1 (mL) + V2 (mL)] × 100

2.6.2. Instrumental FT-IR Method

In this methodology, the FT-IR spectra recorded for the characterization of pectins were used to determine the degree of methoxylation (DM), taking into account the band areas at 1747–1746 cm−1 and 1633–1621 cm−1 arising from methyl-esterified and carboxylate groups, respectively. The degree of methoxylation was obtained using the equation:
%DM = [A COOCH3/(A COOCH3 + ACOO)] × 100

2.7. FT-IR Spectroscopic Analysis

Glucans and pectins were analysed by FT-IR using a Bruker ALPHA FT-IR spectrometer equipped with a A241/D reflection module in 4000–400 cm−1 range, by following the standard KBr method. The sample was ground with KBr in the 1:40 ratio, and the resulting powder was hard-pressed into tablets. All experiments were carried out in triplicate at a spectral resolution of 4 cm−1.

2.8. Scanning Electron Microscopy (SEM)

The surface morphological investigations were carried out by a scanning electron microscope (SEM) (Field Emission SEM FEI Quanta 200, Thermo Fisher Scientific, Hillsboro, OR, USA) and Electron Probe Micro Analyzer (EPMA)-JEOL-JXA 8230t (Kyoto, Japan). The analyses were performed under conditions reported by Fazio et al. [24].

2.9. Differential Scanning Calorimetry (DSC)

The calorimetric behaviour of the samples was analysed using DSC SETARAM 131 instrument. The calibration operations were carried out using a sample of indium with a known weight. Each sample (15–30 mg) was weighed in a crucible, and then the container was capped and sealed by mechanical press. All the tests were carried out under nitrogen flow at a temperature scan rate of 20 °C/min.

2.10. Statistical Analysis

DE and DM were analysed in triplicate and the results were expressed as mean ± standard deviation (SD). One-way ANOVA method and a Sidak comparison method via GraphPad Prism 8 were used. Significance was established at p values < 0.05 (*), p < 0.01 (**), p < 0.001 (***), and p < 0.0001 (****).

3. Results

3.1. Extraction of Glucans

Extraction solvents (acetone, methanol and 70% aqueous ethanol) removed lipids and soluble material to facilitate the complete separation of fibre [27]. During this process, the resulting residue was slurred in alkaline aqueous solution to solubilize glucans and proteins, followed by precipitation of proteins under acidic conditions (pH = 4.5) and by recovery of crude glucans after precipitation from ethanol. More advanced technologies to obtain glucans have been used recently, such as accelerated solvent extraction [28] and microwave-assisted extractions [29], plus pressurized solvent extraction [30]. Although these procedures have been shown to be faster than traditional methodologies, they require a more accurate purification procedure for the isolation of nutraceuticals of interest, and they can be performed through the use of more specific devices, which increases the costs [30]. The experimental results are given in Table 1. Data reported in the table show that the content of glucans was slightly higher in walnut husks from Montalto (4.6 ± 0.2 g/100 g DM) than in those from Zumpano (3.74 ± 0.3 g/100 g DM).

3.2. α- and β-Glucan Content

The enzymatic method for β-glucan measurement is widely used due to its accuracy and reliability. In this approach, complete hydrolysis of glucans requires a controlled acid measured with GOPOD reagent. α-glucans were determined using specific enzymes for α-glycosidic bond hydrolysis under alkaline conditions, and β-glucans were calculated by the difference between total and α-glucan content. This method aimed to achieve complete hydrolysis of both α- and β-glucans to glucose, minimizing the loss of glucose through secondary reactions (Table 2).
As can be seen from the data reported in the table, the percentage of total glucans determined by the enzymatic method confirmed that walnut husks from Montalto (11.3 ± 0.7%) had a higher content than walnut husks from Zumpano (7.2 ± 0.4%). Additionally, Montalto husks were richer in β-glucans (6.3 ± 0.4%) than in α-glucans (5.0 ± 0.2%), while Zumpano husks, compared to the Montalto husks, contained α- and β-glucans in equal percentages (3.6 ± 0.4%).

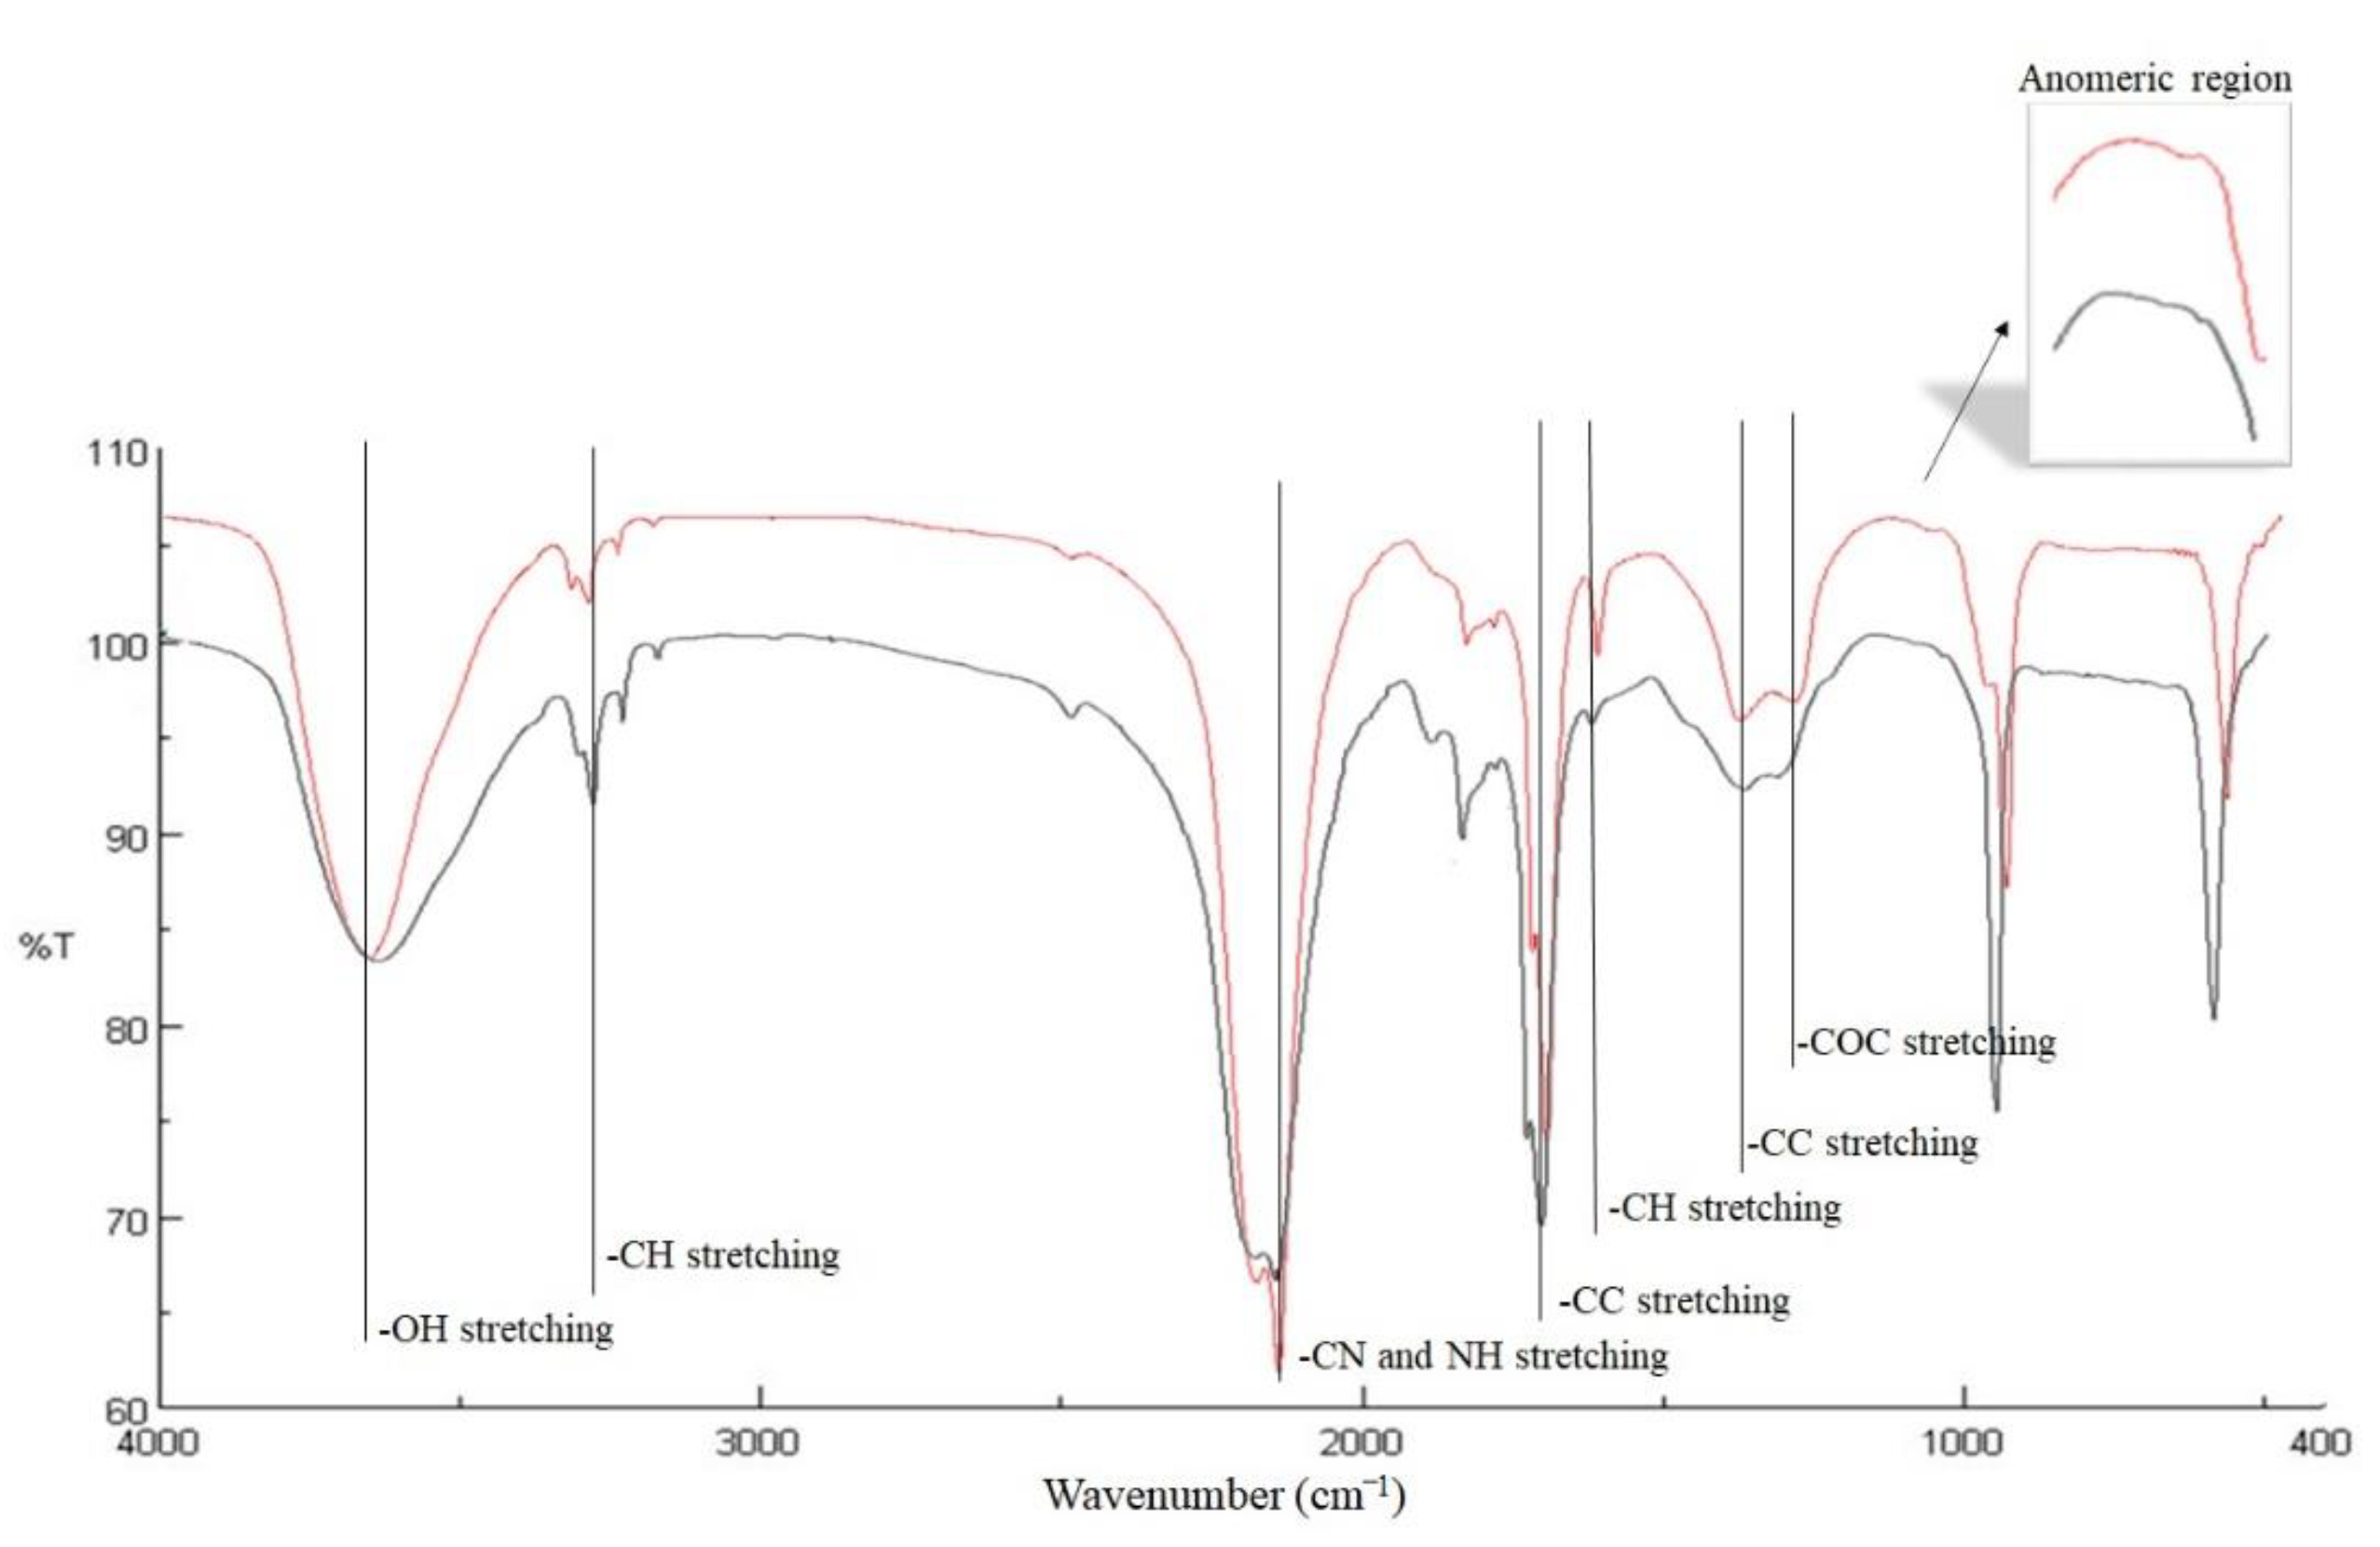
3.3. FT-IR Spectroscopic Analysis of Glucans

Infrared spectroscopic analysis of glucans provided information on the fundamental molecular vibrations of covalent bonds in the 4000–400 cm−1 IR region, showing the characteristic bands of the major functional groups (Figure 2). The comparison of glucan spectra from Montalto and Zumpano husks highlighted that the qualitative profile of the structures does not significantly change. The IR band centred around 3437 cm−1 was generated by the symmetrical and asymmetric stretching of the OH groups present on the glucan backbone. The bands at 2920–2918 cm−1 were due to CH2 stretching of CH2OH groups. The presence of proteins in the sample linked to the glucan backbone by amide bonding provided the stretching of the CN and NH groups [31,32] generating the band at 1641 cm−1 (the amide I). OH and CH bending from in-plane ring deformation generated two IR peaks at 1322 cm−1 and 1261 cm−1, respectively. COC and CC stretching vibrations of the glucosides ring originated two bands in the region of 1090–1025 cm−1, indicating the presence of cyclic structures of monosaccharides [33]. The 950–780 cm−1 region is called the “anomeric region”, where it was possible to distinguish between the two anomeric glycosidic bond types of the glucopyranose rings which generated absorption bands at 860–830 cm−1 for α-linkage and at 920–890 cm−1 for β-linkage [19].

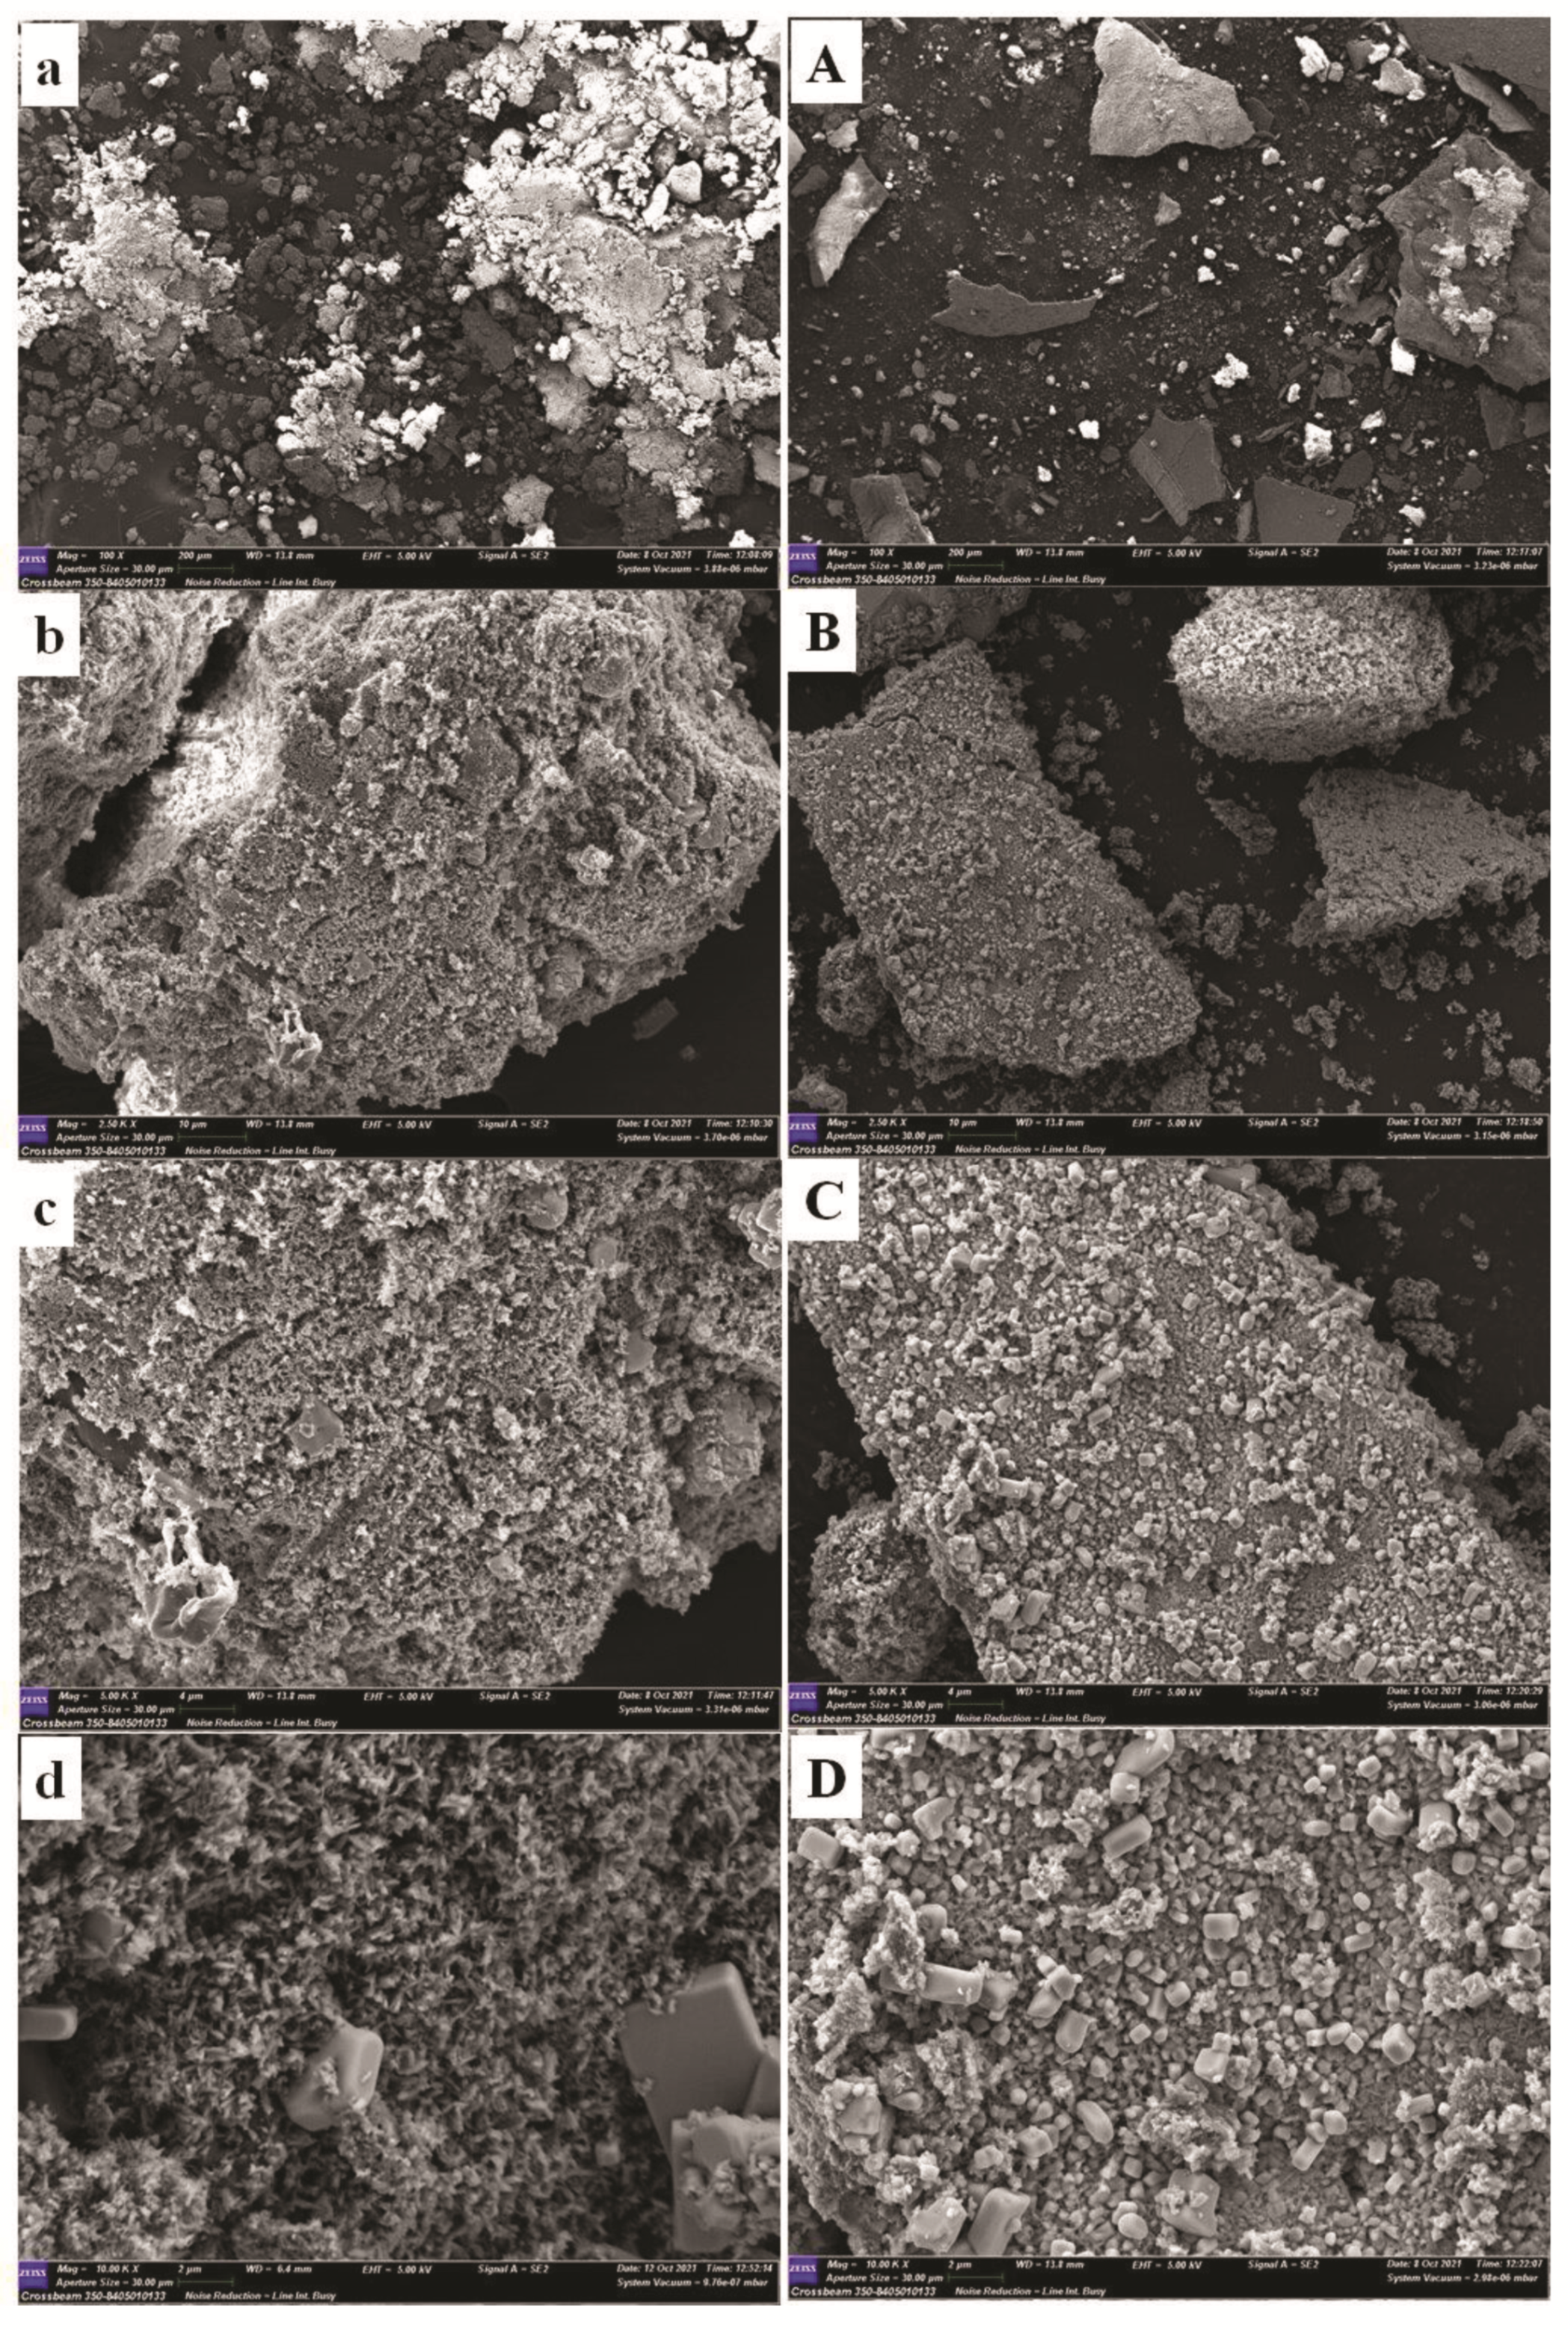
3.4. Scanning Electron Microscopy (SEM) of Glucans

The morphological investigation was carried out to highlight any different surface structures arising in the same type of fibre (glucans) from different soil and climate conditions. All the sample were analysed under the same conditions: four magnifications equal to 100×, 2500×, 5000× and 10,000 with a scale equal to 200, 10, 4 and 2 µm, respectively. The surface of crude glucans from Zumpano husks (GZ) showed the presence of aggregates in the form of microcrystals, whose dimensions were variable as it was more evident at high magnifications (5000× and 10,000×) (Figure 3a–d). The size distribution of the crystals was uneven: some crystals were significantly larger than others. The microcrystals observed were rectangular and needle-like in nature. The presence of particles probably glassy in nature which were incorporated into the matrix were also observed. Microcrystals were also observed in the glucans from Montalto hulls (GM), but unlike those present on the surface of glucans from Zumpano husks, they were larger compared to GZ, not aggregated and had a cubic form (Figure 3A–D).

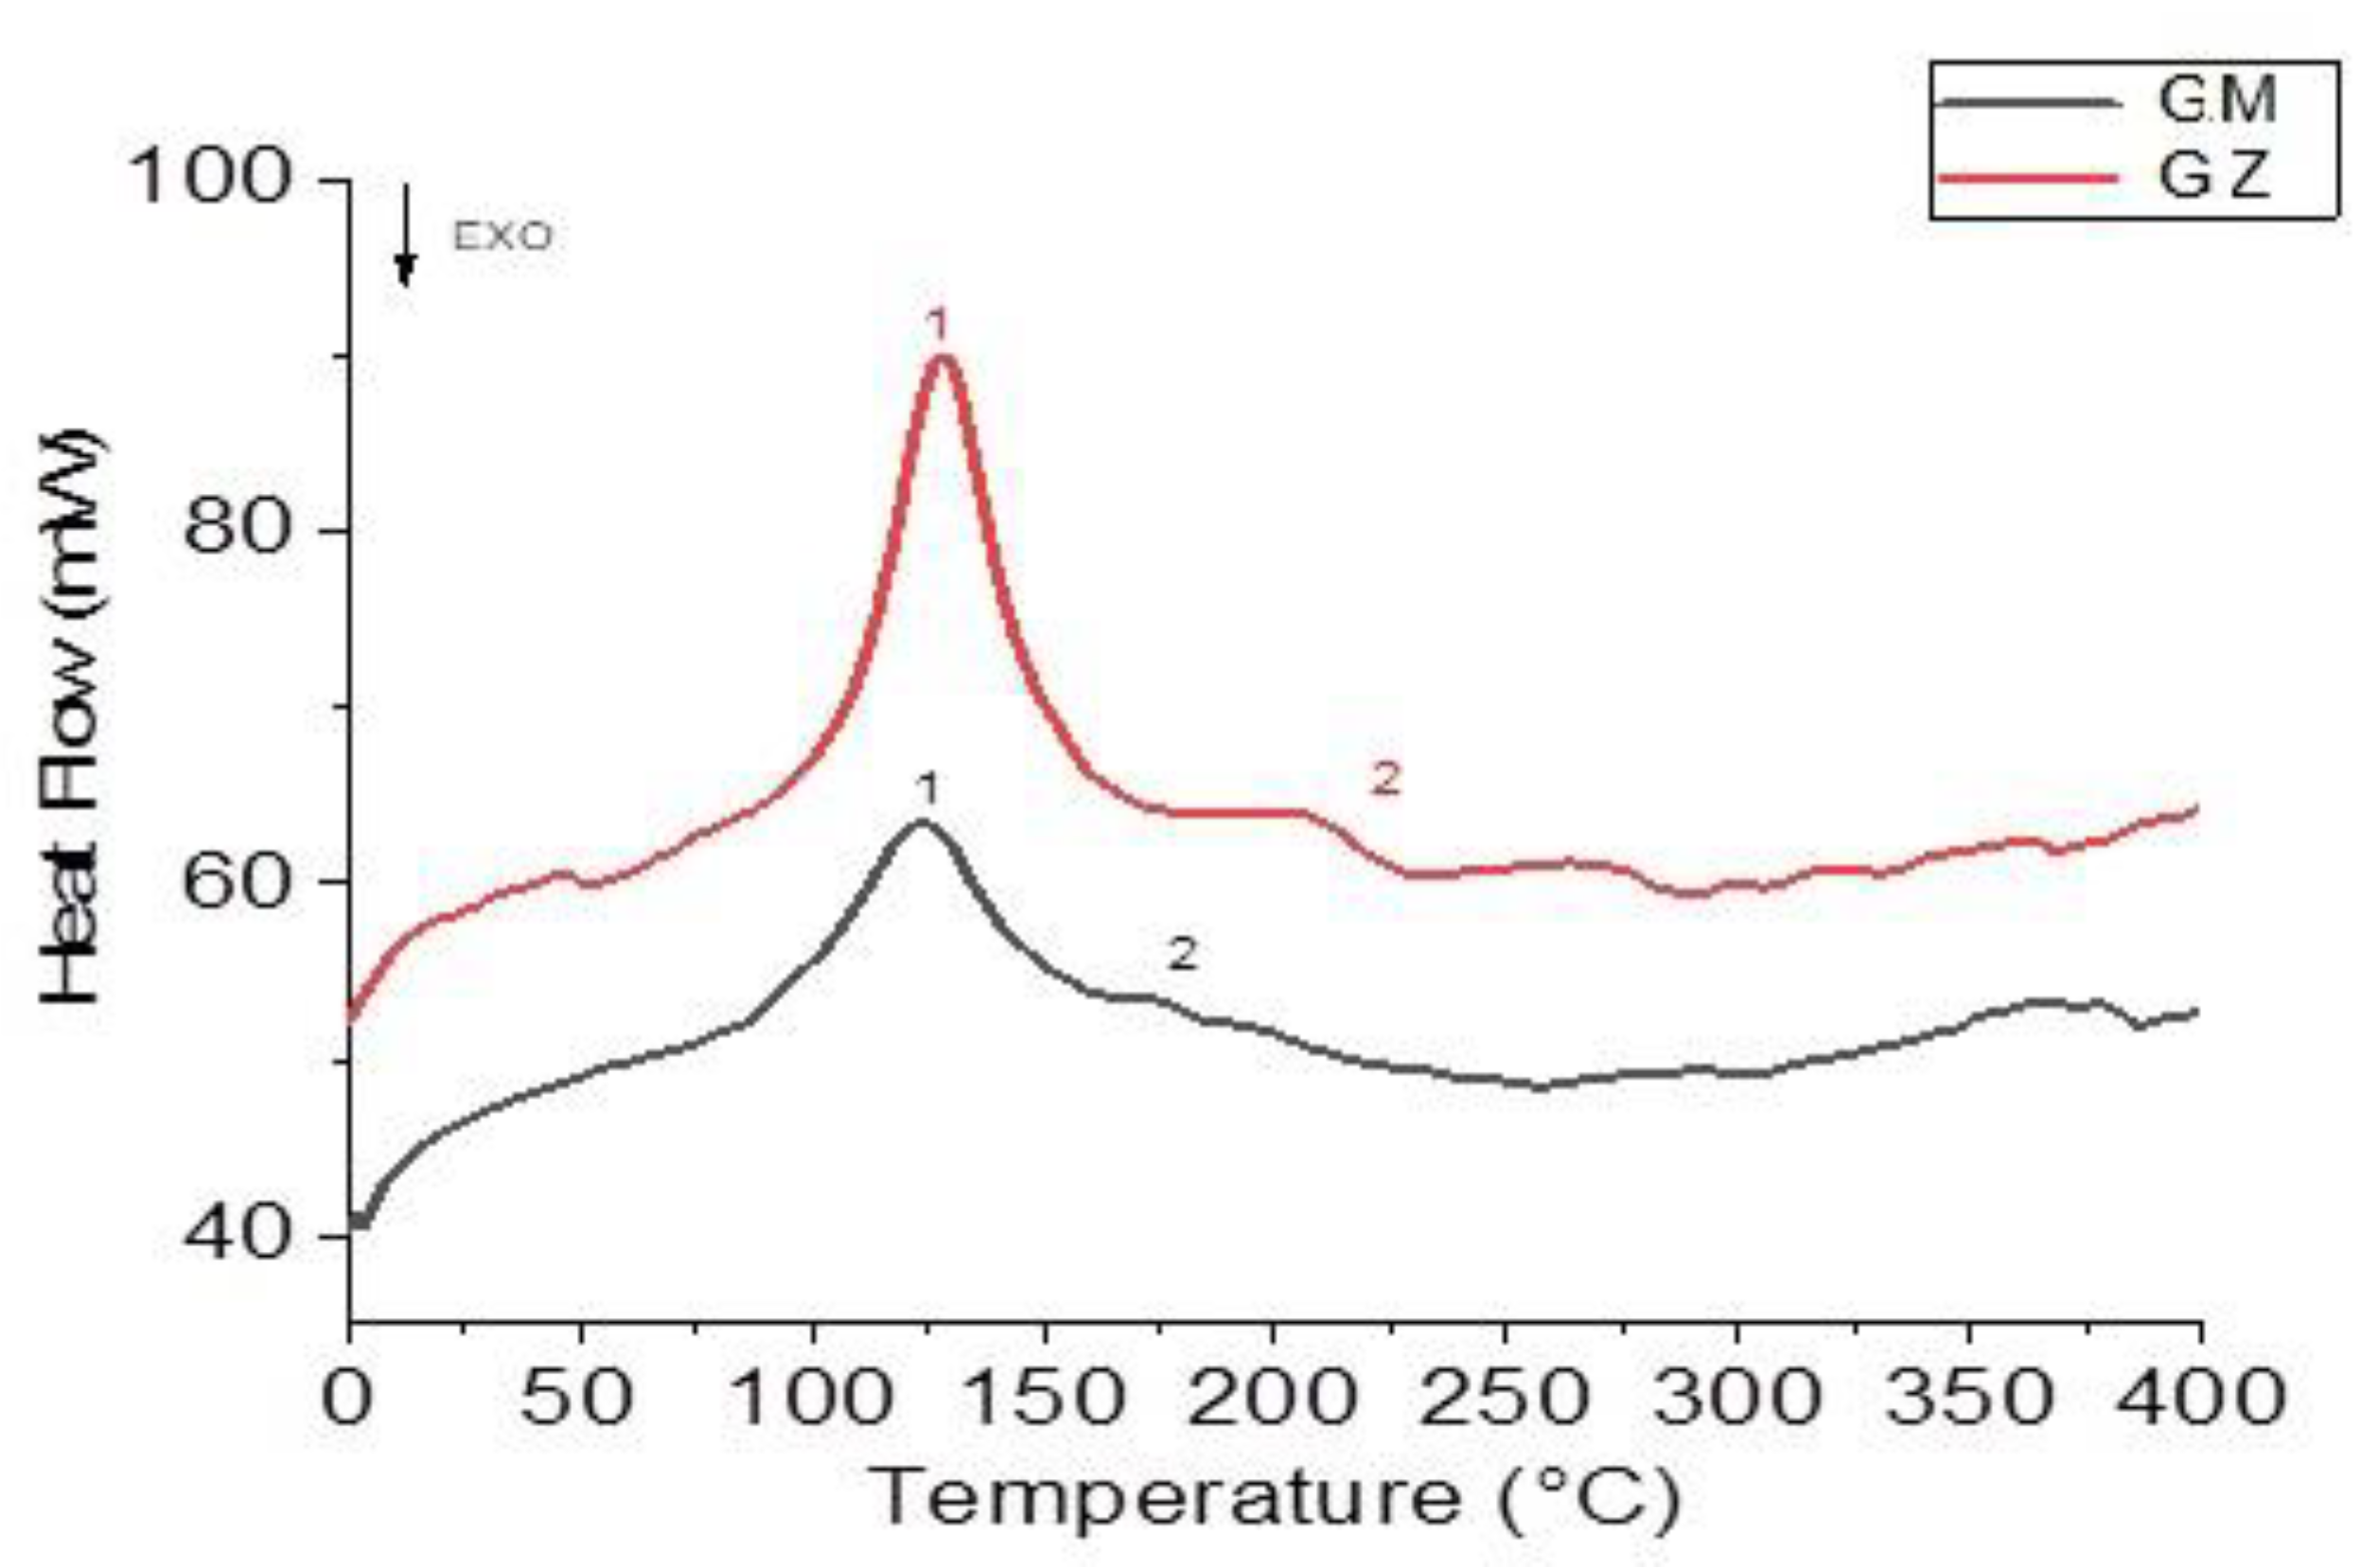
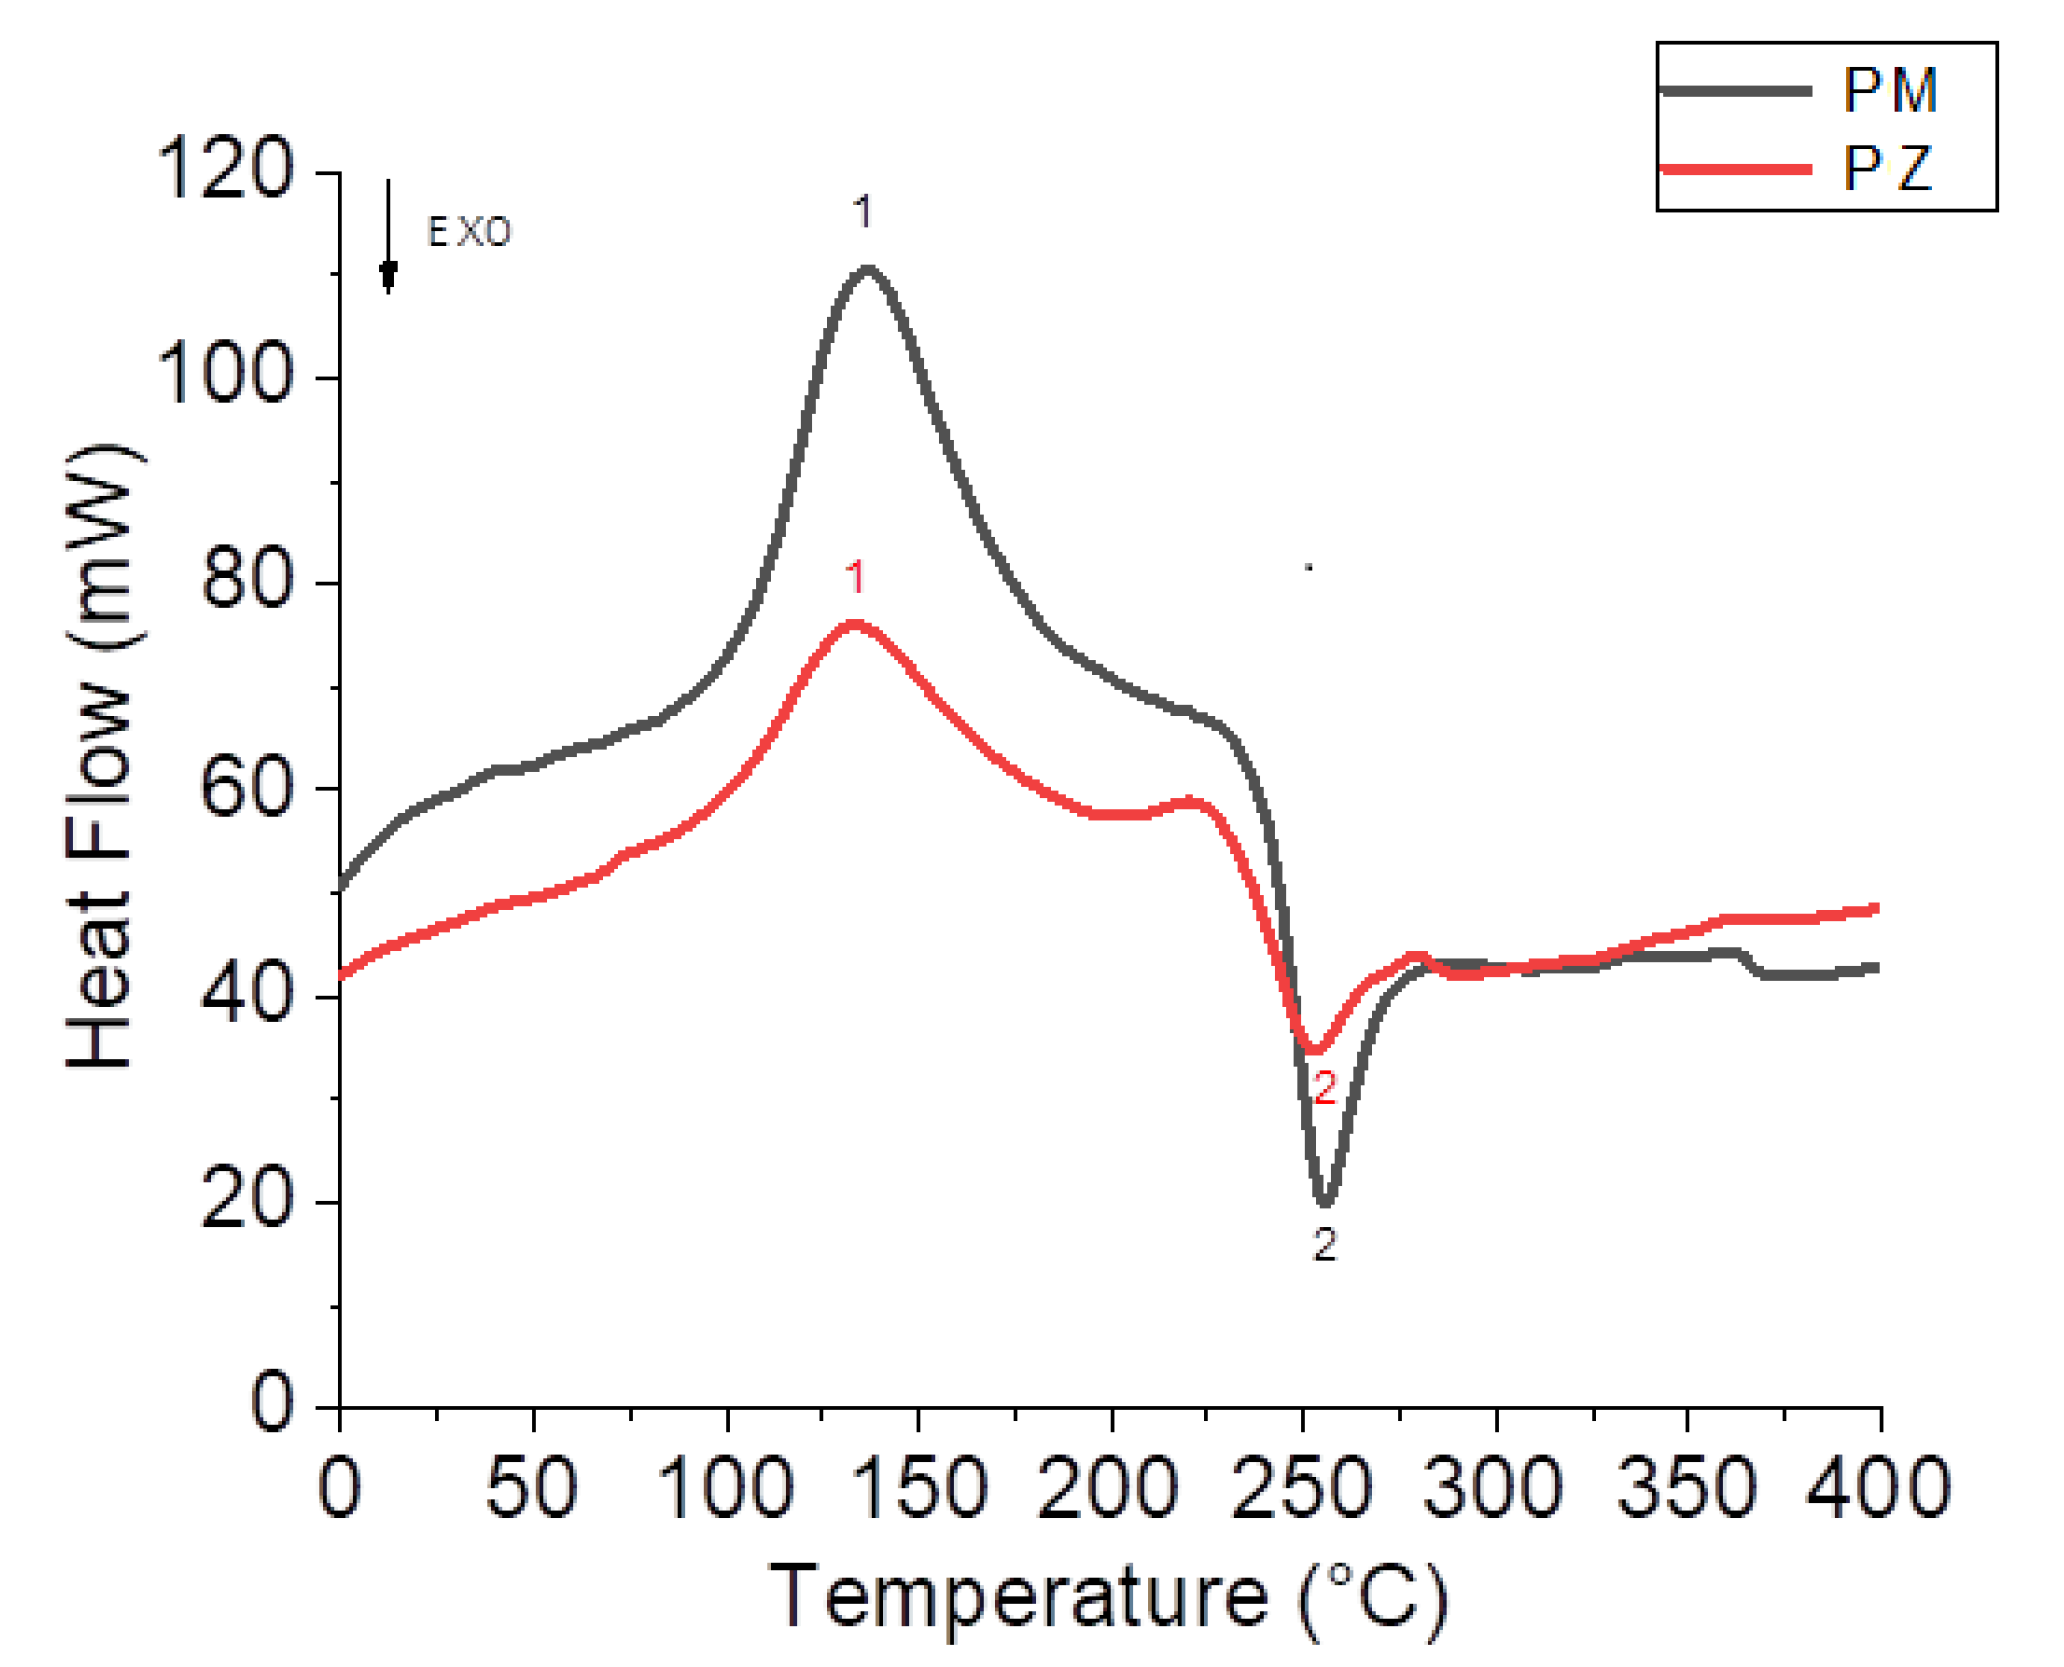
3.5. Differential Scanning Calorimetry (DSC) of Glucans

The calorimetric curves recorded for the glucan samples are very similar. Both mainly presented an endothermic peak (1) near 125 °C and a glass transition (TG) between 150 and 220 °C (Figure 4).
Peak one of the GZ samples had an enthalpy value (E = 115.8 J/g) significantly higher than that recorded for the same peak of the GM samples (E = 52.3 J/g). The enthalpy of fusion was closely related to the degree of crystallinity. A higher value corresponded to a greater interaction between the molecules, and there was more interaction between the molecules in the GM samples than in the GZ samples.
Inflection points typical of glass transition (TG) [34] were present in both samples, but GZ samples had a higher TG (246.0 °C) than the GM samples (TG = 180.5 °C).

3.6. Extraction of Pectins

Recently, advanced technologies have been developed to improve the yield and to decrease the time of pectin extraction. The “so-called” green methodologies are nonthermal processes that apply, in place of the heat, the acoustic energy of ultrasounds (ultrasound-assisted extraction), or microwave radiation (microwave-assisted extraction) to increase the release of the target material [35,36]. Nevertheless, the employed process for the pectin extraction from walnut husks was the traditional method which involved hydrolysis of protopectin with citric acid and extraction from the primary cell wall of plant tissue using water under reflux, because preliminary extraction tests using ultrasounds resulted in lower yields. Citric acid, compared with mineral acids, had a lower environmental impact and it was cheaper [37].
The obtained results showed that the pectin content of husks from Montalto (PM, 69.8 ± 0.1 g/100 g DM) was about three times higher than that extracted from Zumpano hulls (PZ, 27.1 ± 0.3 g/100 g DM), which indicated that different pedoclimatic areas influenced fibre content.

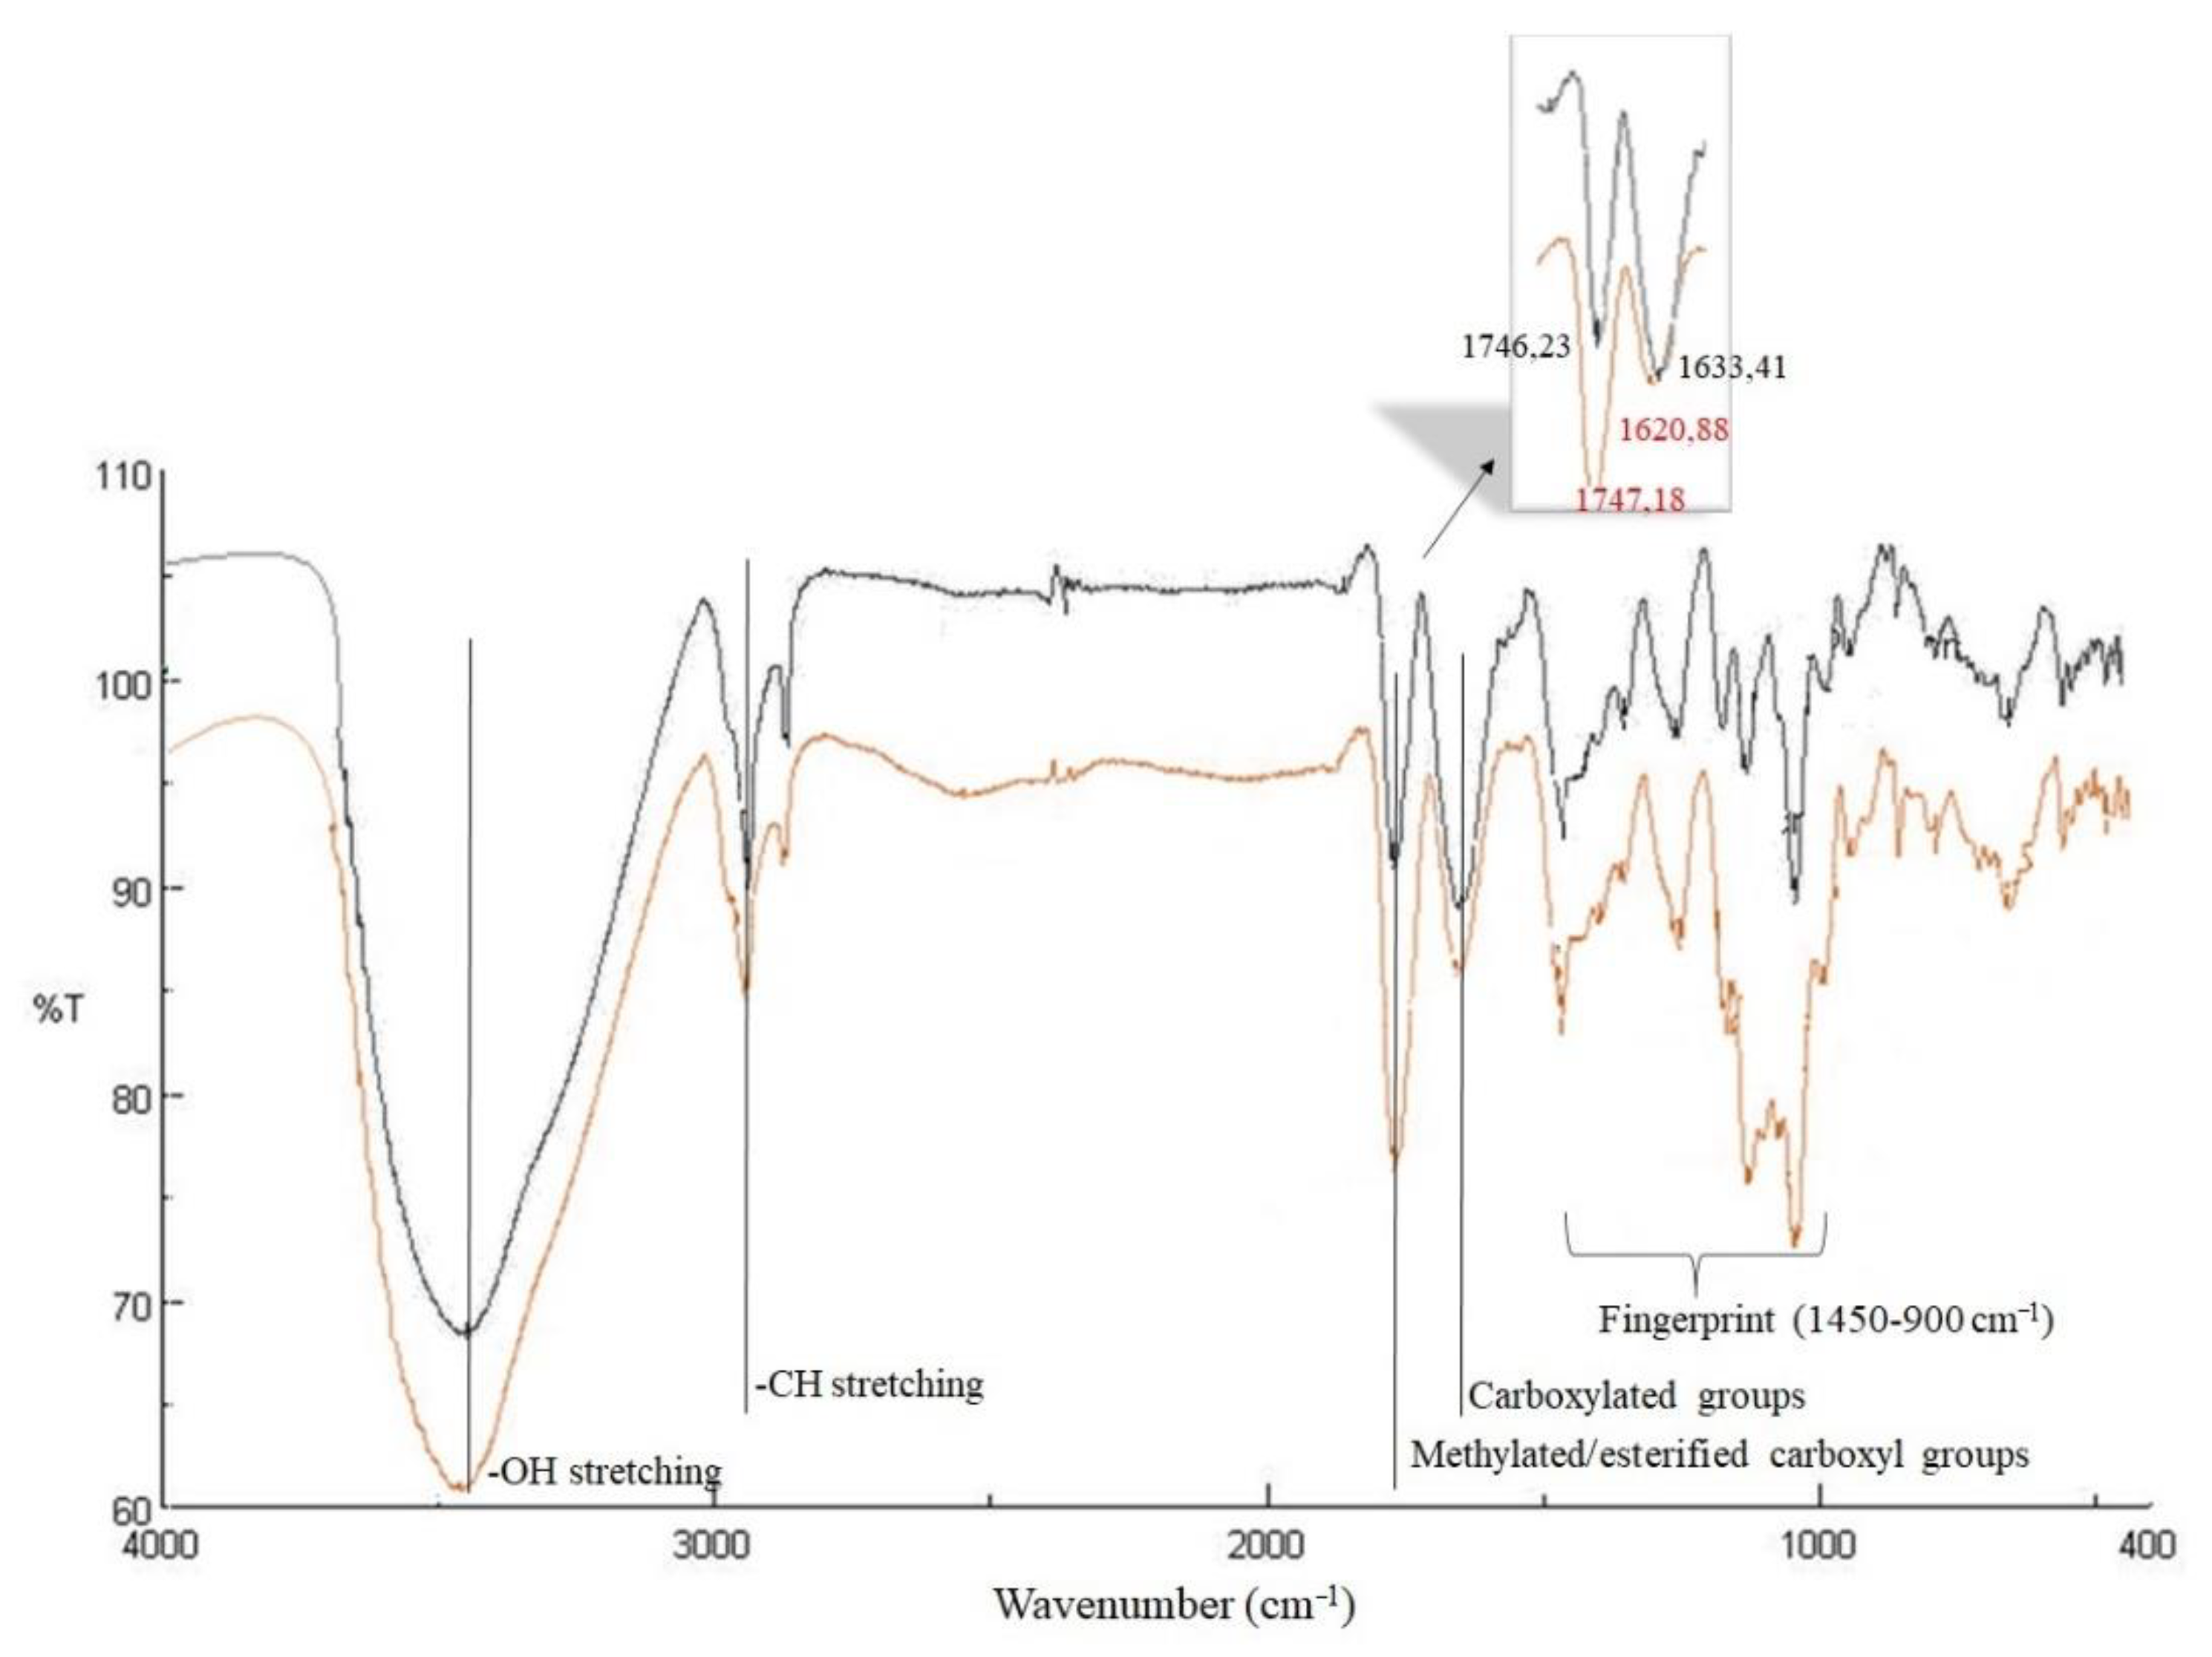
3.7. FT-IR Spectroscopic Analysis of Pectins

The FT-IR spectra of walnut husk pectins from Montalto and Zumpano, scanned at wave numbers ranging from 4000 to 400 cm−1 and corrected against the background spectrum of air, are reported in Figure 5. The qualitative profile of the spectra of the samples from different pedoclimatic areas only showed differences in the absorption intensity of the characterizing bands. The 3600–2500 cm−1 region presented two major peaks: the first one, centred around 3437 cm−1, generated by OH stretching, due to inter- and intra-molecular hydrogen bonding of the galacturonic acid backbone, and the second one, at 2915 cm−1, due to C–H absorption stretching. The 1800–1500 cm−1 region revealed the presence of a first band at 1747–1746 cm−1, generated from ester carbonyl groups stretching, and a second one at 1633–1621 cm−1 due to the carboxylate ion stretching [38]. These bands were very important since it was possible to assess the degree of methoxylation of pectin by considering the corresponding intensities. Moreover, analysis of the spectra showed that in PM pectins (red line), the intensity of the band relating to the ester groups was greater than that relating to the carboxylate groups, whereas in PZ (black line), the intensities of the two bands are reversed. In the “fingerprint region” (1450 to 900 cm−1) [39], Raman bands were evident at 1019–1017 cm−1, generated from COH deformation, at 1103–1106 cm−1 due to C-C stretching and 1041–1040 cm−1 arising from asymmetric COC stretching vibration. The presence of α-glycosidic linkage was highlighted by a weak band at 840 cm−1, generated by the ring vibration of [40].

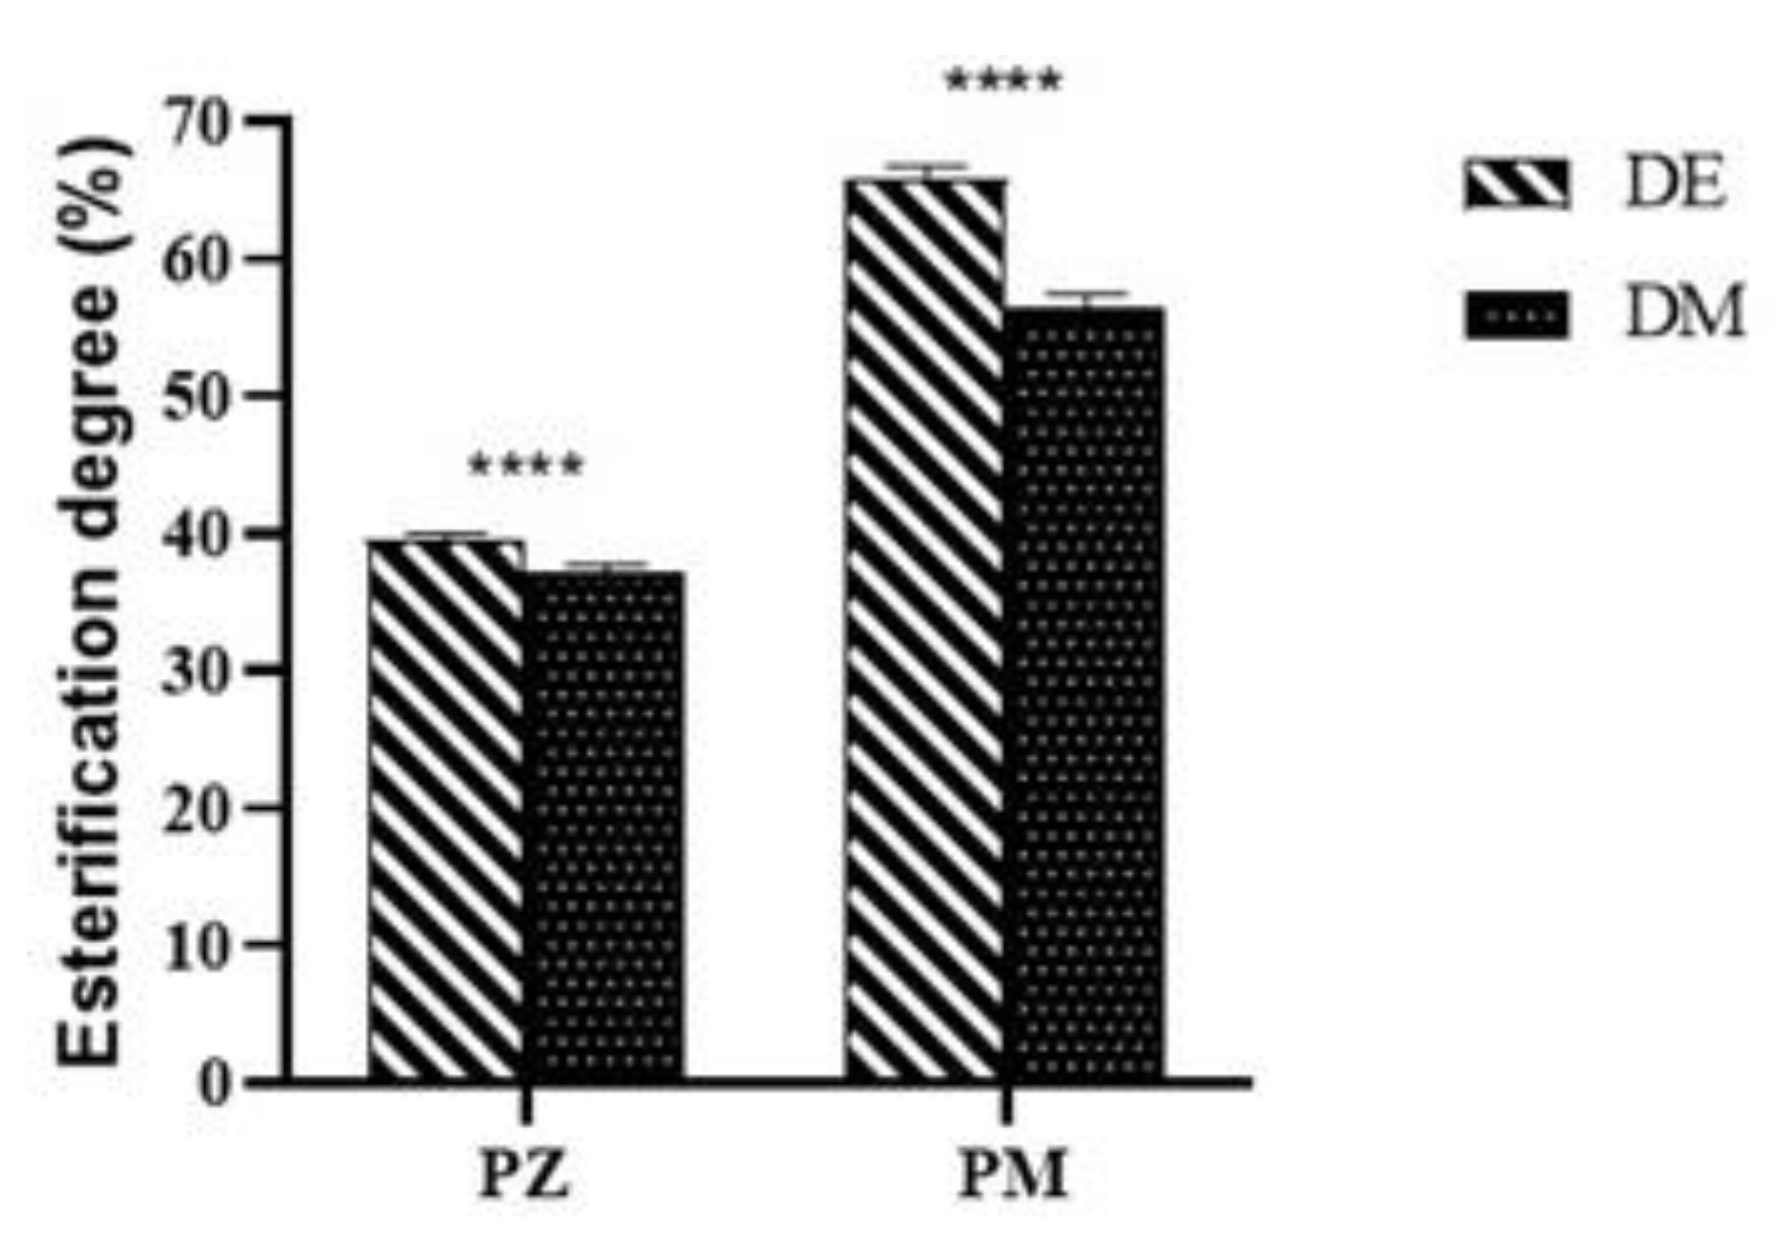
3.8. Determination of Esterification Degree

Pectin is a complex polysaccharide composed of at least five different sugar moieties, with 80–90% of its dry weight being galacturonic acid (GalA). A major percentage of the GalA is present in homogalacturonan (HG) regions of pectin as unbranched chains in which a variable proportion of the GalA contains a methyl ester at the C6 position [41]. The functional properties of pectins in foods, such as gelling capacity, and their reactivity towards calcium and other cations, are largely dependent on the amount of methylated GalA subunits. Thus, degree of methylation (DM) is an important parameter for characterisation of food pectins [42]. DE was used to classify the pectins into high-methoxyl (HM) form, when the esterified group content was higher than 50%, and low-methoxyl (LM) form, if the content was lower than 50%. The esterification degree of PM and PZ was evaluated by titrimetric method and indicated as DE, while DM was the instrumental FTIR value (Figure 6). The analyses on each sample were performed in triplicate by both titrimetric and instrumental methods and the results were reported as means ± standard deviation. The results showed that titrimetric values were slightly higher than those obtained by the instrumental method, and that the esterification degree, regardless of the method used, of pectin from Montalto was significantly higher than that of pectins from Zumpano. The titrimetric percentage values for DE of pectins from Montalto and Zumpano were 65.9 ± 0.8 and 39.4 ± 0.6, respectively, while the corresponding %DM were 56.3 ± 1.1 and 37.2 ± 0.5.

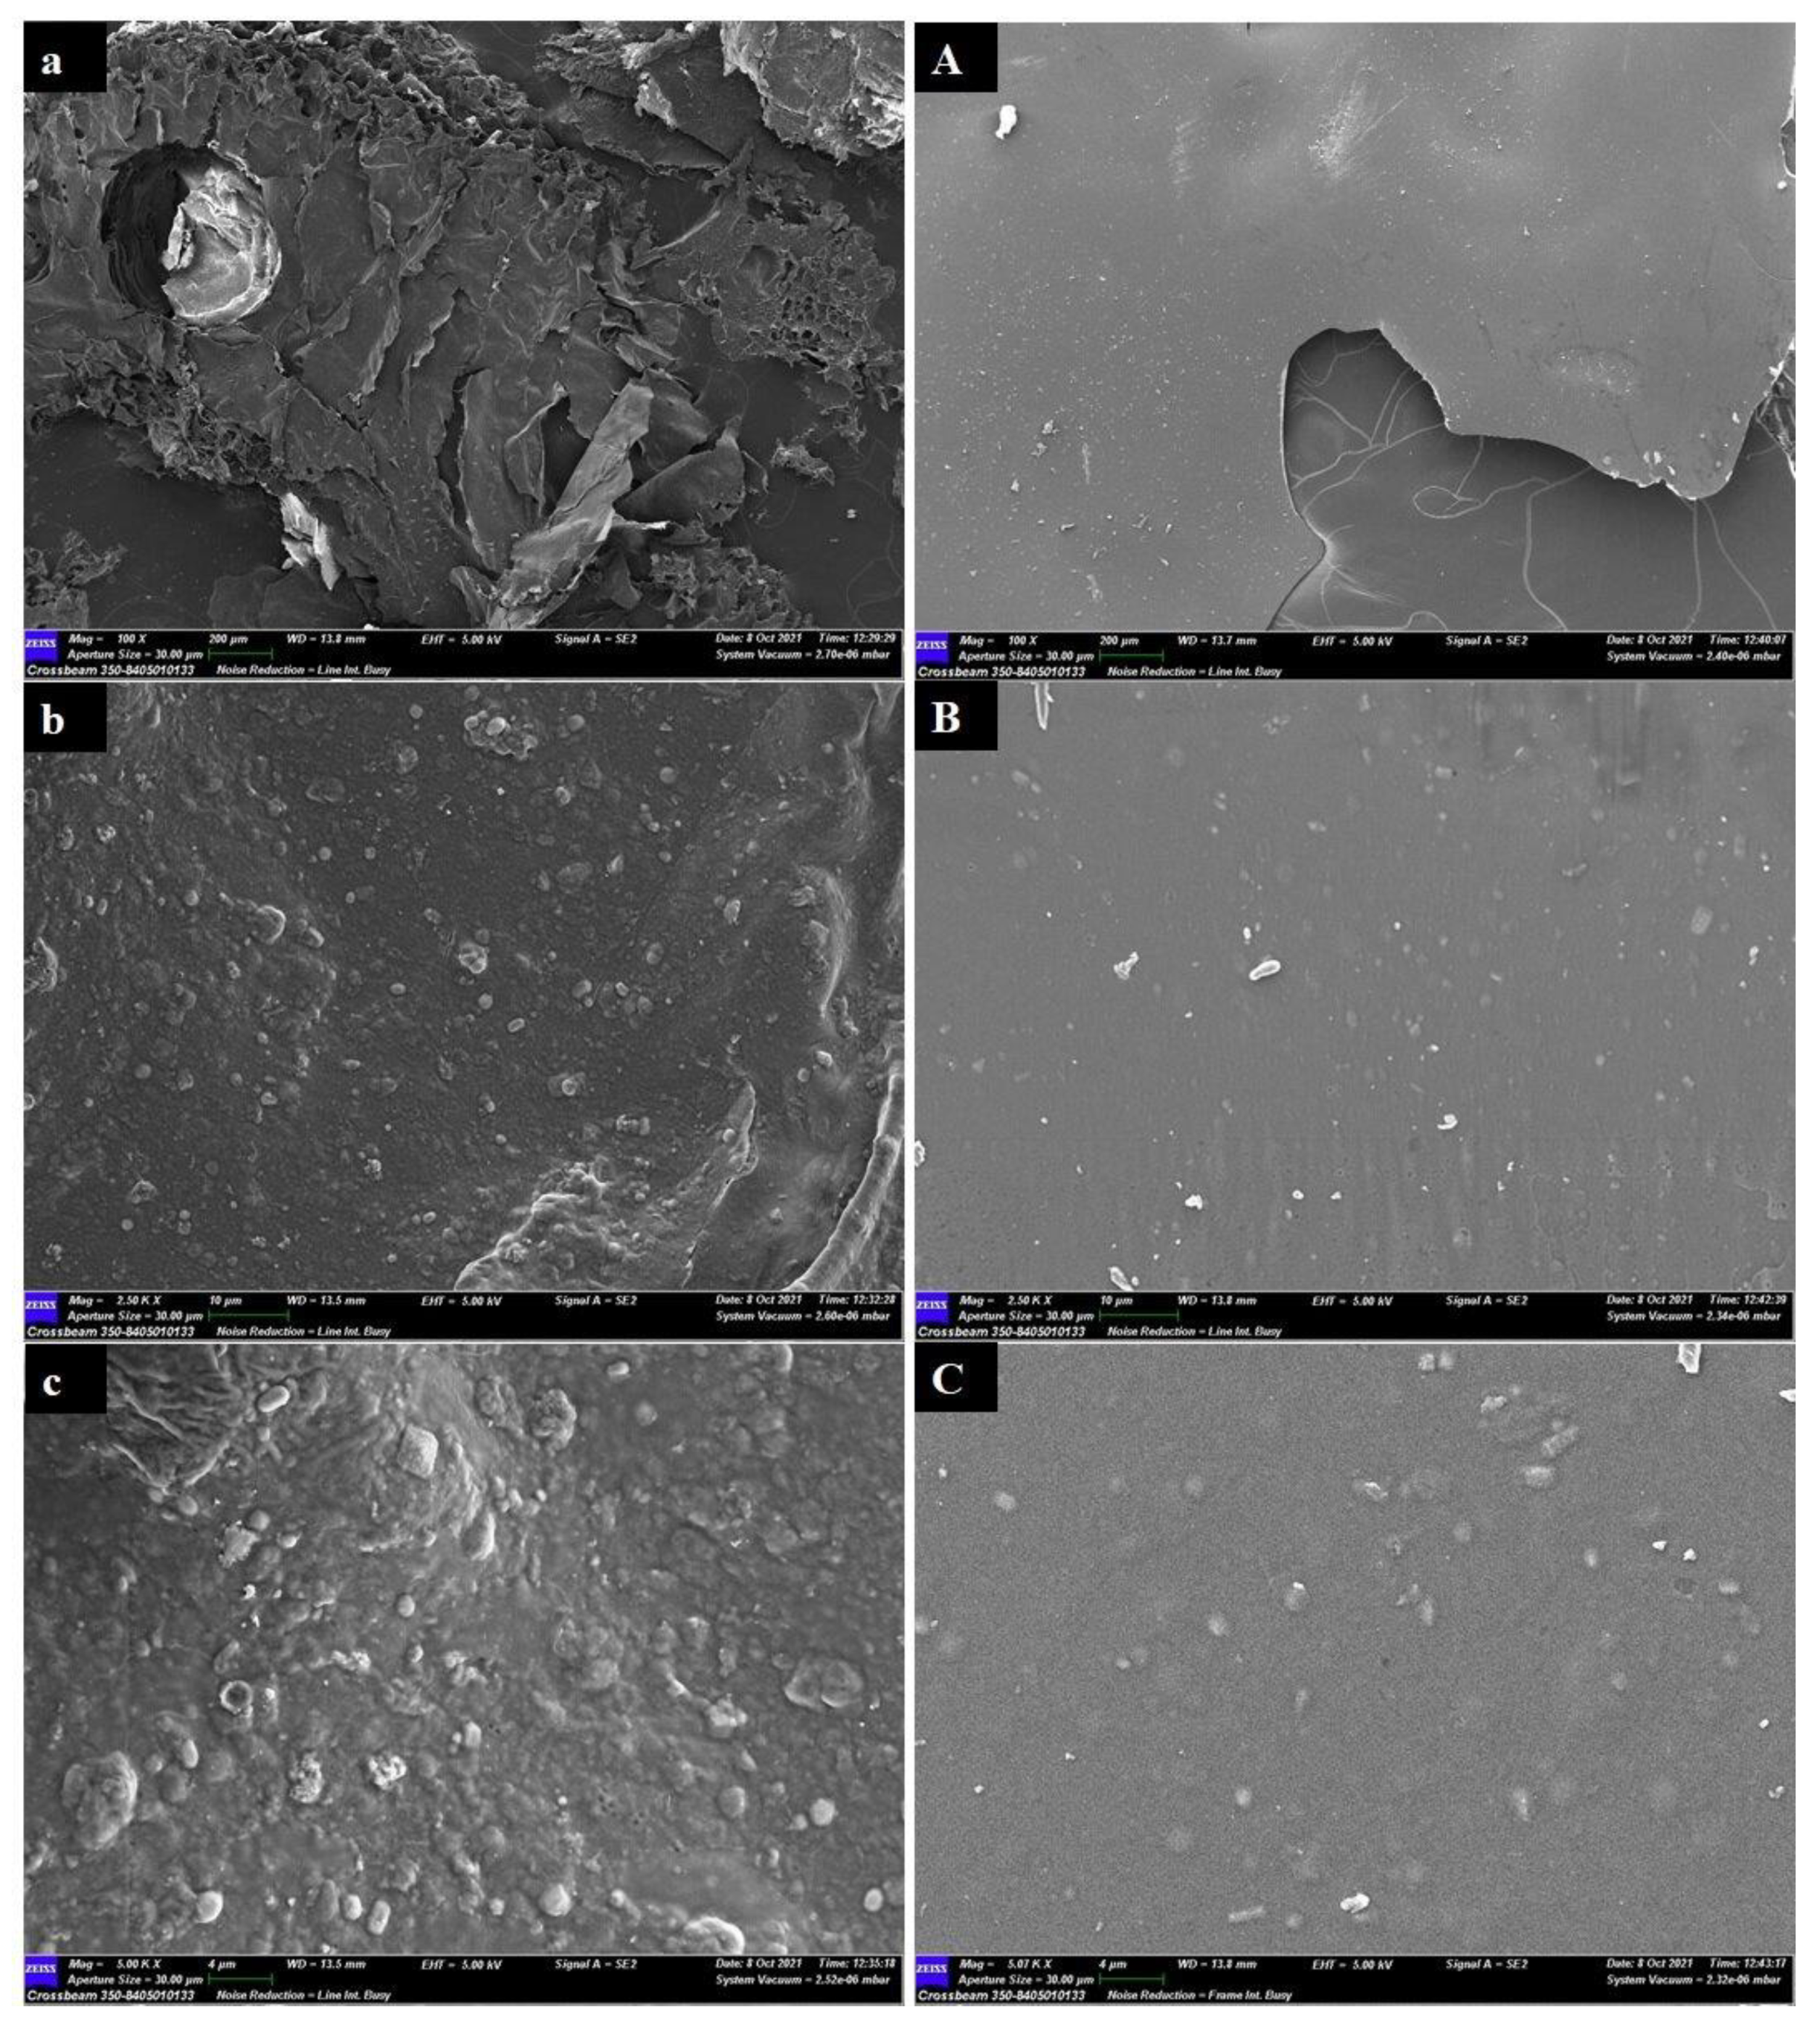
3.9. Scanning Electron Microscopy (SEM) of Pectins

All the pectins were studied for morphological investigation under the same conditions: three magnifications equal to 100×, 2500×, and 5000× with a scale equal to 200, 10, and 4 µm, respectively. SEM images showed different surface structures depending on the pedoclimatic area of provenance of the walnut husks. The surface of PZ showed a leafy appearance and the presence of crystals which were incorporated in a spherical matrix. Filaments with large vesicles were also present (Figure 7a–c).
The surface of PM exhibited a uniform structure, characterized by a very smooth lamellar appearance. This lamella also showed microcrystals incorporated in a matrix (Figure 7A–C).

3.10. Differential Scanning Calorimetry (DSC) of Pectins

The calorimetric curves recorded for the PM (red line) and PZ (black line) were similar, but unlike the calorimetric curves for glucans, they showed two peaks, one of which was endothermic and the other exothermic (Figure 8). Peak one, which was very similar to that observed for glucan calorimetric curves, was endothermic and was located between 130 and 135 °C. It had a higher enthalpy for the PM samples (E = 326.8 J/g) than for the PZ samples (E = 212.4 J/g). Peak two, between 240 and 250 °C, was exothermic, and it showed similar enthalpy values for both samples (E = −90.6 J/g; E = −77.1 J/g).

4. Discussion

Glucans and pectins are nonstarch polysaccharides and fibre components, which possess a broad spectrum of biological activities. Glucans have hypocholesterolemic and hypoglycemic effects but also improve the defence of the immune system and induce defence mechanisms to respond to wounding [20,43,44]. Pectins are applied in the pharmaceutical field to treat human pathologies, such as cancers, liver damage, and inflammations [45]. Husk glucans, occurring in the bran of cereal grains (barley and oats and to a much lesser degree in rye and wheat, in amounts of about 7%, 5%, 2% and less than 1%, respectively) and many kinds of mushrooms, have been researched in order to valorise the waste from nut production. In this context, walnuts with green hulls were harvested from two locations of southern Italy, where walnut trees were widespread. Although the two areas were characterized by similar climatic conditions (annual raining, daily temperature and humidity average), the recovery of glucans was different for the hulls from the two areas. In fact, the glucan content from Montalto was 1.2 times higher than that of GZ, most likely due to the different soil characteristics. The glucan content from both Montalto and Zumpano husks is nevertheless significant compared to that of some cereals such as oat samples (0.71–5.06%) [46], broad bean pods (3.0–4.5%) and pomegranate Akko peels (2.5%) [12,13] The qualitative profile of the IR spectra of both GM and GZ glucans was similar. Furthermore, the observation of the anomeric region did not allow us to distinguish easily between the two glycosidic linkage types of the aldopyranoses. Despite this criticality, the use of the β-glucan assay kit allowed us to determine the α- and β-glucan content in both samples, showing that Montalto husks were richer in β-glucans while Zumpano husks contained α- and β-glucans in equal percentages. However, the β-glucan content in the Montalto husks was 1.75 times of that in Zumpano husks. The morphological investigation highlighted different surface structures for GM and GZ. The surface of GZ showed the presence of aggregates of microcrystals whose dimensions were variable, while the GM surface showed not aggregated microcrystals with a cubic form. The surface morphology of both GM and GZ was different from SEM images of barley and oat glucans [19,47]. Glucans, recovered from other type of biomasses such as Vicia faba L. pods using the same extraction method, showed different morphological surfaces, which exhibited agglomerates with a spongy appearance [13].
Thermal analysis (DSC) confirmed the higher degree of crystallinity of GZ, since the corresponding melting enthalpy value was twice that recorded for the GM sample. Pectins have also been investigated in walnut husks from Montalto and Zumpano for their valorisation, carrying out the extraction under acidic conditions at reflux temperature. The pectin content, as well as that of glucans, was found to be different in the two matrices: recovery of PM was 2.6 times that of PZ, confirming that soil and climate conditions influenced fibre content. It has been reported that extraction of pectins from other types of wastes or by-products, carried out using similar chemical conditions, yielded 5.2–12.2% from banana peels [48], 3.7–7.7% from passionfruit peel [49], 3.9–11.2% from pomegranate peels [50], and 7.3–19.1% pistachio green hull [51]. The percentage yield in PM was higher than that of other food wastes extracted under alkaline conditions such as leek leaves (12 ± 7%), endive roots (22 ± 8%), onion hulls (14 ± 0%), endive leaves (36 ± 8%), pumpkin kernel cake (29 ± 2.13%), tomato skins (29 ± 9.15%), and grape pomace (15 ± 3.07%) [52]. The comparison of our results with these data highlighted that the walnut husks from Montalto were a good source of pectins. Similarly to glucans, pectins were characterized by FTIR spectroscopy, surface morphological analysis (SEM) and thermal characteristics (DSC). In addition, the degree of methoxylation was determined, since it is an important structural factor influencing the functional properties of pectins. The FT-IR spectra of both PM and PZ did not show any significant differences in the characteristic bands of the structure, except for the absorption intensities of the peaks in the 1800–1500 cm−1 region arising from ester carbonyl groups and carboxylate ion stretching. In fact, the IR spectra of PM showed that the intensity of the ester groups was greater than that relating to the carboxylate groups, whereas in PZ spectra the carboxylate ion band was stronger than the ester group band. These spectroscopic differences were reflected in the different degree of methoxylation (DM), calculated on the basis of the areas of the two bands between PM and PZ. The DM of PM was 1.5 times higher than PZ’s. This was confirmed by the titrimetric method (DE), although the values obtained for DE are slightly higher than those obtained for DM. However, regardless of the method used, the esterification degree of PM was significantly higher than that of PZ, and considering that its percentage value (both DM and DE) was higher than 50, it is possible to classify PM as a high-methoxyl pectin, similarly to apple pectin, with a DM of 65.88% [53]. Additionally, pectins extracted from biomass (rind and peels) obtained from fruits with citric acid solution at high temperature, such as melon, kiwifruit, pomegranate and orange, were high-methoxyl pectins, having esterification degrees (DM) of 71.98%, 84.72%, 56.74% and 69.67%, respectively [54]. Morphological analysis of PM and PZ suggested different surface morphologies, exhibiting a very smooth lamellar appearance for PM with little pellets on it, comparable to the morphological characteristics of passion fruit pectin [25]. In contrast, the morphological structures of pectins from melon rind, kiwifruit, pomegranate and orange peels had some microfractures and hollow openings [54].
Calorimetric curves of PM and PZ were similar, showing two main peaks during the thermal analysis, one of which was endothermic and the other exothermic. The parameters associated with the two peaks were melting temperature and enthalpy (Tm and Δm, respectively), and degradation temperature and enthalpy (Td and Δd, respectively). The first endothermic peak between 130 and 150 °C is ascribed to water evaporation: PM and PZ showed little differences for Tm but Δm of PM samples was higher than the PZ samples, which indicated that more energy was needed to absolutely remove water from PM, likely due to higher esterification degree. The second exothermic peak, between 240 and 250 °C, was caused by the degradation of pectin: PM and PZ showed little differences for Td and Δm [55,56]. The above results indicated that geographical and climatic conditions in different regions could lead to significant differences both in the content of bioactive compounds and their morphological and thermal characteristics.

5. Conclusions

The results of the present study suggested that J. regia L. green husks, which represent a waste material, could be a source of glucans and pectins, with a potential use in food, cosmetics and pharmaceutical fields. Walnuts with green husks were collected from two different soil areas of Southern Italy (Montalto and Zumpano) which influenced the content, morphological and thermal characteristics of the extracted glucans and pectins, showing that the higher yields were obtained from the Montalto green husks.
In fact, the glucan content from the Montalto walnut husks was about 1.2 times that of the glucans from the Zumpano husks. In addition, GM were characterized by a prevalence of β-glucans over α-glucans. Morphological analysis of Montalto glucans showed a surface covered by cubic microcrystals, which differed from that of Zumpano ones, characterized by the presence of agglomerates of varying sizes of microcrystals. The morphological characteristic of GZ was confirmed by thermal analysis, which showed a higher degree of crystallinity than GM. Pectin recovery was 2.6 times higher from Montalto husks than from Zumpano ones. Additionally, PM, compared with PZ, showed a higher esterification degree that resulted in a higher Δm needed to remove retained water from the structure. The surface of the PM is lamellar in contrast to that of the PZ, which is leaf-shaped. Both glucans and pectins from Montalto and Zumpano walnut husks will be further studied to investigate how the differences in their chemical and physical characteristics are reflected in their biological activity.

Author Contributions

C.L.T. conducted the experiment; P.C. conducted morphological characterization of glucans and pectins; A.F. projected the work and wrote the manuscript; P.P. revised the work; E.C. facilitated and revised the work. All authors have read and agreed to the published version of the manuscript.

Funding

C.L.T. is supported by MIUR (Ministero Istruzione Università e Ricerca) fellow grant for PhD students in Translational Medicine doctorate at University of Calabria.

Institutional Review Board Statement

Not applicable.

Informed Consent Statement

Not applicable.

Data Availability Statement

The data presented in this study are available on request from the corresponding author.

Conflicts of Interest

The authors declare no conflict of interest.

References

  1. Stampar, F.; Solar, A.; Hudina, M.; Veberic, R.; Colaric, M. Traditional walnut liqueur—Cocktail of phenolics. Food Chem. 2006, 95, 627–631. [Google Scholar] [CrossRef]
  2. Stampar, F.; Solar, A.; Hudina, M.; Veberic, R.; Colaric, M.; Fabcic, J. Phenolics in walnut liqueur. Acta Hortic. 2007, 744, 451–454. [Google Scholar] [CrossRef]
  3. Wichtl, M.; Anton, R. Tradition, pratique officinale, science et thérapeutique. In Plantes Thérapeutiques, 2nd ed.; Tec & Doc–Cachan, Editions Technique et Documentation-Editions Médicales Internationales, Ed.; Librairie Eyrolles: Paris, France, 1999; Volume 1, p. XCVI-692. [Google Scholar]
  4. Croitoru, A.; Ficai, D.; Craciun, L.; Ficai, A.; Andronescu, E. Evaluation and Exploitation of Bioactive Compounds of Walnut, Juglans regia. Curr. Pharm. Des. 2019, 25, 119–131. [Google Scholar] [CrossRef]
  5. Oliveira, I.; Sousa, A.; Ferreira, I.C.F.R.; Bento, A.; Estevinho, L.; Pereira, J.A. Total phenols antioxidant potential and antimicrobial activity of walnut (Juglans regia L.) green husk. Food Chem. Toxicol. 2008, 46, 2326–2331. [Google Scholar] [CrossRef] [PubMed]
  6. Fernández-Agulló, A.; Pereira, E.; Freire, M.S.; Valentão, P.; Andrade, P.B.; González-Álvarez, J.; Pereira, J.A. Influence of solvent on the antioxidant and antimicrobial properties of walnut (Juglans regia L.) green husk extracts. Ind. Crop. Prod. 2013, 42, 126–132. [Google Scholar] [CrossRef]
  7. Ghasemi, K.; Ghasemi, Y.; Ehteshamnia, A.; Nabavi, S.M.; Nabavi, S.F.; Ebrahimzadeh, M.A.; Pourmorad, F. Influence of environmental factors on antioxidante activity, phenol and flavonoids contents of Walnut (Juglans regia L.) green husks. J. Med. Plants Res. 2011, 5, 1128–1133. [Google Scholar]
  8. Beiki, T.; Najafpour, G.D.; Hosseini, M. Evaluation of antimicrobial and dyeing properties of walnut (Juglans regia L.) green husk extract for cosmetics. Color. Technol. 2018, 134, 71–81. [Google Scholar] [CrossRef]
  9. Kiran Aithal, B.; Sunil Kumar, M.; Nageshwar Rao, B.; Udupa, N.; Satish Rao, B. Juglone, a naphthoquinone from walnut, exerts cytotoxic and genotoxic effects against cultured melanoma tumor cells. Cell Biol. Int. 2009, 33, 1039–1049. [Google Scholar] [CrossRef]
  10. Ji, Y.-B.; Qu, Z.Y.; Zou, X. Juglone-induced apoptosis in human gastric cancer SGC-7901 cells via the mitochondrial pathway. Exp. Toxicol. Pathol. 2011, 63, 69–78. [Google Scholar] [CrossRef]
  11. Xu, H.L.; Yu, X.F.; Qu, S.C.; Qu, X.R.; Jiang, Y.F.; Sui, D.Y. Juglone, from Juglans mandshruica Maxim, inhibits growth and induces apoptosis in human leukemia cell HL-60 through a reactive oxygen species-dependent mechanism. Food Chem. Toxicol. 2012, 50, 590–596. [Google Scholar] [CrossRef]
  12. Fazio, A.; Iacopetta, D.; La Torre, C.; Ceramella, J.; Muià, N.; Catalano, A.; Carocci, A.; Sinicropi, M.S. Finding solutions for agricultural wastes: Antioxidant and antitumor properties of pomegranate Akko peel extracts and beta-glucan recovery. Food Funct. 2018, 9, 6619–6632. [Google Scholar] [CrossRef] [PubMed]
  13. Fazio, A.; La Torre, C.; Dalena, F.; Plastina, P. Screening of glucan and pectin contents in broad bean (Vicia faba L.) pods during maturation. Eur. Food Res. Technol. 2020, 246, 333–347. [Google Scholar] [CrossRef]
  14. Arias, D.; Rodriguez, J.; Lopez, B.; Mendez, P. Evaluation of the physicochemical properties of pectin extracted from Musa paradisiaca banana peels at different pH conditions in the formation of nanoparticles. Heliyon 2021, 7, E06059. [Google Scholar] [CrossRef]
  15. Manasa, V.; Padmanabhan, A.; Appaiah, K.A.A. Utilization of coffee pulp waste for rapid recovery of pectin and polyphenols for sustainable material recycle. Waste Manag. 2021, 120, 762–771. [Google Scholar] [CrossRef]
  16. Mellinas, C.; Ramos, M.; Jimenez, A.; Garrigos, M.C. Recent Trends in the Use of Pectin from Agro-Waste Residues as a Natural-Based Biopolymer for Food Packaging Applications. Materials 2020, 13, 673. [Google Scholar] [CrossRef] [PubMed] [Green Version]
  17. McCleary, B.V.; Draga, A. Measurement of β-glucan in mushrooms and mycelial products. J. AOAC Int. 2016, 99, 364–373. [Google Scholar] [CrossRef] [Green Version]
  18. Temelli, F. Extraction and functional properties of barley β-glucan as affected by temperature and pH. J. Food Sci. 1997, 62, 1194–1201. [Google Scholar] [CrossRef]
  19. Limberger-Bayer, V.M.; de Francisco, A.; Chan, A.; Oro, T.; Ogliaru, P.J.; Barreto, P.L.M. Barley β-glucans extraction and partial characterization. Food Chem. 2014, 154, 84–89. [Google Scholar] [CrossRef] [Green Version]
  20. Fazio, A.; La Torre, C.; Caroleo, M.C.; Caputo, P.; Plastina, P.; Cione, E. Isolation and Purification of Glucans from an Italian Cultivar of Ziziphus jujuba Mill. and In Vitro Effect on Skin Repair. Molecules 2020, 25, 968. [Google Scholar] [CrossRef] [Green Version]
  21. Nie, S.; Cui, S.W.; Xie, M.; Phillips, A.O.; Phillips, G.O. Bioactive polysaccharides from Cordyceps sinensis: Isolation, structure features and bioactivitie. Bioact. Carbohydr. Diet. Fibre 2013, 1, 38–52. [Google Scholar] [CrossRef]
  22. Yalcin, E.; Çelik, S. Solubility properties of barley flour, protein isolates and hydrolysates. Food Chem. 2007, 104, 1641–1647. [Google Scholar] [CrossRef]
  23. Bilgi, B.; Çelik, S. Solubility and emulsifying properties of barley protein concentrate. Eur. Food Res. Technol. 2004, 218, 437–441. [Google Scholar] [CrossRef]
  24. Fazio, A.; La Torre, C.; Caroleo, M.C.; Caputo, P.; Cannataro, R.; Plastina, P.; Cione, E. Effect of addition of pectins from jujubes (Ziziphus jujuba Mill.) on vitamin C production during heterolactic fermentation. Molecules 2020, 25, 2706. [Google Scholar] [CrossRef]
  25. Rajia, Z.; Khodaiyana, F.; Rezaei, K.; Kiania, H.; Hosseini, S.S. Extraction optimization and physicochemical properties of pectin from melon peel. Int. J. Biol. Macromol. 2017, 98, 709–716. [Google Scholar] [CrossRef] [PubMed]
  26. Liew, S.Q.; Chin, N.L.; Yusof, Y.A. Extraction and characterization of pectin from passion fruit peels. Agric. Agric. Sci. Procedia 2014, 2, 231–236. [Google Scholar] [CrossRef] [Green Version]
  27. Bashir, K.M.I.; Choi, J.S. Clinical and physiological perspectives of beta-glucans: The past, present, and future. Int. J. Mol. Sci. 2017, 18, 1906. [Google Scholar] [CrossRef]
  28. Du, B.; Zhu, F.; Xu, B. β-Glucan extraction from bran of hull-less barley by accelerated solvent extraction combined with response surface methodology. J. Cereal Sci. 2014, 59, 95–100. [Google Scholar] [CrossRef]
  29. Yang, L.; Sun, X.W.; Yang, F.J.; Zhao, C.J.; Zhang, L.; Zu, Y.G. Application of ionic liquids in the microwave-assisted extraction of proanthocyanidins from Larix gmelini Bark. Int. J. Mol. Sci. 2012, 13, 5163–5178. [Google Scholar] [CrossRef] [Green Version]
  30. Palanisamy, M.; Aldars-García, L.; Gil-Ramírez, A.; Ruiz-Rodríguez, A.; Marín, F.R.; Reglero, G.; Soler Rivas, C. Pressurized water extraction of β-glucan enriched fractions with bile acids-binding capacities obtained from edible mushrooms. Biotechnol. Prog. 2014, 30, 391–400. [Google Scholar] [CrossRef] [Green Version]
  31. Wang, Y.; Ahmed, Z.; Feng, W.; Li, C.; Song, S. Physicochemical properties of exopolysaccharide produced by Lactobacillus kefiranofaciens ZW3 isolated from Tibet kefir. Int. J. Biol. Macromol. 2008, 43, 283–288. [Google Scholar] [CrossRef]
  32. Ahmad, A.; Anjum, F.M.; Zahoor, T.; Nawaz, H.; Ahmed, Z. Extraction and characterization of β-D-glucan from oat for industrial utilization. Int. J. Biol. Macromol. 2010, 46, 304–309. [Google Scholar] [CrossRef]
  33. Kačuraková, M.; Capeka, P.; Sasinková, V.; Wellnerb, N.; Ebringerová, A. FT-IR study of plant cell wall model compounds: Pectic polysaccharides and hemicelluloses. Carbohydr. Polym. 2000, 43, 195–203. [Google Scholar] [CrossRef]
  34. Hutchinson, J.M. Studying the Glass Transition by DSC and TMDSC. J. Therm. Anal. Calorim. 2003, 72, 619–629. [Google Scholar] [CrossRef]
  35. Cui, J.; Zhao, C.; Feng, L.; Han, Y.; Du, H.; Xiao, H.; Zheng, J. Pectins from fruits: Relationships between extraction methods, structural characteristics, and functional properties. Trends Food Sci. Technol. 2021, 110, 39–54. [Google Scholar] [CrossRef]
  36. Liew, S.Q.; Teoh, W.H.; Yusoff, R.; Ngoh, G. Comparisons of process intensifying methods in the extraction of pectin from pomelo peel. Chem. Eng. Process. -Process. Intensif. 2019, 143, 107586. [Google Scholar] [CrossRef]
  37. Pinheiro, E.R.; Silva, I.M.D.A.; Gonzaga, L.V.; Amante, E.R.; Teófilo, R.F.; Ferreira, M.M.C.; Amboni, R.D.M.C. Optimization of extraction of high-ester pectin from passion fruit peel (Passiflora edulis Flavicarpa) with citric acid by using response surface methodology. Bioresour. Technol. 2008, 99, 5561–5566. [Google Scholar] [CrossRef] [PubMed]
  38. Szymanska-Chargot, M.; Zdunek, A. Use of FT-IR spectra and PCA to the bulk characterization of cell wall residues of fruits and vegetables along a fraction process. Food Biophys. 2013, 8, 29–42. [Google Scholar] [CrossRef] [PubMed] [Green Version]
  39. Li, Q.; Xu, R.; Fang, Q.; Yuan, Y.; Cao, J.; Jiang, W. Analyses of microstructure and cell wall polysaccharides of flesh tissues provide insights into cultivar difference in mealy patterns developed in apple fruit. Food Chem. 2020, 321, 126707. [Google Scholar] [CrossRef]
  40. Chylińska, M.; Szymanska-Chargot, M.; Zdunek, A. FT-IR and FT-Raman characterization of non-cellulosic polysaccharides fractions isolated from plant cell wall. Carbohydr. Polym. 2016, 154, 48–54. [Google Scholar] [CrossRef]
  41. Ridley, B.L.; O’Neill, M.A.; Mohnen, D. Pectins: Structure, biosynthesis, and oligogalacturonide-related signaling. PhytoChem. 2001, 57, 929–967. [Google Scholar] [CrossRef]
  42. Fissore, E.N.; Rojas, A.M.; Gerschenson, L.N.; Williams, P.A. Butternut and beetroot pectins: Characterization and functional properties. Food Hydrocoll. 2013, 31, 172–182. [Google Scholar] [CrossRef]
  43. Rondanelli, M.; Opizzi, A.; Monteferrario, F. The biological activity of beta-glucans. Minerva Med. 2009, 100, 237–245. [Google Scholar] [PubMed]
  44. Shahrahmania, N.; Akbarib, S.A.A.; Mojabc, F.; Mirzaid, M.; Shahrahmania, H. The effect of Zizyphus Jujube Fruit Lotion on Breast Fissure in Breastfeeding Women. Iran. J. Pharm. Res. 2018, 17, 101–109. [Google Scholar]
  45. Naqash, F.; Masoodi, F.A.; Rather, S.A.; Wani, S.M.; Gani, A. Emerging concepts in the nutraceutical and functional properties of pectin-A Review. Carbohydr. Polym. 2017, 168, 227–239. [Google Scholar] [CrossRef]
  46. Shen, R.L.; Liu, X.Y.; Dong, J.L.; Si, J.L.; Li, H. The gel properties and microstructure of the mixture of oat β-glucan/soy protein isolates. Food Hydroll. 2015, 47, 108–114. [Google Scholar] [CrossRef]
  47. Wang, Y.X.; Li, L.Y.; Zhang, T.; Wang, J.Q.; Huang, X.J.; Hu, J.L.; Yin, J.Y.; Nie, S.P. Fractionation, physicochemical and structural characterization of polysaccharides from barley water-soluble fiber. Food Hydrocoll. 2021, 113, 106539. [Google Scholar] [CrossRef]
  48. Oliveira, T.I.S.; Rosa, M.F.; Cavalcante, F.L.; Pereira, P.H.F.; Moates, G.K.; Wellner, N.; Mazzetto, S.E.; Waldron, K.W.; Azeredo, H.M.C. Optimization of pectin extraction from banana peels with citric acid by using response surface methodology. Food Chem. 2016, 198, 113–118. [Google Scholar] [CrossRef]
  49. Liew, S.Q.; Chin, N.L.; Yusof, Y.A.; Sowndhararajan, K. Comparison of acidic and enzymatic pectin extraction from passion fruit peels and its gel properties. J. Food Process. Eng. 2016, 39, 501–511. [Google Scholar] [CrossRef]
  50. Pereira, P.H.F.; Oliveira, T.I.S.; Rosa, M.F.; Cavalcante, F.L.; Moates, G.K.; Wellner, N.; Moates, G.K.; Wellner, N.; Walder, K.W.; Azeredo, H.M.C. Pectin extraction from pomegranate peels with citric acid. Int. J. Biol. Macromol. 2016, 88, 373–379. [Google Scholar] [CrossRef]
  51. Chaharbaghi, E.; Khodaiyan, F.; Hosseini, S.S. Optimization of pectin extraction from pistachio green hull as a new source. Carbohydr. Polym. 2017, 173, 107–113. [Google Scholar] [CrossRef] [PubMed]
  52. Müller-Maatsch, J.; Bencivenni, M.; Caligiani, A.; Tedeschi, T.; Bruggeman, G.; Bosch, M.; Petrusan, J.; Van Droogenbroeck, B.; Elst, K.; Sforza, S. Pectin content and composition from different food waste streams. Food Chem. 2016, 201, 37–45. [Google Scholar] [CrossRef] [PubMed] [Green Version]
  53. Naqash, F.; Masoodi, F.A.; Gani, A.; Nazir, S.; Jhan, F. Pectin recovery from apple pomace: Physico-chemical and functional variation based on methyl-esterification. Int. J. Food Sci. Technol. 2021, 9, 669–4679. [Google Scholar] [CrossRef]
  54. Güzela, M; Akpınar, O. Valorisation of fruit by-products: Production characterization of pectins from fruit peels. Food Bioprod. Process. 2019, 115, 126–133. [Google Scholar] [CrossRef]
  55. Einhorn-Stoll, U.; Kunzek, H.; Dongowski, G. Thermal analysis of chemically and mechanically modified pectins. Food Hydrocoll. 2007, 21, 1101–1112. [Google Scholar] [CrossRef]
  56. Wang, X.; Chen, Q.; Lü, X. Pectin extracted from apple pomace and citrus peel by subcritical water. Food Hydrocoll. 2014, 38, 129–137. [Google Scholar] [CrossRef]
Figure 1. Walnut fruits with green hulls (Juglans regia L.).
Fermentation 07 00305 g001
Figure 2. FTIR spectra in the 400 to 4000 cm−1 region of walnut husk glucans from Montalto (red line) and from Zumpano (black line).
Fermentation 07 00305 g002
Figure 3. Scanning electron images of glucans from Zumpano (GZ, a–d) and Montalto (GM, (A–D)) (at four different magnifications and scales. (a,A) (100×, 200 µm); (b,B) (2500×, 10 μm); (c,C) (5000×, 4 μm); (d,D) (10,000×, 2 μm).
Fermentation 07 00305 g003
Figure 4. DSC records of walnut husks’ glucans from Montalto (red line) and from Zumpano (blackline).
Fermentation 07 00305 g004
Figure 5. FTIR spectra in the 400 to 4000 cm−1 region of walnut husk pectins from Montalto (red line) and from Zumpano (black line).
Fermentation 07 00305 g005
Figure 6. Effects of the two pedoclimatic areas (M and Z) on esterification degree of walnut husks’ pectins (P) evaluated by titrimetric method (DE) and instrumental methods (DM). Error bars indicated standard deviation (n = 3). Asterisks on the dashes indicate significant differences among the two methods used for esterification degree evaluation of pectins from the same agroclimatic area (**** p < 0.0001).
Fermentation 07 00305 g006
Figure 7. Scanning electron images of pectins from Zumpano (PZ, (ac)) and Montalto (PM, (AC)) at three different magnifications and scales. (a,A) (100×, 200 µm); (b,B) (2500×, 10 μm); (c,C) (5000×, 4 μm).
Fermentation 07 00305 g007
Figure 8. DSC records of walnut husks’ pectins from Zumpano (red line) and from Montalto (black line).
Fermentation 07 00305 g008
Table 1. Geographical and climatic conditions of the two gathering areas.
Collection PlaceLatitudeLongitudeAltitude
(m)
Annual Raining Average
(mm)
DailyTemperature
Average (°C)
Humidity
Average (%)
Montalto39°24′20″88 N16°9′31″68 E49020–11010–2085
Zumpano39°18′42″84 N16°17′34″44 E42912.7–101.63.9–27.875
Table 2. Recovered glucans (g/100 g DM) and total α- and β-glucans (%).
SamplesRecovered Glucans
(g/100 g DM)
Total Glucans
(%)
α-Glucans
(%)
β-Glucans
(%)
Montalto husk4.6 ± 0.211.3 ± 0.75.0 ± 0.26.3 ± 0.4
Zumpano husk3.74 ± 0.37.2 ± 0.43.6 ± 0.33.6 ± 0.5
Publisher’s Note: MDPI stays neutral with regard to jurisdictional claims in published maps and institutional affiliations.

