Article

Dynamics of Saccharomyces cerevisiae Strains Isolated from Vine Bark in Vineyard: Influence of Plant Age and Strain Presence during Grape must Spontaneous Fermentations

1
Department of Agronomy Food Natural Resources Animals and Environment (DAFNAE), University of Padova, Viale dell’Università, 16, 35020 Legnaro, PD, Italy
2
Interdepartmental Centre for Research in Viticulture and Enology (CIRVE), University of Padova, Via XXVIII Aprile, 14, 31015 Conegliano, TV, Italy
3
Veneto Agricoltura, Istituto per la Qualità e le Tecnologie Agroalimentari, Via S. Gaetano, 74, 36016 Thiene, VI, Italia
*
Author to whom correspondence should be addressed.
Fermentation 2019, 5(3), 62; https://doi.org/10.3390/fermentation5030062
Submission received: 15 June 2019 / Revised: 3 July 2019 / Accepted: 6 July 2019 / Published: 9 July 2019

Abstract

:
In this study, two vineyards of different age were chosen. During three years, a sampling campaign was performed for isolating vineyard-associated Saccharomyces cerevisiae (S. cerevisiae) strains. Bark portions and, when present, grape bunches were regularly collected from the same vine plants during the overall sampling period. Each bark portion was added to a synthetic must, while each grape bunch was manually crushed, and fermentations were run to isolate S. cerevisiae strains. All collected yeasts were identified at different species and strain levels to evaluate the genetic variability of S. cerevisiae strains in the two vineyards and strains dynamics. Moreover, bark-associated strains were compared with those isolated from spontaneous fermentations of grapes collected during the two harvests. Regarding the youngest vineyard, no S. cerevisiae was identified on bark and grape surface, highlighting the importance of vine age on yeast colonization. Results reported the isolation of S. cerevisiae from vine bark of the old vineyard at all sampling times, regardless of the presence of the grape bunch. Therefore, this environment can be considered an alternative ecological niche that permanently hosts S. cerevisiae. Bark-associated strains were not found on grape bunches and during pilot-scale vinifications, indicating no significative strain transfer from vine bark to the grape must. Commercial starters were identified as well both in vineyards and during vinifications.

Graphical Abstract

1. Introduction

Saccharomycescerevisiae (S. cerevisiae) is the main agent of alcoholic fermentation and it is widely used as a starter in several fermentation processes (wine, beer, and bread). During alcoholic fermentation of a grape must, S. cerevisiae becomes the dominant species mainly as the ethanol concentration increases [1]. Therefore, isolation of natural S. cerevisiae is generally carried out from spontaneous must fermentations [2,3,4,5,6,7] suggesting, in the past, the idea that S. cerevisiae is frequent on grapes. However, the use of direct isolation techniques reveals that Saccharomyces is absent or a rare contaminant of grapes [8]. When being present on grapes, S. cerevisiae occurs at concentrations lower than 10–100 CFU/g [9] and the cells number never exceeds 10 CFU/cm2 of grape berries [10]. Recently, Taylor et al. [11], by means of meta-barcode DNA sequencing, stated that Saccharomyces sp. comprises less than 0.00005% of the fungal community on ripe grapes in vineyards. For these reasons, the vineyard seems not to be the primary source for this yeast. Several studies, indeed, reported the diffusion of this species in other natural environments such as other fruits [12,13], insects [14], oak fluxes, or soil associated with oak and other broad-leafed trees [13,15,16,17,18,19,20]. These findings strengthen the idea that the vineyard is a “transient” environment where S. cerevisiae presence is mainly associated to grape berry ripening. Habitats other than fruit may represent a refuge when fruit is not available [21]. Regarding S. cerevisiae–grape berry association, yeast density and diversity on grapes vary depending on grape variety and maturation stage, vintage, age of the vineyard and soil type, geographical location of the vineyard, climatic conditions (including temperature and rainfall), diseases, insect pests, and viticultural practices applied to the vineyard [5,8,22,23,24,25]. Data indicate that yeast populations on grapes increase from 102–103 CFU/g on immature berries to 103–106 CFU/g on mature ones [22]. Although very low, the frequency of S. cerevisiae on grapes in vineyards varies between plants, bunches, and berries coming from the same vineyard and it depends on the grapevine cultivar and pesticide treatments [24].
Goddard et al. [26] sampled soil, bark, and flowers from Matua Valley (Auckland) vineyard and identified 122 colonies of S. cerevisiae, with 22 different genotypes (2 from vine bark, 2 from buttercup flowers, and 18 from soil) evidencing for the first time the presence of S. cerevisiae on vine bark. The vine bark is a very interesting environment as it is present during all the year and for the entire life of the vine plant. Therefore, it could be a potential niche to host S. cerevisiae during the period when grape bunches are not present.
In order to investigate the role of vine bark on the diffusion and permanence of S. cerevisiae in the vineyard, we monitored strains presence on this part of the vine plant and grape bunches during three consecutive vintages. To assess the importance of vine bark as an S. cerevisiae strain reservoir, bark portion samples were also collected in the period when grape bunches were not present. We chose two vineyards of different ages to evaluate how the presence of S. cerevisiae could change in young and old plants. Moreover, pilot-scale vinifications were run at two harvests to investigate how the presence of bark strains influence strains dynamics during spontaneous fermentation. Finally, the relationship between the two ecological niches (bark and grape bunch), in terms of strains distribution, was evaluated.

2. Results and Discussion

2.1. Presence of S. cerevisiae Strains on Grape Bunches and Vine Bark Portions at Harvest Time

To evaluate if S. cerevisiae could colonize different parts of the vine plants, we collected bark portions and grape bunches at harvest time 1 (H1). In this condition, we also investigated whether these two ecological niches were connected and able to share their respective strain pools. Two vineyards (young vineyard (YV, three-year-old) and old vineyard (OV, eight-year-old)) were considered in order to evaluate the effect of the plant age on the presence and abundance of S. cerevisiae strains. In both vineyards, a total of 20 vine plants chosen from two different rows (10 plants from each row) were analyzed. To evaluate the effect of the plant position, results from each row were shown separately.
Form each plant, a grape bunch was collected (a total of 40) and single-bunch fermentations were run by separately crushing each cluster. Moreover, from each plant, bark portions were collected and each sample was added to a synthetic must as a fermentation starter. In both sets of experiments, the fermentation was used to enrich S. cerevisiae concentration that is known to be very low in vineyards [9]. Plate isolation was performed to recover S. cerevisiae isolates when the CO2 produced during the fermentation was about 3–4 g per 100 g of grape or per 100 mL of synthetic must. At this stage, corresponding to ethanol content above 4.5%–5%, naturally present non-Saccharomyces yeasts declined to give way to ethanol-tolerant yeasts such as S. cerevisiae [27]. After 940 h, fermentations were stopped and total CO2 production was recorded. The average CO2 productions measured for grape samples were always significantly higher than those from bark samples, regardless of plants age (Figure 1).
In the YV, the variability of total CO2 production levels measured for each vine row was very limited (Figure 1).
In grape samples, the boxplot distribution showed that the interquartile range was between 5.3 to 7.8 g/100 g of grape, while in bark fermentations it was between 0.2 and 1.5 g/100 g of grape. The results suggested a limited presence of S. cerevisiae in the analyzed samples, and regarding barks the absence of fermenting yeasts. When yeast isolates were analyzed, none of them were identified as S. cerevisiae.
On the contrary, the OV showed rather vigorous fermentations (Supplementary Materials, Figure S1) with high levels of CO2 production. In single-bunch fermentations, although the CO2 levels were promising (the interquartile range was between 7.5 and 9.9 g/100 g of grape), only two samples revealed the presence of S. cerevisiae. Strain G2.2 was isolated from plant 2: 13 out of 42 isolates analyzed belonged to S. cerevisiae species and all showed the same genotype. From plant 5, a single strain was obtained. When its genetic profile was compared with those of the commercial strains used in the wineries of the Prosecco area, it overlapped with strain Lalvin DV10. This yeast was already isolated in the same area during previous grape sampling campaigns, confirming dissemination of commercial strains from the cellar to the vineyard [7]. In bark fermentations, the CO2 production was highly variable (particularly in the vine row including plants 11–20). Six samples collected from plants 6, 10, 11, 13, 14, and 18 reached about 9 g/100 mL of synthetic must (Supplementary Materials, Figure S2). In bark fermentations, the genetic analysis revealed that only samples collected from plants 6, 10, 11, 13, and 14 producing a high CO2 level contained S. cerevisiae (Table 1).
By mtDNA analysis, seven strains were found in total. Only from two bark samples (plants 11 and 14), two strains were isolated from each fermentation. Results suggested that plant age strongly influenced S. cerevisiae presence. The OV had a different cordon structure, which is thicker and more robust than the YV. Due to the more complex structure, the OV seemed to constitute a better habitat for fermenting yeasts than the YV. The absence of S. cerevisiae on young vine plants was previously documented, although only grape bunches were analyzed at that time [28]. In the OV, bark revealed higher S. cerevisiae presence and strains variability than grape bunch. Moreover, although the presence of S. cerevisiae was very limited, strains of bark origin were not isolated on grape bunches.

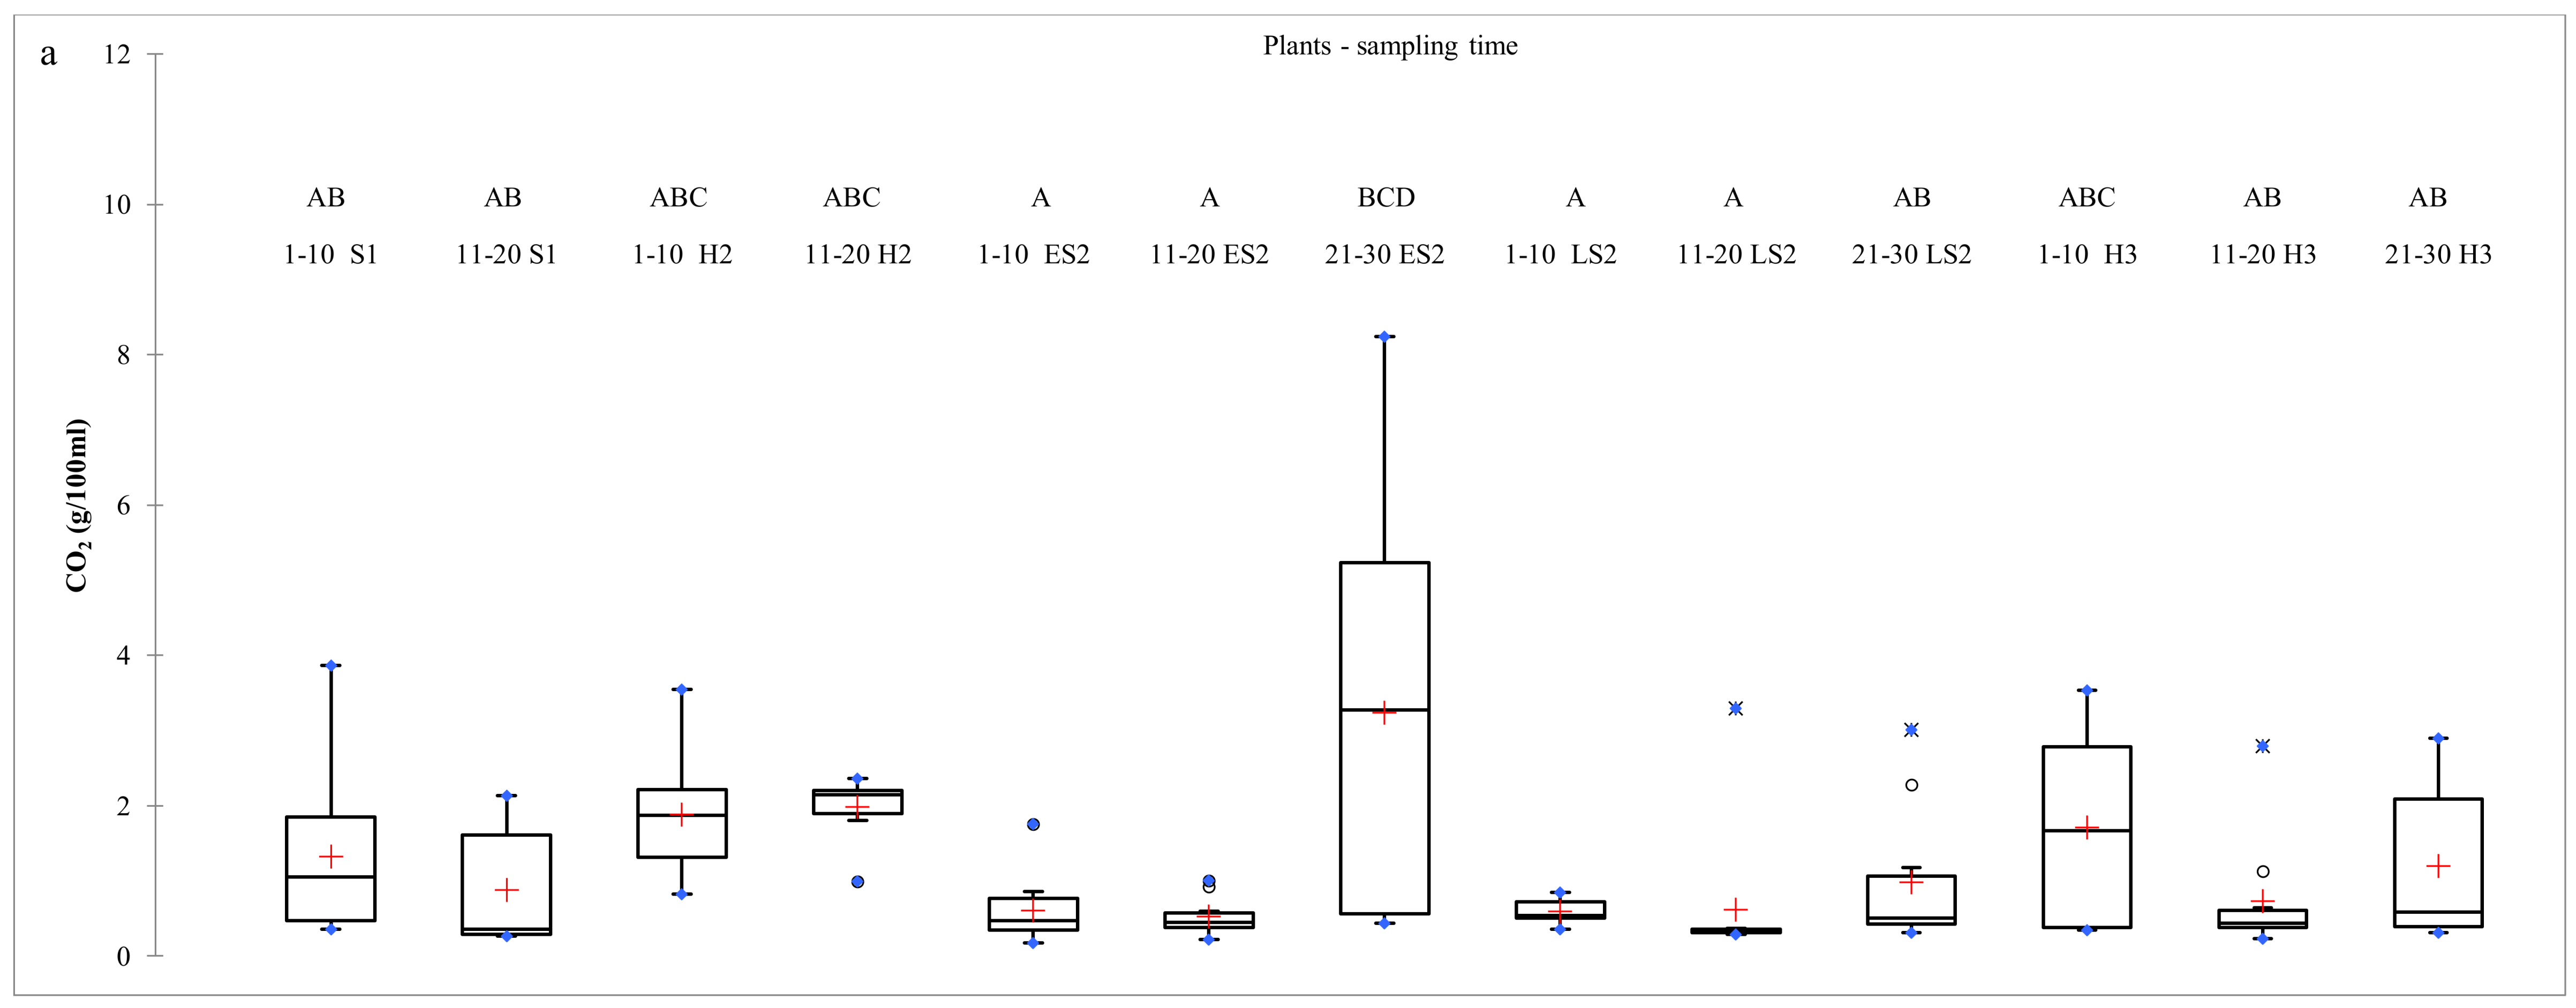
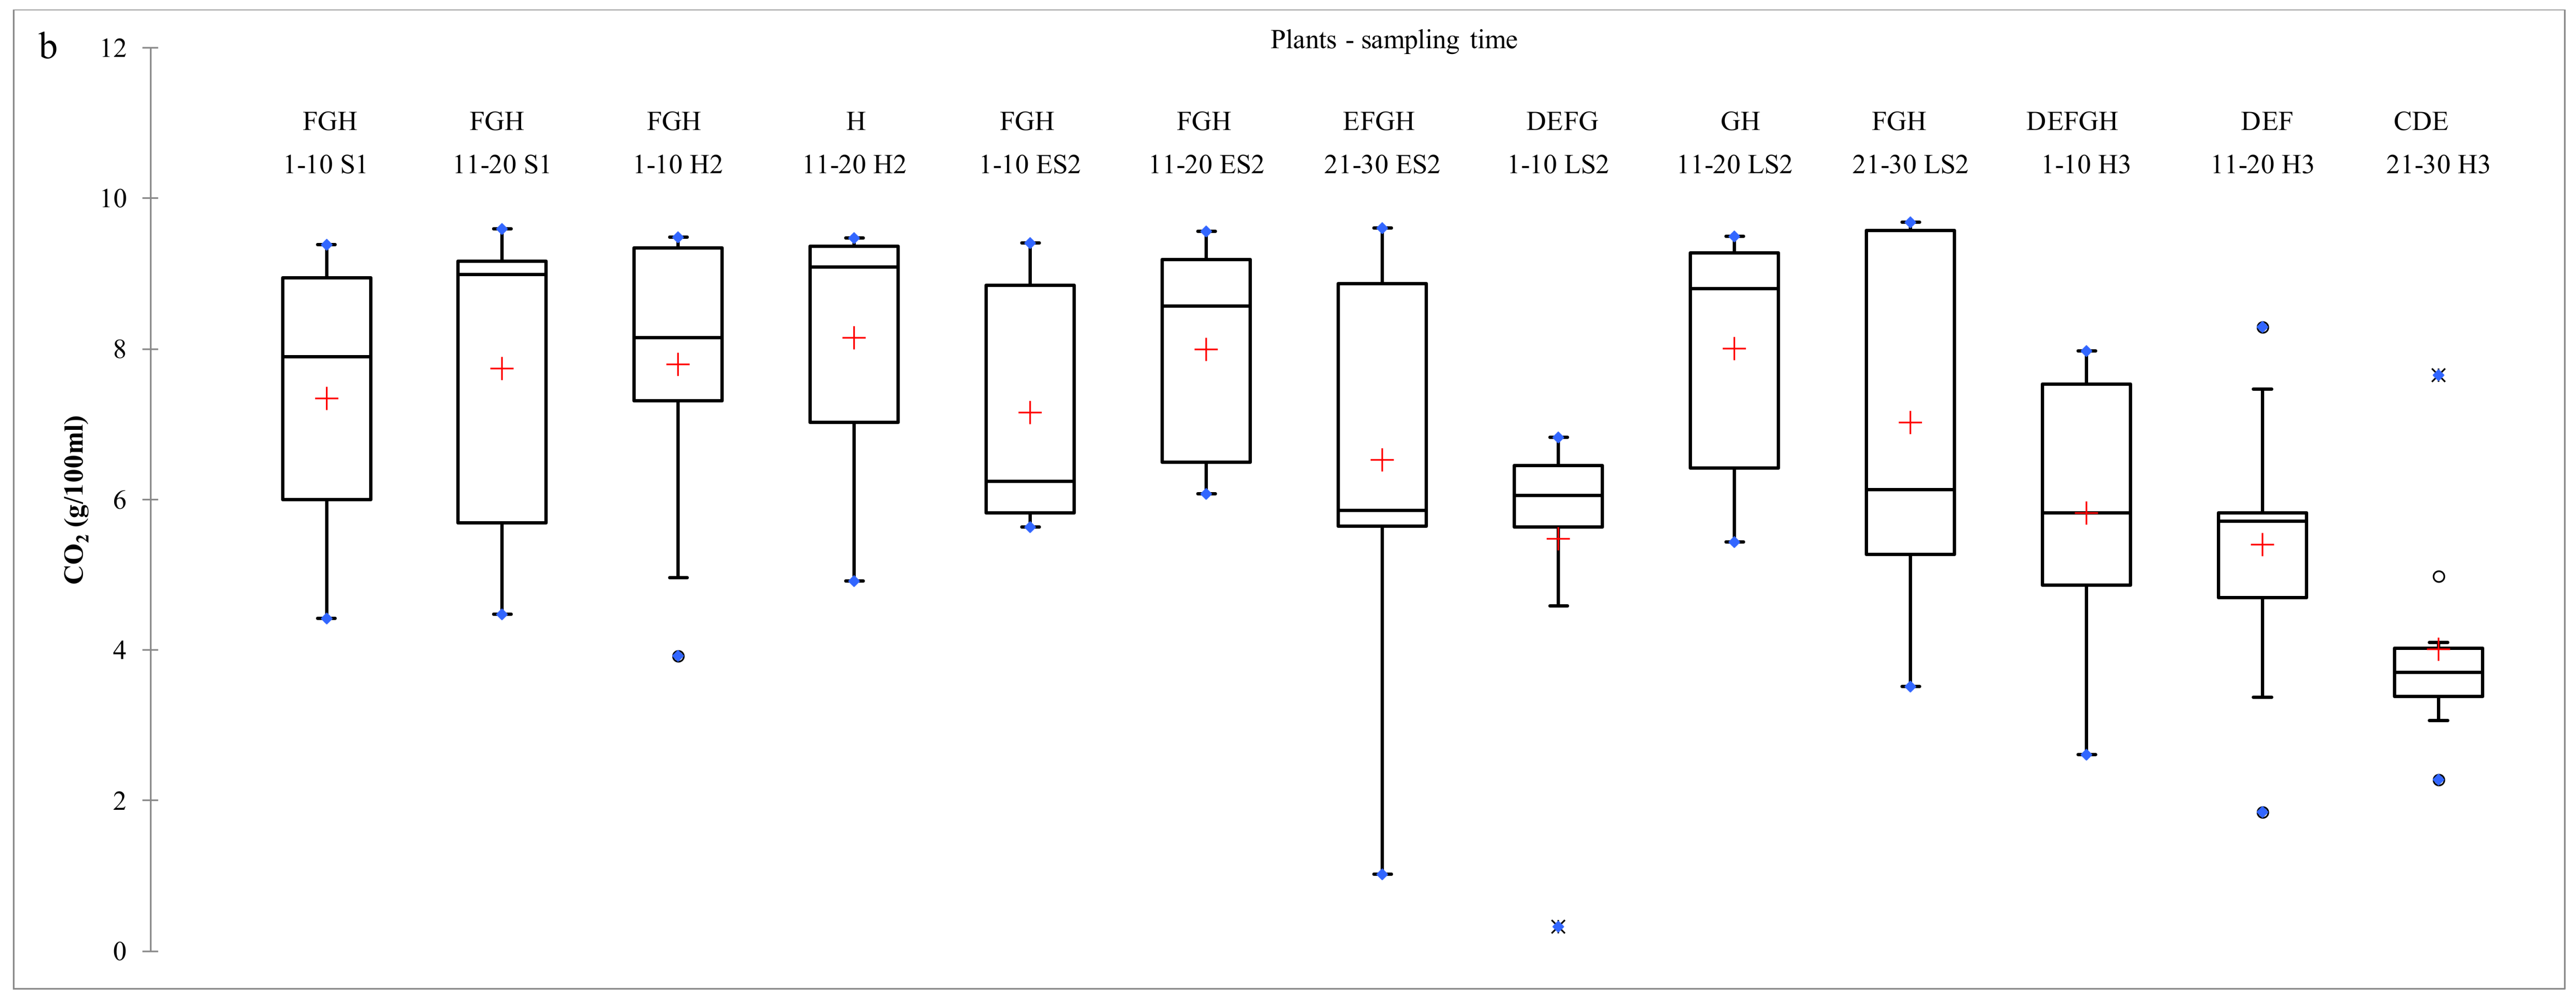
2.2. Dynamics of S. cerevisiae Strains on Vine Bark During Two Consecutive Vintages

The above results suggested that the bark is an interesting niche where S. cerevisiae is present during harvest. With the aim of evaluating whether S. cerevisiae is permanently present on vine bark, independently from the maturation stage of grape cluster, bark samples were collected in spring 1 (S1) and at harvest time 2 (H2) during the subsequent year. To allow for the comparison of the fermentation trends of yeasts collected at different sampling times, CO2 production at about 800 h was considered (Figure 2).
In the YV, the average values of total CO2 production calculated for each vine row were generally very low and significantly different from those measured in fermentation of OV samples. The interquartile ranges in the boxplot distribution were between 0 and 2.2 g/100 mL of synthetic must confirming the trend described during the previous harvest. When yeast isolates were analyzed, none of them were identified as S. cerevisiae.
In the OV, at S1, CO2 concentration showed a high level of variability. The interquartile ranges in the boxplot distribution were between 5.7 and 9.2 g/100 mL of synthetic must. At H2, the variability of CO2 production among bark fermentations was lower. The interquartile ranges in the boxplot distribution were between 7 and 9 g/100 mL of synthetic must. These results suggested an increase of ethanol-resistance species, such as S. cerevisiae, from S1 to H2. Genetic analysis of yeasts isolated at S1 reported that 14 out of 20 bark samples showed presence of S. cerevisiae. A total of 9 strains were found and each fermentation was driven by a single strain. The most present strain was Y3.1 that was found in 4 bark samples, all collected from vine plants of the same row. This strain was already identified at H1, in the bark sample collected from plant 14 present in the other vine row. The other two strains were already found at H1: C6.1, isolated from plant 11, was previously identified in the bark sample collected from plant 6, and Y1.1 was isolated from plant 19 and previously collected from plant 11. Two commercial strains were identified: Lalvin DV10 from plants 2 and 12 (isolated from grape bunch fermentation, plant 5, at H1) and Premium Blanc from plant 17.
At H2, 16 out of 20 bark samples showed the presence of S. cerevisiae and the total strains number was 13. Y3.1 was confirmed to be the most present strain, isolated from 5 plants from both vine rows. Two strains, namely T10 and T6, were present in more than one bark sample, and in three samples two strains were simultaneously present. Three commercial strains were identified at H1: Lalvin DV10 and Premium Blanc were already present at S1 while VIN13 was isolated for the first time.
Results demonstrated that the bark environment showed a high level of variability in terms of strains number and distribution; therefore, in the successive season, we decided to monitor a third vine row in each vineyard in addition to the previous ones. Moreover, to better evaluate strains distribution when grape bunches were not present, two samplings, at early spring (ES2) and late spring (LS2), were performed and results were compared to those obtained at the successive harvest time 3 (H3).
In the YV, total CO2 production (Figure 2) was always very low, although it was more variable at H3. CO2 concentration levels evidenced, once again, the presence of poorly fermenting yeasts. This was confirmed by the genetic analysis that did not allow identifying any S. cerevisiae among the yeast isolates.
In the OV, the boxplot distribution of total CO2 production showed a level of variability among bark samples, collected at ES2 and LS2, comparable to that found at S1. The interquartile ranges in the boxplot distribution were between 5.3 and 10 g/100 mL of synthetic must. Only bark samples collected from plants 1 to 10 at LS2 evidenced a very limited variability among CO2 production values, and the interquartile range in the boxplot distribution was between 5 and 6.4 g/100 mL of synthetic must. This row at LS2 evidenced the presence of mainly low-ethanol-tolerant yeasts. At H3, CO2 production values revealed considerable differences among vine rows, although not statistically different when the average values were considered. The new vine row (from plants 21 to 30) showed the lowest variability level and the interquartile range in the boxplot distribution was between 3.9 and 5 g/100 mL of synthetic must. These results highlighted the dominance of low-ethanol-tolerant yeasts. Genetic analysis at ES2 and LS2 evidenced that 15 and 8 out of 30 bark samples showed the presence of S. cerevisiae, respectively. These ratios were lower than that found at S1, confirming that the presence of S. cerevisiae was strongly variable in vineyard at different sampling times. The total strains numbers were 6 at ES2 and 5 at LS2, both lower than that found at S1. Y3.1 was confirmed to be the most present strain, isolated from 8 plants in the three vine rows. The bark sample collected from plant 8 was the only one showing the presence of two strains, Y3.1 and T10. The latter, together with C6.1, was already found at S1 and H2. No commercial strains were isolated at these sampling times. At H3, only 5 out of 30 bark samples evidenced the presence of S. cerevisiae, and a total of 2 strains, Y3.1 and T10 (both already identified at previous sampling times), were rescued. Y3.1 was confirmed to be the most present strain and it seems to dominate the bark environment as it was found at every sampling time, although at different levels.
The strains number and distribution were considerably lower than those found at H1 and H2, pointing out the strong influence of different vintages (in terms of rainfall and other climate-affecting factors and consequently in terms of chemical treatments) on vine yeast populations.

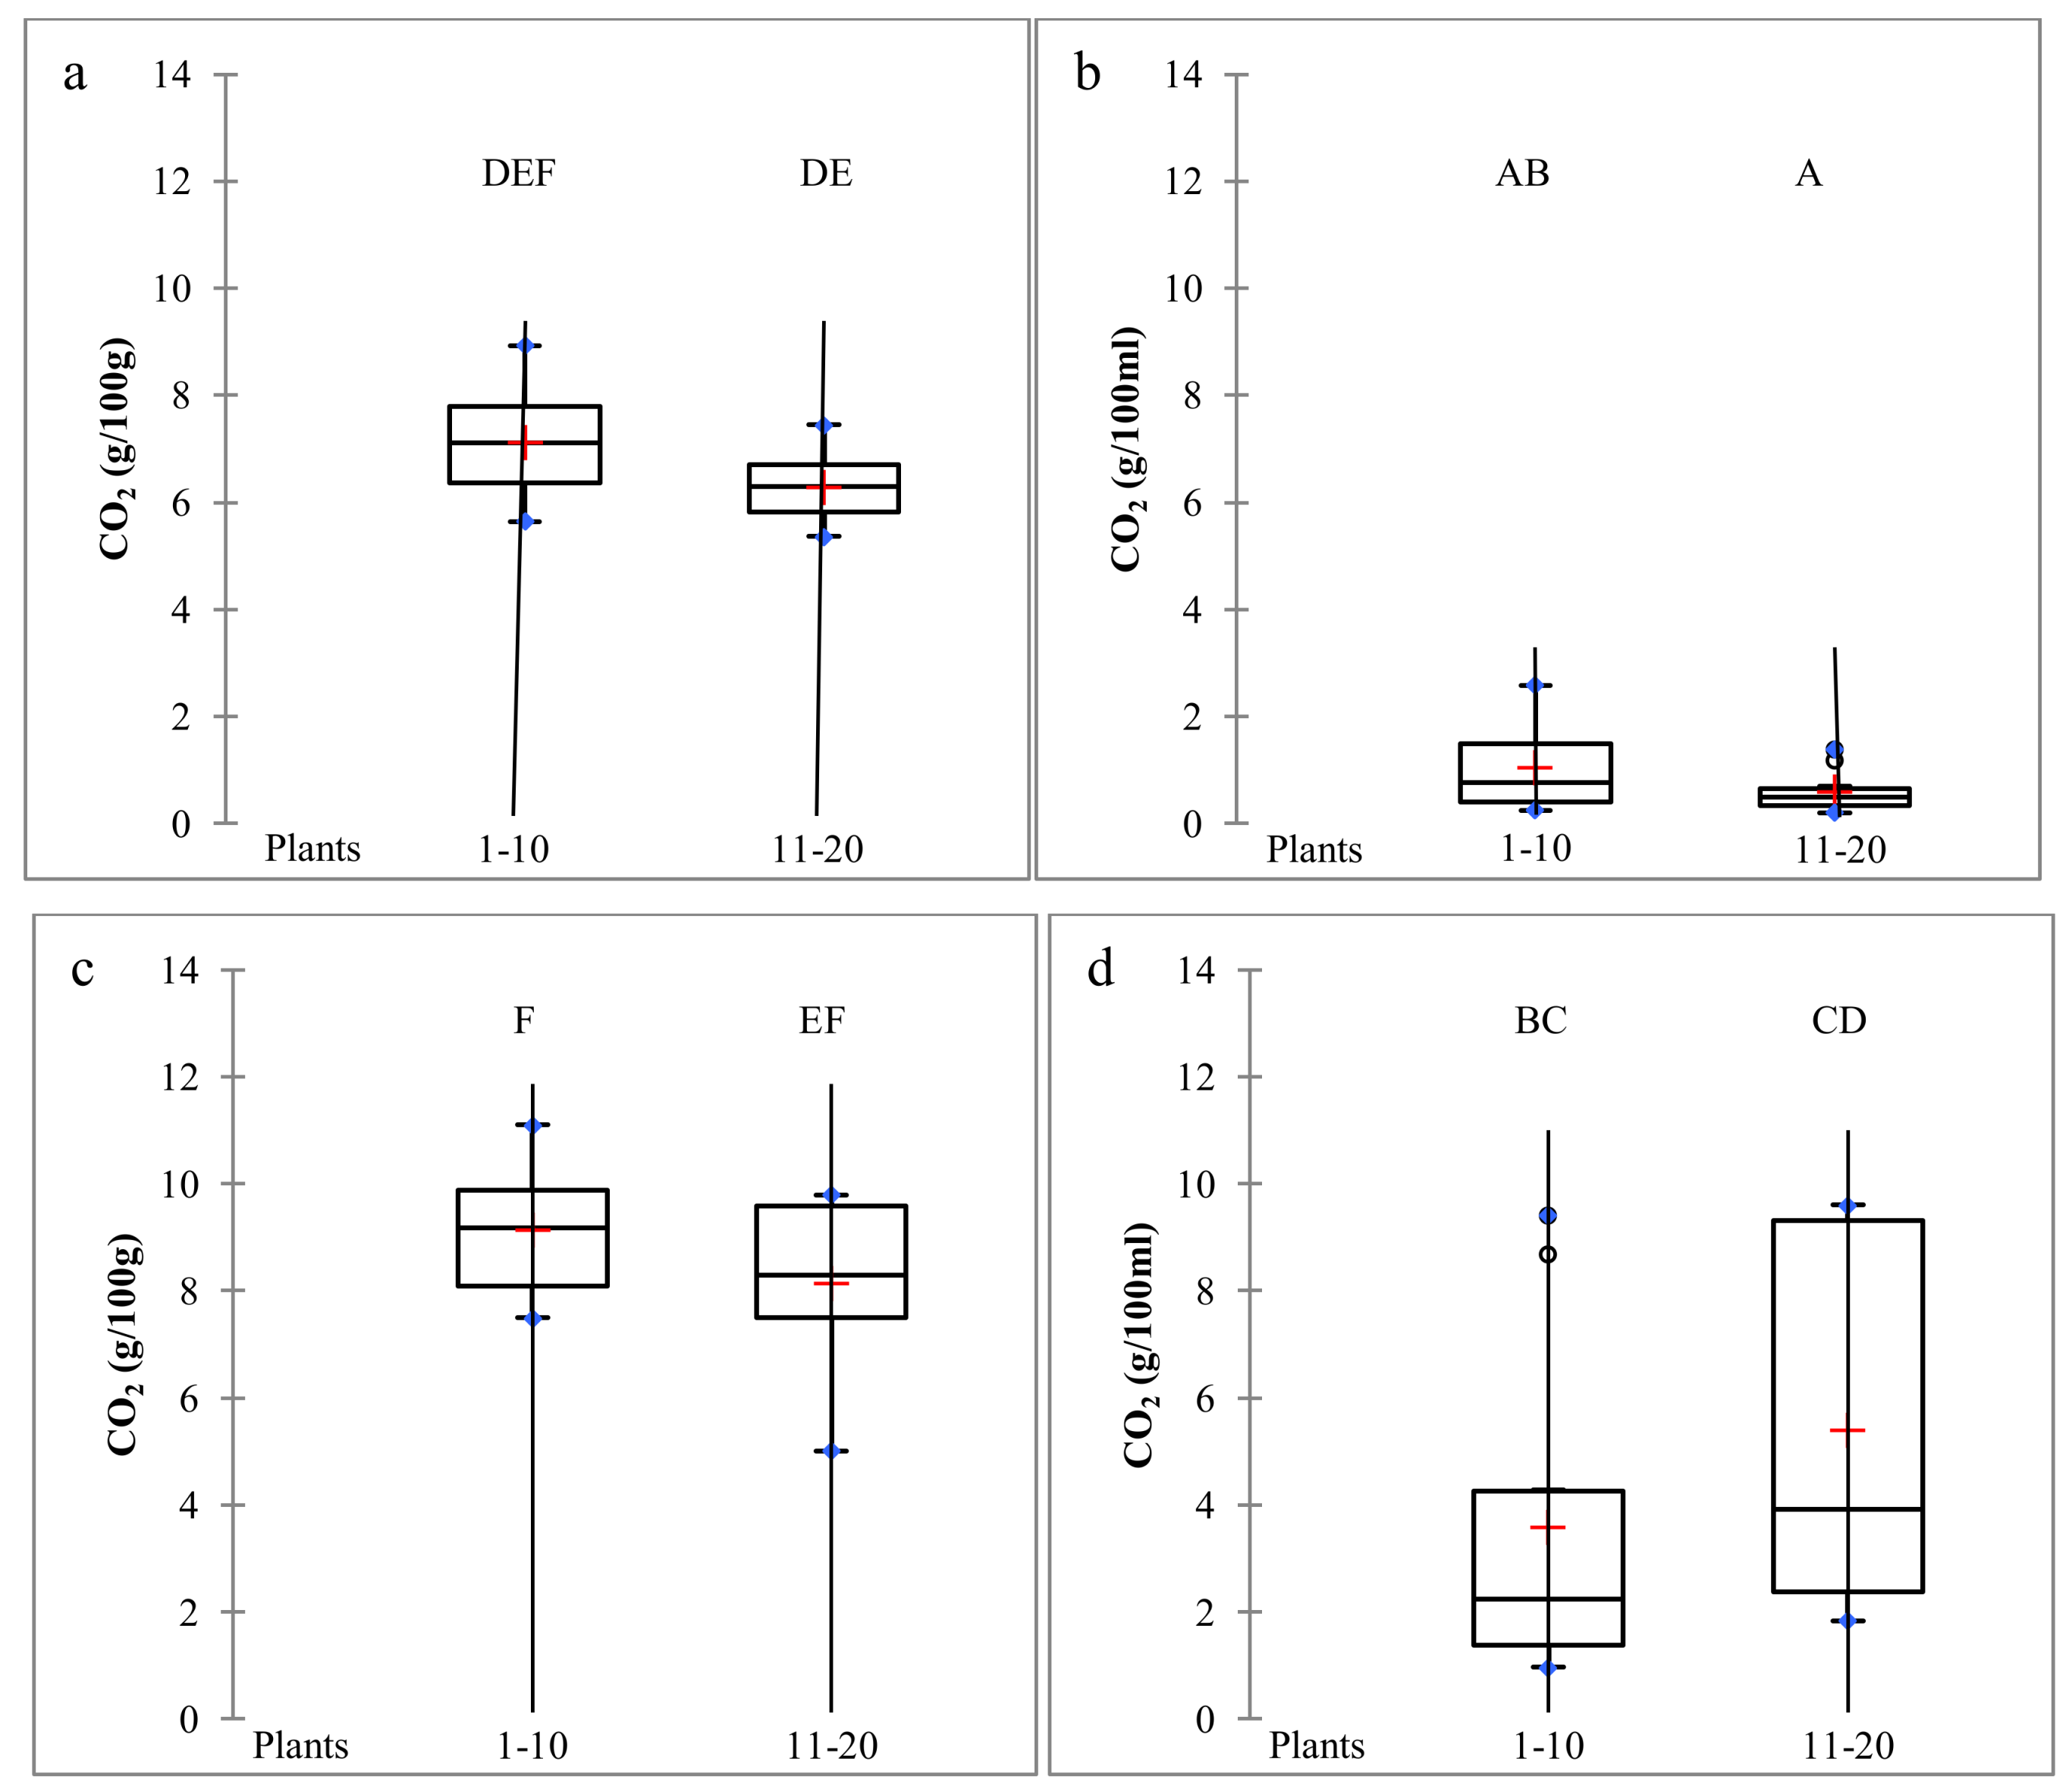
2.3. Dynamics of S. cerevisiae Strains During Pilot-Scale Vinifications

To evaluate how the presence of bark strains influenced strains dynamics during spontaneous fermentation, pilot-scale vinifications were performed at H2 and H3. Previous studies reported that many different strains are present during spontaneous must fermentations, but few are dominant in the later stages of the process [27]. Therefore, at H2, we decided to monitor presence of strains at an early stage (6% ethanol) and at the end of the fermentation process (Table 2).
In fermentations performed with grapes obtained from the YV, 10 and 12 S. cerevisiae strains were found at 6% ethanol and at the end of the fermentation process, respectively. All strains were not previously isolated from bark, indicating a grape-bunch origin. More than half of the strains were commercial starters previously used by the experimental cellar where pilot-scale vinifications were performed. Of total isolates analyzed, commercial strains accounted for 84.3% and 69.2% at 6% ethanol and at the end of the fermentation process, respectively. Only three strains were present at both sampling times: the commercial fruity flavor, the most present strain, F9 and F18.
Regarding the OV, 17 and 15 S. cerevisiae strains were found at 6% ethanol and at the end of the fermentation, respectively. These results evidenced that strains variability was slightly higher in OV fermentation than in YV fermentation. All strains were not previously isolated from bark, except for the commercial strain Premium Blanc that was found at 6% ethanol. Seven strains out of 17 at 6% ethanol and 6 out of 15 at the end of the fermentation process resulted to be commercial starters; 6 out of 7 commercial starters found in total were present in both vinifications (YV and OV). These findings suggested a high level of tank contamination. Strains F9 and F17 were found in fermentations of grapes collected from YV and OV as well. Possible cross-contaminations occurred during fermentations did not allow clearly establishing the origin of these strains. Of the isolates analyzed, commercial strains accounted for 62% and 53.8% at 6% ethanol and at the end of the fermentation process, respectively. Eight strains were present at both sampling times: 5 were commercial strains and 3 (F21, F23, and F28) had a bunch origin.
A limited variability in terms of number of strains was found between the two sampling times (at 6% ethanol and at the end of the fermentation process) for both YV and OV grapes, although an evident change of strains composition was found due to an increasing ethanol concentration. Therefore, at H3, we decided to perform only the sampling at 6% ethanol. To favor S. cerevisiae development, the grape must was split into two tanks; in one tank, 50 mg/L of SO2 was added, a dosage which is known to inhibit non-Saccharomyces species.
At H3, in fermentations performed with grape obtained from YV, 11 S. cerevisiae strains were found, whereas in the presence of SO2 the total strains number was 12 (Table 3).
All strains were not previously isolated from bark, indicating a grape-bunch origin. Moreover, they were not present in the corresponding vinification at H2. Seven strains out of 11 in YV fermentation and 5 out of 12 in YV fermentation in the presence of SO2 were commercial starters; 4 out of the 8 commercial starters found in total were present in both vinifications. Of total isolates analyzed, commercial strains accounted for 76.6% and 71.7% in YV fermentation and in YV fermentation with SO2, respectively. The most present strain was the commercial starter VL that reached 35%–36.7% of the total isolates analyzed. Among the strains of bunch origin, only P7 and P14 were found in both fermentations.
In fermentations performed with grapes obtained from OV, 9 S. cerevisiae strains were found, whereas in the presence of SO2 the total strains number was 10; 4 out of the 9 commercial starters found in total were present in both vinifications. Of total isolates analyzed in both vinifications, commercial strains accounted for 81.7%. The most present strains were the commercial starter CRU 211 (43.3%) in fermentation without SO2 and WAM (41.7%) in fermentation with SO2. Five strains were present in both vinifications: 4 were commercial strains and 1 (P14) had a bunch origin. Seven commercial strains and two strains of bunch origin (P4 and P14) were found to be present in fermentations of grapes collected from the YV and OV. These findings suggested again the presence of a high level of contamination.
In these pilot-scale vinifications, the addition of SO2 slightly incremented strains variability, but in the presence of SO2 some strains, such as the commercial starter WAM, increased their concentration. These findings suggested that different levels of SO2 tolerance could modulate strain presence in the fermenting must.

3. Materials and Methods

3.1. Wine-Making Area, Grapevine Variety, and Sampling Times

Two vineyards of Glera, the main white grape variety of the Conegliano Valdobbiadene Prosecco Superiore DOCG wine-making area, were studied. One vineyard was three years old (YV) and the grapevine trunks had an average diameter of 1.5–2 cm with a thin bark. The second one was eight years old (OV) with a robust trunk with an average diameter of 10 cm. In both vineyards, two or three rows were selected, and each one was constituted by 30 vine plants. Three consecutive harvests were considered and the monitoring campaign included the following samplings: during the first year at H1 and in the subsequent year in S1 and at H2; during the third year at ES2, LS2, and at H3. From each row, 10 plants were chosen for sampling bark portions and, at harvest, grape bunches.

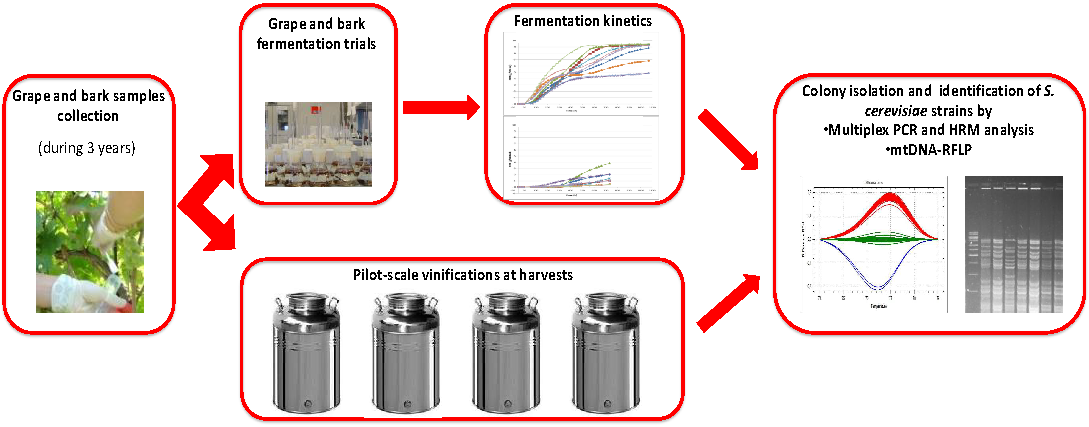
3.2. Bark and Grape Sampling and Yeast Isolation

To collect S. cerevisiae strains from bark, sampling was carried out by scratching bark portions from the vine cordon with a sterilized spatula. Samples were transferred to the laboratory, introduced into 120 mL Erlenmeyer flasks sealed with silicon caps, containing a bowed glass pipette, and added with 100 mL of Delfini synthetic must [29]. To each flask, 100 μL of sulphur dioxide at 5% (v/v) to prevent apiculate yeasts development and 10 mL of vaseline oil to prevent moulds growth were added.
The fermentation process was followed by monitoring the weight loss daily. Fermentations were considered completed when weight loss was lower than 0.1 g within 24 h.
To collected S. cerevisiae strains from grapes, grape bunches were collected 3 to 5 days before harvest, as described by Viel et al. [7]. Briefly, stomacher sterile bags were used to collect about 500 g of grapes (generally corresponding to one bunch) and an amount of sugar (50% fructose and 50% glucose), corresponding to 2% of grapes weight, was added to each sample, together with 500 μL of sulphur dioxide at 5% (v/v), to promote the growth of S. cerevisiae yeast species. Samples were manually crushed, and spontaneous fermentations were let to run at room temperature. The fermentation process was monitored by evaluating the daily weight loss of the fermenting flasks until the daily weight decrease was lower than 0.1 g, indicating the end of fermentation.
For both bark and grape fermentations, when the amount of CO2 produced reached 3–4 g/100 mL of synthetic must or 100 g of grape, a 1 mL aliquot from each flask or bag was serially diluted and plated on WL medium (Oxoid). Plates were incubated for 5 days at 25 °C. For each sample, about 50 colonies with Saccharomyces-like morphology were randomly collected and stored at −80 °C in a 40% (v/v) glycerol solution.

3.3. Pilot-Scale Vinifications and Yeast Isolation

At sampling times H2 and H3, manual harvest was performed when Glera grapes reached the complete ripeness. For each vineyard, 400 kg of bunches were collected from each sampled row, consisting of 30 vine plants each. After crushing, the grape must was transferred to two steel tanks of 1 hl capacity, each one filled with about 70 L of must and let to ferment spontaneously.
Pilot-scale vinifications were carried out in the experimental winery of Veneto Agricoltura (Conegliano, Italy). After 24 h of maceration at 20 °C, the grape must was pressed to separate the grape pomace. After further 24 h of settling, the juice was transferred to a new tank. The fermentation process was carried out at 20 °C and monitored daily by measuring the sugar consumption (data not shown)
At H2, the OV grape must had 174 g/L of sugars (pH: 3.42) and the YV grape must had 159 g/L of sugars (pH: 3.23). When alcohol content was about 6.0% (v/v) and at the end of fermentation (sugars concentration lower than 1 g/L), aliquots from each tank were taken, serially diluted, and plated on WL agar medium (Oxoid) for colony count and isolation. For each fermentation, at the two sampling points, a total of 50–52 colonies showing Saccharomyces-like morphology were randomly collected, purified, and stored in 40% (v/v) glycerol solution.
At H3, the OV grape must had 146 g/L of sugars (pH: 3.15) and the YV grape must had 150 g/L of sugars (pH: 3.26). For each vineyard, after grape crushing, the must was split into two tanks. In one tank, the fermentation was carried out without sulfur dioxide addition, while in the other one 50 mg/L of SO2 was added. When alcohol content was about 6.0% (v/v), aliquots from each tank were taken, serially diluted, and plated on WL agar medium (Oxoid) for colony count and isolation. For each fermentation, a total of 60 colonies showing Saccharomyces-like morphology were randomly collected, purified, and stored in a 40% (v/v) glycerol solution. In all the vinifications, alcoholic fermentations were completed, represented by the sugars concentration lower than 1 g/L.

3.4. Species Identification

To identify isolates belonging to the species S. cerevisiae, multiplex PCR [30] and HRM analyses [31] on yeasts colonies were performed.

3.5. MtDNA RFLP Analysis

In order to identify S. cerevisiae isolates genotypes, the Querol and Ramon [32] method was followed. Briefly, isolates were plated on YM agar medium and incubated for 48 h at 25 °C. Then, yeast colonies were resuspended in 1 mL of sterile water, centrifuged for 3 min at 14,000 rpm, and processed for DNA isolation. DNA digestion was carried out using HinfI enzyme (Fermentas, Thermo Scientific, Waltham, MA, EUA). After the digestion, DNA fragments were separated by electrophoresis on agarose gel, as described by Bovo et al. [33]. The mtDNA restriction profiles were analyzed using BioNumerics® 6.6 software (Applied Maths, Sint-Martens-Latem, Belgium) and yeast isolates showing the same genotype were identified by the same code.

3.6. Statistical Analysis

Boxplot and one-way analysis of variance (ANOVA) at a 95% accuracy level were made with XLSTAT software version 7.5.2 (Addinsoft, Paris, France).

4. Conclusions

In this work, grape and bark samples, collected from two vineyards of different ages, were fermented to evaluate the presence of S. cerevisae strains during three following vintages. Moreover, pilot-scale vinifications were conducted at two following harvests to evaluate the potential transfer of S. cerevisiae from the vineyard to the cellar. By analyzing more than 910 isolates collected from vineyard and from vinifications of grape musts, 60 genotypes, corresponding to the same number of strains, were isolated.
The first sampling of grapes and bark portions was carried out at harvest (H1) and highlighted that the age of vineyards was an important factor affecting the presence and diffusion of S. cerevisiae on the bark and on grape surface. The very low level of CO2 production during fermentation indicated the abundance of oxidative yeasts in the YV; indeed no S. cerevisiae was identified from the bark and on the grape surface.
During the successive vintages bark samples were collected at spring when grape bunches were not present yet and at harvest. In the OV, the abundance of S. cerevisiae was highly variable, ranging from a minimum of 2 strains at H1 and H3 to a maximum of 13 strains at H2. These results evidenced the strong effect of the vintage on vine yeast populations. The effect of different vintages on S. cerevisiae strains abundance is well-documented in the grape must and during vinification [34,35], but no previous works described the effect of vintage on vineyard-associated S. cerevisiae strains.
Generally, each bark sample contained only one S. cerevisiae strain, evidencing a very low genetic variability, although this species was anyway present. Notwithstanding, the constant isolation of S. cerevisiae from bark, regardless of the presence of grape bunches, suggested that it can be considered an alternative ecological niche that permanently hosts S. cerevisiae in the vineyard.
Interestingly, no strains of bark origin were found on grape bunches (H1) and during pilot-scale vinifications. These results suggested that strains of bark origin, adapted to vine conditions, were less competitive in the grape must. The native strains, developed in the grape must during vinifications, could be originated from other sources, such as contamination by cellar tools (tanks), soil or that carried by insects, as suggested by other researches [21,26].
Several commercial strains have been isolated from bark samples and during pilot-scale vinifications, confirming the high level of strain dissemination found from previous studies. These commercial starters were the only strains that were simultaneously found in the vineyard and during vinifications, suggesting a potential transfer from the vineyard to the cellar. One of them, Premium Blanc, was present in the vineyard and dominated during pilot-scale vinifications.
In conclusion, the vineyard population of S. cerevisiae was present during the whole sampled period, and it was affected by the different harvests and sampling times, the age of the plants, and plant position in the vineyard. The bark population of S. cerevisiae seemed to be very different from that of the grapes, since no strain transfer was detected during this study. Therefore, further investigations will be needed to evaluate whether such differences could be evidenced in their technological properties as well.

Supplementary Materials

Supplementary materials can be found at https://www.mdpi.com/2311-5637/5/3/62/s1. Figure S1. Fermentation kinetics of the 10 samples obtained at H1 from grapes from plants 1 to 10 of vine row 1 in the YV (a), bark from plants 1 to 10 of vine row 1 in the YV (b), grapes from plants 11 to 20 of vine row 2 in the YV (c), bark from plants 11 to 20 of vine row 2 in the YV (d), grapes from plants 1 to 10 of vine row 1 in the OV (e), bark from plants 1 to 10 of vine row 1 in the OV (f), grapes from plants 11 to 20 of vine row 2 in the OV (g), and bark from plants 11 to 20 of vine row 2 in the OV (h); Figure S2. A. Fermentation kinetics of the 10 samples obtained at spring 1 (S1) from bark from plants 1 to 10 of vine row 1 in the YV (a), bark from plants 11 to 20 of vine row 2 in the YV (b), bark from plants 1 to 10 of vine row 1 in the OV (c), and bark from plants 11 to 20 of vine row 2 in the OV (d). B. Fermentation kinetics of the 10 samples obtained at H2 from bark from plants 1 to 10 of vine row 1 in the YV (a), bark from plants 11 to 20 of vine row 2 in the YV (b), bark from plants 1 to 10 of vine row 1 in the OV (c), and bark from plants 11 to 20 of vine row 2 in the OV (d). C. Fermentation kinetics of the 10 samples obtained at ES2 from bark from plants 1 to 10 of vine row 1 in the YV (a), bark from plants 11 to 20 of vine row 2 in the YV (b), bark from plants 21 to 30 of vine row 3 in the YV (c), bark from plants 1 to 10 of vine row 1 in the OV (d), bark from plants 11 to 20 of vine row 2 in the OV (e), and bark from plants 21 to 30 of vine row 3 in the OV (f). D. Fermentation kinetics of the 10 samples obtained at LS2 from bark from plants 1 to 10 of vine row 1 in the YV (a), bark from plants 11 to 20 of vine row 2 in the YV (b), bark from plants 21 to 30 of vine row 3 in the YV (c), bark from plants 1 to 10 of vine row 1 in the OV (d), and bark from plants 11 to 20 of vine row 2 in the OV (e), bark from plants 21 to 30 of vine row 3 in the OV (f). E. Fermentation kinetics of the 10 samples obtained at H3 from bark from plants 1 to 10 of vine row 1 in the YV (a), bark from plants 11 to 20 of vine row 2 in the YV (b), bark from plants 21 to 30 of vine row 3 in the YV (c), bark from plants 1 to 10 of vine row 1 in the OV (d), bark from plants 11 to 20 of vine row 2 in the OV (e), and bark from plants 21 to 30 of vine row 3 in the OV (f); Figure S3. Dendrogram representing the genetic relationships among the vineyard strains.

Author Contributions

Conceptualization: C.N. and V.C.; formal analysis: C.N.; investigation: C.N., C.V., M.C., and C.A.; resources: A.G. and V.C.; writing of original draft preparation: C.N. and V.C.; supervision: V.C.; project administration: V.C.; funding acquisition: A.G. and V.C.

Funding

The research financial support was provided by Provincia di Treviso and project PSR BIODILIEVITI (Regione Veneto, 2013–2015).

Acknowledgments

The authors wish to thank Valentina Lecci and Gianluca Forcolin for fermentation tests and molecular analysis, and Consorzio di Tutela del vino Conegliano Valdobbiadene Prosecco DOCG for finding the two partner companies, Azienda vinicola San Giovanni-Perini (Conegliano Loc. Manzana) and Azienda Il colle (San Pietro di Feletto Loc. Pedeguarda) for providing the two vineyards and Stefano Soligo (Veneto Agricoltura, Conegliano) for pilot-scale vinifications.

Conflicts of Interest

The authors declare no conflicts of interest.

References

  1. Mas, A.; Guillamón, J.M.; Beltran, G. Editorial: Non-conventional Yeast in the Wine Industry. Front. Microbiol. 2016, 7, 1494. [Google Scholar] [CrossRef] [PubMed]
  2. Clavijo, A.; Calderón, I.L.; Paneque, P. Diversity of Saccharomyces and non-Saccharomyces yeasts in three red grape varieties cultured in the Serrania de Ronda (Spain) vine-growing region. Int. J. Food Microbiol. 2010, 143, 241–245. [Google Scholar] [CrossRef] [PubMed]
  3. Cordero-Bueso, G.; Arroyo, T.; Serrano, A.; Valero, E. Remanence and survival of commercial yeast in different ecological niches of the vineyard. FEMS Microbiol. Ecol. 2011, 77, 429–437. [Google Scholar] [CrossRef] [PubMed]
  4. Crosato, G.; Carlot, M.; De Iseppi, A.; Garavaglia, J.; Pinto, L.M.N.; Ziegler, D.R.; de Souza Ramos, R.C.; Rossi, R.C.; Nadai, C.; Giacomini, A. Genetic variability and physiological traits of Saccharomyces cerevisiae strains isolated from “Vale dos Vinhedos” vineyards reflect agricultural practices and history of this Brazilian wet subtropical area. World J. Microbiol. Biotechnol. 2018, 34, 105. [Google Scholar] [CrossRef] [PubMed]
  5. Valero, E.; Schuller, D.; Cambon, B.; Casal, M.; Dequin, S. Biodiversity of Saccharomyces yeast strains from grape berries of wine-producing areas using starter commercial yeasts. FEMS Yeast Res. 2007, 7, 317–329. [Google Scholar] [CrossRef] [PubMed]
  6. Versavaud, A.; Courcoux, P.; Roulland, C.; Dulau, L.; Hallet, J. Genetic diversity and geographical distribution of wild Saccharomyces cerevisiae strains from the wine-producing area of Charentes, France. Appl. Environ. Microbiol. 1995, 61, 3521–3529. [Google Scholar] [PubMed]
  7. Viel, A.; Legras, J.L.; Nadai, C.; Carlot, M.; Lombardi, A.; Crespan, M.; Migliaro, D.; Giacomini, A.; Corich, V. The geographic distribution of Saccharomyces cerevisiae isolates within three Italian neighboring winemaking regions reveals strong differences in yeast abundance, genetic diversity and industrial strain dissemination. Front. Microbiol. 2017, 8, 1595. [Google Scholar] [CrossRef] [PubMed]
  8. Barata, A.; Malfeito-Ferreira, M.; Loureiro, V. The microbial ecology of wine grape berries. Int. J. Food Microbiol. 2012, 153, 243–259. [Google Scholar] [CrossRef]
  9. Fleet, G.H. Yeast interactions and wine flavour. Int. J. Food Microbiol. 2003, 86, 11–22. [Google Scholar] [CrossRef]
  10. Martini, A.; Ciani, M.; Scorzetti, G. Direct enumeration and isolation of wine yeasts from grapes surfaces. Am. J. Enol. Vitic. 1996, 47, 435–440. [Google Scholar] [CrossRef]
  11. Taylor, M.W.; Tsai, P.; Anfang, N.; Ross, H.A.; Goddard, M.R. Pyrosequencing reveals regional differences in fruit-associated fungal communities. Environ. Microbiol. 2014, 16, 2848–2858. [Google Scholar] [CrossRef] [PubMed]
  12. Robiglio, A.; Sosa, M.C.; Lutz, M.C.; Lopes, C.A.; Sangorrín, M.P. Yeast biocontrol of fungal spoilage of pears stored at low temperature. Int. J. Food Microbiol. 2011, 147, 211–216. [Google Scholar] [CrossRef] [PubMed]
  13. Wang, Q.M.; Liu, W.Q.; Liti, G.; Wang, S.A.; Bai, F.Y. Surprisingly diverged populations of Saccharomyces cerevisiae in natural environments remote from human activity. Mol. Ecol. 2012, 21, 5404–5417. [Google Scholar] [CrossRef] [PubMed]
  14. Stefanini, I.; Dapporto, L.; Legras, J.L.; Calabretta, A.; Di Paola, M.; De Filippo, C.; Viola, R.; Capretti, P.; Polsinelli, M.; Turillazzi, S. Role of social wasps in Saccharomyces cerevisiae ecology and evolution. Proc. Natl. Acad. Sci. USA 2012, 109, 13398–13403. [Google Scholar] [CrossRef] [PubMed]
  15. Naumov, G.I.; Naumova, E.S.; Sniegowski, P.D. Saccharomyces paradoxus and Saccharomyces cerevisiae are associated with exudates of North American oaks. Can. J. Microbiol. 1998, 44, 1045–1050. [Google Scholar] [CrossRef] [PubMed]
  16. Sniegowski, P.D.; Dombrowski, P.G.; Fingerman, E. Saccharomyces cerevisiae and Saccharomyces paradoxus coexist in a natural woodland site in North America and display different levels of reproductive isolation from European conspecifics. FEMS Yeast Res. 2002, 1, 299–306. [Google Scholar] [CrossRef] [PubMed]
  17. Johnson, L.J.; Koufopanou, V.; Goddard, M.R.; Hetherington, R.; Schäfer, S.M.; Burt, A. Population genetics of the wild yeast Saccharomyces paradoxus. Genetics 2004, 166, 43–52. [Google Scholar] [CrossRef]
  18. Sampaio, J.P.; Goncalves, P. Natural populations of Saccharomyces kudriavzevii in Portugal are associated with oak bark and are sympatric with S. cerevisiae and S. paradoxus. Appl. Environ. Microbiol. 2008, 74, 2144–2152. [Google Scholar] [CrossRef]
  19. Zhang, H.; Skelton, A.; Gardner, R.C.; Goddard, M.R. S. paradoxus and S. cerevisiae reside on oak trees in New Zealand: Evidence for migration from Europe and inter-species hybrids. FEMS Yeast Res. 2010, 7, 941–947. [Google Scholar] [CrossRef]
  20. Hyma, K.E.; Fay, J.C. Mixing of vineyard and oak-tree ecotypes of Saccharomyces cerevisiae in North American vineyards. Mol. Ecol. 2013, 22, 2917–2930. [Google Scholar] [CrossRef]
  21. Goddard, M.R.; Greig, D. Saccharomyces cerevisiae: A nomadic yeast with no niche? FEMS Yeast Res. 2015, 15. [Google Scholar] [CrossRef] [PubMed]
  22. Setati, M.E.; Jacobson, D.; Andong, U.C.; Bauer, F.F. The Vineyard Yeast Microbiome, a Mixed Model Microbial Map. PLoS ONE 2013, 7, e52609. [Google Scholar] [CrossRef]
  23. Bokulich, N.A.; Thorngate, J.H.; Richardson, P.M.; Mills, D.A. Microbial biogeography of wine grapes is conditioned by cultivar, vintage, and climate. Proc. Natl. Acad. Sci. USA 2014, 111, E139–E148. [Google Scholar] [CrossRef] [PubMed]
  24. Mannazzu, I.M.; Clementi, F.; Ciani, M. Strategies and criteria for the isolation and selection of autochthonous starters. In Biodiversity and Biotechnology of Wine Yeasts; Ciani, M., Ed.; Research Signpost: Trivandrum, India, 2002; pp. 19–35. [Google Scholar]
  25. Pretorius, I.S. Tailoring wine yeast for the new millennium: Novel approaches to the ancient art of winemaking. Yeast 2000, 16, 675–729. [Google Scholar] [CrossRef]
  26. Goddard, M.R.; Anfang, N.; Tang, R.; Gardner, R.C.; Jun, C. A distinct population of Saccharomyces cerevisiae in New Zealand: Evidence for local dispersal by insects and human-aided global dispersal in oak barrels. Environ. Microbiol. 2010, 12, 63–73. [Google Scholar] [CrossRef] [PubMed]
  27. Torija, M.J.; Rozes, N.; Poblet, M.; Guillamón, J.M.; Mas, A. Yeast population dynamics in spontaneous fermentations: Comparison between two different wine-producing areas over a period of three years. Antonie Leeuwenhoek 2001, 79, 345–352. [Google Scholar] [CrossRef] [PubMed]
  28. Van der Westhuizen, T.J.; Augustyn, O.P.H.; Pretorius, I.S. Geographical distribution of indigenous Saccharomyces cerevisiae strains isolated from vineyards in the coastal regions of the Western Cape in South Africa. S. Afr. J. Enol. Vitic. 2000, 21, 3–9. [Google Scholar] [CrossRef]
  29. Delfini, C.; Formica, J.V. Wine Microbiology: Science and Technology; Marcel Dekker: New York, NY, USA, 2001. [Google Scholar]
  30. Nardi, T.; Carlot, M.; De Bortoli, E.; Corich, V.; Giacomini, A. A rapid method for differentiating Saccharomyces sensu stricto strains from other yeast species in an enological environment. FEMS Microbiol. Lett. 2006, 264, 168–173. [Google Scholar] [CrossRef] [PubMed]
  31. Nadai, C.; Bovo, B.; Giacomini, A.; Corich, V. New rapid PCR protocol based on high-resolution melting analysis to identify Saccharomyces cerevisiae and other species within its genus. J. Appl. Microbiol. 2018, 124, 1232–1242. [Google Scholar] [CrossRef]
  32. Querol, A.; Ramon, D. The application of molecular techniques in wine microbiology. Trends Food Sci. Technol. 1996, 7, 73–78. [Google Scholar] [CrossRef]
  33. Bovo, B.; Giacomini, A.; Corich, V. Effects of grape marcs acidification treatment on the evolution of indigenous yeast populations during the production of grappa. J. Appl. Microbiol. 2011, 111, 382–388. [Google Scholar] [CrossRef] [PubMed]
  34. Gutierrez, A.R.; Santamaria, P.; Epifanio, S.; Garijo, P.; López, R.L. Ecology of spontaneous fermentation in one winery during 5 consecutive years. Lett. Appl. Microbiol. 1999, 29, 411–415. [Google Scholar] [CrossRef]
  35. Settanni, L.; Sannino, C.; Francesca, N.; Guarcello, R.; Moschetti, G. Yeast ecology of vineyards within Marsala wine area (western Sicily) in two consecutive vintages and selection of autochthonous Saccharomyces cerevisiae strains. J. Biosci. Bioeng. 2012, 114, 606–614. [Google Scholar] [CrossRef] [PubMed]
Figure 1. CO2 production at sampling time (harvest time 1, H1) at the end of the fermentation process of grape bunches collected from the young vineyard (YV) (a), bark samples collected from the YV (b), grape bunches collected from the old vineyard (OV) (c), and bark collected from the OV (d). Different letters above the boxplots indicate significant differences between the average CO2 values calculated for the 10 plants of each row in the two vineyards, according to the Tukey’s test (p ≤ 0.05).
Fermentation 05 00062 g001
Figure 2. CO2 production at about 800 h of fermentation of bark samples collected from the YV (a) and the OV (b). Different letters above the boxplots indicate significant differences between the average CO2 values calculated for the 10 plants of each row in the two vineyards, according to the Tukey’s test (p ≤ 0.05).
Fermentation 05 00062 g002aFermentation 05 00062 g002b
Table 1. Presence of Saccharomyces cerevisiae (S. cerevisiae) strains in bark samples collected from 30 vine plants (three rows) in the OV. Plants 2–30 were sampled only at early spring 2 (ES2), late spring 2 (LS2), and harvest time 3 (H3).
Vine PlantH1S1H2ES2LS2H3
1Y3.1 (100%)Y3.1 (100%)
2DV10 (100%)
3T10 (100%)T10 (100%)T10 (100%)T10 (100%)
4Y3.1 (100%)
5Y3.1 (100%)T13 (100%)
6C6.1 (100%)Y3.1 (100%)
7T17 (100%)
8Y3.1 (100%)T10 (100%)Y3.1 (91%)
T10 (9%)
Y3.1 (100%)
9T14 (100%)Y3.1 (100%)
10C10.1 (100%)Y3.1 (100%)VIN13 (63%)
T15 (37%)
T10 (100%)Y3.1 (100%)
Total strain number245212
11Y1.1 (10%)
Y1.2 (90%)
C6.1 (100%)Premium Blanc (33%)
T4 (67%)
Y3.1 (100%)
12DV10 (100%)Premium Blanc (90%)
C6.1 (10%)
13Y3.1 (100%)T1 (100%)Y3.1 (100%)Y3.1 (100%)
14Y4.1 (20%)
Y4.2 (80%)
Y3.1 (100%)T10 (100%)
15T5 (100%)C6.1 (100%)
16T2 (100%)T9 (100%)
17Premium Blanc (100%)T6 (75%)
T7 (25%)
Y3.1 (100%)T16 (100%)
18T3 (100%)T6 (15%)
T8 (85%)
T10 (100%)Y3.1 (100%)
19Y1.1 (100%)Y3.1 (100%)Y3.1 (100%)
20DV10 (100%)Y3.1 (100%)Y3.1 (100%)
Total strain number579431
21
22 T18 (100%)
23 T18 (100%)
24 T11 (100%)
25 Y3.1 (100%)
26 T12 (100%)T18 (100%)
27 T18 (100%)
28 Y3.1 (100%)Y3.1 (100%)
29
30
Total strain number 311
Table 2. S. cerevisiae strains isolated at 6% ethanol and at the end of fermentation during spontaneous fermentations of grapes harvested at H2.
6% EtOHEnd Fermentation
StrainYVOVYVOV
Aromatic K0303
D2544345
ES18111071
Fruity flavor17211815
Premium Blanc0100
VL17133
VL31100
WAM3141
F20010
F40010
F50010
F70010
F81000
F92065
F120001
F130002
F150001
F171100
F184050
F200300
F210303
F230608
F240100
F250002
F260001
F270100
F280101
F290100
F300100
F310100
F320010
Total colonies51505252
Table 3. S. cerevisiae strains isolated at 6% ethanol during spontaneous fermentations of grapes harvested at sampling time H3. – SO2: fermentation without SO2 addition; + SO2: fermentation with addition of 50 mg/L of D.
– SO2+ SO2
StrainYVOVYVOV
CRU 21172601
D2540100
DV107273
ES18151219
Fruity flavor2600
Premium Blanc1000
VL1212228
VL30023
WAM301125
P20100
P30001
P42006
P50002
P61000
P71010
P80010
P90020
P100010
P110800
P120010
P130010
P14102102
Total colonies60606060

