Transcriptomic Response of Saccharomyces cerevisiae during Fermentation under Oleic Acid and Ergosterol Depletion


Abstract
:1. Introduction
2. Materials and Methods
2.1. Yeast Strains and Growth Conditions
2.2. RNA Extraction and Microarray Analysis
2.3. Data Analysis
3. Results
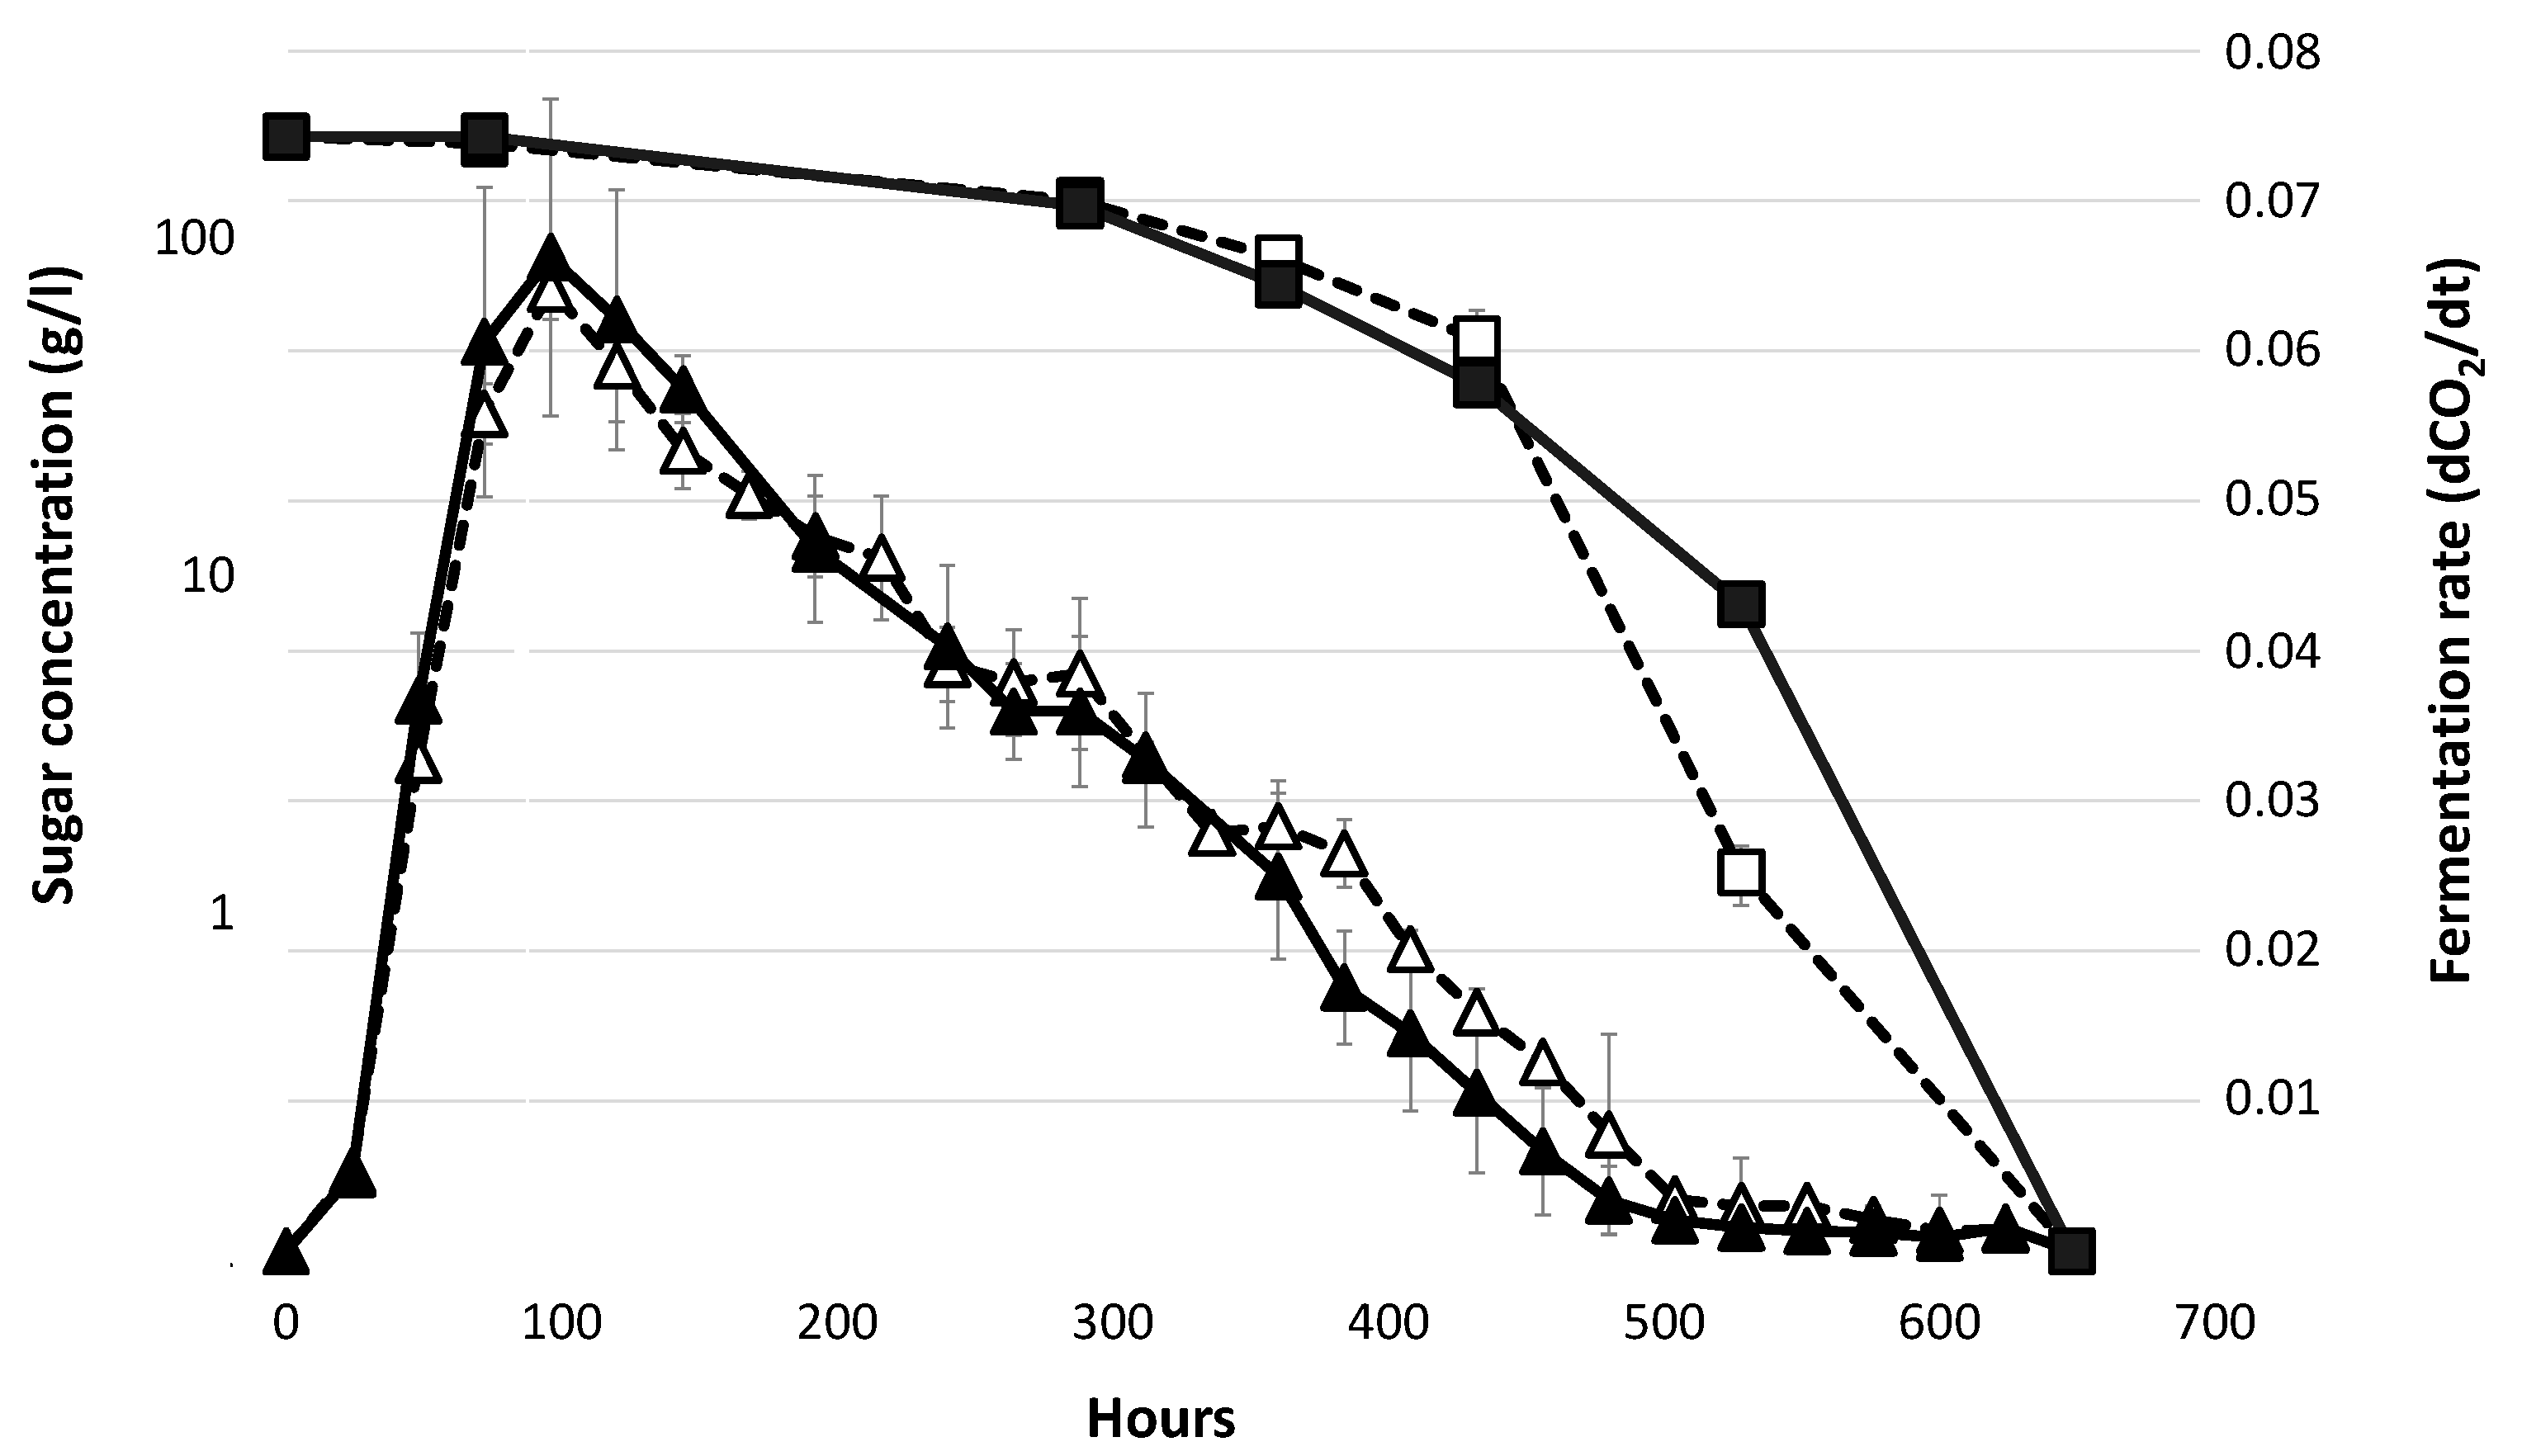
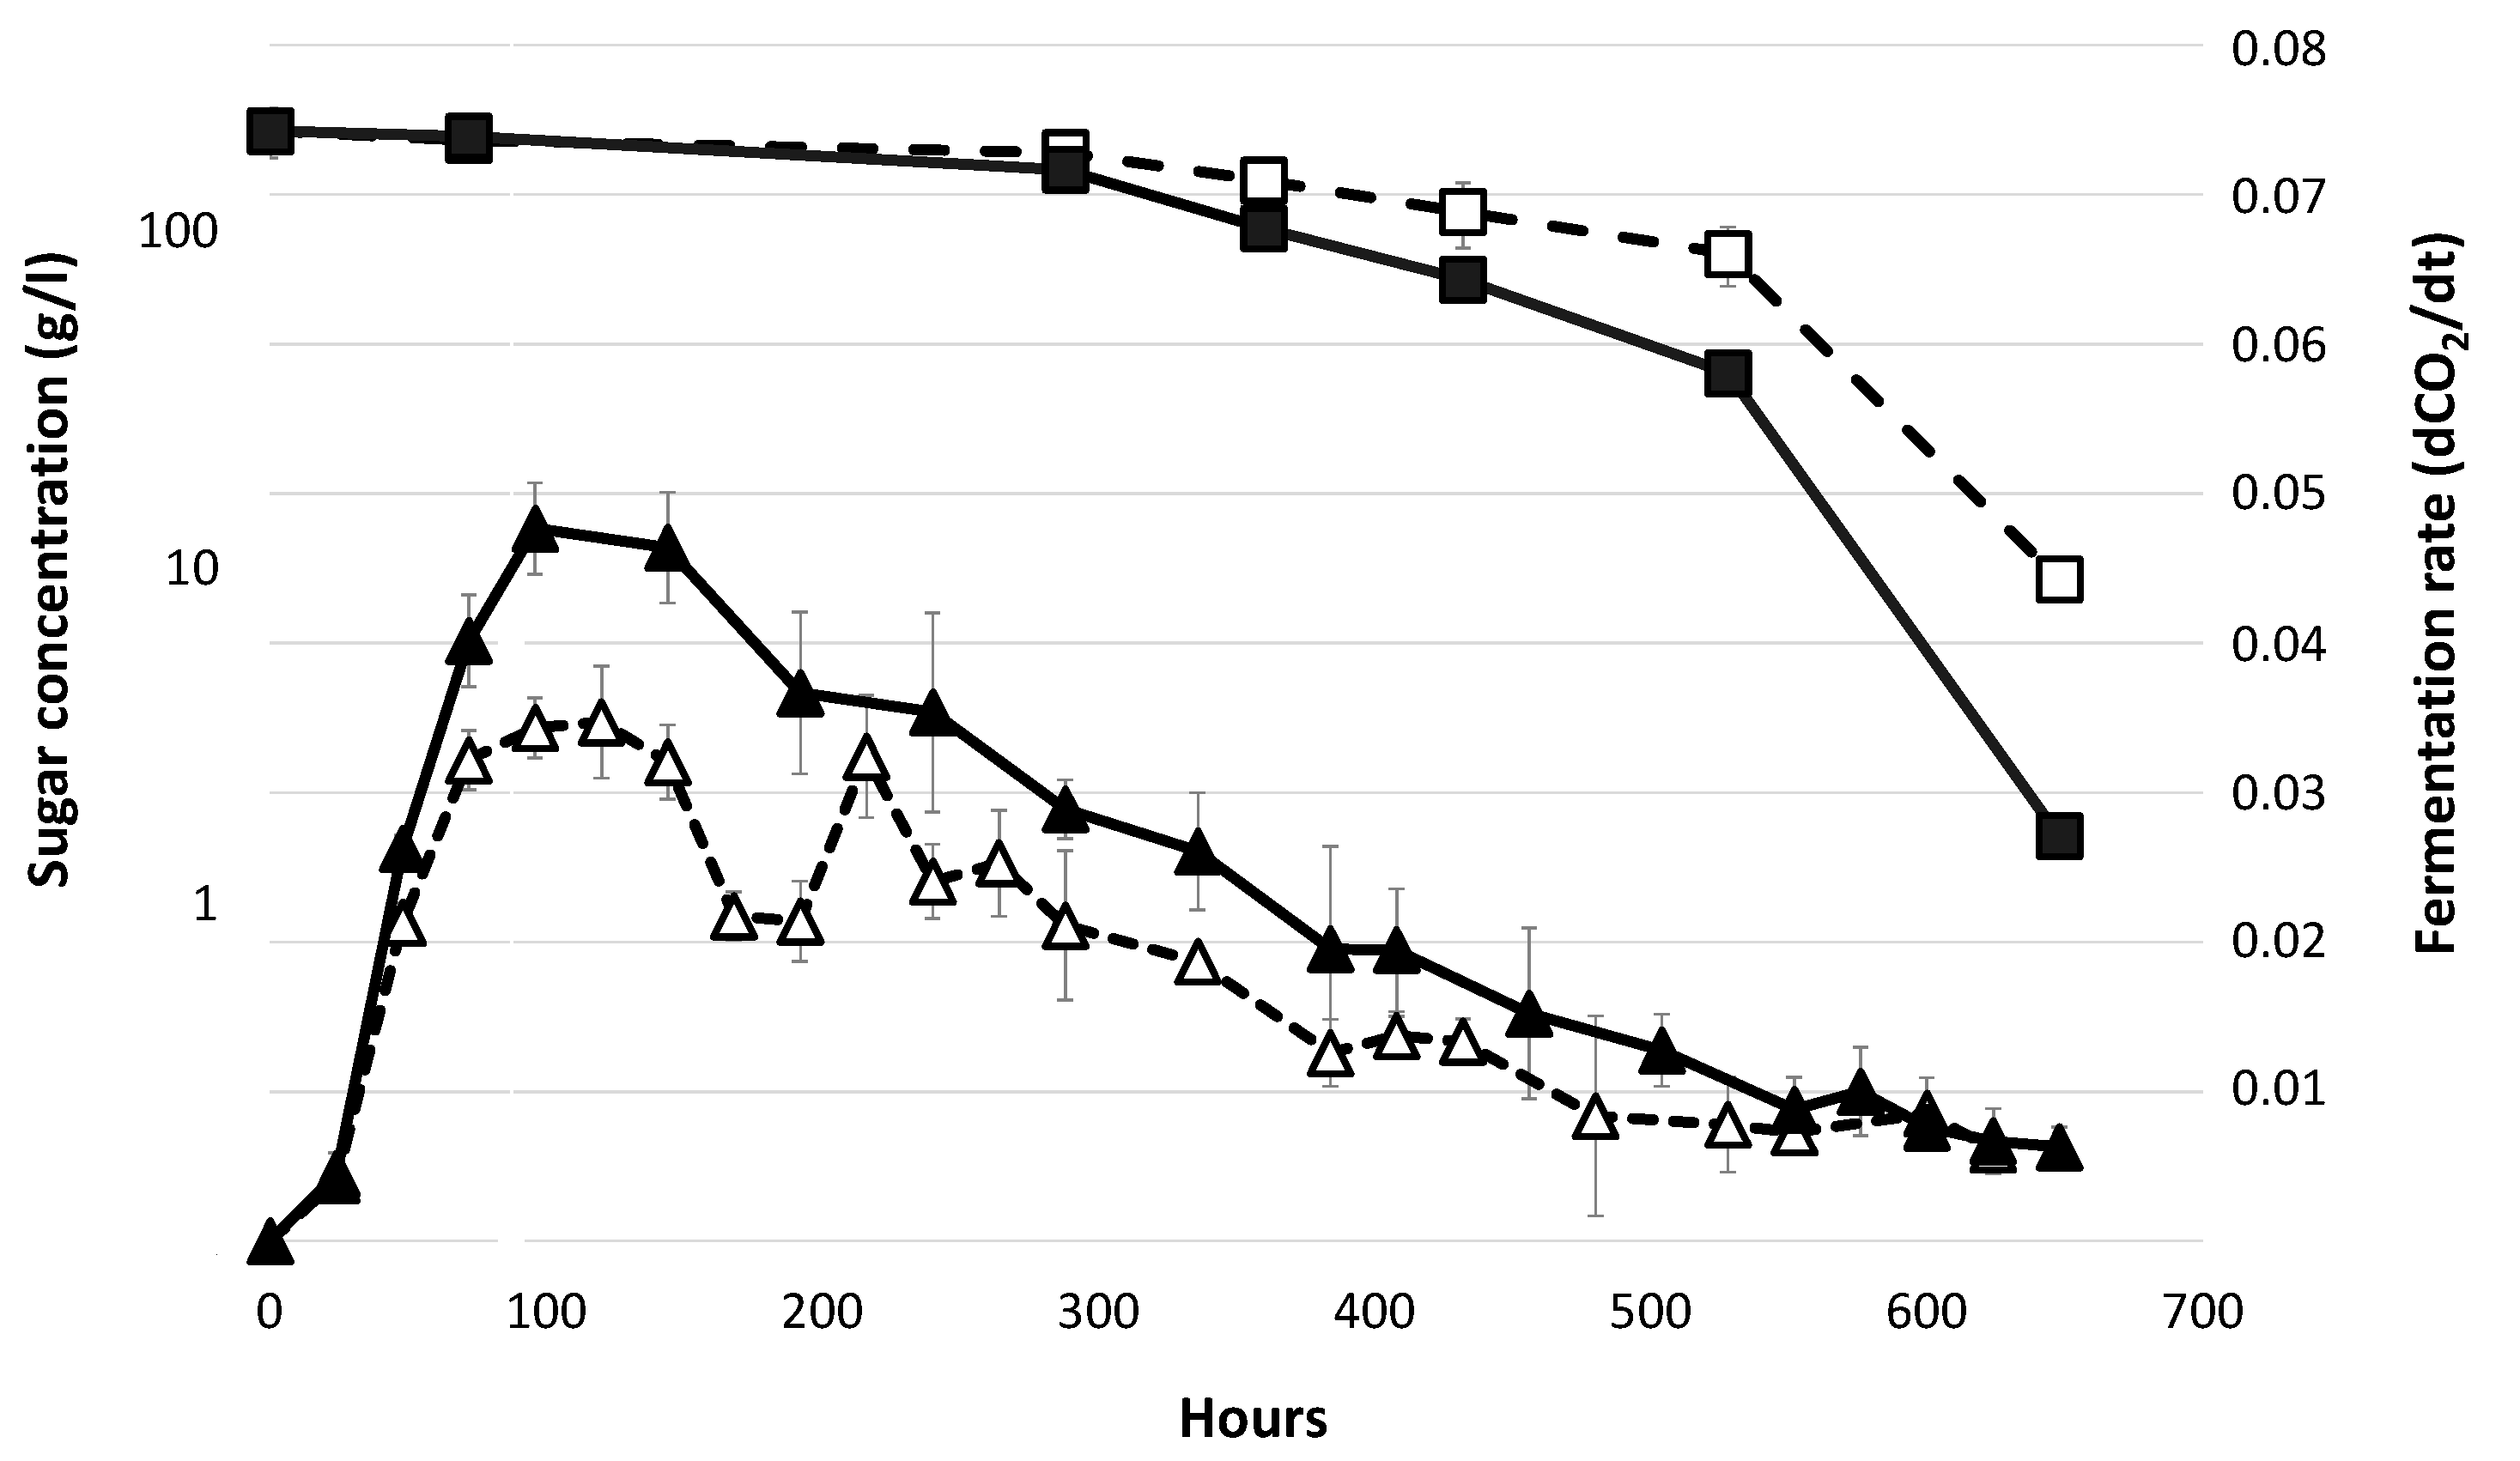
3.1. Fermentation Profiles in Absence of Lipid Supplementation.
3.2. Transcriptomic Response during Fermentation in Absence of Lipid Supplementation
3.3. Differences in the Transcriptomic Response of M25 and EC1118 during Growth in Absence of Oleic Acid and Ergosterol Supplementation
4. Discussion
5. Conclusions
Supplementary Materials
Author Contributions
Funding
Conflicts of Interest
References
- Hohmann, S. An integrated view on a eukaryotic osmoregulation system. Curr. Genet. 2015, 61, 373–382. [Google Scholar] [CrossRef] [PubMed]
- Cutler, N.S.; Pan, X.; Heitman, J.; Cardenas, M.E. The TOR signal transduction cascade controls cellular differentiation in response to nutrients. Mol. Biol. Cell 2001, 12, 4103–4113. [Google Scholar] [CrossRef] [PubMed]
- Zara, G.; Budroni, M.; Mannazzu, I.; Zara, S. Air-liquid biofilm formation is dependent on ammonium depletion in a Saccharomyces cerevisiae flor strain. Yeast 2011, 28, 809–814. [Google Scholar] [CrossRef] [PubMed]
- Landolfo, S.; Politi, H.; Angelozzi, D.; Mannazzu, I. ROS accumulation and oxidative damage to cell structures in Saccharomyces cerevisiae wine strains during fermentation of high-sugar-containing medium. Biochim. Biophys. Acta 2008, 1780, 892–898. [Google Scholar] [CrossRef] [PubMed]
- Morano, K.A.; Grant, C.M.; Moye-Rowley, W.S. The response to heat shock and oxidative stress in Saccharomyces cerevisiae. Genetics 2012, 190, 1157–1195. [Google Scholar] [CrossRef] [PubMed]
- Verghese, J.; Abrams, J.; Wang, Y.; Morano, K.A. Biology of the heat shock response and protein chaperones: Budding yeast (Saccharomyces cerevisiae) as a model system. Microbiol. Mol. Biol. Rev. MMBR 2012, 76, 115–158. [Google Scholar] [CrossRef]
- Sahara, T.; Goda, T.; Ohgiya, S. Comprehensive expression analysis of time-dependent genetic responses in yeast cells to low temperature. J. Biol. Chem. 2002, 277, 50015–50021. [Google Scholar] [CrossRef]
- Heinisch, J.J.; Rodicio, R. Stress responses in wine yeast. In Biology of Microorganisms on Grapes, in Must and in Wine; König, H., Unden, G., Fröhlich, J., Eds.; Springer International Publishing: Cham, Switzerland, 2017; pp. 377–395. ISBN 978-3-319-60021-5. [Google Scholar]
- Henderson, C.M.; Block, D.E. Examining the Role of Membrane Lipid Composition in Determining the Ethanol Tolerance of Saccharomyces cerevisiae. Appl. Environ. Microbiol. 2014, 80, 2966–2972. [Google Scholar] [CrossRef]
- Klug, L.; Daum, G. Yeast lipid metabolism at a glance. FEMS Yeast Res. 2014, 14, 369–388. [Google Scholar] [CrossRef] [Green Version]
- Luparia, V.; Soubeyrand, V.; Berges, T.; Julien, A.; Salmon, J.-M. Assimilation of grape phytosterols by Saccharomyces cerevisiae and their impact on enological fermentations. Appl. Microbiol. Biotechnol. 2004, 65, 25–32. [Google Scholar] [CrossRef]
- Duan, L.L.; Shi, Y.; Jiang, R.; Yang, Q.; Wang, Y.Q.; Liu, P.T.; Duan, C.Q.; Yan, G.L. Effects of adding unsaturated fatty acids on fatty acid composition of Saccharomyces cerevisiae and major volatile compounds in wine. S. Afr. J. Enol. Vitic. 2015, 36, 285–295. [Google Scholar] [CrossRef]
- Valero, E.; Millan, M.C.; Mauricio, J.C.; Ortega, J.M. Effect of grape skin maceration on sterol, phospholipid, and fatty acid contents of Saccharomyces cerevisiae during alcoholic fermentation. Am. J. Enol. Vitic. 1998, 49, 119–124. [Google Scholar]
- Aceituno, F.F.; Orellana, M.; Torres, J.; Mendoza, S.; Slater, A.W.; Melo, F.; Agosin, E. Oxygen response of the wine yeast Saccharomyces cerevisiae EC1118 grown under carbon-sufficient, nitrogen-limited enological conditions. Appl. Environ. Microbiol. 2012, 78, 8340–8352. [Google Scholar] [CrossRef] [PubMed]
- Zara, G.; Bardi, L.; Belviso, S.; Farris, G.A.; Zara, S.; Budroni, M. Correlation between cell lipid content, gene expression and fermentative behaviour of two Saccharomyces cerevisiae wine strains. J. Appl. Microbiol. 2008, 104, 906–914. [Google Scholar] [CrossRef] [PubMed]
- Bely, M.; Sablayrolles, J.M.; Barre, P. Description of alcoholic fermentation kinetics: Its variability and significance. Am. J. Enol. Vitic. 1990, 41, 319–324. [Google Scholar]
- Ausubel, F.M.; Brent, R.; Kingston, R.E.; Moore, D.D.; Seidman, J.G.; Smith, J.A.; Struhl, K. Hot-phenol RNA extraction. In Current Protocols in Molecular Biology; John Wiley and Sons Inc.: New York, NY, USA, 1995. [Google Scholar]
- Causton, H.C.; Ren, B.; Koh, S.S.; Harbison, C.T.; Kanin, E.; Jennings, E.G.; Lee, T.I.; True, H.L.; Lander, E.S.; Young, R.A. Remodeling of yeast genome expression in response to environmental changes. Mol. Biol. Cell 2001, 12, 323–337. [Google Scholar] [CrossRef]
- Jelinsky, S.A.; Samson, L.D. Global response of Saccharomyces cerevisiae to an alkylating agent. Proc. Natl. Acad. Sci. USA 1999, 96, 1486–1491. [Google Scholar] [CrossRef]
- Edgar, R.; Domrachev, M.; Lash, A.E. Gene Expression Omnibus: NCBI gene expression and hybridization array data repository. Nucleic Acids Res. 2002, 30, 207–210. [Google Scholar] [CrossRef] [Green Version]
- Benjamini, Y.; Hochberg, Y. Controlling the False Discovery Rate: A practical and powerful approach to multiple testing. J. R. Stat. Soc. Ser. B Methodol. 1995, 57, 289–300. [Google Scholar] [CrossRef]
- Huang, D.W.; Sherman, B.T.; Lempicki, R.A. Systematic and integrative analysis of large gene lists using DAVID bioinformatics resources. Nat. Protoc. 2009, 4, 44–57. [Google Scholar] [CrossRef]
- Teixeira, M.C.; Monteiro, P.; Jain, P.; Tenreiro, S.; Fernandes, A.R.; Mira, N.P.; Alenquer, M.; Freitas, A.T.; Oliveira, A.L.; Sá-Correia, I. The YEASTRACT database: A tool for the analysis of transcription regulatory associations in Saccharomyces cerevisiae. Nucleic Acids Res. 2006, 34, D446–D451. [Google Scholar] [CrossRef] [PubMed]
- Landolfo, S.; Zara, G.; Zara, S.; Budroni, M.; Ciani, M.; Mannazzu, I. Oleic acid and ergosterol supplementation mitigates oxidative stress in wine strains of Saccharomyces cerevisiae. Int. J. Food Microbiol. 2010, 141, 229–235. [Google Scholar] [CrossRef] [PubMed]
- Bisson, L.F. Stuck and sluggish fermentations. Am. J. Enol. Vitic. 1999, 50, 107–119. [Google Scholar]
- Zara, G.; Angelozzi, D.; Belviso, S.; Bardi, L.; Goffrini, P.; Lodi, T.; Budroni, M.; Mannazzu, I. Oxygen is required to restore flor strain viability and lipid biosynthesis under fermentative conditions. FEMS Yeast Res. 2009, 9, 217–225. [Google Scholar] [CrossRef] [PubMed] [Green Version]
- Tesnière, C.; Delobel, P.; Pradal, M.; Blondin, B. Impact of nutrient imbalance on wine alcoholic fermentations: Nitrogen excess enhances yeast cell death in lipid-limited must. PLoS ONE 2013, 8, e61645. [Google Scholar] [CrossRef] [PubMed]
- Kennedy, M.A.; Barbuch, R.; Bard, M. Transcriptional regulation of the squalene synthase gene (ERG9) in the yeast Saccharomyces cerevisiae. Biochim. Biophys. Acta 1999, 1445, 110–122. [Google Scholar] [CrossRef]
- Hickman, M.J.; Spatt, D.; Winston, F. The Hog1 mitogen-activated protein kinase mediates a hypoxic response in Saccharomyces cerevisiae. Genetics 2011, 188, 325–338. [Google Scholar] [CrossRef] [PubMed]
- Davies, B.S.J.; Wang, H.S.; Rine, J. Dual activators of the sterol biosynthetic pathway of Saccharomyces cerevisiae: Similar activation/regulatory domains but different response mechanisms. Mol. Cell. Biol. 2005, 25, 7375–7385. [Google Scholar] [CrossRef]
- Hughes, A.L.; Todd, B.L.; Espenshade, P.J. SREBP pathway responds to sterols and functions as an oxygen sensor in fission yeast. Cell 2005, 120, 831–842. [Google Scholar] [CrossRef]
- Wilcox, L.J.; Balderes, D.A.; Wharton, B.; Tinkelenberg, A.H.; Rao, G.; Sturley, S.L. Transcriptional profiling identifies two members of the ATP-binding cassette transporter superfamily required for sterol uptake in yeast. J. Biol. Chem. 2002, 277, 32466–32472. [Google Scholar] [CrossRef]
- Davies, B.S.J.; Rine, J. A role for sterol levels in oxygen sensing in Saccharomyces cerevisiae. Genetics 2006, 174, 191–201. [Google Scholar] [CrossRef] [PubMed]
- Todd, B.L.; Stewart, E.V.; Burg, J.S.; Hughes, A.L.; Espenshade, P.J. Sterol regulatory element binding protein is a principal regulator of anaerobic gene expression in fission yeast. Mol. Cell. Biol. 2006, 26, 2817–2831. [Google Scholar] [CrossRef] [PubMed]
- Luo, Z.; van Vuuren, H.J.J. Functional analyses of PAU genes in Saccharomyces cerevisiae. Microbiology 2009, 155, 4036–4049. [Google Scholar] [CrossRef] [PubMed]
- Abramova, N.E.; Cohen, B.D.; Sertil, O.; Kapoor, R.; Davies, K.J.; Lowry, C.V. Regulatory mechanisms controlling expression of the DAN/TIR mannoprotein genes during anaerobic remodeling of the cell wall in Saccharomyces cerevisiae. Genetics 2001, 157, 1169–1177. [Google Scholar] [PubMed]
- Rossignol, T.; Dulau, L.; Julien, A.; Blondin, B. Genome-wide monitoring of wine yeast gene expression during alcoholic fermentation. Yeast 2003, 20, 1369–1385. [Google Scholar] [CrossRef] [PubMed]
- Marks, V.D.; Ho Sui, S.J.; Erasmus, D.; van der Merwe, G.K.; Brumm, J.; Wasserman, W.W.; Bryan, J.; van Vuuren, H.J.J. Dynamics of the yeast transcriptome during wine fermentation reveals a novel fermentation stress response. FEMS Yeast Res. 2008, 8, 35–52. [Google Scholar] [CrossRef] [PubMed] [Green Version]
- Rachidi, N.; Martinez, M.J.; Barre, P.; Blondin, B. Saccharomyces cerevisiae PAU genes are induced by anaerobiosis. Mol. Microbiol. 2000, 35, 1421–1430. [Google Scholar] [CrossRef] [PubMed]
- Plakunov, V.K.; Shelemekh, O.V. Mechanisms of oxygen regulation in microorganisms. Microbiology 2009, 78, 535–546. [Google Scholar] [CrossRef]
- Klinkenberg, L.G.; Mennella, T.A.; Luetkenhaus, K.; Zitomer, R.S. Combinatorial repression of the hypoxic genes of Saccharomyces cerevisiae by DNA binding proteins Rox1 and Mot3. Eukaryot. Cell 2005, 4, 649–660. [Google Scholar] [CrossRef]
- Sertil, O.; Kapoor, R.; Cohen, B.D.; Abramova, N.; Lowry, C.V. Synergistic repression of anaerobic genes by Mot3 and Rox1 in Saccharomyces cerevisiae. Nucleic Acids Res. 2003, 31, 5831–5837. [Google Scholar] [CrossRef]
- Hickman, M.J.; Winston, F. Heme levels switch the function of Hap1 of Saccharomyces cerevisiae between transcriptional activator and transcriptional repressor. Mol. Cell. Biol. 2007, 27, 7414–7424. [Google Scholar] [CrossRef]
- Auesukaree, C. Molecular mechanisms of the yeast adaptive response and tolerance to stresses encountered during ethanol fermentation. J. Biosci. Bioeng. 2017, 124, 133–142. [Google Scholar] [CrossRef]
- Sales, K.; Brandt, W.; Rumbak, E.; Lindsey, G. The LEA-like protein HSP12 in Saccharomyces cerevisiae has a plasma membrane location and protects membranes against desiccation and ethanol-induced stress. Biochim. Biophys. Acta 2000, 1463, 267–278. [Google Scholar] [CrossRef]
- Shobayashi, M.; Mitsueda, S.; Ago, M.; Fujii, T.; Iwashita, K.; Iefuji, H. Effects of culture conditions on ergosterol biosynthesis by Saccharomyces cerevisiae. Biosci. Biotechnol. Biochem. 2005, 69, 2381–2388. [Google Scholar] [CrossRef]
- Burke, P.V.; Raitt, D.C.; Allen, L.A.; Kellogg, E.A.; Poyton, R.O. Effects of oxygen concentration on the expression of cytochrome c and cytochrome c oxidase genes in yeast. J. Biol. Chem. 1997, 272, 14705–14712. [Google Scholar] [CrossRef]
- Liu, J.; Barrientos, A. Transcriptional regulation of yeast oxidative phosphorylation hypoxic genes by oxidative stress. Antioxid. Redox Signal. 2013, 19, 1916–1927. [Google Scholar] [CrossRef]
- Rosenfeld, E.; Beauvoit, B.; Blondin, B.; Salmon, J.-M. Oxygen consumption by anaerobic Saccharomyces cerevisiae under enological conditions: Effect on fermentation kinetics. Appl. Environ. Microbiol. 2003, 69, 113–121. [Google Scholar] [CrossRef]
- Abe, F. Induction of DAN/TIR yeast cell wall mannoprotein genes in response to high hydrostatic pressure and low temperature. FEBS Lett. 2007, 581, 4993–4998. [Google Scholar] [CrossRef]
- López-Malo, M.; García-Rios, E.; Melgar, B.; Sanchez, M.R.; Dunham, M.J.; Guillamón, J.M. Evolutionary engineering of a wine yeast strain revealed a key role of inositol and mannoprotein metabolism during low-temperature fermentation. BMC Genom. 2015, 16, 537. [Google Scholar]
- Chiva, R.; López-Malo, M.; Salvadó, Z.; Mas, A.; Guillamón, J.M. Analysis of low temperature-induced genes (LTIG) in wine yeast during alcoholic fermentation. FEMS Yeast Res. 2012, 12, 831–843. [Google Scholar] [CrossRef] [Green Version]
- Kwast, K.E.; Burke, P.V.; Poyton, R.O. Oxygen sensing and the transcriptional regulation of oxygen-responsive genes in yeast. J. Exp. Biol. 1998, 201, 1177–1195. [Google Scholar] [PubMed]
- Luo, S.; Levine, R.L. Methionine in proteins defends against oxidative stress. FASEB J. Off. Publ. Fed. Am. Soc. Exp. Biol. 2009, 23, 464–472. [Google Scholar] [CrossRef] [PubMed]
- Schindeldecker, M.; Moosmann, B. Protein-borne methionine residues as structural antioxidants in mitochondria. Amino Acids 2015, 47, 1421–1432. [Google Scholar] [CrossRef] [PubMed]
- Aranda, A.; del Olmo, M. Exposure of Saccharomyces cerevisiae to acetaldehyde induces sulfur amino acid metabolism and polyamine transporter genes, which depend on Met4p and Haa1p transcription factors, respectively. Appl. Environ. Microbiol. 2004, 70, 1913–1922. [Google Scholar] [CrossRef] [PubMed]
- Zara, G.; Mannazzu, I.; Sanna, M.L.; Orro, D.; Farris, G.A.; Budroni, M. Exploitation of the semi-homothallic life cycle of Saccharomyces cerevisiae for the development of breeding strategies. FEMS Yeast Res. 2008, 8, 1147–1154. [Google Scholar] [CrossRef]
- Li, E.; de Orduña, R.M. Evaluation of the acetaldehyde production and degradation potential of 26 enological Saccharomyces and non-Saccharomyces yeast strains in a resting cell model system. J. Ind. Microbiol. Biotechnol. 2011, 38, 1391–1398. [Google Scholar] [CrossRef] [PubMed]


| Sample | Medium | Maximum Population Size (107 cell/mL) | Growth Rate (h−1) | Area under Curve |
|---|---|---|---|---|
| M25 | SJ | 1.230 a ± 0.16 | 0.094 a ± 0.05 | 236.09 a ± 12.01 |
| FSJ | 1.406 c ± 0.22 | 0.156 b ± 0.11 | 275.02 b ± 20.12 | |
| EC1118 | SJ | 1.366 b ± 0.25 | 0.351 c ± 0.29 | 267.91 b ± 19.84 |
| FSJ | 1.383 b ± 0.18 | 0.298 c ± 0.25 | 270.73 b ± 15.71 |
| Functional Groups Upregulated in SJ | ||||
| Annotation Cluster 1 | Enrichment Score: 9.36 | Count | p_Value | Benjamini |
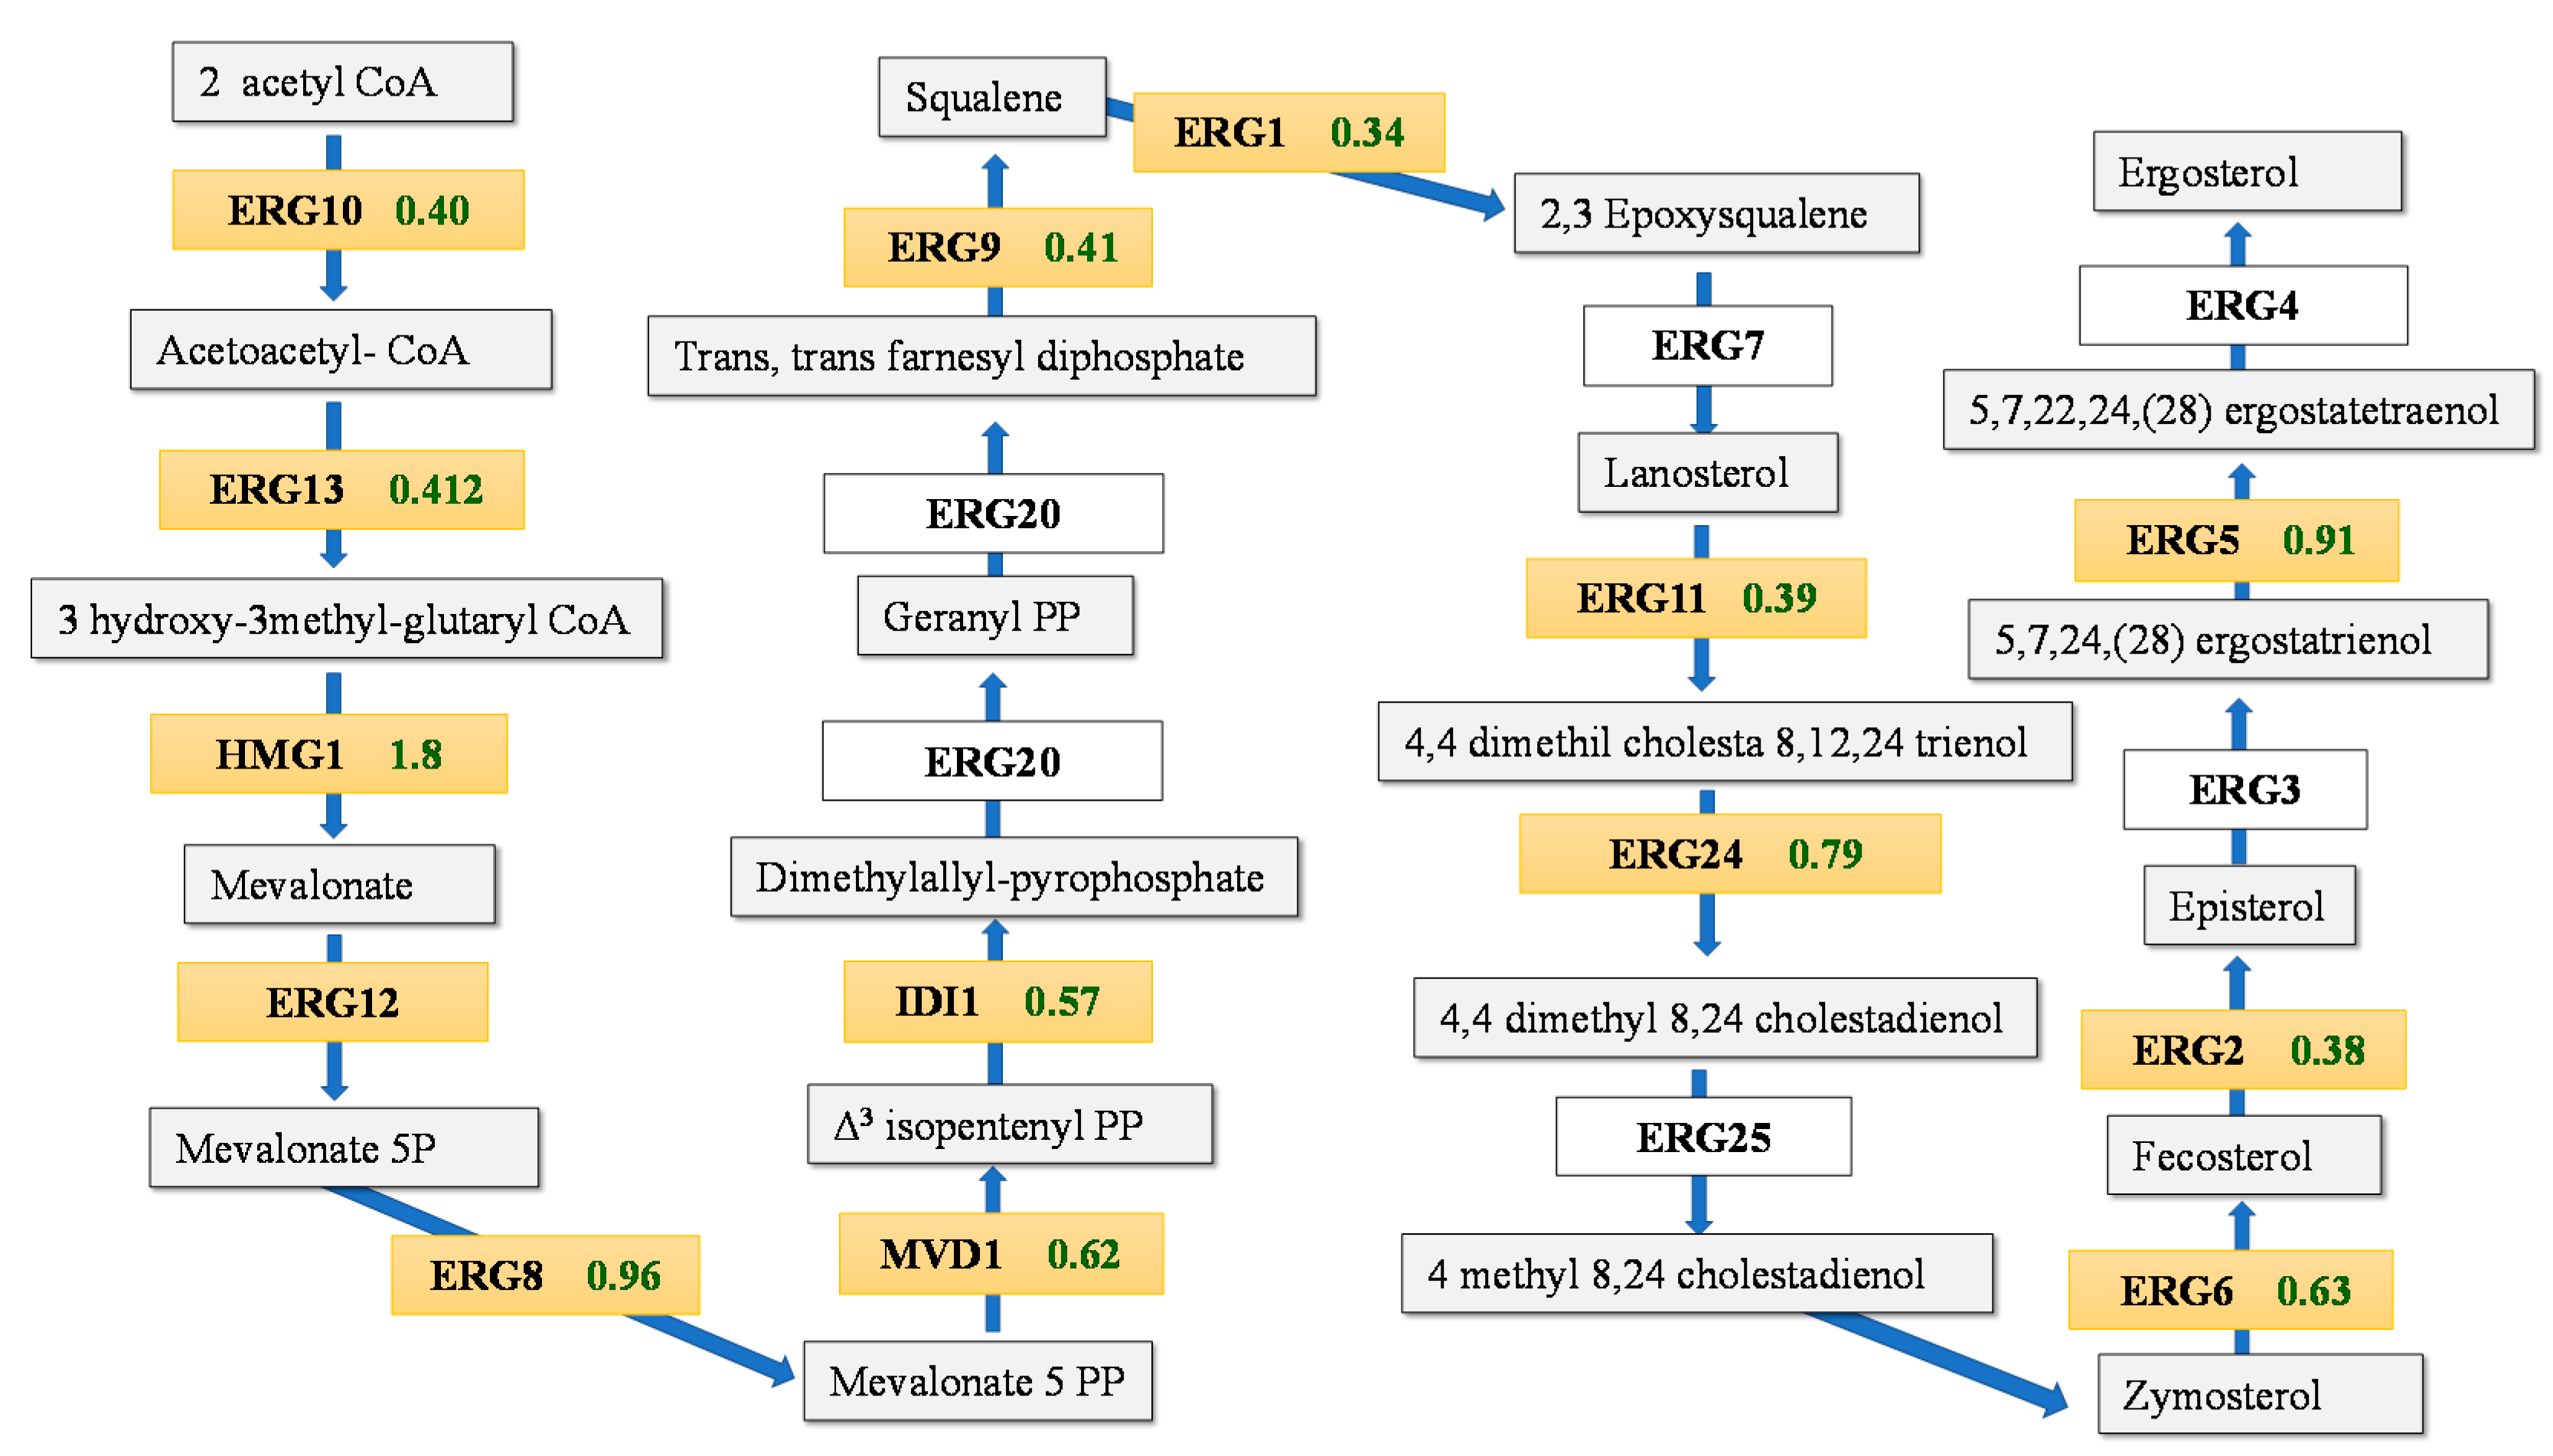
| GOTERM_BP_DIRECT | ergosterol biosynthetic process | 13 | 3.9 × 10⁻¹⁵ | 5.4 × 10⁻¹³ |
| UP_KEYWORDS | Sterol biosynthesis | 12 | 1.3 × 10⁻¹³ | 1.7 × 10⁻¹¹ |
| KEGG_PATHWAY | Steroid biosynthesis | 8 | 8.2 × 10⁻⁹ | 2.5 × 10⁻⁷ |
| UP_KEYWORDS | Lipid biosynthesis | 13 | 7.6 × 10⁻⁸ | 3.4 × 10⁻⁶ |
| GOTERM_BP_DIRECT | lipid metabolic process | 14 | 7.0 × 10⁻⁶ | 2.7 × 10⁻⁴ |
| UP_KEYWORDS | Lipid metabolism | 14 | 8.3 × 10⁻⁶ | 2.8 × 10⁻⁴ |
| Annotation Cluster 2 | Enrichment Score: 6.41 | Count | p_Value | Benjamini |
| GOTERM_BP_DIRECT | oxidation-reduction process | 24 | 1.6 × 10⁻⁷ | 7.0 × 10⁻⁶ |
| UP_KEYWORDS | Oxidoreductase | 17 | 8.5 × 10⁻⁵ | 1.6 × 10⁻³ |
| GOTERM_MF_DIRECT | oxidoreductase activity | 17 | 2.2 × 10⁻⁴ | 1.3 × 10⁻² |
| Annotation Cluster 3 | Enrichment Score: 3.51 | Count | p_Value | Benjamini |
| GOTERM_BP_DIRECT | response to stress | 11 | 1.0 × 10⁻⁸ | 5.4 × 10⁻⁷ |
| GOTERM_MF_DIRECT | structural constituent of cell wall | 9 | 2.5 × 10⁻⁶ | 4.6 × 10⁻⁴ |
| GOTERM_BP_DIRECT | fungal-type cell wall organization | 10 | 1.6 × 10⁻³ | 5.2 × 10⁻² |
| GOTERM_CC_DIRECT | fungal-type cell wall | 9 | 1.8 × 10⁻³ | 3.3 × 10⁻² |
| Annotation Cluster 4 | Enrichment Score: 3 | Count | p_Value | Benjamini |
| UP_KEYWORDS | Heme | 7 | 7.4 × 10⁻⁵ | 2.0 × 10⁻³ |
| GOTERM_MF_DIRECT | heme binding | 6 | 2.1 × 10⁻⁴ | 1.9 × 10⁻² |
| Annotation Cluster 5 | Enrichment Score: 2.44 | Count | p_Value | Benjamini |
| UP_KEYWORDS | Electron transport | 7 | 4.5 × 10⁻⁴ | 7.5 × 10⁻³ |
| GOTERM_BP_DIRECT | mitochondrial electron transport, ubiquinol to cytochrome c | 4 | 1.8 × 10⁻³ | 5.3 × 10⁻² |
| GOTERM_CC_DIRECT | respiratory chain | 4 | 3.5 × 10⁻³ | 5.3 × 10⁻² |
| Functional Groups Downregulated in SJ | ||||
| Annotation Cluster 6 | Enrichment Score: 2.46 | Count | p_Value | Benjamini |
| GOTERM_BP_DIRECT | cytoplasmic translation | 11 | 2.5 × 10⁻⁴ | 6.7 × 10⁻² |
| GOTERM_CC_DIRECT | intracellular ribonucleoprotein complex | 14 | 4.5 × 10⁻⁴ | 4.2 × 10⁻² |
| UP_KEYWORDS | Ribonucleoprotein | 14 | 5.0 × 10⁻⁴ | 6.3 × 10⁻² |
| GOTERM_CC_DIRECT | cytosolic large ribosomal subunit | 8 | 9.0 × 10⁻⁴ | 4.2 × 10⁻² |
| Annotation Cluster 7 | Enrichment Score: 2.21 | Count | p_Value | Benjamini |
| UP_KEYWORDS | Purine biosynthesis | 4 | 2.2 × 10⁻³ | 5.6 × 10⁻² |
| GOTERM_BP_DIRECT | purine nucleotide biosynthetic process | 4 | 2.4 × 10⁻³ | 2.8 × 10⁻¹ |
| Upregulated ORFs | |||
| Transcription Factors | % in user set | % in Yeastract | p-value |
| Sfp1p | 85.37% | 2.42% | 4.45 × 10⁻¹⁰ |
| Hap1p | 39.84% | 14.08% | 1.03 × 10⁻¹⁵ |
| Rox1p | 30.08% | 4.10% | 6.82 × 10⁻⁸ |
| Mot3p | 26.02% | 5.43% | 5.86 × 10⁻¹⁰ |
| Ecm22p | 23.58% | 5.45% | 3.75 × 10⁻⁹ |
| Upc2p | 21.95% | 8.49% | 3.80 × 10⁻¹³ |
| Downregulated ORFs | |||
| Transcription Factors | % in user set | % in Yeastract | p-value |
| Sfp1p | 83.15% | 1.71% | 1.17 × 10⁻⁶ |
| Yap1p | 73.03% | 1.88% | 6.025 × 10⁻⁷ |
| Gcn4p | 70.79% | 2.10% | 8.73 × 10⁻⁹ |
| Annotation Cluster 1 | Enrichment Score: 4.43 | Count | p_Value | Benjamini |
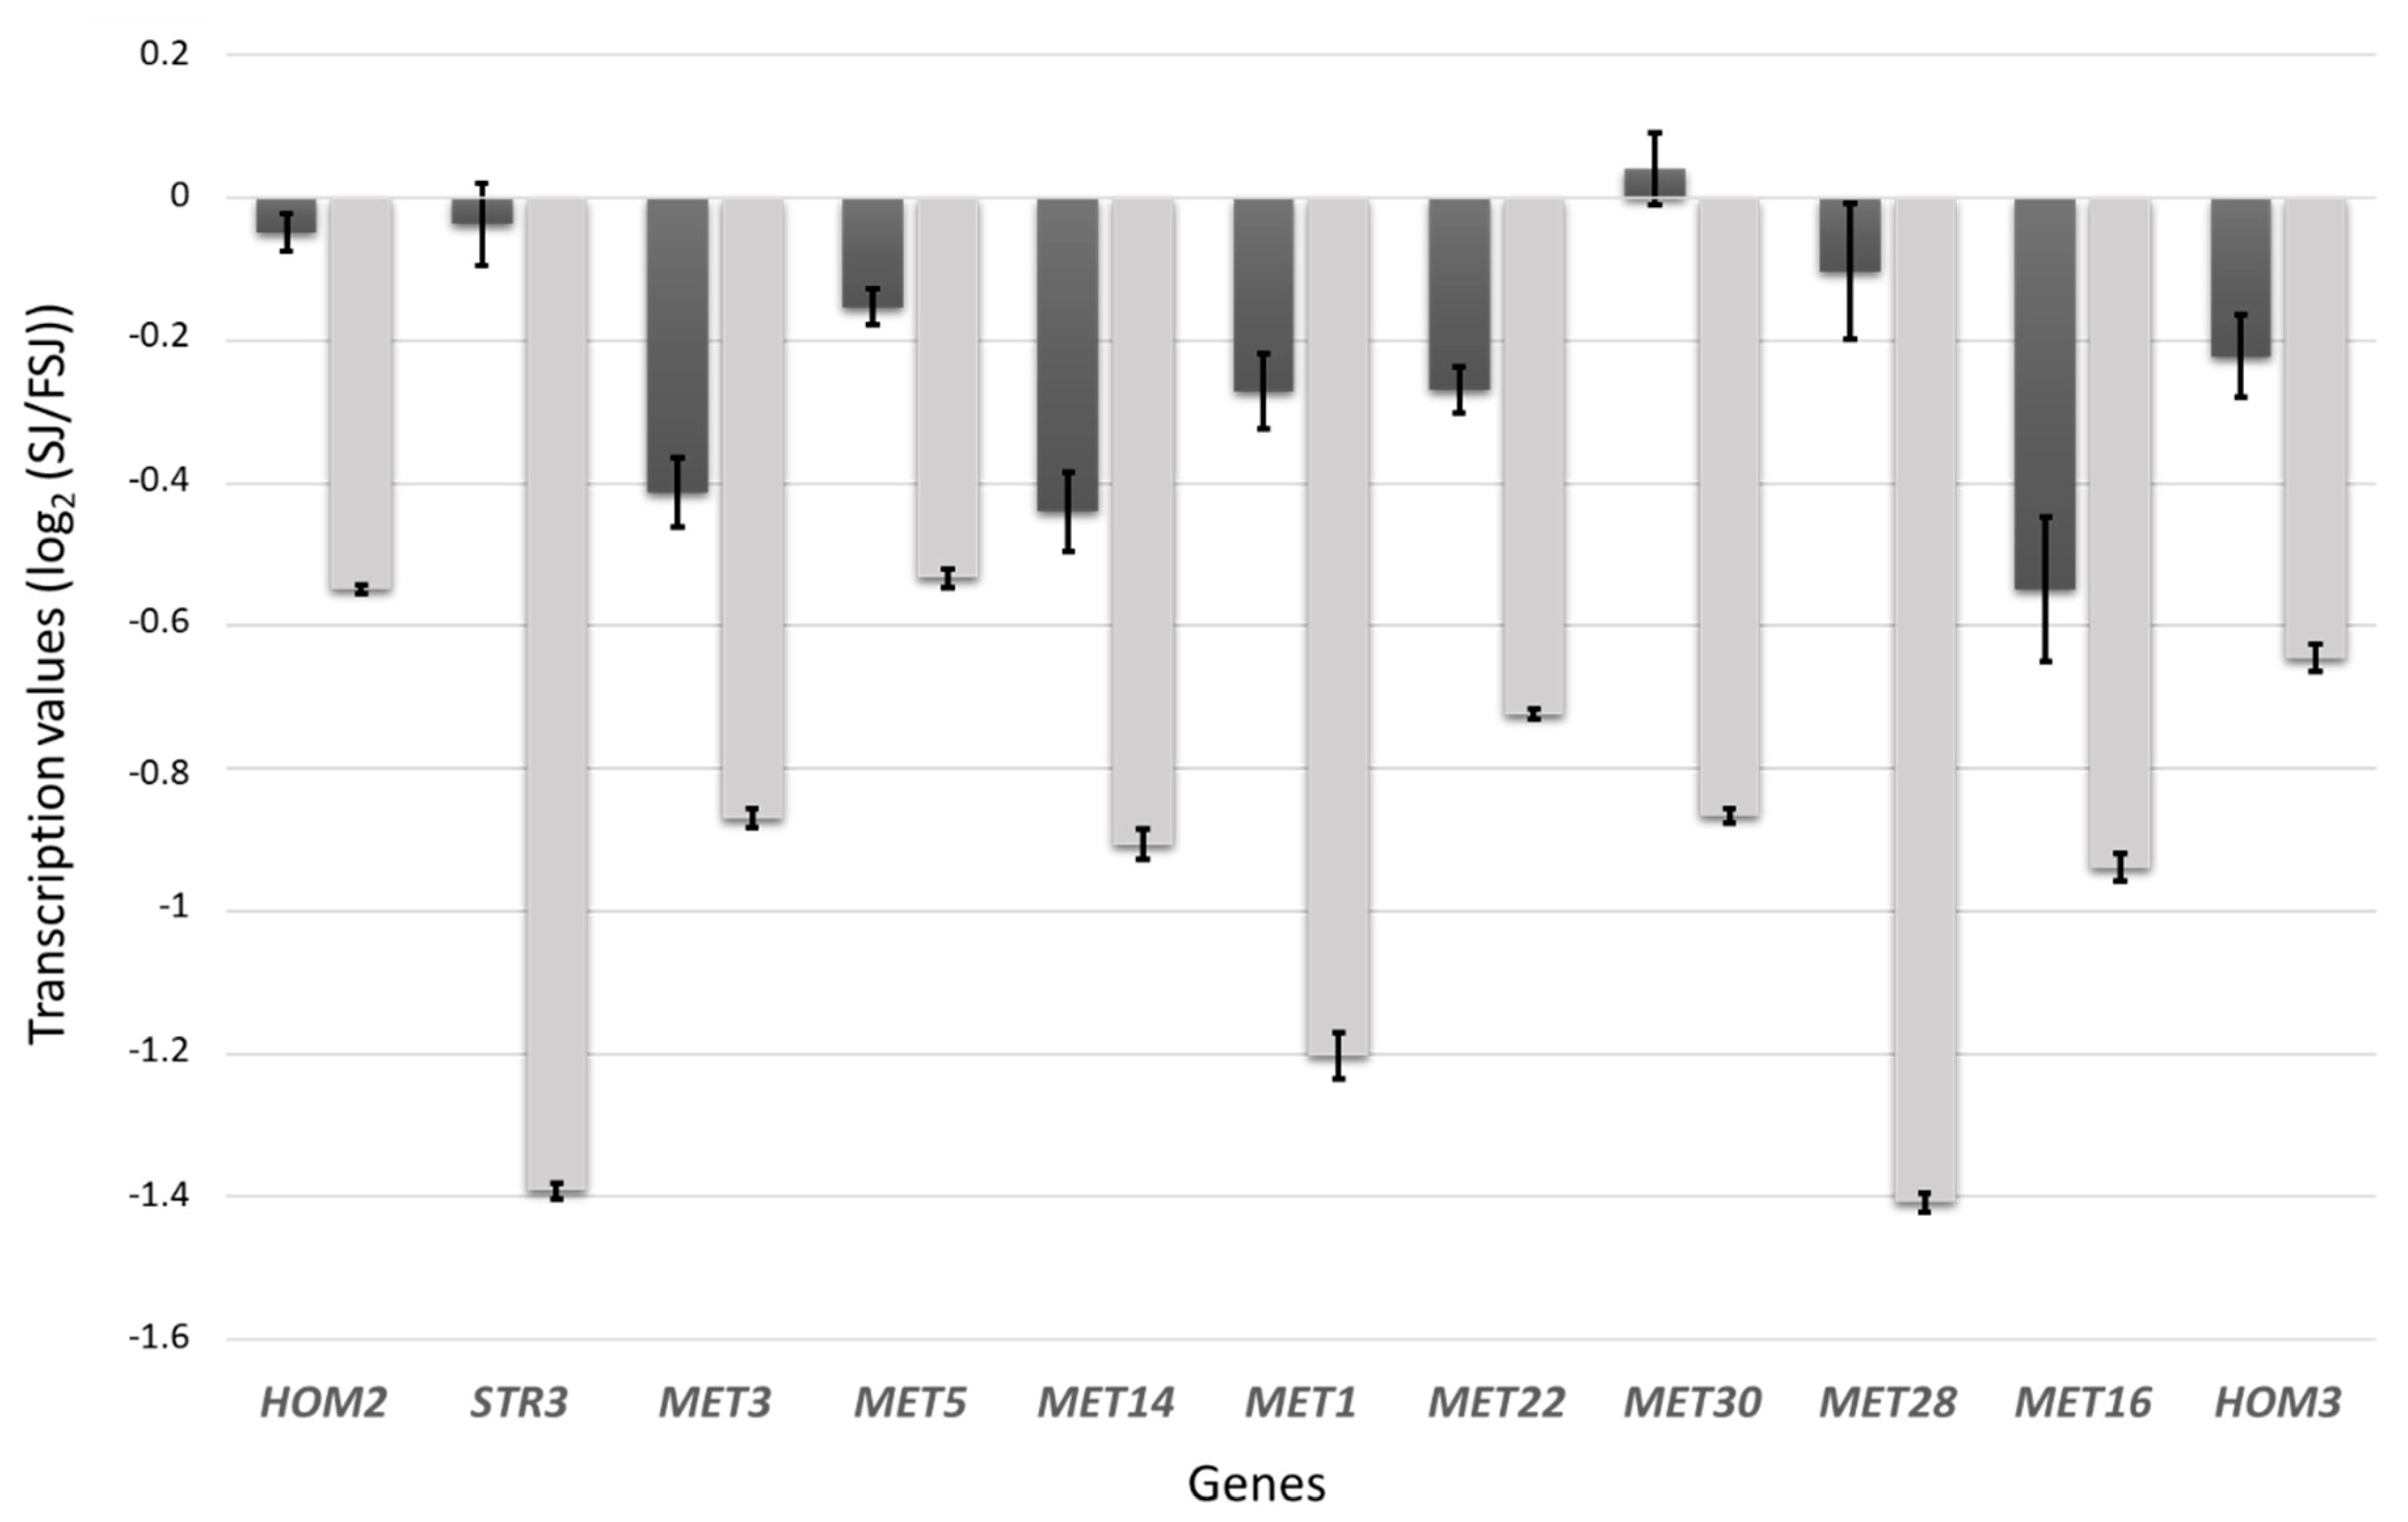
| GOTERM_BP_DIRECT | cellular amino acid biosynthetic process | 23 | 7.5 × 10⁻⁹ | 2.6 × 10⁻⁶ |
| GOTERM_BP_DIRECT | methionine biosynthetic process | 11 | 5.4 × 10⁻⁷ | 1.2 × 10⁻⁴ |
| UP_KEYWORDS | Cysteine biosynthesis | 6 | 1.9 × 10⁻⁴ | 1.2 × 10⁻² |
| KEGG_PATHWAY | Sulfur metabolism | 5 | 4.7 × 10⁻³ | 6.1 × 10⁻² |
| Annotation Cluster 2 | Enrichment Score: 3.7 | Count | p_Value | Benjamini |
| INTERPRO | Stress-induced protein SRP1/TIP1 | 16 | 6.4 × 10⁻¹¹ | 3.9 × 10⁻⁸ |
| GOTERM_BP_DIRECT | response to stress | 17 | 7.3 × 10⁻¹⁰ | 5.1 × 10⁻⁷ |
| GOTERM_MF_DIRECT | structural constituent of cell wall | 17 | 1.3 × 10⁻⁹ | 5.4 × 10⁻⁷ |
| GOTERM_CC_DIRECT | fungal-type cell wall | 24 | 2.4 × 10⁻⁸ | 4.3 × 10⁻⁶ |
| GOTERM_BP_DIRECT | fungal-type cell wall organization | 23 | 6.3 × 10⁻⁶ | 1.1 × 10⁻³ |
| UP_KEYWORDS | Cell wall | 13 | 2.1 × 10⁻⁴ | 1.1 × 10⁻² |
| GOTERM_CC_DIRECT | cell wall | 13 | 2.3 × 10⁻⁴ | 2.0 × 10⁻² |
| Annotation Cluster 3 | Enrichment Score: 2.66 | Count | p_Value | Benjamini |
| UP_SEQ_FEATURE | transit peptide:Mitochondrion | 34 | 5.8 × 10⁻⁴ | 1.2 × 10⁻¹ |
| UP_KEYWORDS | Mitochondrion | 62 | 2.3 × 10⁻³ | 4.2 × 10⁻² |
| Annotation Cluster 7 | Enrichment Score: 2.25 | Count | p_Value | Benjamini |
| UP_KEYWORDS | Arginine biosynthesis | 5 | 9.7 × 10⁻⁴ | 2.4 × 10⁻² |
| Annotation Cluster 8 | Enrichment Score: 1.79 | Count | p_Value | Benjamini |
| GOTERM_CC_DIRECT | integral component of plasma membrane | 18 | 2.8 × 10⁻⁴ | 1.6 × 10⁻² |
© 2019 by the authors. Licensee MDPI, Basel, Switzerland. This article is an open access article distributed under the terms and conditions of the Creative Commons Attribution (CC BY) license (http://creativecommons.org/licenses/by/4.0/).
Share and Cite
Zara, G.; van Vuuren, H.J.J.; Mannazzu, I.; Zara, S.; Budroni, M. Transcriptomic Response of Saccharomyces cerevisiae during Fermentation under Oleic Acid and Ergosterol Depletion. Fermentation 2019, 5, 57. https://doi.org/10.3390/fermentation5030057
Zara G, van Vuuren HJJ, Mannazzu I, Zara S, Budroni M. Transcriptomic Response of Saccharomyces cerevisiae during Fermentation under Oleic Acid and Ergosterol Depletion. Fermentation. 2019; 5(3):57. https://doi.org/10.3390/fermentation5030057
Chicago/Turabian StyleZara, Giacomo, Hennie J. J. van Vuuren, Ilaria Mannazzu, Severino Zara, and Marilena Budroni. 2019. "Transcriptomic Response of Saccharomyces cerevisiae during Fermentation under Oleic Acid and Ergosterol Depletion" Fermentation 5, no. 3: 57. https://doi.org/10.3390/fermentation5030057