Article

Development of a Novel Approach for Controlling and Predicting Residual Sugars in Wines

1
Chemical Engineering Department, Ariel University, Ariel 40700, Israel
2
Eastern Regional R&D Center, Ariel 40700, Israel
*
Authors to whom correspondence should be addressed.
Fermentation 2024, 10(3), 125; https://doi.org/10.3390/fermentation10030125
Submission received: 24 January 2024 / Revised: 20 February 2024 / Accepted: 21 February 2024 / Published: 23 February 2024
(This article belongs to the Collection New Aspect on Wine Fermentation)

Abstract

:
Residual sugars (RS) in wine are the sugars that remain in a wine after fermentation is complete. In some wine styles, such as semi-dry wines, the accurate measurement of the RS concentration is critical for both qualitative and legislative reasons. Brix, measured by a simple refractometer, can give a good estimation of the RS concentration in the must, but during fermentation, the presence of alcohol leads to inaccurate sugar measurements. In order to measure the RS accurately, other more precise techniques are used, most of which are expensive or require professional skills. Therefore, novel approaches for rapid, easy, and practical measurements for estimating the sugar content have been suggested over the years. However, most of these methods do not supply an actual measurement of RS but rather give brix values, and those that measure RS involve special equipment, which is less relevant for small wineries. This study suggests a novel model for predicting and controlling the wine’s residual sugar. The data the model uses is the initial brix of the must before fermentation and its density during fermentation. The model was created by measuring actual residual sugars during the fermentation of natural and synthetic musts, with various degrees of initial brix levels, while simultaneously measuring their densities and correlating the two measurements. Linear regression between the residual sugar of the wine and its density was obtained for all treatments and repetitions (i.e., different values of must initial brix) with R2 values above 0.97. Using the model, one can calculate (before commencing the fermentation) the density values at which the fermentation will reach a particular desired residual sugar value for a specific initial brix level; the model is applicable for the fermentation conditions used in this work, i.e., brix levels of 18–27 °Bx, Saccharomyces cerevisiae strains (fx-33 and fx-10) in common conditions of fermentation regarding temperature and aeration.

1. Introduction

During the winemaking process, yeast consumes the natural sugars in grapes (mainly glucose and fructose) and converts them into alcohol and carbon dioxide through fermentation. However, not all sugar is fermented in some cases, and a certain amount remains in the finished wine [1]. Residual sugars (RS) are all of the sugars that remain in the wine after fermentation is completed or terminated, including the non-fermentable sugars [2]. The level of residual sugars in a wine can vary widely, from dry wines with virtually no residual sugar to sweet wines with significant residual sugar content [3,4]. When aiming for a wine with residual sugars, a premature cessation of fermentation is achieved through various techniques, including racking, cooling, heating, the addition of high concentrations of SO2, and, in some wine styles, the addition of alcohol [3]. The choice of when to stop fermentation or whether to leave some sugar unfermented is a deliberate decision that influences the wine sweetness level classification [2,3].
Sugar measurements are taken regularly during wine fermentation to monitor fermentation progress. Sugar measurements are typically taken by brix measurements and by specific gravity measurements. Both measurements are important in determining when to stop fermentation and when to rack the wine off the lees [2].
Brix is defined as the percentage of total solids in solution, in grams of solute/100 g of solution (g/g). As sugar constitutes 95% of the soluble solids in grape juice, brix is an approximate measure of the actual sugar content in the must. It is easy to measure brix in must using a refractometer or a hydrometer before alcoholic fermentation. However, as alcoholic fermentation progresses, alcohol interferes with sugar measurement, resulting in an inaccurate measurement of the true brix [5]. The data obtained from a refractometer are higher than the true brix of the sample, while that from a hydrometer are lower than the true value. Hydrometer brix decreases linearly with increasing percentage alcohol content, whereas refractometer brix increases linearly [5,6]. The demand over the years for real-time, rapid, noninvasive, and continuous brix monitoring yielded various novel techniques other than hydrometer and refractometer. These include differential measurements, density measurements, osmotic potential measurements, mass flow measurements, and various biosensors (e.g., optical, ultrasonic, etc.) [7].
Precise measurement of sugar concentration, rather than brix measurement, is usually performed using “wet chemistry” techniques (i.e., reaction/titration), enzymatic assays, high-performance liquid chromatography (HPLC), spectroscopic-based techniques and several alternative techniques (such as remote-sensing technologies, colorimetric and digital image analysis) [8,9,10]. Reaction/titration includes two commonly used procedures: (i) Lane and Eynon and (ii) Rebelein methods (also known as Fehling test), both of which rely on reacting the sugars with alkaline cupric tartrate and then titrating to determine the excess copper ions. It should be noted that both of these techniques measure all the reducing sugars, including those that are not considered fermentable, such as pentose sugars. These tests will, therefore, give higher results than tests that determine just the concentration of glucose and fructose. In the enzymatic assay, the conversion of glucose and fructose by specific enzymes can be monitored directly by measuring the absorbance (340 nm) resulting from the generation of a by-product of the reaction (NADPH). The test is quite straightforward to conduct and requires only sample dilution. Kits for this assay are commercially available. The drawback of this method is its relatively high cost (reagents and a UV spectrophotometer). HPLC, coupled with various detectors, is one of the common techniques for sugar determination [8,11,12]. The most commonly applied detector is the refractive index (RI) detector [12]. Others include ultraviolet (UV) detector [11], evaporating light scattering detector (ELSD) [13], and (MS) detector [14]. It offers several advantages, including potential for automation, high precision, and rapidity. However, this method is time-consuming and requires high-cost equipment and skilled personnel to operate and maintain the instrument [8]. Alternative approaches based on spectroscopic techniques, including near-infrared (NIR), mid-infrared (MID), and Fourier-transform infrared spectroscopy (FTIR) [15], have been proposed in order to simplify sugar quantitation [16,17]. Some of these technologies are already in use in wine laboratories with great results and ease of use (such as the WineScan™ instrument of Foss industries) but are highly expensive.
Despite the advantages of these abovementioned methods, most are less relevant for small wineries as they are either expensive or complicated to perform [18,19,20,21]. For this reason, simple and cost-effective approaches for the quantification of reducing sugars were recently studied. Few studies have been published reporting the use of digital images to quantify sugar in food products [22,23]. A recent method combining colorimetric reaction with digital image analysis has proven effective for the accurate and precise quantification of beverage samples by low-cost analytical procedures [8]. In addition, novel methods were suggested for estimating the sugar concentration based on brix measurements by various cost-effective sensors [17], refractometers, and hydrometers. Equations were empirically derived to calculate the accurate brix of must during alcoholic fermentation [5,24]. These methods are based on measurements made by either a hydrometer or refractometer (or both) but measure brix rather than residual sugar content [7].
Our study suggests a novel model for predicting the residual sugar of the wine at a specific density point during fermentation by measuring the initial brix of the must before fermentation. The model can be used as a practical and rapid tool for estimating the point in the fermentation at which to terminate the fermentation in order to achieve the requested residual sugars in the wine, thus gaining precision and saving time and costs, as no special equipment is needed for the measurement but a simple hydrometer, usually present in any winery.

2. Materials and Methods

Materials were procured from Sigma-Aldrich (Sigma-Aldrich, St. Louis, MO, USA). Fermentations were carried out both on natural and synthetic musts. The objective of using a synthetic medium was to standardize the experimental conditions and to obtain more reproducibility compared to the natural musts.
The synthetic medium used has been used as a wine model system in fermentation studies by several authors due to its good correspondence with grape juice [25,26,27]. The composition of the medium was 3 g·L−1 tartaric acid, 2 g·L−1 l(+)malic acid, 1 g·L−1 KH2PO4, 0.5 g·L−1 MgSO4·7H2O, 0.1 g·L−1 NaCl, 0.1 g·L−1 CaCl2, 25 μg·L−1 biotin, 0.25 g·L−1 inositol and 100 μg·L−1 of H3BO3, ZnSO4, MnCl2, FeCl2, CuSO4, KI, thiamin, calcium pantothenate, pyridoxine, and nicotinic acid. The initial pH was adjusted to 3.3 with KOH. Glucose and fructose were added in a 1:1 ratio in order to obtain five different initial sugar concentrations (3 replicates for each treatment). The brix values obtained were as follows: 18.1, 20.3, 22.4, 24.4, and 26.6 °Bx. The natural must was of Malbec grapes from Mevo-Horon, Israel (lat. 31.82, long. 35.02, alt. 200 m). A total yield of ca. 30 kg for each treatment; grapes were harvested at seven time points to create musts with varying degrees of initial brix (range of 17–26 °Bx).

2.1. Fermentation Conditions

Fermentations of synthetic musts were carried out in 2 L wine bottles provided with a bubbling CO2 outlet and conducted in triplicate. In order to initiate alcoholic fermentation, 1.5 L of synthetic must (three repetitions per sugar level) were supplemented with commercial Saccharomyces cerevisiae strain fx-33 (Laffort®, Bordeaux, France) at a concentration of 0.2 g/kg grapes. In addition, yeast nutrients were added according to the manufacturer’s instructions (Nutrivit Vinoferm, 3581 Beverlo, Belgium). The fermentation temperature was kept at 25 °C.
Winemaking from the Malbec grapes was carried out according to the following procedure. Grapes were harvested at different stages of grape ripening in order to produce a range of musts with different initial brix (7 treatments; brix range: 17.3–25.7 °Bx). A total of 10 kg of grapes were destemmed, crushed, and placed in 25 L tanks, three repetitions per sugar level. In order to initiate alcoholic fermentation, commercial Saccharomyces cerevisiae strain fx-10 (Lallemand Inc., Montreal, QC, Canada) at a concentration of 0.2 g/kg grapes was added following the manufacturer’s instructions. The cap punch-down operations were carried out twice a day during the seven days of fermentation at 25 °C. On day 7, the wine was separated from the pomace by pressing it using a hydraulic press and kept at the same temperature until its density dropped below 0.994 g·mL−1. Sulfur dioxide was added to the wine as potassium metabisulfite at a concentration of 60 mg·L−1 of total SO2.

2.2. Must and Wine Analysis

Samples were taken at indicated time points, as indicated in Figure 1, and analyzed for temperature, density, and reducing sugars. Density was measured by a hydrometer (scale: 0 to 35 brix, triple scale hydrometer, France). Total soluble solids (brix determination) were measured by a digital refractometer (Pocket PAL-1, ATAGO, Tokyo, Japan). pH was measured by a Hanna HI 2211 pH meter (Hanna Instruments Inc., Woonsocket, RI, USA). Sugar concentrations were measured both by the Fehling test [28] and by the WineScan™ analyzer (Foss, Hilleroed, Denmark) [29].

2.3. Statistical Analyses

Linear regressions were made and tested with Microsoft Excel software, version 2401 (Microsoft Corporation, Redmond, WA, USA). One-way ANOVA was conducted, followed by the Tukey post hoc test, for analyzing the differences among means of each wine characteristic (measurements were conducted in triplicates). Prism statistical software, version 10.2.0 (GraphPad Software, Boston, MA, USA) was used to determine the statistical significance of differences between the treatment means at α = 0.05.

3. Results

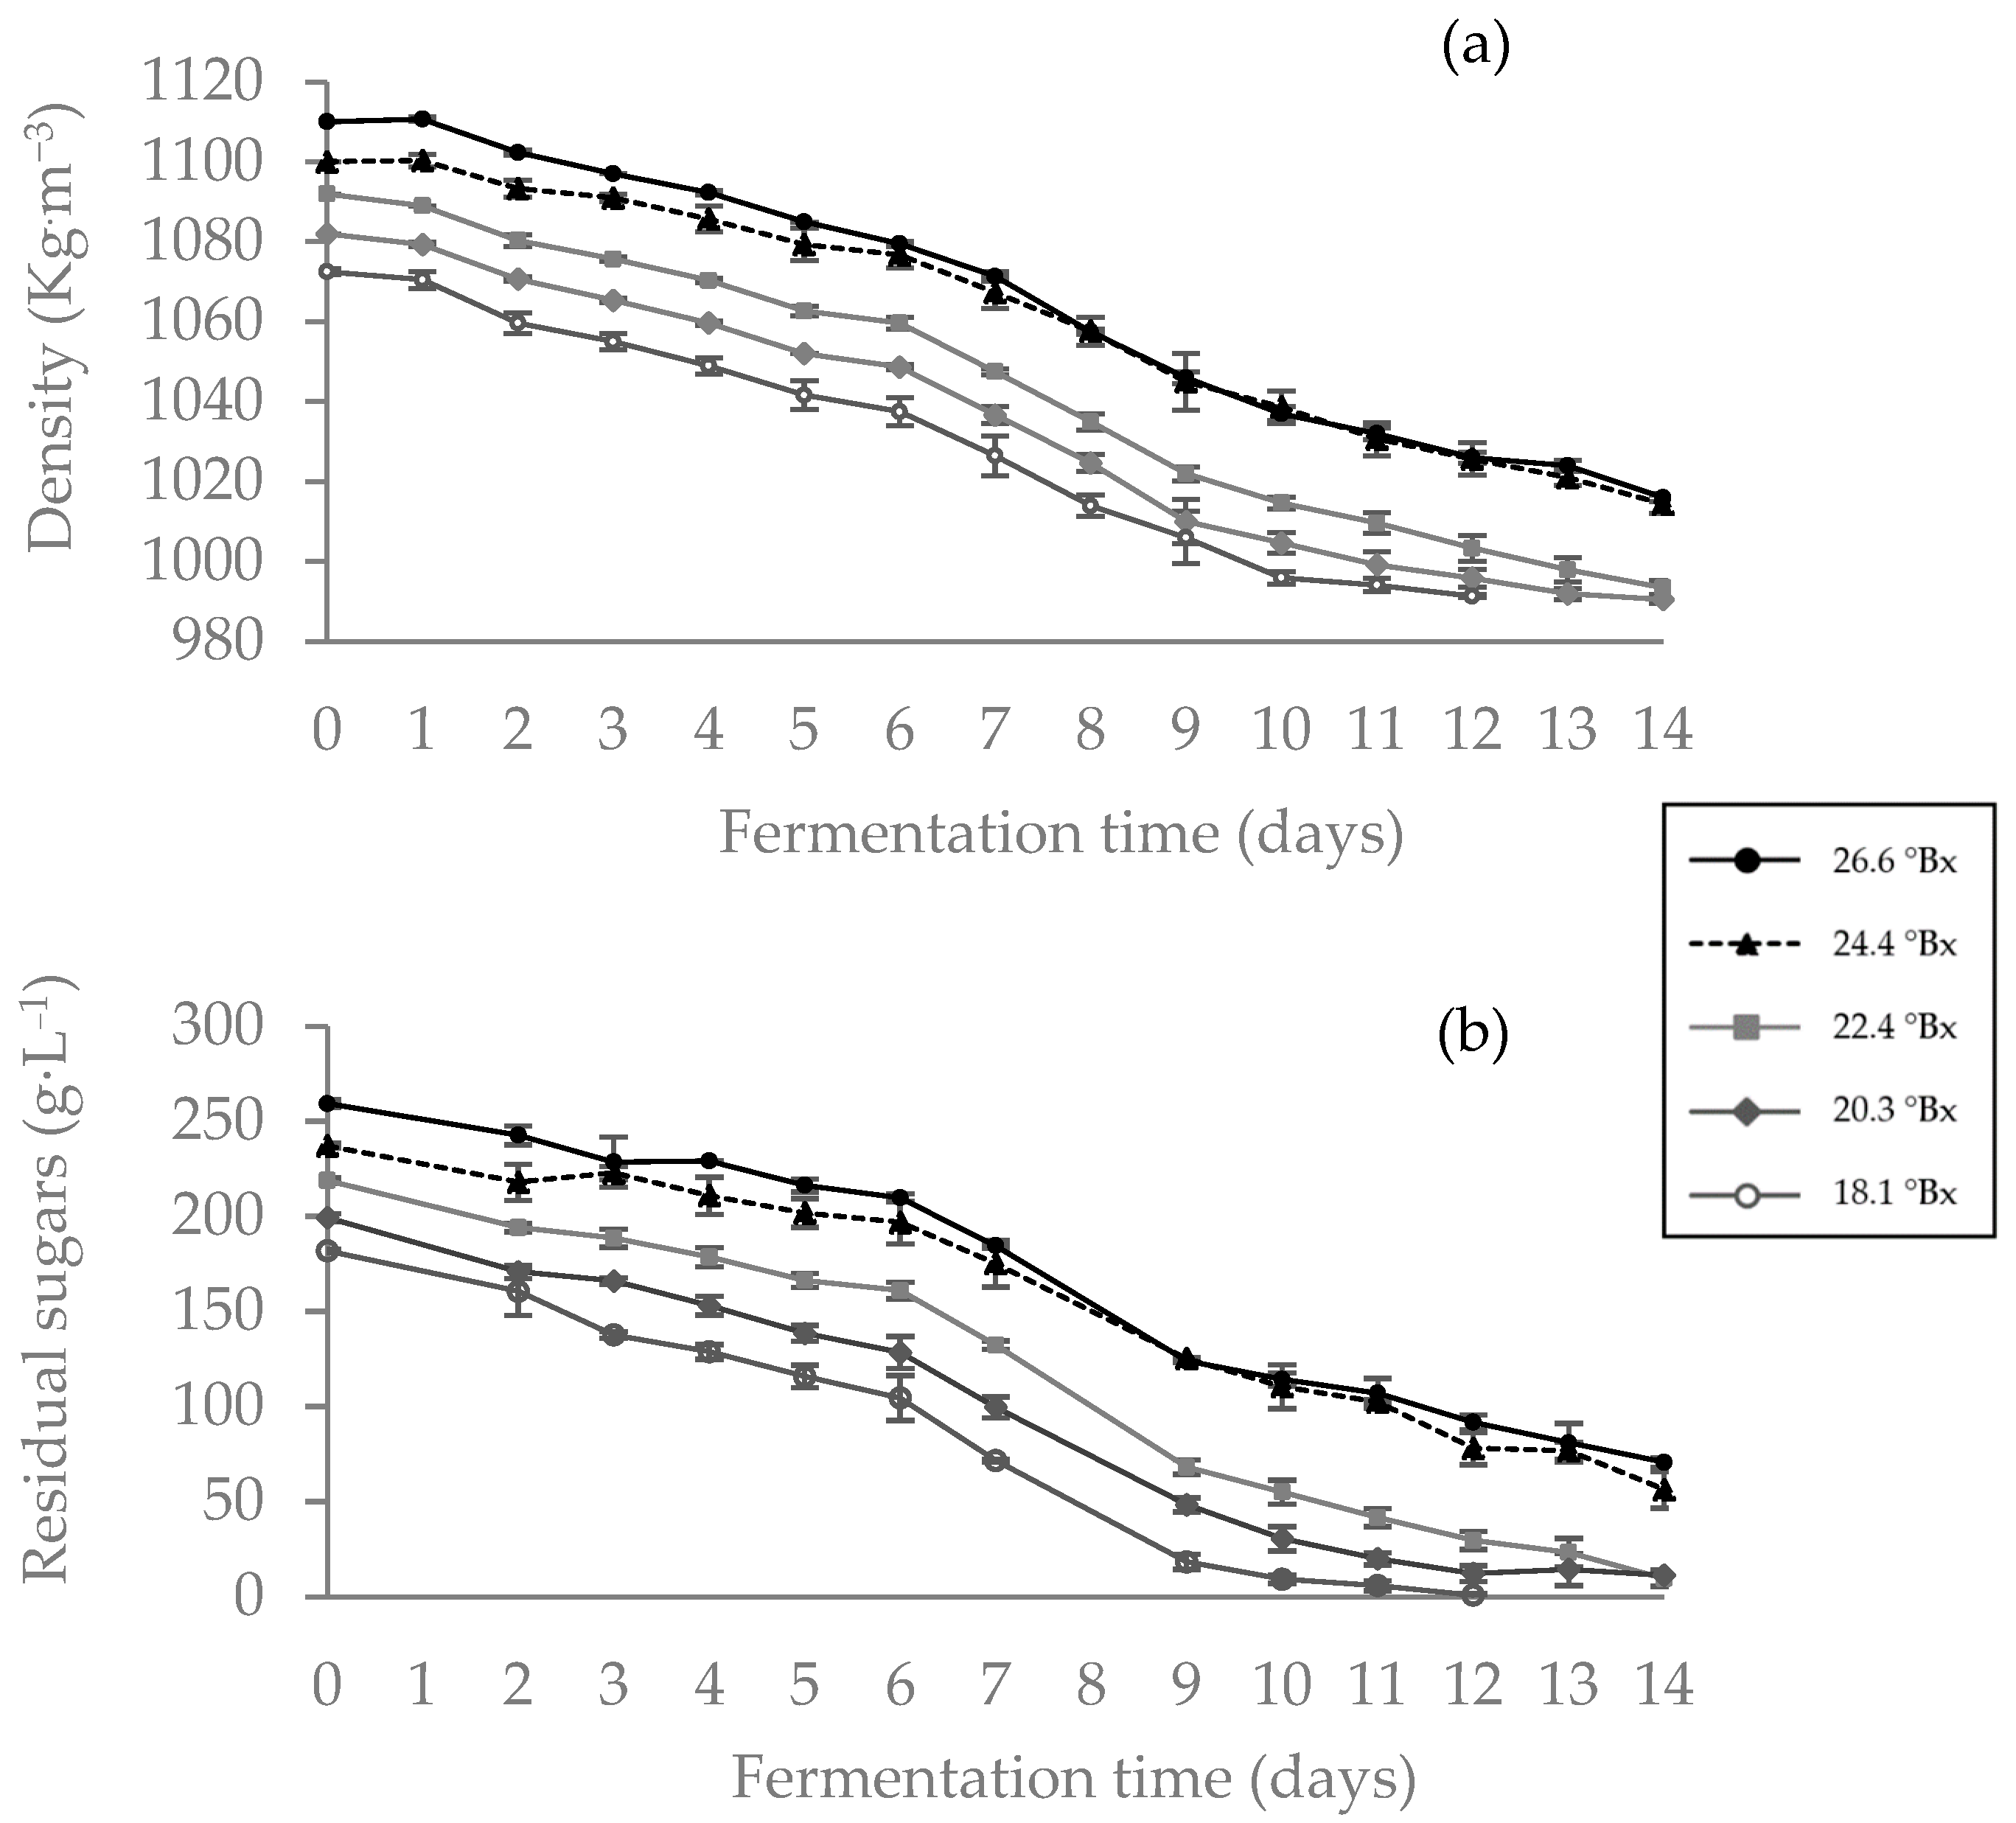
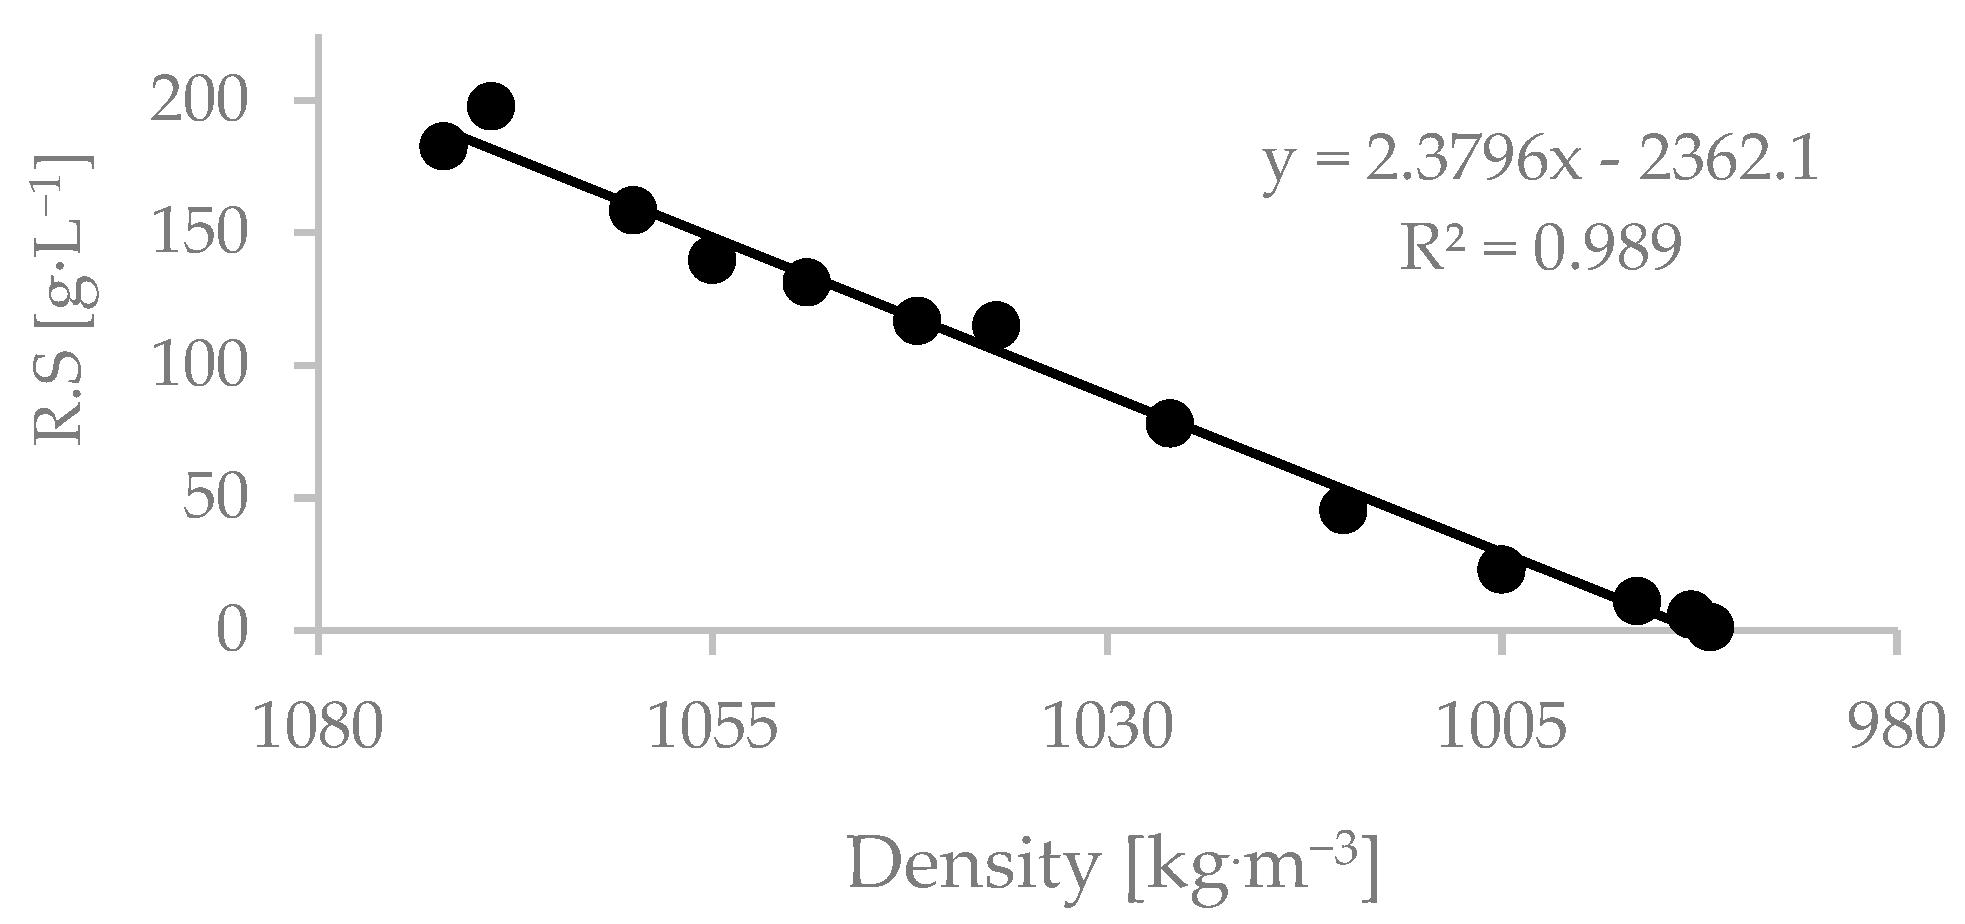
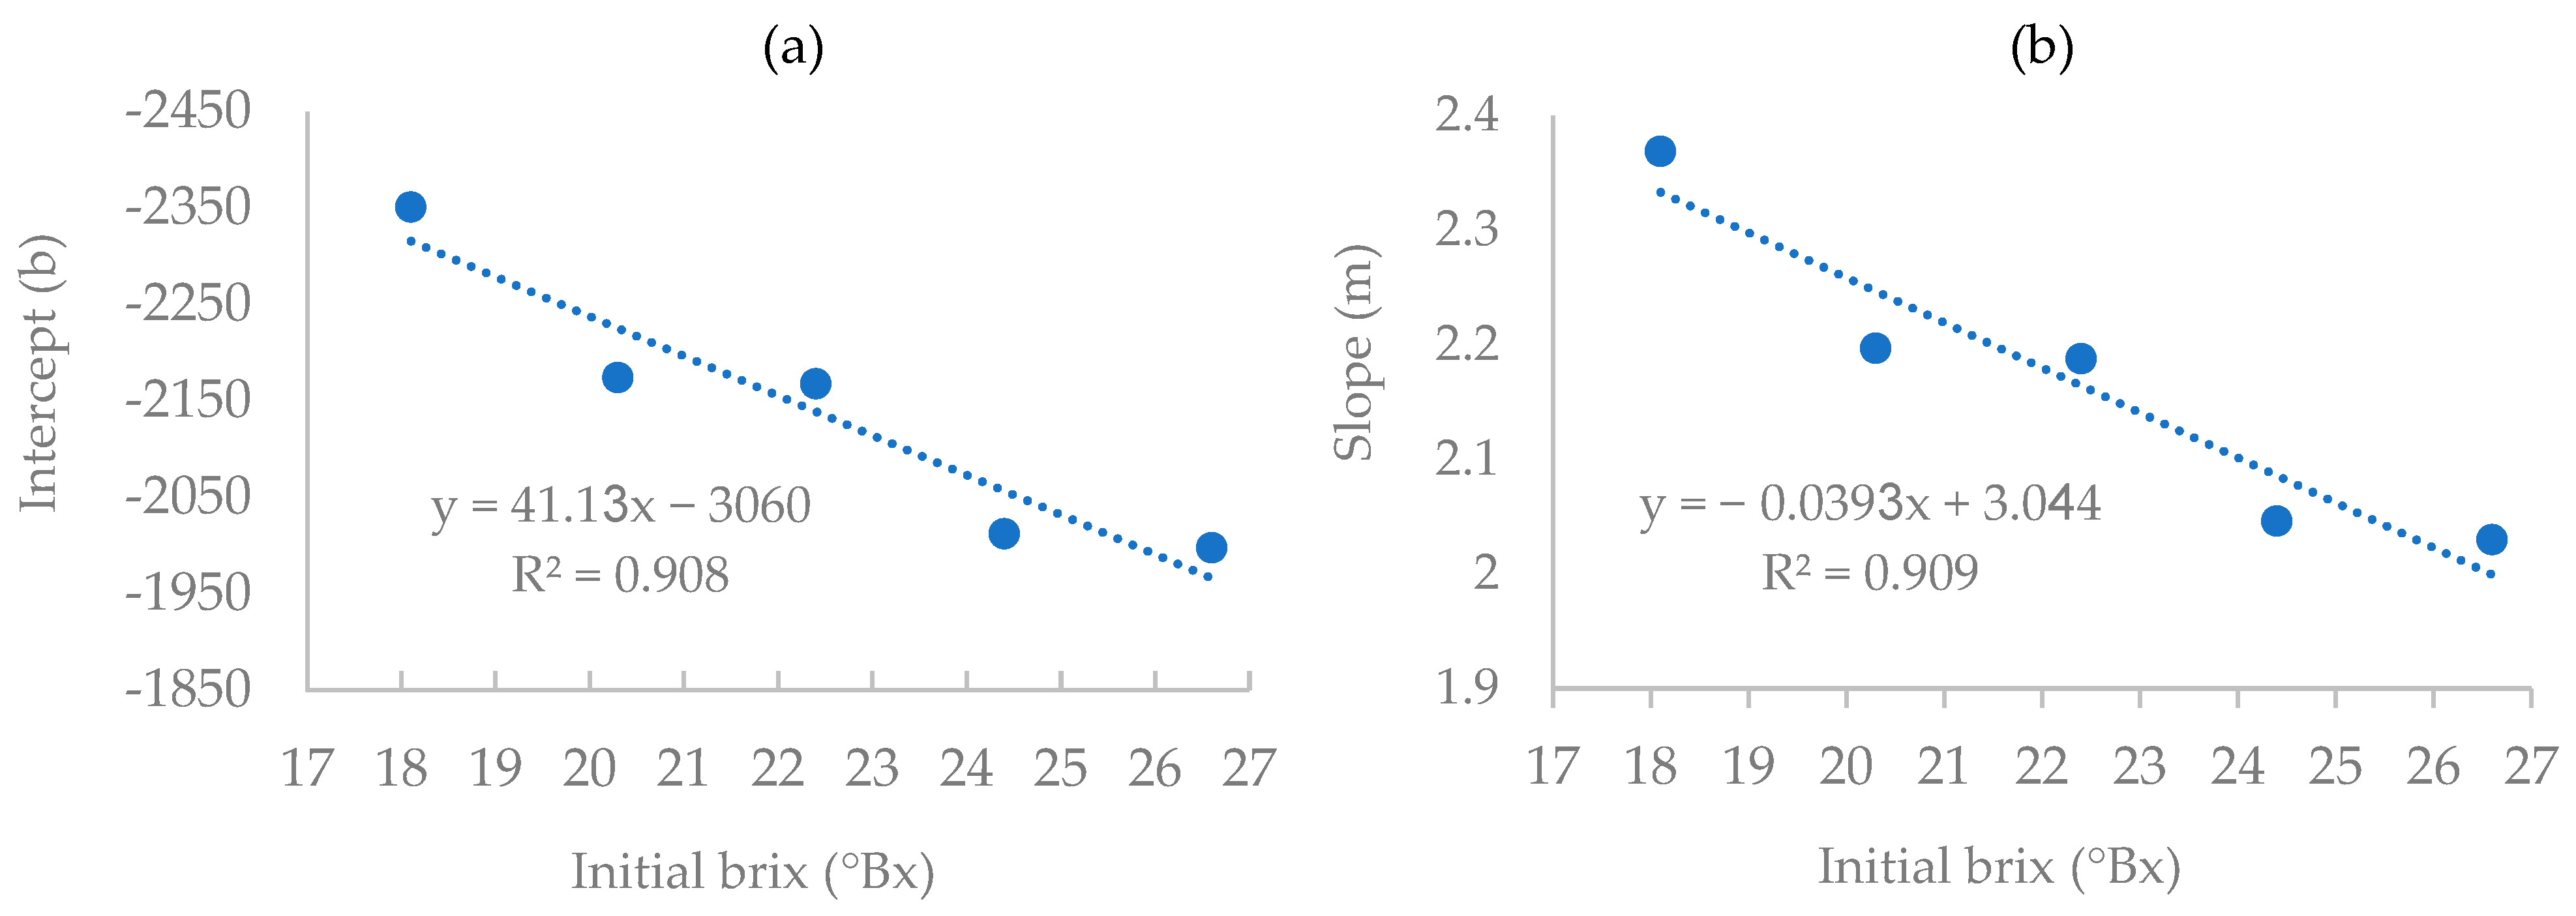
3.1. Measurement of Actual Residual Sugars in Synthetic Musts

Fermentation trials of synthetic musts of different initial sugar concentrations were conducted at constant temperatures. Samples for density measurements by hydrometer and the residual sugar analysis by Fehling test were taken daily. The results are summarized in Figure 1. It is clear from the Figure that as the alcoholic fermentation progresses, there is a gradual drop in residual sugars, followed by a reduction in the wine’s density. In addition, as expected, it can be seen from the results that the time for completion of fermentation was longer for the treatment with higher initial brix than for the one with low initial brix (18 and 12 days, respectively). Fermentation of the must with 26.6 °Bx was not fully completed during the 18 days of measurements, resulting in ca. 40 g·L−1 sugar in the wine.
Linear regression between the residual sugar of the wine and its density was obtained for all treatments and repetitions (i.e., different values of must initial brix).
A sample of such regression is presented in Figure 2 (the regression of the 18.1 °Bx must).
Equations for the linear regression of the triplicates for all treatments (initial brix levels) are presented in Table 1.
The equations were used to calculate the average slopes and intercepts to be used for each initial brix level. Table 1 shows an apparent decrease in the regression slopes when initial brix levels are higher. This decrease is caused by the elevated accumulation of alcohol in the musts with higher initial brix, which lowers the measured density, as the density of ethanol, the primary alcohol in wines, is 0.78945 g/cm3 at 20 °C [24].
It is important to note that musts with brix values in the typical range of fermented wines were used for the experiments.
In order to predict the density needed for a specific residual sugar value for any given initial brix value within the range of 18.1–26.6 brix, other than those used for the study, the different linear equations presented in Table 1 were used to plot new curves, allowing the calculation of both intercept and slope for any given initial brix level within the abovementioned range (Figure 3).
Using the equations derived from these graphs, with R2 of 0.91 (Figure 3), one can calculate the density values at which the fermentation will reach any desired residual sugar value for any given initial brix level in the fermentation conditions tested (temperature, yeast strain, brix range, and acidity.)
For example, achieving the basic equation for a brix value of 23.5 will be as follows:
The linear equation for calculating the slope (m) equals:
y = 0.0393 x + 3.044 = 0.0393 × 23.5 + 3.044 = 2.120
The linear equation for calculating the intercept (b) equals:
y = 41.13 x 3060 = 41.13 × 23.5 3060 = 2093.45
Thus, the equation for calculating the density point for a specific desirable residual sugar level for the 23.5 Bx must is as follows:
y = 2.120 x 2093.45
Using this equation, the winemaker can predict at what density he should stop the fermentation (x) to achieve the desired residual sugar concentration (y).
For example, in order to achieve a residual sugar value of 30 g·L−1, the fermentation should be stopped at a density of 1001.6 kg/m3, calculated as follows:
x = 30 + 2093.45 2.120 = 1001.6 k g m 3
d e n s i t y = 1001.6 k g m 3

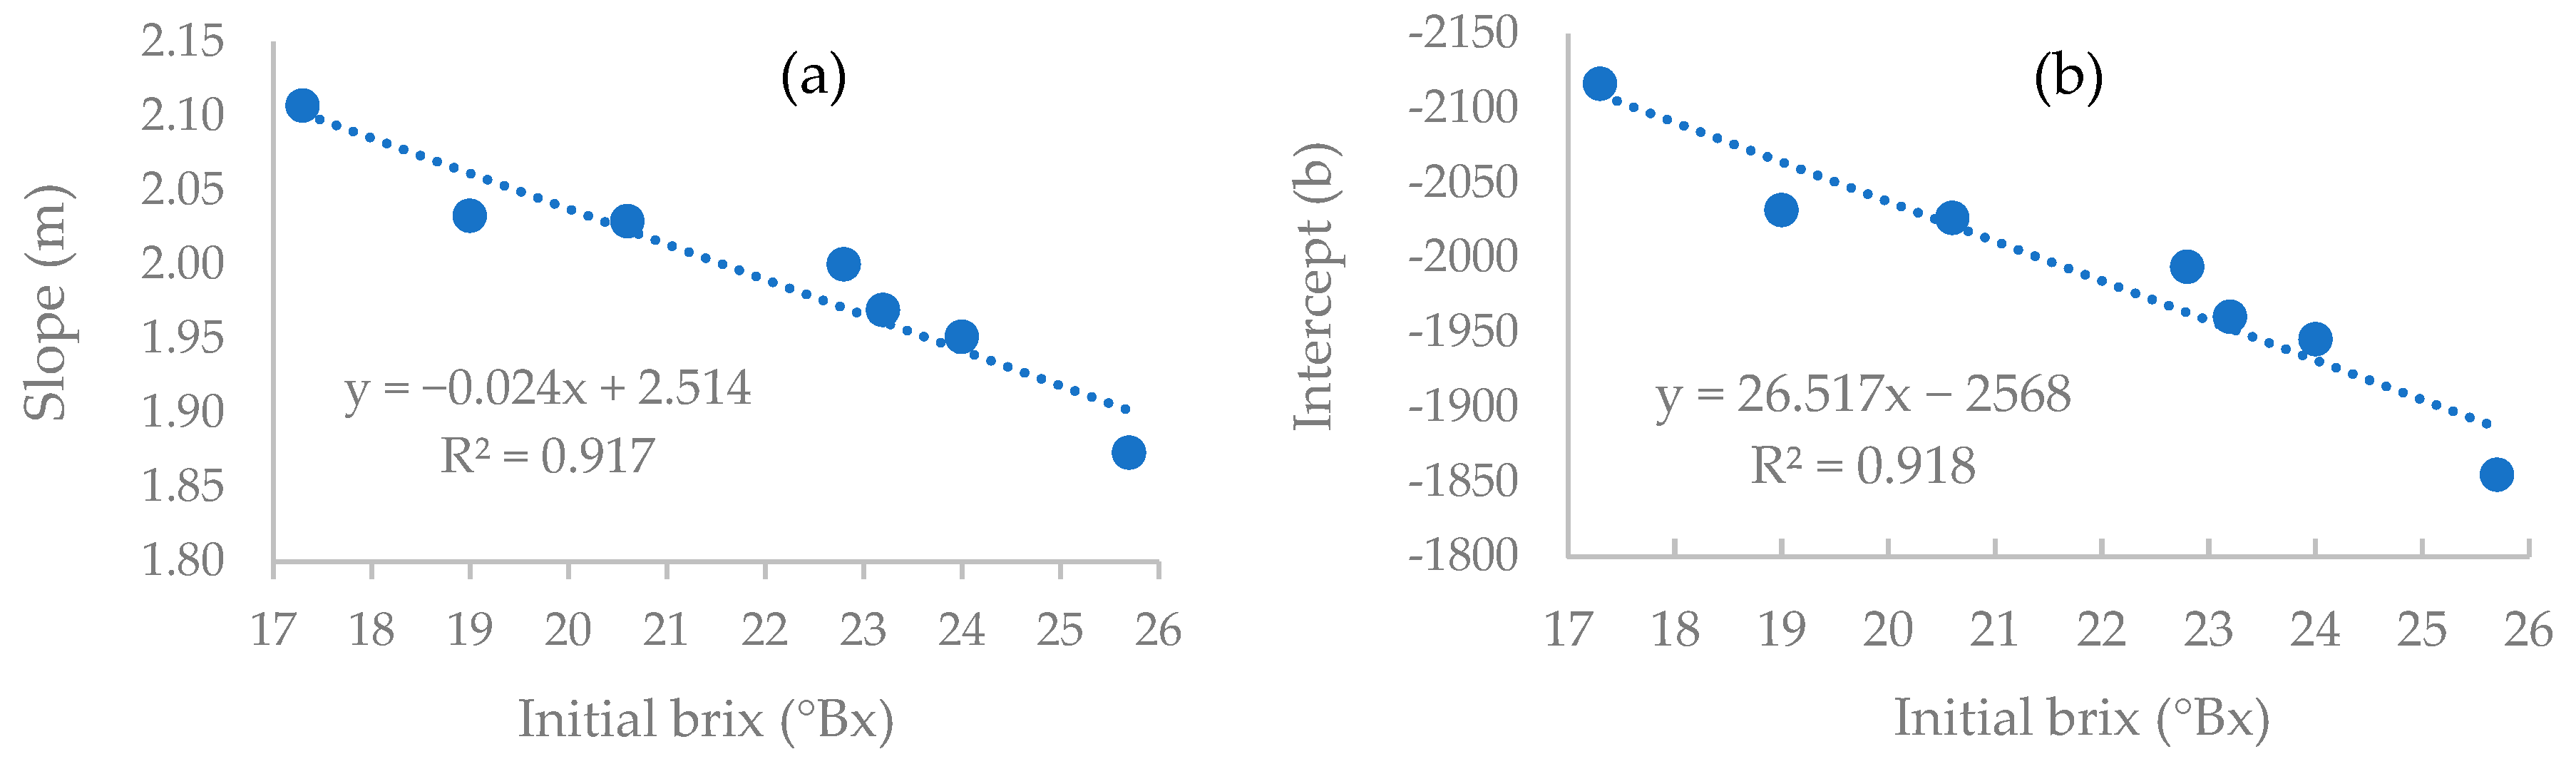
3.2. Application of the Model to Natural Musts

The analysis method mentioned above was developed using synthetic musts. In order to investigate whether it could be applied to natural wines, Malbec grapes were harvested at different initial brix values and fermented. Density and residual sugar values during fermentation are summarized in Table 2.
The results show that the natural must fermentations were faster than those of the synthetic musts, as expected and well-published [30]. The basic reason for this is the well-balanced nutritional status of the natural musts, which includes a wide variety of nitrogen and carbohydrate sources compared to synthetic wine. In addition, as with the synthetic fermentations, musts with higher brix values exhibited extended fermentation durations. Linear regression between the residual sugar of the wine and its density was obtained for all treatments, similar to the process that was developed for the synthetic musts. The different equations are summarized in Table 3.
As was conducted with the synthetic wines, to predict the density needed for a specific residual sugar value for any given initial brix value, the different linear equations presented in Table 3 were used to plot new curves (Figure 4).
Table 4 presents an example of the densities (and linear regression parameters) in which the fermentation should be terminated to achieve a residual sugar value of 30 g·L−1 for different initial musts brix values.
Finally, an algorithm using the regressions calculated for the natural musts was created to calculate the slope and intercept for any given initial brix level and desirable residual sugar levels. The algorithm creates the final equation and calculates the density point at which one should terminate the fermentation to reach the desirable residual sugar level. This algorithm demonstrates the potential of this model, once further developed with more comprehensive panels of tested conditions, to be used as a practical tool for winemakers. The algorithm code is available in the Supplementary Data.

4. Discussion

Developments in techniques for brix and sugar measurements in wine, among other fruits and products, were published in a review by Jaywant et al. [17]. It was concluded that despite the various methods and instruments for sugar and brix measurements in wine, there is still a need for prompt, low-cost analysis with minimal sample preparation. Vis/NIRS has been proposed as an alternative to traditional methods due to its rapidity, simplicity, cost-effectiveness, and potential for routine analysis (after proper calibration and validation). Residual sugars (g·L−1) by such method were measured by Urbano–Cuadrado et al. with R2 of 0.705 [31], and total sugars (g·L−1) were measured by Páscoa et al., with R2 of 0.94 [32]. Swe et al. developed a brix estimation model for destructive and nondestructive measurements (R2 of 0.72 and 0.85, respectively) using hyperspectral imaging combined with two machine-learning approaches, ridge regression and the EBM [10]. A recent study on the combination of colorimetric reaction with digital image analysis proved to be a viable strategy for reducing sugar quantification [8]. In our study, a model was developed for estimating the residual sugar concentration rather than brix estimation. The residual sugar concentration measurement (in units of g·L−1) is critical for determining the wine’s final sweetness, as well as for vinification decisions (e.g., when to stop fermentation to achieve a specific sugar concentration) and for legislation of the wine at a proper category. Our model enables the user to accurately measure sugar concentration with a simple measurement of initial brix followed by density measurements during fermentation (R2 of 0.9), a straightforward technique used regularly by wineries to monitor the fermentation status. The advantage of the model is the prediction of the actual residual sugar concentration, rather than the prediction of brix values, by simple and basic equipment that are common in every winery.
It is worth mentioning that our model is applicable for common brix values of grapes used for fermentation (i.e., above 18 and lower than 27 °Bx), mild fermentation conditions of temperature (circa 25 °C), low aeration conditions, and two types of Saccharomyces cerevisiae yeast strains.
Extreme conditions (i.e., very high or very low fermentation temperatures or extreme anaerobic/aerobic conditions) could influence the model by changing the ratio of alcohol yield versus initial residual sugar concentration. Temperature elevation influences the level of yeast biomass during fermentation [33]. It has been reported that the higher the temperature the lower the ethanol production from the same initial level of sugars [34]. However, the poor impact of the fermentation temperature on the final alcoholic strength has also been described by several studies [35,36]. According to this, even low fermentation temperatures have no effect on the final alcohol content as long as the temperature is high enough to allow yeast development [36].
Regarding the anaerobic/aerobic conditions, ethanol yields are lower under aerobic conditions than under anaerobic conditions [37]. Thus, further experiments should be held to elaborate our model to higher aeration conditions during fermentation. For example, the use of macro oxidation methods, which have become increasingly applicable in recent years due to the development of available and feasible equipment [38], might indeed change the sugar-to-alcohol ratio and, thus, affect the predictability of residual sugar by the suggested model.
Another essential factor that needs attention is the type of yeast strain used for fermentation. Our study included two yeast strains of Saccharomyces cerevisiae. Over 200 commercial yeast strains for winemaking are on the market; these yeasts can differ significantly in their metabolic behavior and alcohol conversion rates [39,40]. Thus, it is necessary to examine the influence of this factor on the predictability of residual sugar by the suggested model.

5. Conclusions

This work presents a straightforward approach for estimating the density point at which one can terminate fermentation to produce a wine with the requested residual sugar. The method is based on measurements with a hydrometer—a standard tool used for monitoring fermentation and can be used within the brix range of most normal musts.
Once further developed, this novel approach can become a rapid and practical tool that could be very useful for the winemaker for planning the wine’s residual sugar prior to fermentation, saving time, costs, and effort. A practical calculator was coded to show the practical potential of such an approach. However, to use it for a broader panel of conditions, other than those used for creating the model, additional experiments should be held, as mentioned above.

Supplementary Materials

The following supporting information can be downloaded at https://www.mdpi.com/article/10.3390/fermentation10030125/s1, which is the code for the calculator used to find the wine density needed to obtain a specific residual sugar concentration.

Author Contributions

Conceptualization, E.D.; methodology, E.D., R.Y., M.S. and E.S.; software, E.S.; formal analysis, E.S. and V.B.A.; investigation, E.D., R.Y. and E.S.; resources, E.D.; data curation, E.S., V.B.A. and R.Y.; writing—original draft preparation, R.Y., E.S. and E.D.; writing—review and editing, E.D. and R.Y.; visualization, E.S., V.B.A. and R.Y.; supervision, E.D.; project administration, E.D. and R.Y.; funding acquisition, E.D. All authors have read and agreed to the published version of the manuscript.

Funding

This research received no external funding.

Data Availability Statement

The data used for this work are presented in the manuscript or within the Supplementary Data Section.

Acknowledgments

We wish to acknowledge Daniel Schneiderman’s assistance with the calculation tool’s coding.

Conflicts of Interest

The authors declare no conflicts of interest.

References

  1. Maicas, S. Advances in Wine Fermentation. Fermentation 2021, 7, 187. [Google Scholar] [CrossRef]
  2. Jacobson, J.L. Introduction to Wine Laboratory Practices and Procedures, 1st ed.; Springer: New York, NY, USA, 2006; ISBN 978-0-387-24377-1. [Google Scholar]
  3. Margalit, Y. Concepts in Wine Technology, 1st ed.; Wine Appreciation Guild: San Francisco, CA, USA, 2004. [Google Scholar]
  4. International Organisation of Vine and Wine. Compendium of International Methods of Wine and Must Analysis; OIV: Paris, France, 2022; Volume 1, ISBN 9782850380525. [Google Scholar]
  5. Son, H.S.; Hong, Y.S.; Park, W.M.; Yu, M.A.; Lee, C.H. A Novel Approach for Estimating Sugar and Alcohol Concentrations in Wines Using Refractometer and Hydrometer. J. Food Sci. 2009, 74, C106–C111. [Google Scholar] [CrossRef] [PubMed]
  6. Rogerson, F.S.; Symington, C. A Method for the Estimation of Alcohol in Fortified Wines Using Hydrometer Baumé and Refractometer Brix. Am. J. Enol. Vitic. 2006, 57, 486–490. [Google Scholar] [CrossRef]
  7. Magwaza, L.S.; Opara, U.L. Analytical methods for determination of sugars and sweetness of horticultural products—A review. Sci. Hortic. 2015, 184, 179–192. [Google Scholar] [CrossRef]
  8. Teixeira, G.G.; Santos, P.M. Simple and cost-effective approaches for quantification of reducing sugar exploiting digital image analysis. J. Food Compos. Anal. 2022, 113, 104719. [Google Scholar] [CrossRef]
  9. El-Shishtawy, R.M.; Al Angari, Y.M.; Alotaibi, M.M.; Almulaiky, Y.Q. Novel and Facile Colorimetric Detection of Reducing Sugars in Foods via In Situ Formed Gelatin-Capped Silver Nanoparticles. Polymers 2023, 15, 1086. [Google Scholar] [CrossRef] [PubMed]
  10. Swe, K.N.; Takai, S.; Noguchi, N. Novel approaches for a brix prediction model in Rondo wine grapes using a hyperspectral Camera: Comparison between destructive and Nondestructive sensing methods. Comput. Electron. Agric. 2023, 211, 108037. [Google Scholar] [CrossRef]
  11. Jalaludin, I.; Kim, J. Comparison of ultraviolet and refractive index detections in the HPLC analysis of sugars. Food Chem. 2021, 365, 130514. [Google Scholar] [CrossRef]
  12. Yeganeh-Zare, S.; Farhadi, K.; Amiri, S. Rapid detection of apple juice concentrate adulteration with date concentrate, fructose and glucose syrup using HPLC-RID incorporated with chemometric tools. Food Chem. 2022, 370, 131015. [Google Scholar] [CrossRef]
  13. Lindqvist, D.N.; Pedersen, H.Æ.; Rasmussen, L.H. A novel technique for determination of the fructose, glucose and sucrose distribution in nectar from orchids by HPLC-ELSD. J. Chromatogr. B Anal. Technol. Biomed. Life Sci. 2018, 1081–1082, 126–130. [Google Scholar] [CrossRef]
  14. Georgelis, N.; Fencil, K.; Richael, C.M. Validation of a rapid and sensitive HPLC/MS method for measuring sucrose, fructose and glucose in plant tissues. Food Chem. 2018, 262, 191–198. [Google Scholar] [CrossRef] [PubMed]
  15. Croce, R.; Malegori, C.; Oliveri, P.; Medici, I.; Cavaglioni, A.; Rossi, C. Prediction of quality parameters in straw wine by means of FT-IR spectroscopy combined with multivariate data processing. Food Chem. 2020, 305, 125512. [Google Scholar] [CrossRef] [PubMed]
  16. Thanasi, V.; Catarino, S.; Ricardo-Da-Silva, J. Fourier transform infrared spectroscopy in monitoring the wine production. Cienc. e Tec. Vitivinic. 2022, 37, 79–99. [Google Scholar] [CrossRef]
  17. Jaywant, S.A.; Singh, H.; Arif, K.M. Sensors and Instruments for Brix Measurement: A Review. Sensors 2022, 22, 2290. [Google Scholar] [CrossRef] [PubMed]
  18. Amerine, M.A.; Ough, C.S. Methods for Analysis of Musts and Wines; Wiley: New York, NY, USA, 1980. [Google Scholar]
  19. Iland, P. Techniques for Chemical Analysis and Quality Monitoring during Winemaking; Patrick Iland Wine Promotions: Campbelltown, Australia, 2000. [Google Scholar]
  20. Rankine, B.C. Making Good Wine: A Manual of Winemaking Practice for Australia and New Zealand; Sun Books: South Melbourne, VIC, Australia, 1989. [Google Scholar]
  21. Zoecklein, B.W.; Fugelsang, K.C.; Gump, B.H.; Nury, F.S. Wine Analysis and Production; Aspen Publishers: Boston, MA, USA, 1995. [Google Scholar]
  22. Franco, M.d.O.K.; Suarez, W.T.; dos Santos, V.B.; Resque, I.S. A novel digital image method for determination of reducing sugars in aged and non-aged cachaças employing a smartphone. Food Chem. 2021, 338, 127800. [Google Scholar] [CrossRef]
  23. Hernández-López, A.; Sanchez Felix, D.A.; Sierra, Z.Z.; Bravo, I.G.; Dinkova, T.D.; Avila-Alejandre, A.X. Quantification of reducing sugars based on the qualitative technique of Benedict. ACS Omega 2020, 5, 32403–32410. [Google Scholar] [CrossRef] [PubMed]
  24. Martens, M.; Hadrich, M.J.; Nestler, F.; Ouda, M.; Schaadt, A. Combination of Refractometry and Densimetry—A Promising Option for Fast Raw Methanol Analysis. Chem.-Ing.-Tech. 2020, 92, 1474–1481. [Google Scholar] [CrossRef]
  25. D’Amato, D.; Corbo, M.R.; Del Nobile, M.A.; Sinigaglia, M. Effects of temperature, ammonium and glucose concentrations on yeast growth in a model wine system. Int. J. Food Sci. Technol. 2006, 41, 1152–1157. [Google Scholar] [CrossRef]
  26. Delfini, C.; Costa, A. Effects of the Grape Must Lees and Insoluble Materials on the Alcoholic Fermentation Rate and the Production of Acetic Acid, Pyruvic Acid, and Acetaldehyde. Am. J. Enol. Vitic. 1993, 44, 86–92. [Google Scholar] [CrossRef]
  27. Lema, C.L.; García-Jares, C.; Orriols, I.; Angulo, L.E.S. Contribution of Saccharomyces and Non-Saccharomyces Populations to the Production of Some Components of Albariño Wine Aroma. Am. J. Enol. Vitic. 1996, 47, 206–216. [Google Scholar] [CrossRef]
  28. Tiwari, A. Practical Biochemistry: A Student Companion; Lambert Academic Publishing: London, UK, 2015; ISBN 3659757160. [Google Scholar]
  29. Berthels, N.J.; Cordero Otero, R.R.; Bauer, F.F.; Thevelein, J.M. Pretorius, IS Discrepancy in glucose and fructose utilisation during fermentation by Saccharomyces cerevisiae wine yeast strains. FEMS Yeast Res. 2004, 4, 683–689. [Google Scholar] [CrossRef] [PubMed]
  30. Viana, T.; Loureiro-Dias, M.C.; Prista, C. Efficient fermentation of an improved synthetic grape must by enological and laboratory strains of Saccharomyces cerevisiae. AMB Express 2014, 4, 16. [Google Scholar] [CrossRef] [PubMed]
  31. Urbano-Cuadrado, M.; Luque De Castro, M.D.; Pérez-Juan, P.M.; García-Olmo, J.; Gómez-Nieto, M.A. Near infrared reflectance spectroscopy and multivariate analysis in enology: Determination or screening of fifteen parameters in different types of wines. Anal. Chim. Acta 2004, 527, 81–88. [Google Scholar] [CrossRef]
  32. Páscoa, R.N.M.J.; Porto, P.A.L.S.; Cerdeira, A.L.; Lopes, J.A. The application of near infrared spectroscopy to wine analysis: An innovative approach using lyophilization to remove water bands interference. Talanta 2020, 214, 120852. [Google Scholar] [CrossRef] [PubMed]
  33. Vamvakas, S.S.; Kapolos, J. Factors affecting yeast ethanol tolerance and fermentation efficiency. World J. Microbiol. Biotechnol. 2020, 36, 1–8. [Google Scholar] [CrossRef] [PubMed]
  34. Pizarro, F.J.; Jewett, M.C.; Nielsen, J.; Agosin, E. Growth temperature exerts differential physiological and transcriptional responses in laboratory and wine strains of Saccharomyces cerevisiae. Appl. Environ. Microbiol. 2008, 74, 6358–6368. [Google Scholar] [CrossRef]
  35. Rodrigues, A.J.; Raimbourg, T.; Gonzalez, R.; Morales, P. Environmental factors influencing the efficacy of different yeast strains for alcohol level reduction in wine by respiration. LWT 2016, 65, 1038–1043. [Google Scholar] [CrossRef]
  36. Ruiz-Rodríguez, A.; Palma, M.; Barroso, C.G. Influence of temperature during pre-fermentative maceration and alcoholic fermentation on the phenolic composition of ‘cabernet sauvignon’ wines. Foods 2021, 10, 1053. [Google Scholar] [CrossRef]
  37. Tronchoni, J.; Gonzalez, R.; Guindal, A.M.; Calleja, E.; Morales, P. Exploring the suitability of Saccharomyces cerevisiae strains for winemaking under aerobic conditions. Food Microbiol. 2022, 101, 103893. [Google Scholar] [CrossRef]
  38. Rossi, S.; Bestulić, E.; Horvat, I.; Plavša, T.; Lukić, I.; Bubola, M.; Ganić, K.K.; Ćurko, N.; Jagatić Korenika, A.M.; Radeka, S. Comparison of different winemaking processes for improvement of phenolic composition, macro- and microelemental content, and taste sensory attributes of Teran (Vitis vinifera L.) red wines. LWT 2022, 154, 112619. [Google Scholar] [CrossRef]
  39. Pretorius, I.S. Tailoring wine yeast for the new millennium: Novel approaches to the ancient art of winemaking. Yeast 2000, 16, 675–729. [Google Scholar] [CrossRef]
  40. Bartowsky, E.; Bellon, J.; Borneman, A.; Chambers, P.; Cordente, A.; Costello, P.; Curtin, C.; Forgan, A.; Henschke, P.; Kutyna, D.; et al. Not all wine yeast are equal. Microbiol. Aust. 2007, 28, 55. [Google Scholar] [CrossRef]
Figure 1. Fermentation profile of synthetic musts starting with a varying degree of sugar concentrations during 14 days of fermentation (density (a) and residual sugar (b) values).
Fermentation 10 00125 g001
Figure 2. Linear regression between the residual sugar of the wine and its density for the wine with the lowest initial brix level (18.1 °Brix).
Fermentation 10 00125 g002
Figure 3. Linear regression curves between average intercepts, found for each brix level for the synthetic must (a) and average slopes (b) vs. initial brix of the must.
Fermentation 10 00125 g003
Figure 4. Linear regression curves between slope (a) and intercept (b) vs. initial brix of the natural must.
Fermentation 10 00125 g004
Table 1. Linear regression between the residual sugar of the wine and its density.
TreatmentEquationAverage Slope (m)Average Intercept (b)Average R2
A (26.6 °Bx)Y = 2.030x − 1997.62.030 ± 0.004−1997.6 ± 1.60.973 ± 0.020
B (24.4 °Bx)Y = 2.046x − 2012.22.046 ± 0.013−2012.2 ± 15.30.994 ± 0.002
C (22.4 °Bx)Y = 2.188x − 2167.72.188 ± 0.011−2167.7 ± 9.40.984 ± 0.008
D (20.3 °Bx)y = 2.197x − 2173.92.197 ± 0.011−2173.9 ± 11.50.976 ± 0.011
E (18.1 °Bx)Y = 2.369x − 2350.92.369 ± 0.016−2350.9 ± 15.90.982 ± 0.009
Table 2. Density (kg·m−3) and residual sugar (g·L−1) values of natural wines during fermentation.
Time (Days)ParameterTreatment/°Bx
87654321
---1000.01001.01015.01035.01071.0Density17.3
---2.02.216.954.3146.2Residual sugars
--996.5997.01000.01013.01041.01080.0Density19.0
--1.81.92.429.561.8174.8Residual sugars
--997.0998.01008.01036.01058.01089.0Density20.6
--2.13.516.370.5120.8185.2Residual sugars
-994.6996.4998.01006.01037.01066.01100.0Density22.8
-2.12.63.215.066.3173.0197.5Residual sugars
-995.0997.0999.01011.01041.01061.01098.0Density 23.2
-1.51.84.029.581.4139.8173.1Residual sugars
-995.0995.6999.01008.01039.01065.01103.0Density24.0
-1.51.32.821.757.4145.6194.0Residual sugars
995.0996.21005.01012.01021.01051.01080.01103.0Density25.7
3.17.631.446.353.6118.5186.0195.5Residual sugars
Table 3. Linear regression between the residual sugars of natural wines and their density.
Treatment/°BxLinear EquationR2
17.3Y = 2.107x − 2116.40.980
19.0Y = 2.033x − 2031.90.967
20.6Y = 2.029x − 2026.60.997
22.8Y = 2.000x − 1993.90.980
23.2Y = 1.970x − 1960.40.991
24.0Y = 1.951x − 1945.30.947
25.7Y = 1.873x − 1854.80.983
Table 4. Densities (and linear regression parameters) in which the fermentation should stop to achieve a sugar value of 30 g·L−1 for different initial brix values.
Initial Brix (°Bx)Slope (m)Intercept (b)Density (kg·m−3)
17.02.10−2110.91007.3
17.52.09−2098.41006.9
18.02.08−2085.81006.4
18.52.07−2073.31006.0
19.02.06−2060.71005.5
19.52.05−2048.21005.1
20.02.04−2035.61004.6
20.52.03−2023.11004.1
21.02.01−2010.51003.6
21.52.00−1998.01003.2
22.01.99−1985.51002.7
22.51.98−1972.91002.2
23.01.97−1960.41001.6
23.51.96−1947.81001.1
24.01.95−1935.31000.6
24.51.94−1922.71000.0
25.01.92−1910.2999.5
25.51.91−1897.6998.9
26.01.90−1885.1998.4
26.51.89−1872.5997.8
Disclaimer/Publisher’s Note: The statements, opinions and data contained in all publications are solely those of the individual author(s) and contributor(s) and not of MDPI and/or the editor(s). MDPI and/or the editor(s) disclaim responsibility for any injury to people or property resulting from any ideas, methods, instructions or products referred to in the content.

