
Mixotrophic Syngas Conversion Enables the Production of meso-2,3-butanediol with Clostridium autoethanogenum


Abstract
:
1. Introduction
2. Materials and Methods
2.1. Microorganism, Medium, and Heterotrophic Preculture Preparation
2.2. Continuously Gassed Stirred-Tank Bioreactor Setup
2.3. Analytical Methods
3. Results and Discussion
3.1. Autotrophic Batch Processes with C. autoethanogenum
3.2. Mixotrophic Batch Processes with D-Xylose
3.3. Mixotrophic Batch Processes with L-Arabinose
3.4. Comparison of Mixotrophic Batch Processes with D-Xylose, L-Arabinose, and D-Fructose
4. Conclusions
Supplementary Materials
Author Contributions
Funding
Institutional Review Board Statement
Informed Consent Statement
Data Availability Statement
Acknowledgments
Conflicts of Interest
References
- Fast, A.G.; Schmidt, E.D.; Jones, S.W.; Tracy, B.P. Acetogenic mixotrophy: Novel options for yield improvement in biofuels and biochemicals production. Curr. Opin. Biotechnol. 2015, 33, 60–72. [Google Scholar] [CrossRef] [PubMed]
- Bessou, C.; Ferchaud, F.; Gabrielle, B.; Mary, B. Biofuels, greenhouse gases and climate change. Agron. Sustain. Dev. 2011, 31, 1–79. [Google Scholar] [CrossRef]
- Asimakopoulos, K.; Gavala, H.N.; Skiadas, I.V. Reactor systems for syngas fermentation processes: A review. Chem. Eng. J. 2018, 348, 732–744. [Google Scholar] [CrossRef]
- Abubackar, H.N.; Veiga, M.C.; Kennes, C. Biological conversion of carbon monoxide: Rich syngas or waste gases to bioethanol. Biofuel. Bioprod. Bioref. 2011, 5, 93–114. [Google Scholar] [CrossRef]
- Griffin, D.W.; Schultz, M.A. Fuel and chemical products from biomass syngas: A comparison of gas fermentation to thermochemical conversion routes. Env. Prog. Sustain. Energy 2012, 31, 219–224. [Google Scholar] [CrossRef]
- Munasinghe, P.C.; Khanal, S.K. Biomass-derived syngas fermentation into biofuels: Opportunities and challenges. Bioresour. Technol. 2010, 101, 5013–5022. [Google Scholar] [CrossRef]
- Kremling, M.; Briesemeister, L.; Gaderer, M.; Fendt, S.; Spliethoff, H. Oxygen-blown entrained flow gasification of biomass: Impact of fuel parameters and oxygen stoichiometric ratio. Energy Fuels 2017, 31, 3949–3959. [Google Scholar] [CrossRef]
- Benevenuti, C.; Amaral, P.; Ferreira, T.; Seidl, P. Impacts of Syngas Composition on Anaerobic Fermentation. Reactions 2021, 2, 391–407. [Google Scholar] [CrossRef]
- Kumar, A.; Jones, D.; Hanna, M. Thermochemical biomass gasification: A review of the current status of the technology. Energies 2009, 2, 556–581. [Google Scholar] [CrossRef]
- Bengelsdorf, F.R.; Straub, M.; Dürre, P. Bacterial synthesis gas (syngas) fermentation. Environ. Technol. 2013, 34, 1639–1651. [Google Scholar] [CrossRef]
- Vees, C.A.; Neuendorf, C.S.; Pflügl, S. Towards continuous industrial bioprocessing with solventogenic and acetogenic clostridia: Challenges, progress and perspectives. J. Ind. Microbiol. Biotechnol. 2020, 47, 753–787. [Google Scholar] [CrossRef] [PubMed]
- Phillips, J.; Huhnke, R.; Atiyeh, H. Syngas Fermentation: A Microbial Conversion Process of Gaseous Substrates to Various Products. Fermentation 2017, 3, 28. [Google Scholar] [CrossRef]
- Pawlak-Kruczek, H.; Wnukowski, M.; Niedzwiecki, L.; Czerep, M.; Kowal, M.; Krochmalny, K.; Zgóra, J.; Ostrycharczyk, M.; Baranowski, M.; Tic, W.J.; et al. Torrefaction as a Valorization Method Used Prior to the Gasification of Sewage Sludge. Energies 2019, 12, 175. [Google Scholar] [CrossRef]
- Daniell, J.; Köpke, M.; Simpson, S. Commercial biomass syngas fermentation. Energies 2012, 5, 5372–5417. [Google Scholar] [CrossRef]
- Oliveira, L.; Röhrenbach, S.; Holzmüller, V.; Weuster-Botz, D. Continuous sulfide supply enhanced autotrophic production of alcohols with Clostridium ragsdalei. Bioresour. Bioprocess. 2022, 9. [Google Scholar] [CrossRef]
- Piatek, P.; Olsson, L.; Nygård, Y. Adaptation during propagation improves Clostridium autoethanogenum tolerance towards benzene, toluene and xylenes during gas fermentation. Bioresour. Technol. Rep. 2020, 12, 100564. [Google Scholar] [CrossRef]
- Mock, J.; Zheng, Y.; Mueller, A.P.; Ly, S.; Tran, L.; Segovia, S.; Nagaraju, S.; Köpke, M.; Dürre, P.; Thauer, R.K. Energy conservation associated with ethanol formation from H2 and CO2 in. J. Bacteriol. 2015, 18, 2965–2980. [Google Scholar] [CrossRef] [PubMed]
- Drake, H.L.; Gössner, A.S.; Daniel, S.L. Old acetogens, new light. Ann. N. Y. Acad. Sci. 2008, 1125, 100–128. [Google Scholar] [CrossRef]
- Ragsdale, S.W. The eastern and western branches of the Wood/Ljungdahl pathway: How the east and west were won. BioFactors 1997, 6, 3–11. [Google Scholar] [CrossRef]
- Ragsdale, S.W.; Pierce, E. Acetogenesis and the Wood-Ljungdahl pathway of CO2 fixation. Biochim. Biophys. Acta 2008, 12, 1873–1898. [Google Scholar] [CrossRef]
- Schuchmann, K.; Müller, V. Autotrophy at the thermodynamic limit of life: A model for energy conservation in acetogenic bacteria. Nat. Rev. Microbiol. 2014, 12, 809–821. [Google Scholar] [CrossRef]
- Liou, J.S.-C.; Balkwill, D.L.; Drake, G.R.; Tanner, R.S. Clostridium carboxidivorans sp. nov., a solvent-producing clostridium isolated from an agricultural settling lagoon, and reclassification of the acetogen Clostridium scatologenes strain SL1 as Clostridium drakei sp. nov. Int. J. Syst. Evol. Microbiol. 2005, 55, 2085–2091. [Google Scholar] [CrossRef] [PubMed]
- Koller, M. Biotechnological approaches to generate biogenic solvents and engery carrieres from renewable resources. Eurobiotech J. 2023, 7, 96–120. [Google Scholar] [CrossRef]
- Lee, J.; Lee, J.W.; Chae, C.G.; Kwon, S.J.; Kim, Y.J.; Lee, J.-H.; Lee, H.S. Domestication of the novel alcohologenic acetogen Clostridium sp. AWRP: From isolation to characterization for syngas fermentation. Biotechnol. Biofuels 2019, 12, 228. [Google Scholar] [CrossRef]
- Abrini, J.; Naveau, H.; Nyns, E.-J. Clostridium autoethanogenum, sp. nov., an anaerobic bacterium that produces ethanol from carbon monoxide. Arch. Microbiol. 1994, 161, 345–351. [Google Scholar] [CrossRef]
- Humphreys, C.M.; McLean, S.; Schatschneider, S.; Millat, T.; Henstra, A.M.; Annan, F.J.; Breitkopf, R.; Pander, B.; Piatek, P.; Rowe, P.; et al. Whole genome sequence and manual annotation of Clostridium autoethanogenum, an industrially relevant bacterium. BMC Genomics. 2015, 16, 1085. [Google Scholar] [CrossRef] [PubMed]
- Weuster-Botz, D. Process Engineering Aspects for the Microbial Conversion of C1 Gases; Springer: Berlin/Heidelberg, Germany, 2021; Volume 180, ISBN 978-3-031-06853-9. [Google Scholar]
- Abubackar, H.N.; Veiga, M.C.; Kennes, C. Carbon monoxide fermentation to ethanol by Clostridium autoethanogenum in a bioreactor with no accumulation of acetic acid. Bioresour. Technol. 2015, 186, 122–127. [Google Scholar] [CrossRef]
- Krishna, K.V.; Bharathi, N.; George Shiju, S.; Alagesan Paari, K.; Malaviya, A. An updated review on advancement in fermentative production strategies for biobutanol using Clostridium spp. Environ. Sci. Pollut. Res. Int. 2022, 29, 47988–48019. [Google Scholar] [CrossRef] [PubMed]
- Mayer, A.; Schädler, T.; Trunz, S.; Stelzer, T.; Weuster-Botz, D. Carbon monoxide conversion with Clostridium aceticum. Biotechnol. Bioeng. 2018, 115, 2740–2750. [Google Scholar] [CrossRef]
- Liew, F.; Henstra, A.M.; Köpke, M.; Winzer, K.; Simpson, S.D.; Minton, N.P. Metabolic engineering of Clostridium autoethanogenum for selective alcohol production. Metab. Eng. 2017, 40, 104–114. [Google Scholar] [CrossRef]
- Liew, F.; Henstra, A.M.; Winzer, K.; Köpke, M.; Simpson, S.D.; Minton, N.P. Insights into CO2 fixation pathway of Clostridium autoethanogenum by targeted mutagenesis. mBio 2016, 7, e00427-16. [Google Scholar] [CrossRef]
- Nagaraju, S.; Davies, N.K.; Walker, D.J.F.; Köpke, M.; Simpson, S.D. Genome editing of Clostridium autoethanogenum using CRISPR/Cas9. Biotechnol. Biofuels 2016, 9, 219. [Google Scholar] [CrossRef]
- Piatek, P.; Humphreys, C.; Raut, M.P.; Wright, P.C.; Simpson, S.; Köpke, M.; Minton, N.P.; Winzer, K. Agr Quorum Sensing influences the Wood-Ljungdahl pathway in Clostridium autoethanogenum. Sci. Rep. 2022, 12, 411. [Google Scholar] [CrossRef]
- Sun, X.; Atiyeh, H.K.; Huhnke, R.L.; Tanner, R.S. Syngas fermentation process development for production of biofuels and chemicals: A review. Bioresour. Technol. Rep. 2019, 7, 100279. [Google Scholar] [CrossRef]
- Dykstra, J.C.; van Oort, J.; Yazdi, A.T.; Vossen, E.; Patinios, C.; van der Oost, J.; Sousa, D.Z.; Kengen, S.W.M. Metabolic engineering of Clostridium autoethanogenum for ethyl acetate production from CO. Microb. Cell Fact. 2022, 21, 243. [Google Scholar] [CrossRef]
- Müller, A.; Köpke, M. Recombinant Microorganisms Comprising Stereospecific Diol Dehydratase Enzyme and Methods Related Thereto. U.S. Patent 9,284,564 B2, 15 March 2016. [Google Scholar]
- Kennes, D.; Abubackar, H.N.; Diaz, M.; Veiga, M.C.; Kennes, C. Bioethanol production from biomass: Carbohydrate vs syngas fermentation. J. Chem. Technol. Biotechnol. 2016, 91, 304–317. [Google Scholar] [CrossRef]
- Baleeiro, F.C.F.; Kleinsteuber, S.; Neumann, A.; Sträuber, H. Syngas-aided anaerobic fermentation for medium-chain carboxylate and alcohol production: The case for microbial communities. Appl. Microbiol. Biotechnol. 2019, 103, 8689–8709. [Google Scholar] [CrossRef] [PubMed]
- Diender, M.; Stams, A.J.M.; Sousa, D.Z. Production of medium-chain fatty acids and higher alcohols by a synthetic co-culture grown on carbon monoxide or syngas. Biotechnol. Biofuels 2016, 9, 82. [Google Scholar] [CrossRef] [PubMed]
- Bäumler, M.; Burgmaier, V.; Herrmann, F.; Mentges, J.; Schneider, M.; Ehrenreich, A.; Liebl, W.; Weuster-Botz, D. Continuous production of ethanol, 1-butanol and 1-hexanol from CO with a synthetic co-culture of clostridia applying a cascade of stirred-tank bioreactors. Microorganisms 2023, 11, 1003. [Google Scholar] [CrossRef] [PubMed]
- Du, Y.; Zou, W.; Zhang, K.; Ye, G.; Yang, J. Advances and Applications of Clostridium Co-culture Systems in Biotechnology. Front. Microbiol. 2020, 11, 560223. [Google Scholar] [CrossRef] [PubMed]
- He, Q.; Hemme, C.L.; Jiang, H.; He, Z.; Zhou, J. Mechanisms of enhanced cellulosic bioethanol fermentation by co-cultivation of Clostridium and Thermoanaerobacter spp. Bioresour. Technol. 2011, 102, 9586–9592. [Google Scholar] [CrossRef]
- Valgepea, K.; de Souza Pinto Lemgruber, R.; Abdalla, T.; Binos, S.; Takemori, N.; Takemori, A.; Tanaka, Y.; Tappel, R.; Köpke, M.; Simpson, S.D.; et al. H2 drives metabolic rearrangements in gas-fermenting Clostridium autoethanogenum. Biotechnol. Biofuels 2018, 11, 55. [Google Scholar] [CrossRef] [PubMed]
- Heffernan, J.K.; Valgepea, K.; de Souza Pinto Lemgruber, R.; Casini, I.; Plan, M.; Tappel, R.; Simpson, S.D.; Köpke, M.; Nielsen, L.K.; Marcellin, E. Enhancing CO2-valorization using Clostridium autoethanogenum for sustainable fuel and chemicals production. Front. Bioeng. Biotechnol. 2020, 8, 204. [Google Scholar] [CrossRef] [PubMed]
- Kantzow, C.; Mayer, A.; Weuster-Botz, D. Continuous gas fermentation by Acetobacterium woodii in a submerged membrane reactor with full cell retention. J. Biotechnol. 2015, 212, 11–18. [Google Scholar] [CrossRef] [PubMed]
- Riegler, P.; Bieringer, E.; Chrusciel, T.; Stärz, M.; Löwe, H.; Weuster-Botz, D. Continuous conversion of CO2/H2 with Clostridium aceticum in biofilm reactors. Biores Technol. 2019, 291, 121760. [Google Scholar] [CrossRef] [PubMed]
- Gunes, B. A critical review on biofilm-based reactor systems for enhanced syngas fermentation processes. Renew. Sustain. Energy Rev. 2021, 143, 110950. [Google Scholar] [CrossRef]
- Jones, S.W.; Fast, A.G.; Carlson, E.D.; Wiedel, C.A.; Au, J.; Antoniewicz, M.R.; Papoutsakis, E.T.; Tracy, B.P. CO2 fixation by anaerobic non-photosynthetic mixotrophy for improved carbon conversion. Nat. Commun. 2016, 7, 12800. [Google Scholar] [CrossRef] [PubMed]
- Emerson, D.F.; Stephanopoulos, G. Limitations in converting waste gases to fuels and chemicals. Curr. Opin. Biotechnol. 2019, 59, 39–45. [Google Scholar] [CrossRef] [PubMed]
- Maru, B.T.; Munasinghe, P.C.; Gilary, H.; Jones, S.W.; Tracy, B.P. Fixation of CO2 and CO on a diverse range of carbohydrates using anaerobic, non-photosynthetic mixotrophy. FEMS Microbiol. Lett. 2018, 365, fny039. [Google Scholar] [CrossRef]
- Knesebeck, M.; Schäfer, D.; Schmitz, K.; Rüllke, M.; Benz, J.P.; Weuster-Botz, D. Enzymatic one-pot hydrolysis of extracted sugar beet press pulp after solid-state fermentation with an engineered Aspergillus niger strain. Fermentation 2023, 9, 582. [Google Scholar] [CrossRef]
- Fehér, C. Novel approaches for biotechnological production and application of L-arabinose. J. Carbohydr. Chem. 2018, 37, 251–284. [Google Scholar] [CrossRef]
- Herrera, A.; Téllez-Luis, S.J.; Ramírez, J.A.; Vázquez, M. Production of Xylose from Sorghum Straw Using Hydrochloric Acid. J. Cereal Sci. 2003, 37, 267–274. [Google Scholar] [CrossRef]
- Wamelink, M.M.C.; Struys, E.A.; Jakobs, C. The biochemistry, metabolism and inherited defects of the pentose phosphate pathway: A review. J. Inherit. Metab. Dis. 2008, 31, 703–717. [Google Scholar] [CrossRef] [PubMed]
- Xiao, H.; Gu, X.; Ning, Y.; Yang, Y.; Mitchell, W.J.; Jiang, W.; Yang, S. Confirmation and elimination of xylose metabolism bottlenecks in glucose phosphoenolpyruvate- dependent phosphotransferase system-deficient Clostridium acetbutylicum for simultaneous utilization of glucose, xylose, and arabinose. Appl. Environ. Microbiol. 2011, 2011, 7886–7895. [Google Scholar] [CrossRef] [PubMed]
- Aristilde, L.; Lewis, I.A.; Park, J.O.; Rabinowitz, J.D. Hierarchy in pentose sugar metabolism in Clostridium acetobutylicum. Appl. Environ. Microbiol. 2015, 4, 1452–1462. [Google Scholar] [CrossRef] [PubMed]
- Wu, C.; Cano, M.; Gao, X.; Lo, J.; Maness, P.; Xiong, W. A quantitative lens on anaerobic life: Leveraging the state-of-the-art fluxomics approach to explore clostridial metabolism. Curr. Opin. Biotechnol. 2020, 64, 47–54. [Google Scholar] [CrossRef]
- Vees, C.A.; Herwig, C.; Pflügl, S. Mixotrophic co-utilization of glucose and carbon monoxide boosts ethanol and butanol productivity of continuous Clostridium carboxidivorans cultures. Bioresour. Technol. 2022, 353, 127138. [Google Scholar] [CrossRef]
- Mann, M.; Munch, G.; Regestein, L.; Rehmann, L. Cultivation strategies of Clostridium autoethanogenum on xylose and carbon monoxide combination. ACS Sustain. Chem. Eng. 2020, 8, 2632–2639. [Google Scholar] [CrossRef]
- Abubackar, H.N.; Fernández-Naveira, Á.; Veiga, M.C.; Kennes, C. Impact of cyclic pH shifts on carbon monoxide fermentation to ethanol by Clostridium autoethanogenum. Fuel 2016, 178, 56–62. [Google Scholar] [CrossRef]
- Oliveira, L.; Rückel, A.; Nordgauer, L.; Schlumprecht, P.; Hutter, E.; Weuster-Botz, D. Comparison of syngas-fermentation Clostrida in stirred-tank bioreactors and the effects of varing syngas impurities. Microorganisms 2022, 10, 681. [Google Scholar] [CrossRef]
- Jeverica, S.; El Sayed, F.; Čamernik, P.; Kocjančič, B.; Sluga, B.; Rottman, M.; Papst, L. Growth detection of Cutibacterium acnes from orthopaedic implant-associated infections in anaerobic bottles from BACTEC and BacT/ALERT blood culture systems and comparison with conventional culture media. Anaerobe 2020, 61, 102133. [Google Scholar] [CrossRef] [PubMed]
- Rückel, A.; Oppelt, A.; Leuter, P.; Johne, P.; Fendt, S.; Weuster-Botz, D. Conversion of Syngas from Entrained Flow Gasification of Biogenic Residues with Clostridium carboxidivorans and Clostridium autoethanogenum. Fermentation 2022, 8, 465. [Google Scholar] [CrossRef]
- Doll, K.; Rückel, A.; Kämpf, P.; Wende, M.; Weuster-Botz, D. Two stirred-tank bioreactors in series enable continuous production of alcohols from carbon monoxide with Clostridium carboxidivorans. Bioprocess. Biosyst. Eng. 2018, 41, 1403–1416. [Google Scholar] [CrossRef] [PubMed]
- Köpke, M.; Gerth, M.L.; Maddock, D.J.; Müller, A.P.; Liew, F.; Simpson, S.D.; Patrick, W.M. Reconstruction of an acetogenic 2,3-butanediol pathway involving a novel NADPH-dependent primary-secondary acohol dehydrogenase. Appl. Environ. Microbiol. 2014, 11, 3394–3403. [Google Scholar] [CrossRef]
- Duval, A.; Sarbu, A.; Dalmas, F.; Albertini, D.; Avérous, L. 2,3-Butanediol as a biobased chain extender for thermoplastic polyurethanes: Influence of stereochemistry on macromolecular architectures and properties. Macromolecules 2022, 55, 5371–5381. [Google Scholar] [CrossRef]
- Köpke, M.; Mihalcea, C.; Liew, F.; Tizard, J.H.; Ali, M.S.; Conolly, J.J.; Al-Sinawi, B.; Simpson, S.D. 2,3-butanediol production by acetogenic bacteria, an alternative route to chemical synthesis, using industrial waste gas. Appl. Environ. Microbiol. 2011, 77, 5467–5475. [Google Scholar] [CrossRef]
- Lee, C.-G.; Jo, C.Y.; Lee, K.B.; Mun, S. Optimization of a simulated-moving-bed process for continuous separation of racemic and meso-2,3-butanediol using an efficient optimization tool based on nonlinear standing-wave-design method. Sep. Purif. Technol. 2021, 254, 117597. [Google Scholar] [CrossRef]
 10.3 g L−1,
  13.7 g L−1,
  and 19.3 g L−1) with C. autoethanogenum in stirred-tank bioreactors with continuous gassing (390 mbar N2, 300 mbar CO, 220 mbar H2, and 90 mbar CO2) compared to the autotrophic reference batch process (open symbols). (Fgas = 5 NL h−1, 37 °C, pH 6.0, and P V−1 = 15.1 W L−1). (a) D-xylose concentration; (b) Carbon monoxide uptake rate; (c) Cell dry weight concentration (CDW); (d) Acetate concentration; (e) Ethanol concentration; (f) D-2-3-butandediol concentration. The error bars indicate the minimum and maximum values of two individual autotrophic batch processes.
10.3 g L−1, 13.7 g L−1, and 19.3 g L−1) with C. autoethanogenum in stirred-tank bioreactors with continuous gassing (390 mbar N2, 300 mbar CO, 220 mbar H2, and 90 mbar CO2) compared to the autotrophic reference batch process (open symbols). (Fgas = 5 NL h−1, 37 °C, pH 6.0, and P V−1 = 15.1 W L−1). (a) D-xylose concentration; (b) Carbon monoxide uptake rate; (c) Cell dry weight concentration (CDW); (d) Acetate concentration; (e) Ethanol concentration; (f) D-2-3-butandediol concentration. The error bars indicate the minimum and maximum values of two individual autotrophic batch processes.
and 19.3 g L−1) with C. autoethanogenum in stirred-tank bioreactors with continuous gassing (390 mbar N2, 300 mbar CO, 220 mbar H2, and 90 mbar CO2) compared to the autotrophic reference batch process (open symbols). (Fgas = 5 NL h−1, 37 °C, pH 6.0, and P V−1 = 15.1 W L−1). (a) D-xylose concentration; (b) Carbon monoxide uptake rate; (c) Cell dry weight concentration (CDW); (d) Acetate concentration; (e) Ethanol concentration; (f) D-2-3-butandediol concentration. The error bars indicate the minimum and maximum values of two individual autotrophic batch processes.
10.3 g L−1, 13.7 g L−1, and 19.3 g L−1) with C. autoethanogenum in stirred-tank bioreactors with continuous gassing (390 mbar N2, 300 mbar CO, 220 mbar H2, and 90 mbar CO2) compared to the autotrophic reference batch process (open symbols). (Fgas = 5 NL h−1, 37 °C, pH 6.0, and P V−1 = 15.1 W L−1). (a) D-xylose concentration; (b) Carbon monoxide uptake rate; (c) Cell dry weight concentration (CDW); (d) Acetate concentration; (e) Ethanol concentration; (f) D-2-3-butandediol concentration. The error bars indicate the minimum and maximum values of two individual autotrophic batch processes.
 9.8 g L−1,
  14.2/14.7 g L−1, and
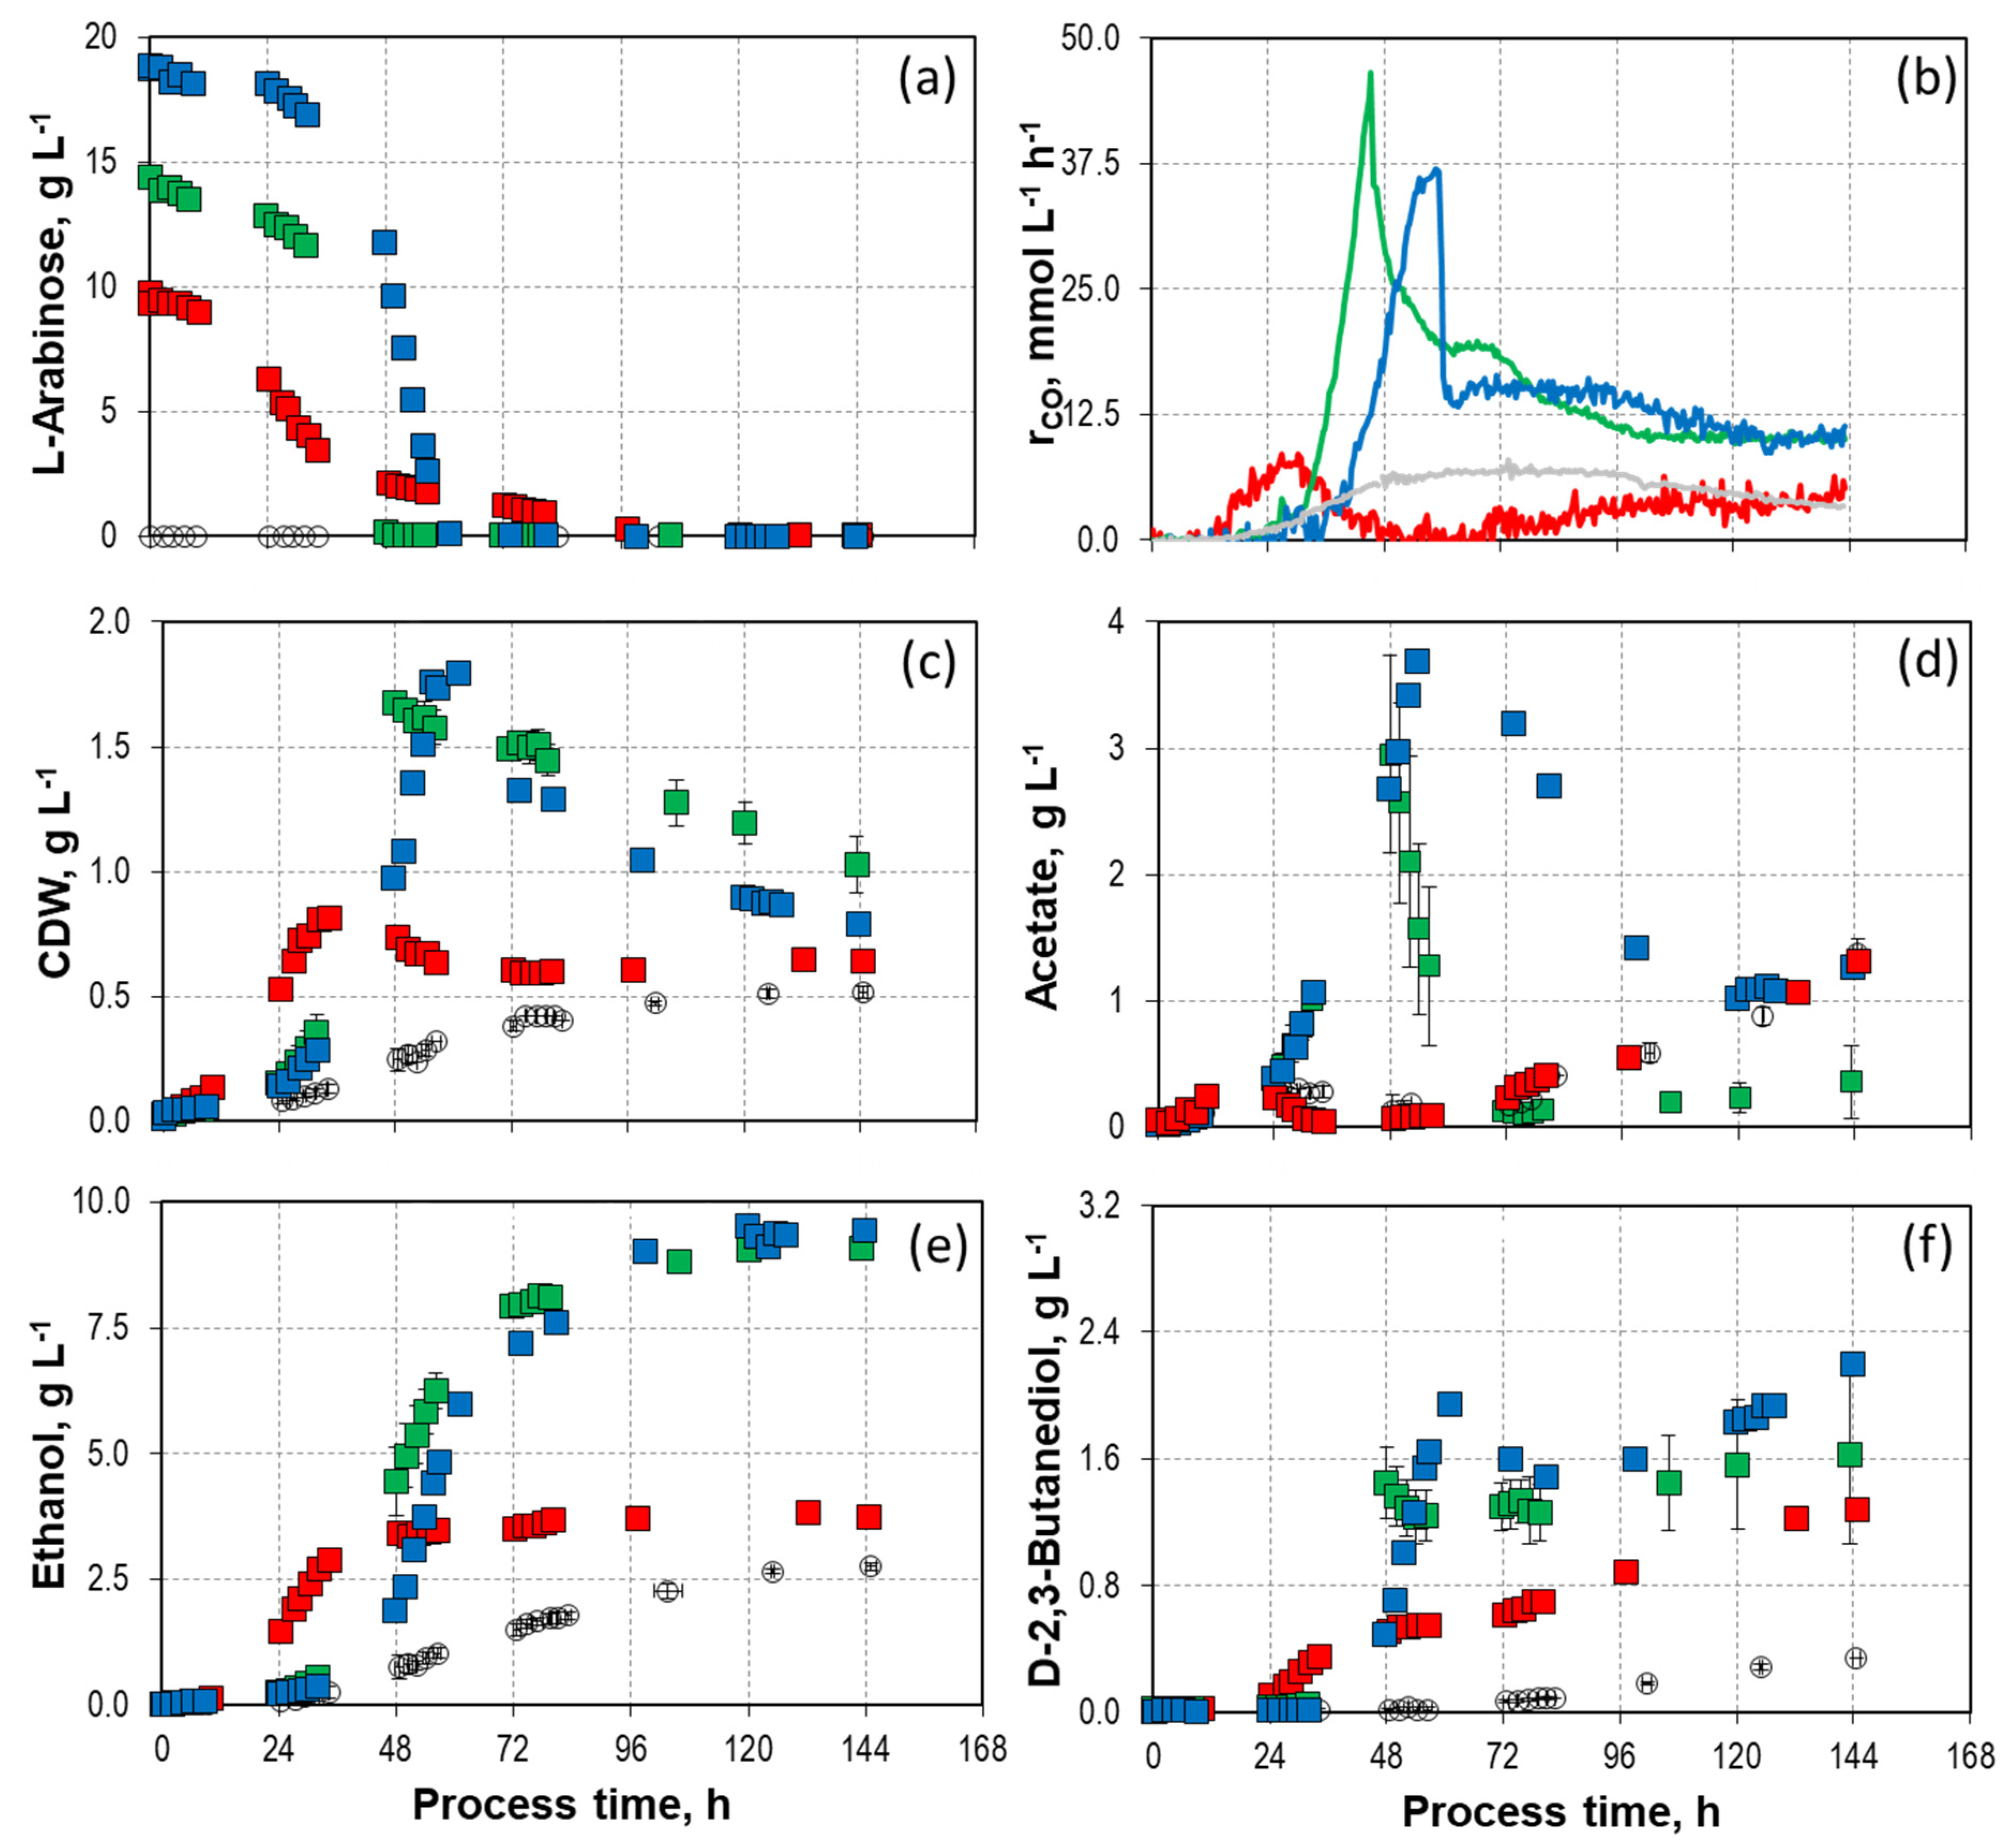
  18.8 g L−1) with C. autoethanogenum in stirred-tank bioreactors with continuous gassing (390 mbar N2, 300 mbar CO, 220 mbar H2, and 90 mbar CO2) compared to the autotrophic reference batch process (open symbols). (Fgas = 5 NL h−1, 37 °C, pH 6.0, and P V−1 = 15.1 W L−1). (a) D-arabinose concentration; (b) Carbon monoxide uptake rate; (c) Cell dry weight concentration (CDW); (d) Acetate concentration; (e) Ethanol concentration; (f) D-2-3-butandediol concentration. The error bars indicate the minimum and maximum values of two individual autotrophic batch processes and two individual mixotrophic processes with 14.2 g L−1–14.7 g L−1 (due to the slight discrepancy between the minimum and maximum values at some data points, not all deviations are visible).
9.8 g L−1, 14.2/14.7 g L−1, and 18.8 g L−1) with C. autoethanogenum in stirred-tank bioreactors with continuous gassing (390 mbar N2, 300 mbar CO, 220 mbar H2, and 90 mbar CO2) compared to the autotrophic reference batch process (open symbols). (Fgas = 5 NL h−1, 37 °C, pH 6.0, and P V−1 = 15.1 W L−1). (a) D-arabinose concentration; (b) Carbon monoxide uptake rate; (c) Cell dry weight concentration (CDW); (d) Acetate concentration; (e) Ethanol concentration; (f) D-2-3-butandediol concentration. The error bars indicate the minimum and maximum values of two individual autotrophic batch processes and two individual mixotrophic processes with 14.2 g L−1–14.7 g L−1 (due to the slight discrepancy between the minimum and maximum values at some data points, not all deviations are visible).
18.8 g L−1) with C. autoethanogenum in stirred-tank bioreactors with continuous gassing (390 mbar N2, 300 mbar CO, 220 mbar H2, and 90 mbar CO2) compared to the autotrophic reference batch process (open symbols). (Fgas = 5 NL h−1, 37 °C, pH 6.0, and P V−1 = 15.1 W L−1). (a) D-arabinose concentration; (b) Carbon monoxide uptake rate; (c) Cell dry weight concentration (CDW); (d) Acetate concentration; (e) Ethanol concentration; (f) D-2-3-butandediol concentration. The error bars indicate the minimum and maximum values of two individual autotrophic batch processes and two individual mixotrophic processes with 14.2 g L−1–14.7 g L−1 (due to the slight discrepancy between the minimum and maximum values at some data points, not all deviations are visible).
9.8 g L−1, 14.2/14.7 g L−1, and 18.8 g L−1) with C. autoethanogenum in stirred-tank bioreactors with continuous gassing (390 mbar N2, 300 mbar CO, 220 mbar H2, and 90 mbar CO2) compared to the autotrophic reference batch process (open symbols). (Fgas = 5 NL h−1, 37 °C, pH 6.0, and P V−1 = 15.1 W L−1). (a) D-arabinose concentration; (b) Carbon monoxide uptake rate; (c) Cell dry weight concentration (CDW); (d) Acetate concentration; (e) Ethanol concentration; (f) D-2-3-butandediol concentration. The error bars indicate the minimum and maximum values of two individual autotrophic batch processes and two individual mixotrophic processes with 14.2 g L−1–14.7 g L−1 (due to the slight discrepancy between the minimum and maximum values at some data points, not all deviations are visible). 9.8 g L−1, 14.2/14.7 g L−1, and 18.8 g L−1) with C. autoethanogenum in stirred-tank bioreactors with continuous gassing (390 mbar N2, 300 mbar CO, 220 mbar H2, and 90 mbar CO2) compared to the autotrophic reference batch process (open symbols). (Fgas = 5 NL h−1, 37 °C, pH 6.0, and P V−1 = 15.1 W L−1). The error bars indicate the minimum and maximum values of two individual mixotrophic processes with 14.2 g L−1 and 14.7 g L−1 (due to the slight discrepancy between the minimum and maximum values at some data points, not all deviations are visible).
9.8 g L−1, 14.2/14.7 g L−1, and 18.8 g L−1) with C. autoethanogenum in stirred-tank bioreactors with continuous gassing (390 mbar N2, 300 mbar CO, 220 mbar H2, and 90 mbar CO2) compared to the autotrophic reference batch process (open symbols). (Fgas = 5 NL h−1, 37 °C, pH 6.0, and P V−1 = 15.1 W L−1). The error bars indicate the minimum and maximum values of two individual mixotrophic processes with 14.2 g L−1 and 14.7 g L−1 (due to the slight discrepancy between the minimum and maximum values at some data points, not all deviations are visible).
9.8 g L−1, 14.2/14.7 g L−1, and 18.8 g L−1) with C. autoethanogenum in stirred-tank bioreactors with continuous gassing (390 mbar N2, 300 mbar CO, 220 mbar H2, and 90 mbar CO2) compared to the autotrophic reference batch process (open symbols). (Fgas = 5 NL h−1, 37 °C, pH 6.0, and P V−1 = 15.1 W L−1). The error bars indicate the minimum and maximum values of two individual mixotrophic processes with 14.2 g L−1 and 14.7 g L−1 (due to the slight discrepancy between the minimum and maximum values at some data points, not all deviations are visible).
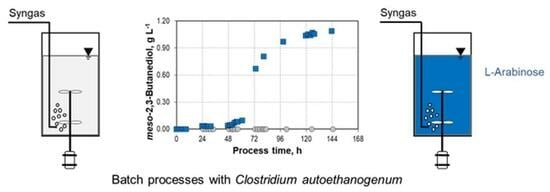
 ) and 14.2–14.7 g L−1 L-arabinose () with C. autoethanogenum in stirred-tank bioreactors with continuous gassing (390 mbar N2, 300 mbar CO, 220 mbar H2, and 90 mbar CO2). (Fgas = 5 NL h−1, 37 °C, pH 6.0, and P V−1 = 15.1 W L−1). (a) Sugar concentration; (b) Carbon monoxide uptake rate; (c) Cell dry weight concentration (CDW); (d) Acetate concentration; (e) Ethanol concentration; (f) D-2-3-butandediol concentration. The error bars indicate the minimum and maximum values of two individual mixotrophic processes with 14.2 g L−1–14.7 g L−1 (due to the slight discrepancy between the minimum and maximum values at some data points, not all deviations are visible).
) and 14.2–14.7 g L−1 L-arabinose () with C. autoethanogenum in stirred-tank bioreactors with continuous gassing (390 mbar N2, 300 mbar CO, 220 mbar H2, and 90 mbar CO2). (Fgas = 5 NL h−1, 37 °C, pH 6.0, and P V−1 = 15.1 W L−1). (a) Sugar concentration; (b) Carbon monoxide uptake rate; (c) Cell dry weight concentration (CDW); (d) Acetate concentration; (e) Ethanol concentration; (f) D-2-3-butandediol concentration. The error bars indicate the minimum and maximum values of two individual mixotrophic processes with 14.2 g L−1–14.7 g L−1 (due to the slight discrepancy between the minimum and maximum values at some data points, not all deviations are visible).
) and 14.2–14.7 g L−1 L-arabinose () with C. autoethanogenum in stirred-tank bioreactors with continuous gassing (390 mbar N2, 300 mbar CO, 220 mbar H2, and 90 mbar CO2). (Fgas = 5 NL h−1, 37 °C, pH 6.0, and P V−1 = 15.1 W L−1). (a) Sugar concentration; (b) Carbon monoxide uptake rate; (c) Cell dry weight concentration (CDW); (d) Acetate concentration; (e) Ethanol concentration; (f) D-2-3-butandediol concentration. The error bars indicate the minimum and maximum values of two individual mixotrophic processes with 14.2 g L−1–14.7 g L−1 (due to the slight discrepancy between the minimum and maximum values at some data points, not all deviations are visible).
 ), 14.2–14.7 g L−1 L-arabinose (
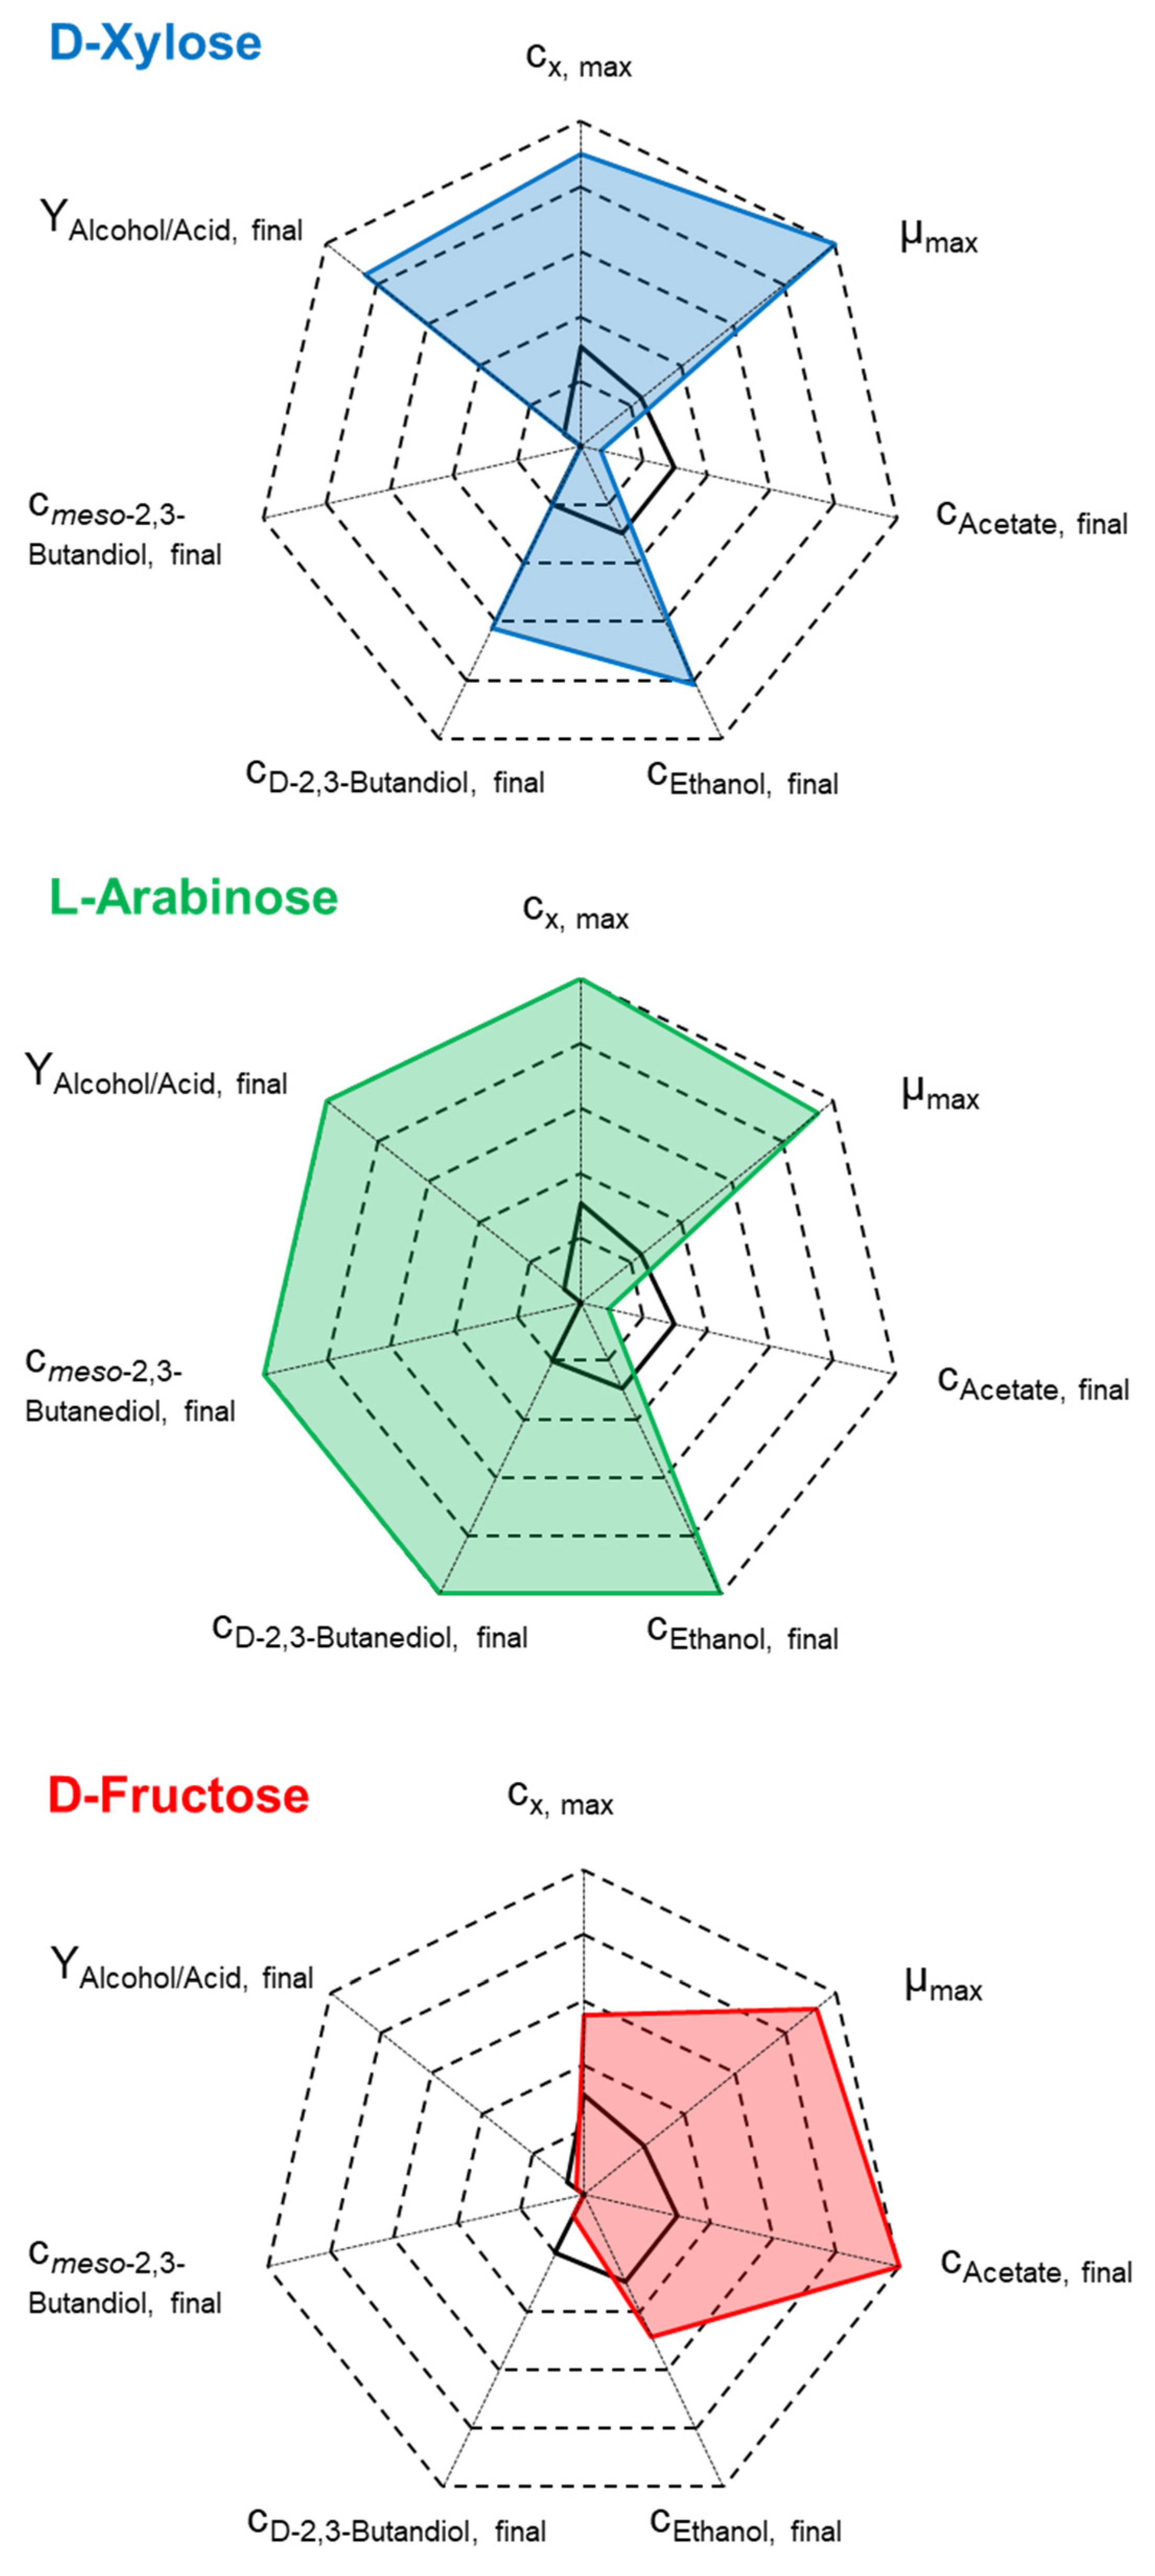
 ), and 13.7 g L−1 D-xylose (
 ) with C. autoethanogenum in stirred-tank bioreactors with continuous gassing (390 mbar N2, 300 mbar CO, 220 mbar H2, and 90 mbar CO2) compared to the autotrophic reference batch process (black line). (Fgas = 5 NL h−1, 37 °C, pH 6.0, and P V−1 = 15.1 W L−1).
), 14.2–14.7 g L−1 L-arabinose (), and 13.7 g L−1 D-xylose () with C. autoethanogenum in stirred-tank bioreactors with continuous gassing (390 mbar N2, 300 mbar CO, 220 mbar H2, and 90 mbar CO2) compared to the autotrophic reference batch process (black line). (Fgas = 5 NL h−1, 37 °C, pH 6.0, and P V−1 = 15.1 W L−1).
) with C. autoethanogenum in stirred-tank bioreactors with continuous gassing (390 mbar N2, 300 mbar CO, 220 mbar H2, and 90 mbar CO2) compared to the autotrophic reference batch process (black line). (Fgas = 5 NL h−1, 37 °C, pH 6.0, and P V−1 = 15.1 W L−1).
), 14.2–14.7 g L−1 L-arabinose (), and 13.7 g L−1 D-xylose () with C. autoethanogenum in stirred-tank bioreactors with continuous gassing (390 mbar N2, 300 mbar CO, 220 mbar H2, and 90 mbar CO2) compared to the autotrophic reference batch process (black line). (Fgas = 5 NL h−1, 37 °C, pH 6.0, and P V−1 = 15.1 W L−1).

| cD-xylose,initial, g L−1 | 0 min/max | 10.3 | 13.7 | 19.3 |
|---|---|---|---|---|
| µmax, h−1 | 0.06 | 0.26 | 0.25 | 0.25 |
| CDWmax, g L−1 | 0.49–0.54 | 1.11 | 1.50 | 1.65 |
| cAcetate,final, g L−1 | 1.11–1.15 | 0.10 | 0.24 | 0.40 |
| cEthanol,final, g L−1 | 2.62–2.77 | 5.31 | 7.38 | 8.68 |
| cD-2,3-butanediol,final, g L−1 | 0.31–0.32 | 0.45 | 0.99 (*) | 1.56 (*) |
| RatioAlcohol,final:Acetate,final, g g−1 | 2.64–2.68 | 57.60 | 34.88 | 25.60 |
| Carbon in medium, mmol C L−1 | 9.94 | 9.94 | 9.94 | 9.94 |
| Carbon in biomass, mmol C L−1 | 15.67–17.10 | 35.10 | 47.43 | 52.24 |
| Carbon in products, mmol C L−1 | 147.15–160.19 | 409.32 | 523.79 | 620.24 |
| CO consumption, mmol C L−1 | 626.31–652.06 | 703.31 | 864.10 | 1064.56 |
| CO2 production, mmol C L−1 | 400.96–438.80 | 652.94 | 611.80 | 1067.11 |
| CO cons./CO2 prod., - | 1.49–1.56 | 1.08 | 1.41 | 1.00 |
| CO consumptionmax, mmol L h−1 | 7.91–8.15 | 24.31 | 28.33 | 28.56 |
| C-balance (recovery), % | 90.66–91.10 | 105.10 | 90.01 | 101.24 |
| cD-arabinose,initial, g L−1 | 0 min/max | 9.8 | 14.2–14.7 min/max | 18.8 |
|---|---|---|---|---|
| µmax, h−1 | 0.06 | 0.29 | 0.20–0.27 | 0.21 |
| CDWmax, g L−1 | 0.49–0.54 | 0.82 | 1.66–1.68 | 1.80 |
| cAcetate,final, g L−1 | 1.11–1.15 | 1.19 | 0.19–0.50 | 1.18 |
| cEthanol,final, g L−1 | 2.62–2.77 | 3.77 | 8.97–9.18 | 9.39 |
| cD-2,3-butanediol,final, g L−1 | 0.31–0.32 | 1.25 | 1.11–2.08 | 2.07 |
| cmeso-2,3-butanediol,final, g L−1 | - | 0.10 | 0.92–1.08 | 1.07 |
| RatioAlcohol,final:Acetate,final, g g−1 | 2.64–2.68 | 4.30 | 24.68–57.89 | 10.61 |
| Carbon in medium, mmol C L−1 | 9.94 | 9.94 | 9.94 | 9.94 |
| Carbon in biomass, mmol C L−1 | 15.67–17.10 | 25.80 | 52.60–53.20 | 56.84 |
| Carbon in products, mmol C L−1 | 147.15–160.19 | 133.86 | 557.05–611.36 | 649.18 |
| CO consumption, mmol C L−1 | 626.31–652.06 | 388.59 | 1601.10–1698.14 | 1538.24 |
| CO2 production, mmol C L−1 | 400.96–438.80 | 505.61 | 1274.15–1284.48 | 1298.70 |
| CO cons./CO2 prod., - | 1.49–1.56 | 0.77 | 1.26–1.32 | 1.18 |
| CO consumptionmax, mmol L h−1 | 7.91–8.15 | 8.57 | 45.59–45.88 | 37.01 |
| C-balance (recovery), % | 90.66–91.10 | 91.87 | 90.51–92.83 | 92.27 |
Disclaimer/Publisher’s Note: The statements, opinions and data contained in all publications are solely those of the individual author(s) and contributor(s) and not of MDPI and/or the editor(s). MDPI and/or the editor(s) disclaim responsibility for any injury to people or property resulting from any ideas, methods, instructions or products referred to in the content. |
© 2024 by the authors. Licensee MDPI, Basel, Switzerland. This article is an open access article distributed under the terms and conditions of the Creative Commons Attribution (CC BY) license (https://creativecommons.org/licenses/by/4.0/).
Share and Cite
Oppelt, A.; Rückel, A.; Rupp, M.; Weuster-Botz, D. Mixotrophic Syngas Conversion Enables the Production of meso-2,3-butanediol with Clostridium autoethanogenum. Fermentation 2024, 10, 102. https://doi.org/10.3390/fermentation10020102
Oppelt A, Rückel A, Rupp M, Weuster-Botz D. Mixotrophic Syngas Conversion Enables the Production of meso-2,3-butanediol with Clostridium autoethanogenum. Fermentation. 2024; 10(2):102. https://doi.org/10.3390/fermentation10020102
Chicago/Turabian StyleOppelt, Anne, Anton Rückel, Markus Rupp, and Dirk Weuster-Botz. 2024. "Mixotrophic Syngas Conversion Enables the Production of meso-2,3-butanediol with Clostridium autoethanogenum" Fermentation 10, no. 2: 102. https://doi.org/10.3390/fermentation10020102