
Customised Microporous Carbon 3D Structures with Good Mechanical Properties and High Nitrogen Content Obtained from Whey Powders
 , ,
, ,  and
and
Abstract
:1. Introduction
2. Materials and Methods
2.1. Synthesis and Activation of the Whey-Derived Carbon Monoliths
2.2. Characterisation Methods
3. Results and Discussion
3.1. Customised 3D Structures Made of Carbonised Whey Powders
3.2. Thermal Activation of the Whey-Derived 3D Carbons
3.3. Chemical Activation of the Whey-Derived 3D Structures
3.3.1. KOH Activation
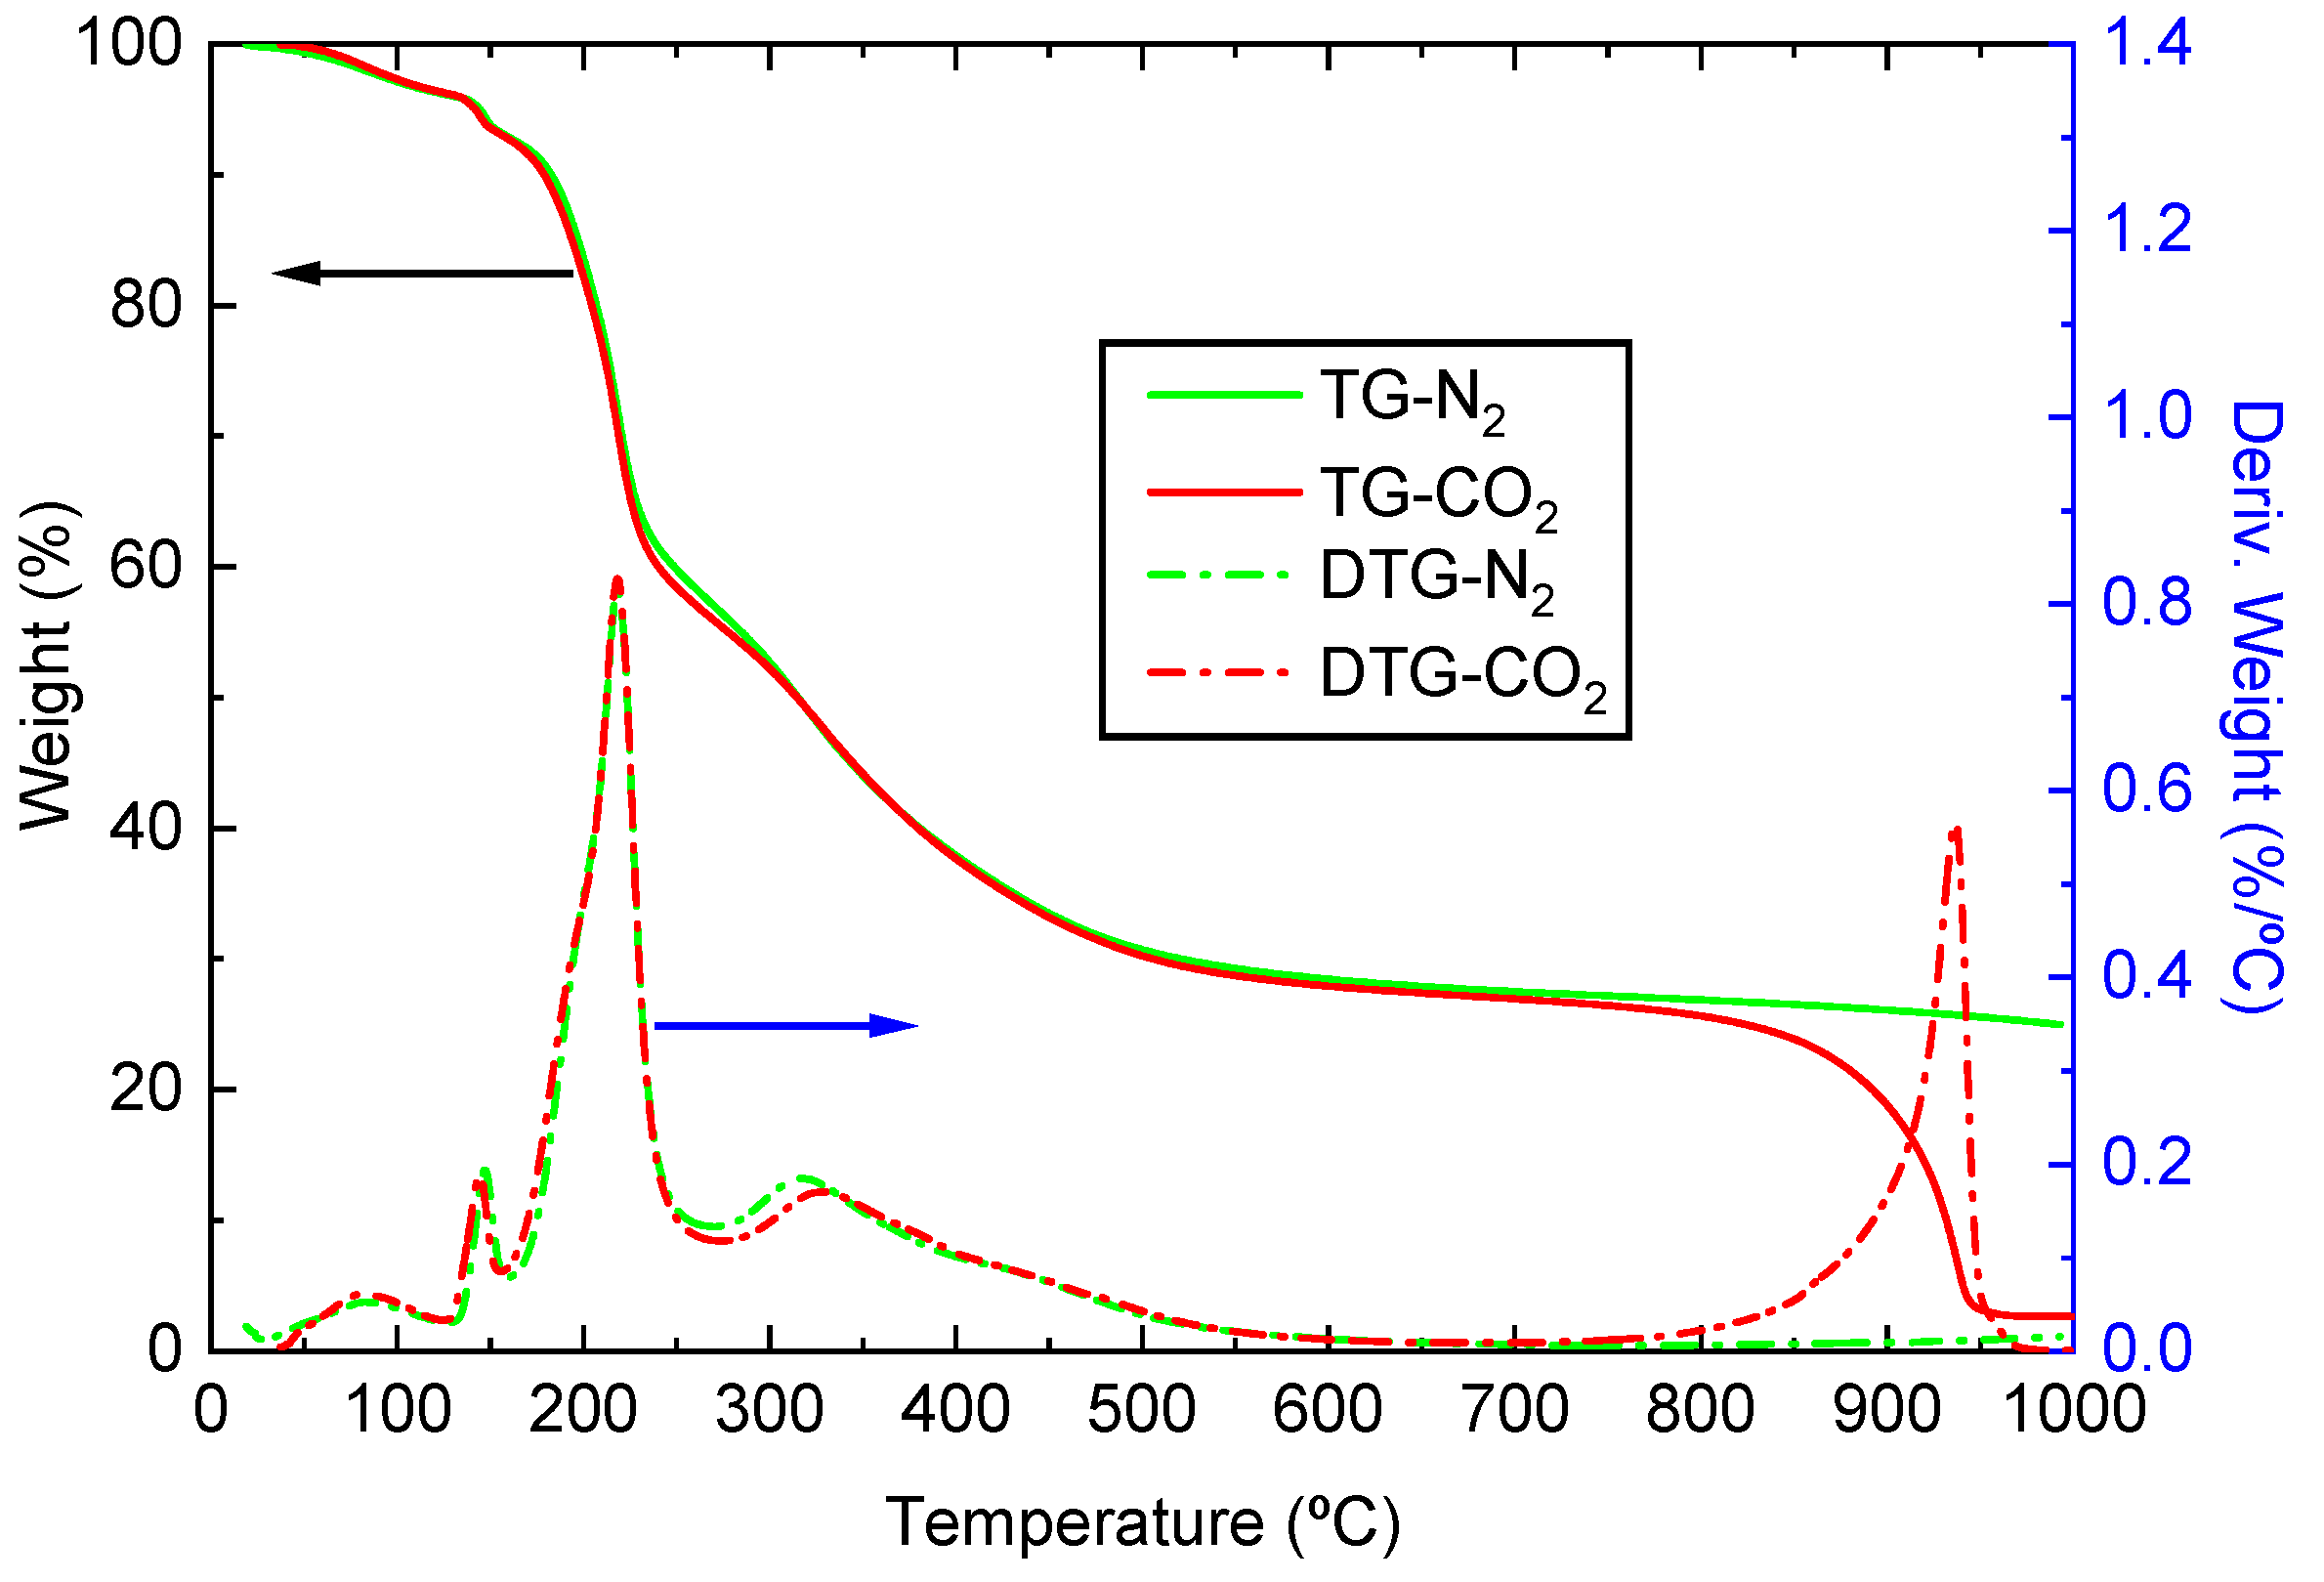
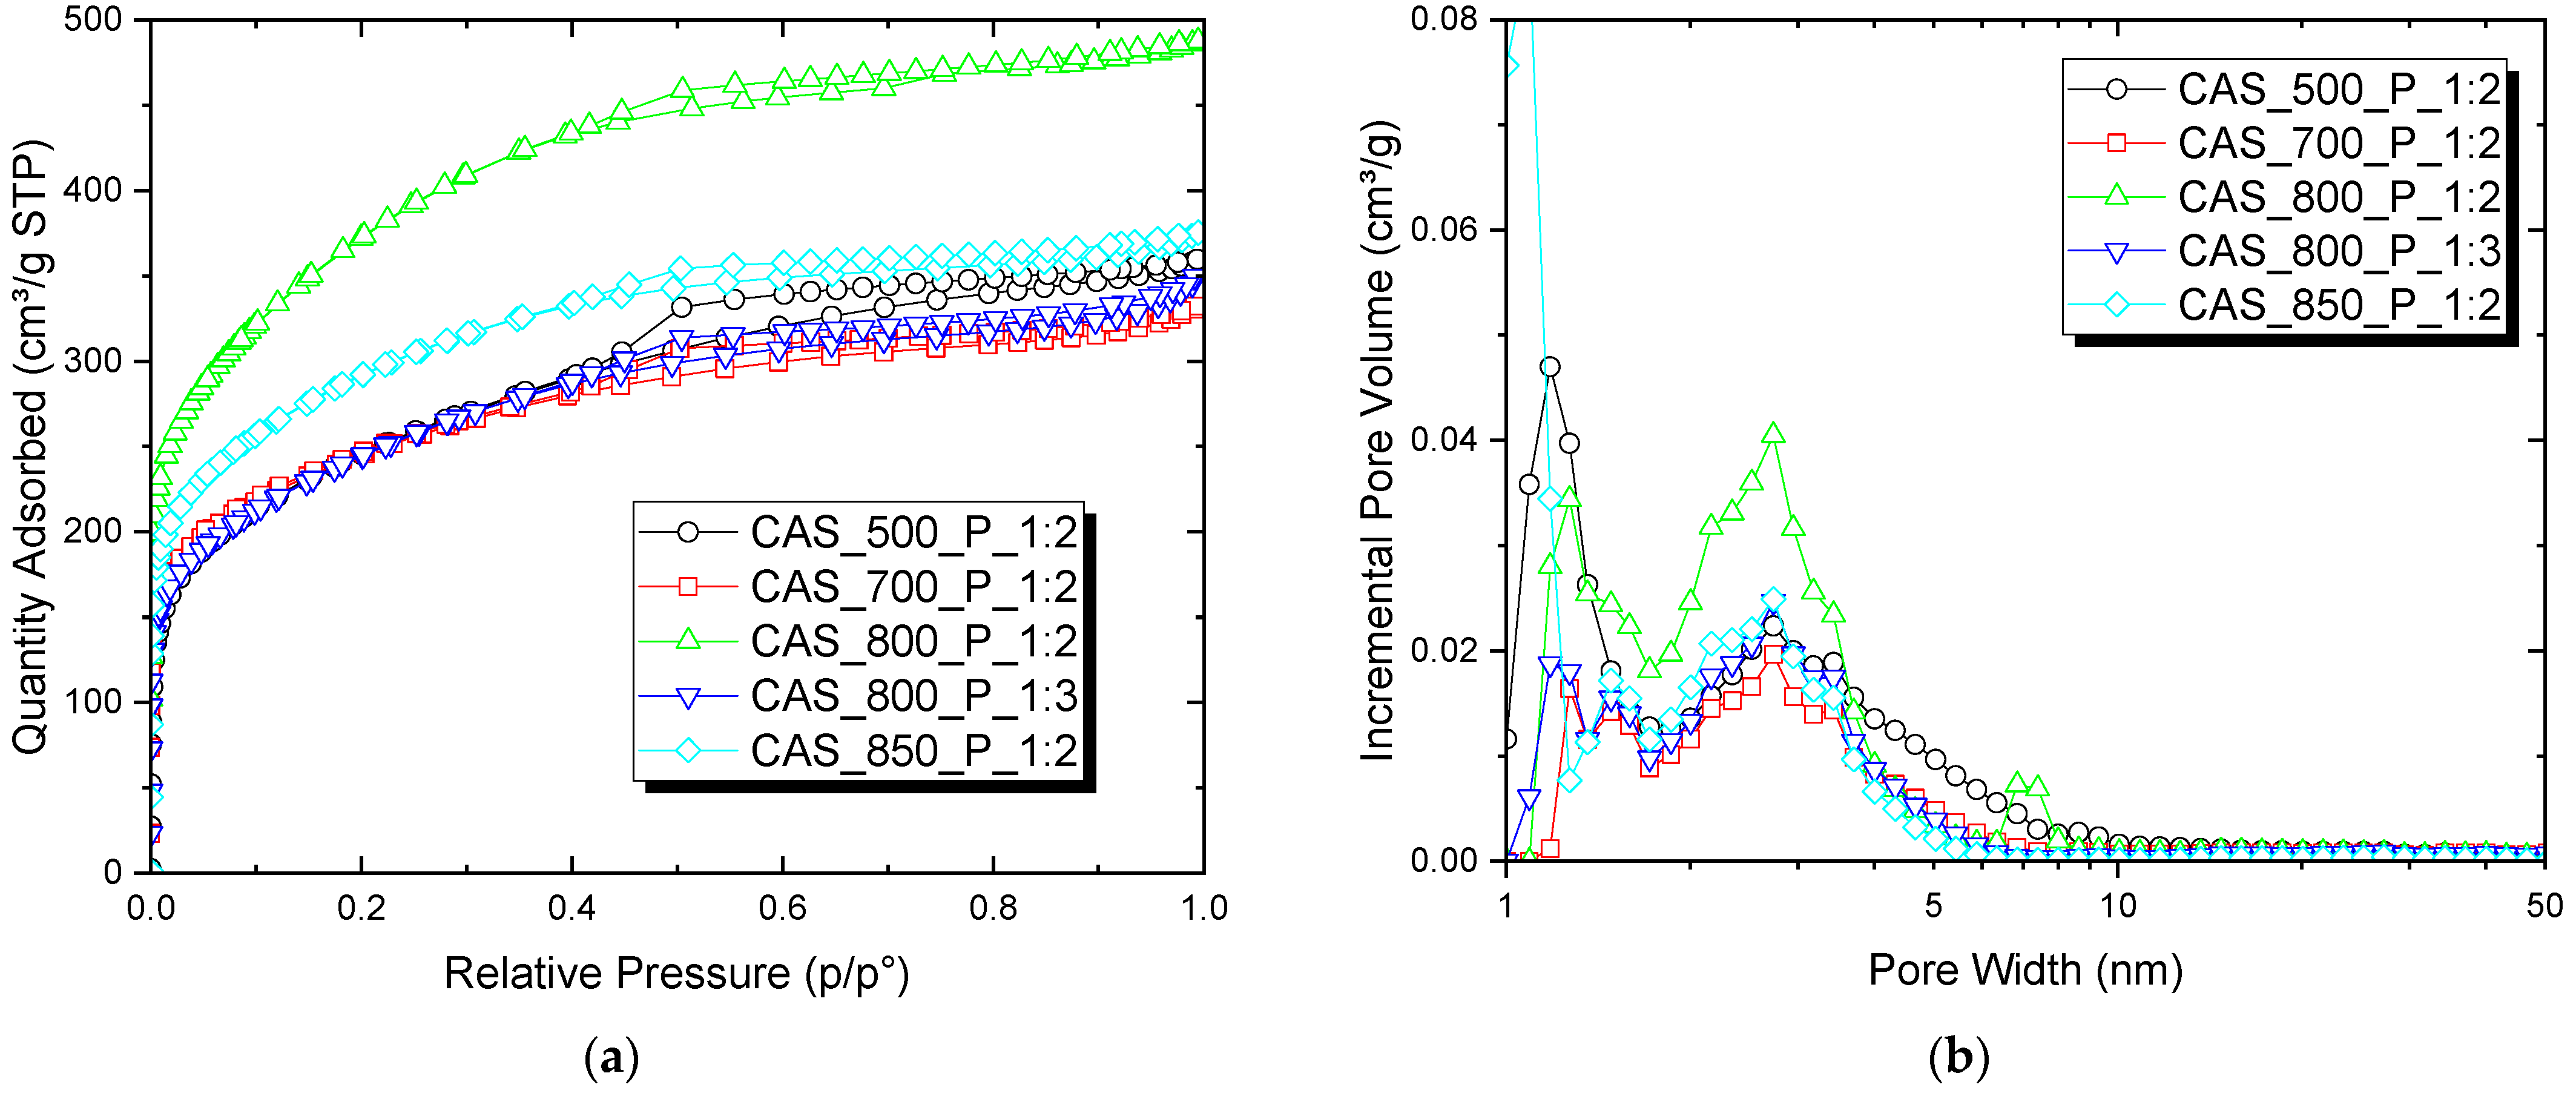
3.3.2. H3PO4 Activation
3.4. Further Characterisation of Selected Samples
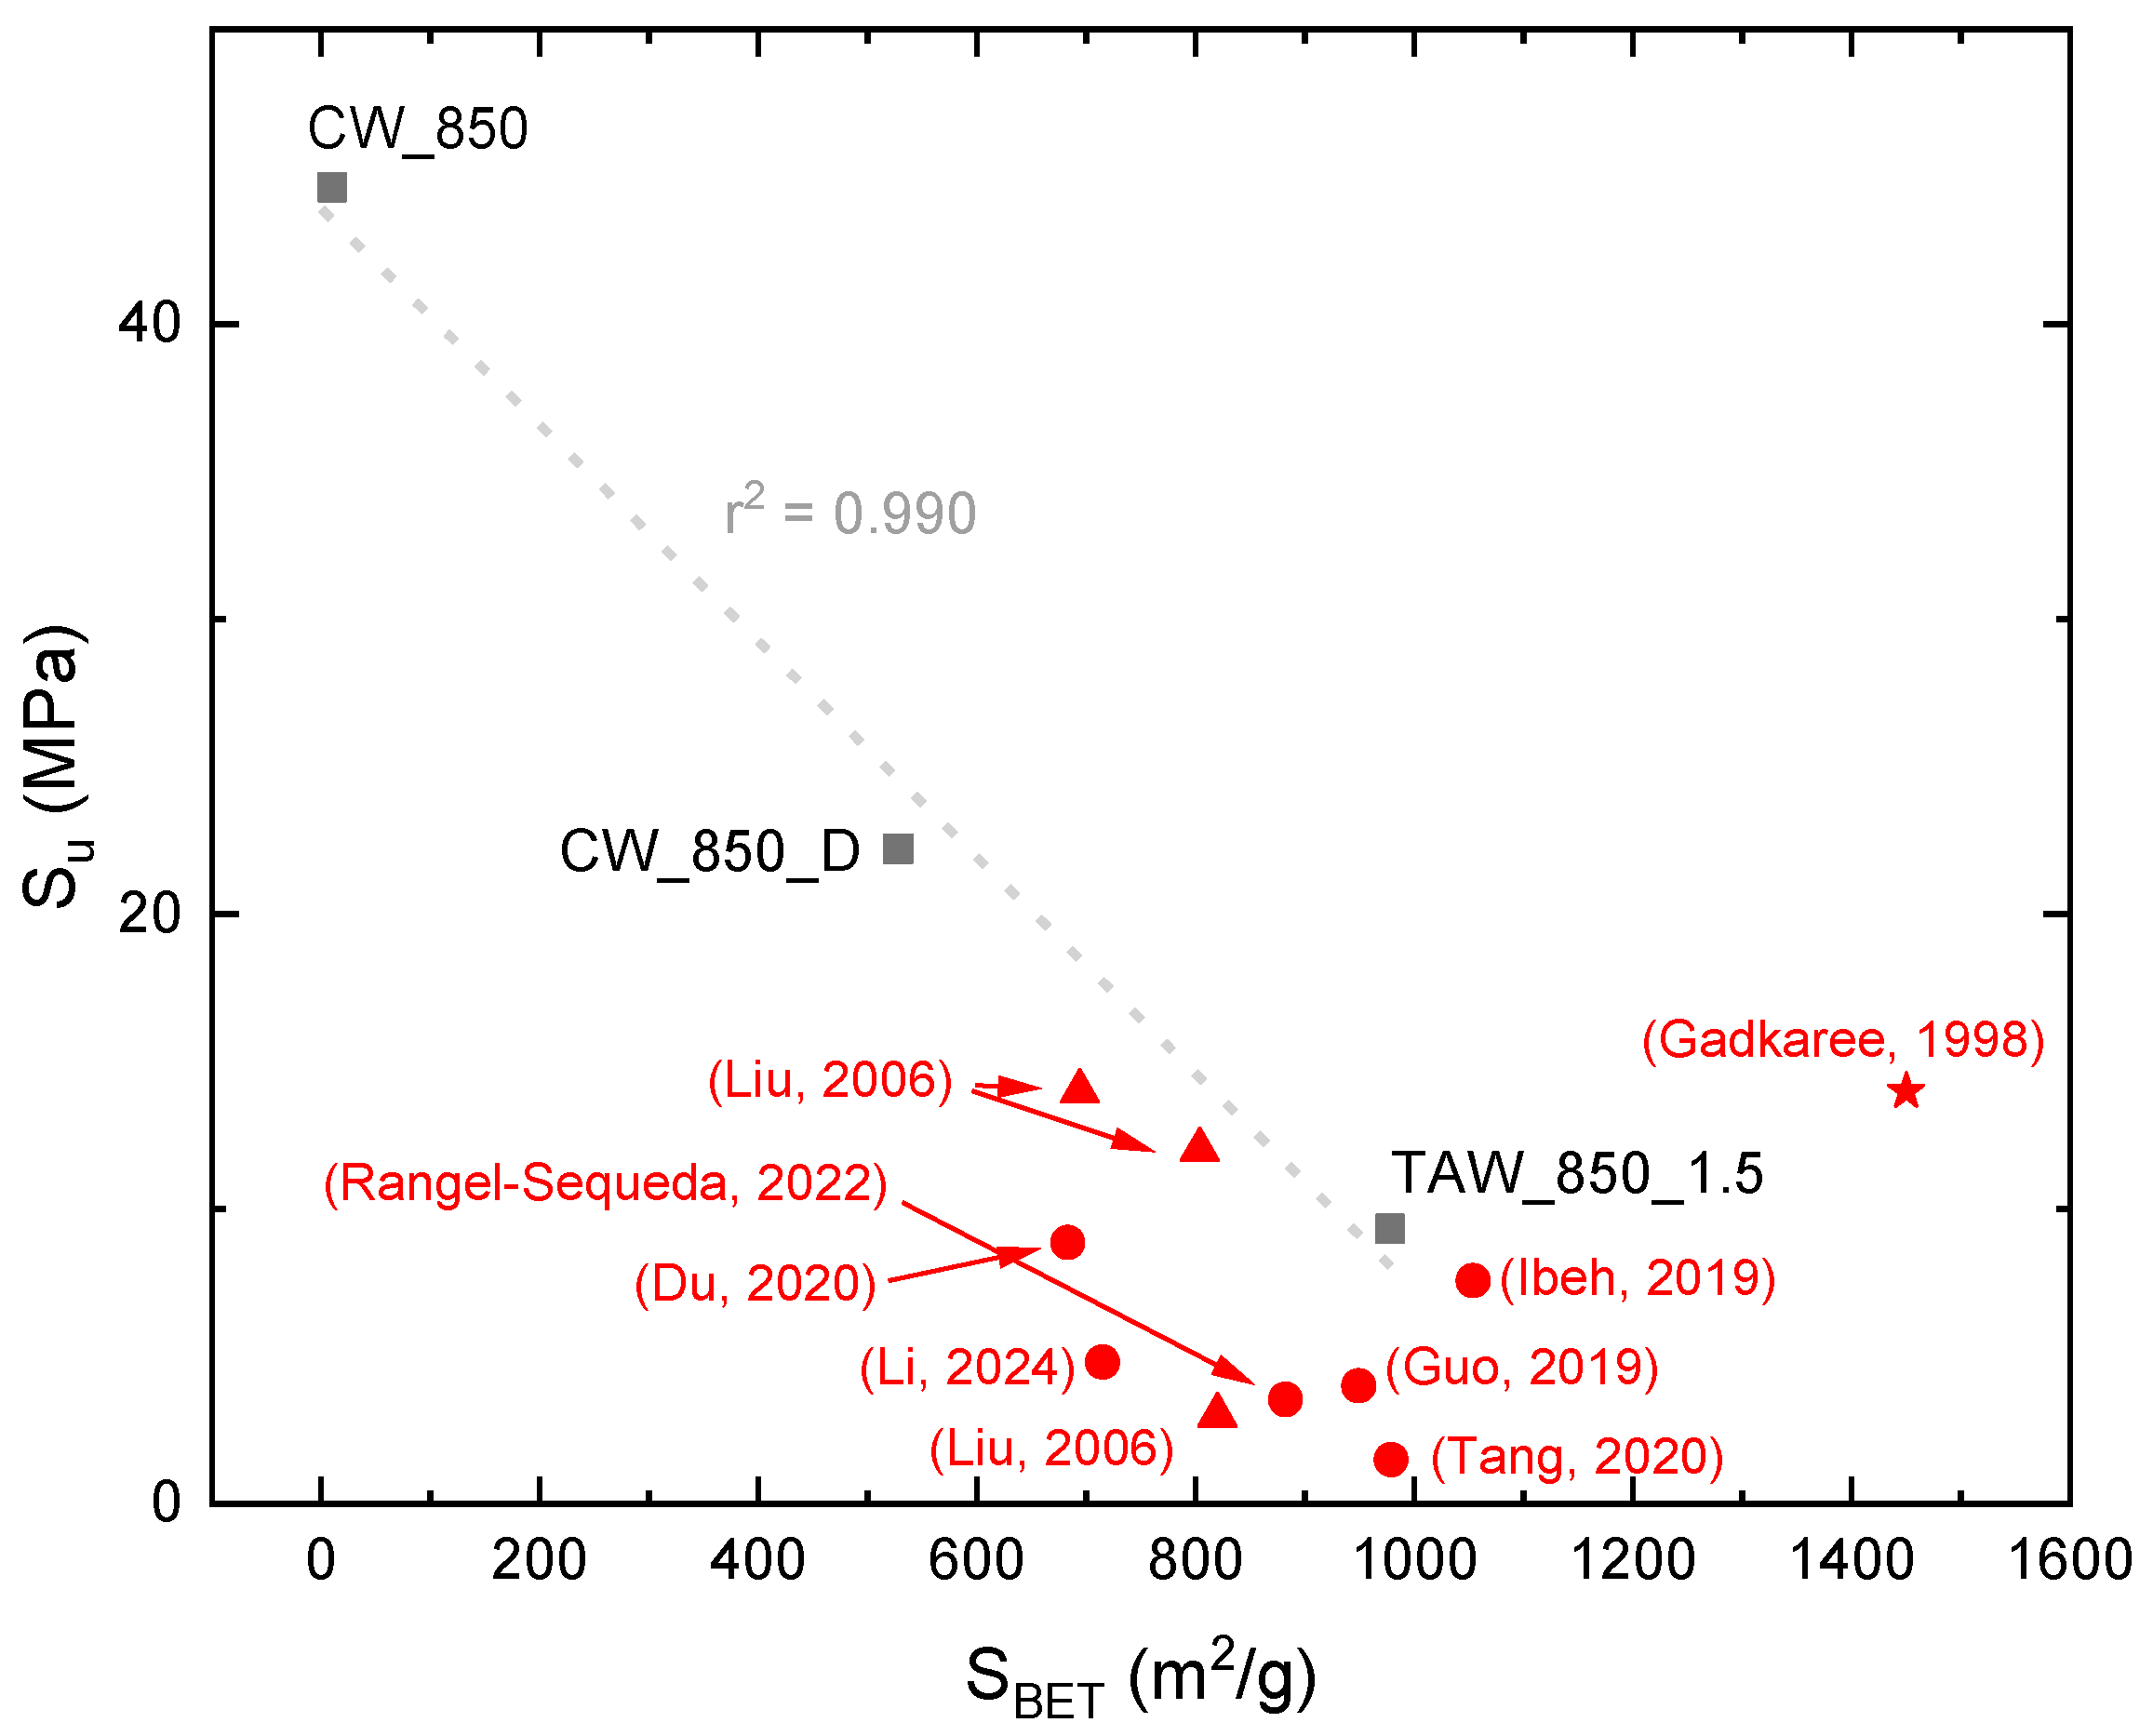
3.5. Mechanical Properties of Selected Monoliths
4. Conclusions
Author Contributions
Funding
Data Availability Statement
Acknowledgments
Conflicts of Interest
References
- Lan, G.; Yang, J.; Ye, R.-P.; Boyjoo, Y.; Liang, J.; Liu, X.; Li, Y.; Liu, J.; Qian, K. Sustainable carbon materials toward emerging applications. Small Methods 2021, 5, 2001250. [Google Scholar] [CrossRef] [PubMed]
- Yap, Y.W.; Mahmed, N.; Norizan, M.N.; Abd Rahim, S.Z.; Ahmad Salimi, M.N.; Abdul Razak, K.; Mohamad, I.S.; Abdullah, M.M.A.-B.; Mohamad Yunus, M.Y. Recent advances in synthesis of graphite from agricultural bio-waste material: A review. Materials 2023, 16, 3601. [Google Scholar] [CrossRef] [PubMed]
- Wang, Y.; Zhang, M.; Shen, X.; Wang, H.; Wang, H.; Xia, K.; Yin, Z.; Zhang, Y. Biomass-derived carbon materials: Controllable preparation and versatile applications. Small 2021, 17, 2008079. [Google Scholar] [CrossRef] [PubMed]
- Chakraborty, R.; Vilya, K.; Pradhan, M.; Nayak, A.K. Recent advancement of biomass-derived porous carbon based materials for energy and environmental remediation applications. J. Mater. Chem. A 2022, 10, 6965–7005. [Google Scholar] [CrossRef]
- Chen, Q.; Tan, X.; Liu, Y.; Liu, S.; Li, M.; Gu, Y.; Zhang, P.; Ye, S.; Yang, Z.; Yang, Y. Biomass-derived porous graphitic carbon materials for energy and environmental applications. J. Mater. Chem. A 2020, 8, 5773–5811. [Google Scholar] [CrossRef]
- Sun, L.; Gong, Y.; Li, D.; Pan, C. Biomass-derived porous carbon materials: Synthesis, designing, and applications for supercapacitors. Green Chem. 2022, 24, 3864–3894. [Google Scholar] [CrossRef]
- Crittenden, B.; Patton, A.; Jouin, C.; Perera, S.; Tennison, S.; Botas Echevarria, J.A. Carbon monoltihs: A comparison with granular materials. Adsorption 2005, 11, 537–541. [Google Scholar] [CrossRef]
- Vilaplana-Ortego, E.; Alcañiz-Monge, J.; Cazorla-Amorós, D.; Linares-Solano, A. Activated carbon fibre monoliths. Fuel Process. Technol. 2002, 77–78, 445–451. [Google Scholar] [CrossRef]
- Moreno-Castilla, C.; Pérez-Cárdenas, A.F. Carbon-based honeycomb monoliths for environmental gas-phase applications. Materials 2010, 3, 1203–1227. [Google Scholar] [CrossRef]
- Yu, F.D.; Luo, L.A.; Grevillot, G. Adsorption isotherms of VOCs onto an activated carbon monolith: Experimental measurement and correlation with different models. J. Chem. Eng. Data 2002, 47, 467–473. [Google Scholar] [CrossRef]
- Yates, M.; Martín-Luengo, M.A.; Vega Argomaniz, L.; Nogales Velasco, S. Design of activated carbon–clay composites for effluent decontamination. Microporous Mesoporous Mater. 2012, 154, 87–92. [Google Scholar] [CrossRef]
- McIntosh, S.L.; Herkes, F.E.; Keller, J.H. Activated carbon monolith catalysts (ACMC): A new and novel catalyst system. Top. Catal. 2010, 53, 1091–1095. [Google Scholar] [CrossRef]
- Gatica, J.M.; Gómez, D.M.; Vidal, H. Monolithic honeycomb design applied to carbon materials for catalytic methane decomposition. Appl. Catal. A 2013, 458, 21–27. [Google Scholar] [CrossRef]
- Marco-Lozar, J.P.; Kunowsky, M.; Suárez-García, F.; Carruthers, J.D.; Linares-Solano, A. Activated carbon monoliths for gas storage at room temperature. Energy Environ. Sci. 2012, 5, 9833–9842. [Google Scholar] [CrossRef]
- Reljic, S.; Cuadrado-Collados, C.; Farrando-Perez, J.; Jardim, E.O.; Martinez-Escandell, M.; Silvestre-Albero, J. Carbon-based monoliths with improved thermal and mechanical properties for methane storage. Fuel 2022, 324, 124753. [Google Scholar] [CrossRef]
- Romero-Anaya, A.J.; Kunowsky, M.; Rufete-Beneite, M.; Lillo-Ródenas, M.Á.; Linares-Solano, Á. Novel monoliths prepared from sucrose avoiding binder and thermal treatment. Microporous Mesoporous Mater. 2019, 284, 78–81. [Google Scholar] [CrossRef]
- Liu, L.; Liu, Z.; Huang, Z.; Liu, Z.; Liu, P. Preparation of activated carbon honeycomb monolith directly from coal. Carbon 2006, 44, 1598–1601. [Google Scholar] [CrossRef]
- Jordá-Beneyto, M.; Lozano-Castelló, D.; Suárez-García, F.; Cazorla-Amorós, D.; Linares-Solano, A. Advanced activated carbon monoliths and activated carbons for hydrogen storage. Microporous Mesoporous Mater. 2008, 112, 235–242. [Google Scholar] [CrossRef]
- Liu, L.; Liu, Z.; Yang, J.; Huang, Z.; Liu, Z. Effect of preparation conditions on the properties of a coal-derived activated carbon honeycomb monolith. Carbon 2007, 45, 2836–2842. [Google Scholar] [CrossRef]
- Rangel-Sequeda, J.F.; Loredo-Cancino, M.; Águeda Maté, V.I.; De Haro-Del Rio, D.A.; Dávila-Guzmán, N.E. 3D printing of powdered activated carbon monoliths: Effect of structuring on physicochemical and mechanical properties and its influence on the adsorption performance. Mat. Today Commun. 2022, 33, 104758. [Google Scholar] [CrossRef]
- Lozano-Castelló, D.; Cazorla-Amorós, D.; Linares-Solano, A.; Quinn, D.F. Activated carbon monoliths for methane storage: Influence of binder. Carbon 2002, 40, 2817–2825. [Google Scholar] [CrossRef]
- Ramos-Fernández, J.M.; Martínez-Escandell, M.; Rodríguez-Reinoso, F. Production of binderless activated carbon monoliths by KOH activation of carbon mesophase materials. Carbon 2008, 46, 365–389. [Google Scholar] [CrossRef]
- Nakagawa, Y.; Molina-Sabio, M.; Rodríguez-Reinoso, F. Modification of the porous structure along the preparation of activated carbon monoliths with H3PO4 and ZnCl2. Microporous Mesoporous Mater. 2007, 103, 29–34. [Google Scholar] [CrossRef]
- Vargas, D.P.; Giraldo, L.; Moreno-Piraján, J.C. CO2 adsorption on activated carbon honeycomb-monoliths: A comparison of Langmuir and Tóth models. Int. J. Mol. Sci. 2012, 13, 8388–8397. [Google Scholar] [CrossRef] [PubMed]
- Ibeh, P.O.; García-Mateos, F.J.; Ruiz-Rosas, R.; Rosas, J.M.; Rodríguez-Mirasol, J.; Cordero, T. Acid mesoporous carbon monoliths from lignocellulosic biomass waste for methanol dehydration. Materials 2019, 12, 2394. [Google Scholar] [CrossRef]
- Budarin, V.L.; Shuttleworth, P.S.; White, R.J.; Clark, J.H. From polysaccharides to starbons®. RSC Green Chem. 2015, 32, 53–81. [Google Scholar] [CrossRef]
- Castro-Gutiérrez, J.; Sanchez-Sanchez, A.; Ghanbaja, J.; Díez, N.; Sevilla, M.; Celzard, A.; Fierro, V. Synthesis of perfectly ordered mesoporous carbons by water-assisted mechanochemical self-assembly of tannin. Green Chem. 2018, 20, 5123–5132. [Google Scholar] [CrossRef]
- Dodson, J.R.; Budarin, V.L.; Hunt, J.; Shuttleworth, P.S.; Clark, J.H. Shaped mesoporous materials from fresh macroalgae. J. Mater. Chem. A 2013, 1, 5203–5307. [Google Scholar] [CrossRef]
- Titirici, M.-M.; Antonietti, M. Chemistry and materials options of sustainable carbon materials made by hydrothermal carbonization. Chem. Soc. Rev. 2010, 39, 103–116. [Google Scholar] [CrossRef]
- Antonietti, M.; Fechler, N.; Fellinger, T.-P. Carbon aerogels and monoliths: Control of porosity and nanoarchitecture via sol-gel routes. Chem. Mater. 2007, 19, 4205–4212. [Google Scholar] [CrossRef]
- Llamas-Unzueta, R.; Menéndez, J.A.; Ramírez-Montoya, L.A.; Viña, J.; Argüelles, A.; Montes-Morán, M.A. 3-D structured porous carbons with virtually any shape from whey powders. Carbon 2021, 175, 403–412. [Google Scholar] [CrossRef]
- Prazeres, A.; Carvalho, M.d.F.; Rivas, J. Cheese whey management: A review. J. Environ. Manag. 2012, 110, 48–68. [Google Scholar] [CrossRef]
- González-Weller, D.; Paz-Montelongo, S.; Bethencourt-Barbuzano, E.; Niebla-Canelo, D.; Alejandro-Vega, S.; Gutiérrez, A.J.; Hardisson, A.; Carrascosa, C.; Rubio, C. Proteins and minerals in whey protein supplements. Foods 2023, 12, 2238. [Google Scholar] [CrossRef]
- Zadow, J. Whey and Lactose Processing; Elsevier Science Publishers Ltd.: Essex, UK, 1992. [Google Scholar]
- Barba, F.J. An integrated approach for the valorization of cheese whey. Foods 2021, 10, 564. [Google Scholar] [CrossRef] [PubMed]
- Llamas-Unzueta, R.; Suárez, M.; Fernández, A.; Díaz, R.; Montes-Morán, M.A.; Menéndez, J.A. Whey-derived porous carbon scaffolds for bone tissue engineering. Biomedicines 2021, 9, 1091. [Google Scholar] [CrossRef] [PubMed]
- Tan, S.; Chen, X.; Zhai, S.; Ebrahimi, A.; Langrish, T.; Chen, Y. Spray drying assisted synthesis of porous carbons from whey powders for capacitive energy storage. Energy 2018, 147, 308–316. [Google Scholar] [CrossRef]
- Pokrzywinski, J.; Keum, J.K.; Ruther, R.E.; Self, E.C.; Chi, M.; Meyer, H.; Littrell, K.C.; Aulakh, D.; Marble, S.; Ding, J.; et al. Unrivaled combination of surface area and pore volume in micelle-templated carbon for supercapacitor energy storage. J. Mater. Chem. A 2017, 5, 13511–13525. [Google Scholar] [CrossRef]
- Menéndez, J.A.; Illán-Gómez, M.; León, C.Y.; Radovic, L. On the difference between the isoelectric point and the point of zero charge of carbons. Carbon 1995, 33, 1655–1657. [Google Scholar] [CrossRef]
- Llamas-Unzueta, R.; Menéndez, J.A.; Suárez, M.; Fernández, A.; Montes-Morán, M.A. From whey robocasting to 3D porous carbons. Add. Manufact. 2022, 59, 103083. [Google Scholar] [CrossRef]
- Zhang, Q.; Chen, M.; Emilia Coldea, T.; Yang, H.; Zhao, H. Structure, chemical stability and antioxidant activity of melanoidins extracted from dark beer by acetone precipitation and macroporous resin adsorption. Food Res. Int. 2023, 164, 112045. [Google Scholar] [CrossRef] [PubMed]
- De la Rosa Arranz, J.M.; González-Vila, F.J.; López-Capel, E.; Manning, D.A.C.; Knicker, H.; González-Pérez, J.A. Structural properties of non-combustion-derived refractory organic matter which interfere with BC quantification. J. Anal. Appl. Pyrol. 2009, 85, 399–407. [Google Scholar] [CrossRef]
- Llamas-Unzueta, R.; Montes-Morán, M.A.; Ramírez-Montoya, L.A.; Concheso, A.; Menéndez, J.A. Whey as a sustainable binder for the production of extruded activated carbon. J. Environ. Chem. Eng. 2022, 10, 107590. [Google Scholar] [CrossRef]
- Lopez, M.; Labady, M.; Laine, J. Preparation of activated carbon from wood monolith. Carbon 1996, 34, 825–827. [Google Scholar] [CrossRef]
- Linares-Solano, A.; Lozano-Castelló, D.; Lillo-Ródenas, M.A.; Cazorla-Amorós, D. Carbon activation by alkaline hydroxides preparation and reactions, porosity and performance. Chem. Phys. Carbon 2008, 30, 2-64–62. [Google Scholar] [CrossRef]
- Liou, T.-H.; Wu, S.-J. Characteristics of microporous/mesoporous carbons prepared from rice husk under base- and acid-treated conditions. J. Hazard. Mater. 2009, 171, 693–703. [Google Scholar] [CrossRef]
- Jagtoyen, M.; Derbyshire, F. Activated carbons from yellow poplar and white oak by H3PO4 activation. Carbon 1998, 36, 1085–1097. [Google Scholar] [CrossRef]
- Li, Y.; Zhang, X.; Yang, R.; Li, G.; Hu, C. The role of H3PO4 in the preparation of activated carbon from NaOH-treated rice husk residue. RSC Adv. 2015, 5, 32626–32636. [Google Scholar] [CrossRef]
- Myglovets, M.; Poddubnaya, O.I.; Sevastyanova, O.; Lindström, M.E.; Gawdzik, B.; Sobiesiak, M.; Tsyba, M.M.; Sapsay, V.I.; Klymchuk, D.O.; Puziy, A.M. Preparation of carbon adsorbents from lignosulfonate by phosphoric acid activation for the adsorption of metal ions. Carbon 2014, 80, 771–783. [Google Scholar] [CrossRef]
- Puziy, A.M.; Poddubnaya, O.I.; Socha, R.P.; Gurgul, J.; Wisniewski, M. XPS and NMR studies of phosphoric acid activated carbons. Carbon 2008, 46, 2113–2123. [Google Scholar] [CrossRef]
- Bejjanki, D.; Banothu, P.; Kumar, V.B.; Kumar, P.S. Biomass-derived N-doped activated carbon from eucalyptus leaves as an efficient supercapacitor electrode material. C 2023, 9, 24. [Google Scholar] [CrossRef]
- Liao, Y.; Shang, Z.; Ju, G.; Wang, D.; Yang, Q.; Wang, Y.; Yuan, S. Biomass derived N-doped porous carbon made from reed straw for an enhanced supercapacitor. Molecules 2023, 28, 4633. [Google Scholar] [CrossRef]
- Inagaki, M.; Toyoda, M.; Soneda, Y.; Morishita, T. Nitrogen-doped carbon materials. Carbon 2018, 132, 104–140. [Google Scholar] [CrossRef]
- Liu, F.; Gao, Y.; Zhang, C.; Huang, H.; Yan, C.; Chu, X.; Xu, Z.; Wang, Z.; Zhang, H.; Xiao, X.; et al. Highly microporous carbon with nitrogen-doping derived from natural biowaste for high-performance flexible solid-state supercapacitor. J. Coll. Interf. Sci. 2019, 548, 322–332. [Google Scholar] [CrossRef]
- Zhao, J.; Shan, W.; Zhang, P.; Dai, S. Solvent-free and mechanochemical synthesis of N-doped mesoporous carbon from tannin and related gas sorption property. Chem. Eng. J. 2020, 381, 122579. [Google Scholar] [CrossRef]
- Estevez, L.; Dua, R.; Bhandari, N.; Ramanujapuram, A.; Wang, P.; Giannelis, E.P. A facile approach for the synthesis of monolithic hierarchical porous carbons-high performance materials for amine based CO2 capture and supercapacitor electrode. Energy Environ. Sci. 2013, 6, 1785–1790. [Google Scholar] [CrossRef]
- Du, J.; Li, W.C.; Ren, Z.X.; Guo, L.P.; Lu, A.H. Synthesis of mechanically robust porous carbon monoliths for CO2 adsorption and separation. J. Energy Chem. 2020, 42, 56–61. [Google Scholar] [CrossRef]
- Li, D.; Tian, Y.; Qiao, Y.; Wen, L. Conversion of powdered active carbon into monoliths without reducing specific surface area using H3PO4-impregnated waste sawdust. Mater. Lett. 2024, 125, 175–178. [Google Scholar] [CrossRef]
- Ibeh, P.O.; García-Mateos, F.J.; Rosas, J.M.; Rodríguez-Mirasol, J.; Cordero, T. Activated carbon monoliths from lignocellulosic biomass waste for electrochemical applications. J. Taiwan Inst. Chem. Eng. 2019, 97, 480–488. [Google Scholar] [CrossRef]
- Guo, L.P.; Li, W.C.; Qiu, B.; Ren, Z.X.; Dua, J.; Lu, A.H. Interfacial assembled preparation of porous carbon composites for selective CO2 capture at elevated temperatures. J. Mater. Chem. A 2019, 7, 5402–5408. [Google Scholar] [CrossRef]
- Tang, S.H.; Zaini, M.A.A. Development of activated carbon pellets using a facile low-cost binder for effective malachite green dye removal. J. Clean. Prod. 2020, 253, 119970. [Google Scholar] [CrossRef]
- Gadkaree, K.P. Carbon honeycomb structures for adsorption applications. Carbon 1998, 36, 981–989. [Google Scholar] [CrossRef]


| Sample | SBET (m2/g) | Vtotal a (cm3/g) | Vmicro b (cm3/g) | Vmeso c (cm3/g) | ρHe (g/cm3) | Yield d (%) | Burn-Off e (%) |
|---|---|---|---|---|---|---|---|
| CW_850 | <10 | 0.001 | - | - | 2.00 | 22.4 | 0 |
| TAW_800_1 | 500 | 0.287 | 0.205 | 0.082 | 2.07 | 17.2 | 23.2 |
| TAW_800_2 | 663 | 0.363 | 0.261 | 0.102 | 2.00 | 15.0 | 33.0 |
| TAW_800_3 | 834 | 0.529 | 0.332 | 0.197 | 1.98 | 12.3 | 45.1 |
| TAW_850_1 | 839 | 0.516 | 0.331 | 0.185 | 2.01 | 12.3 | 45.1 |
| TAW_850_1.5 | 981 | 0.689 | 0.377 | 0.312 | 2.01 | 10.1 | 54.9 |
| TAW_850_2 | 1140 | 0.995 | 0.442 | 0.553 | 1.99 | 7.1 | 68.3 |
| Sample | SBET (m2/g) | Vtotal a (cm3/g) | Vmicro b (cm3/g) | Vmeso c (cm3/g) | ρHe (g/cm3) | Yield d (%) |
|---|---|---|---|---|---|---|
| CW_750 | <10 | - | - | - | 1.91 | 27.1 |
| CW_750_D | 528 | 0.287 | 0.205 | 0.082 | 1.93 | 26.1 |
| CAS_700_K_1:2 | 1777 | 0.722 | 0.690 | 0.032 | 2.08 | 14.2 |
| CAS_750_K_1:1 | 1346 | 0.655 | 0.518 | 0.137 | 2.02 | 21.3 |
| CAS_750_K_1:2 | 2440 | 1.100 | 1.072 | 0.028 | 2.12 | 13.9 |
| CAS_750_K_1:3 | 2815 | 1.224 | 1.216 | 0.008 | 2.36 | 10.9 |
| CAS_800_K_1:2 | 2356 | 1.029 | 1.017 | 0.012 | 2.44 | 13.0 |
| Sample | SBET (m2/g) | Vtotal a (cm3/g) | Vmicro b (cm3/g) | Vmeso c (cm3/g) | ρHe (g/cm3) | Yield d (%) |
|---|---|---|---|---|---|---|
| CAS_500_P_1:2 | 893 | 0.554 | 0.329 | 0.225 | 1.64 | 33.7 |
| CAS_700_P_1:2 | 891 | 0.511 | 0.303 | 0.208 | 1.83 | 31.8 |
| CAS_800_P_1:2 | 1354 | 0.751 | 0.438 | 0.313 | 2.00 | 23.7 |
| CAS_800_P_1:3 | 886 | 0.539 | 0.297 | 0.242 | 1.93 | 26.4 |
| CAS_850_P_1:2 | 1062 | 0.578 | 0.372 | 0.206 | 1.93 | 22.1 |
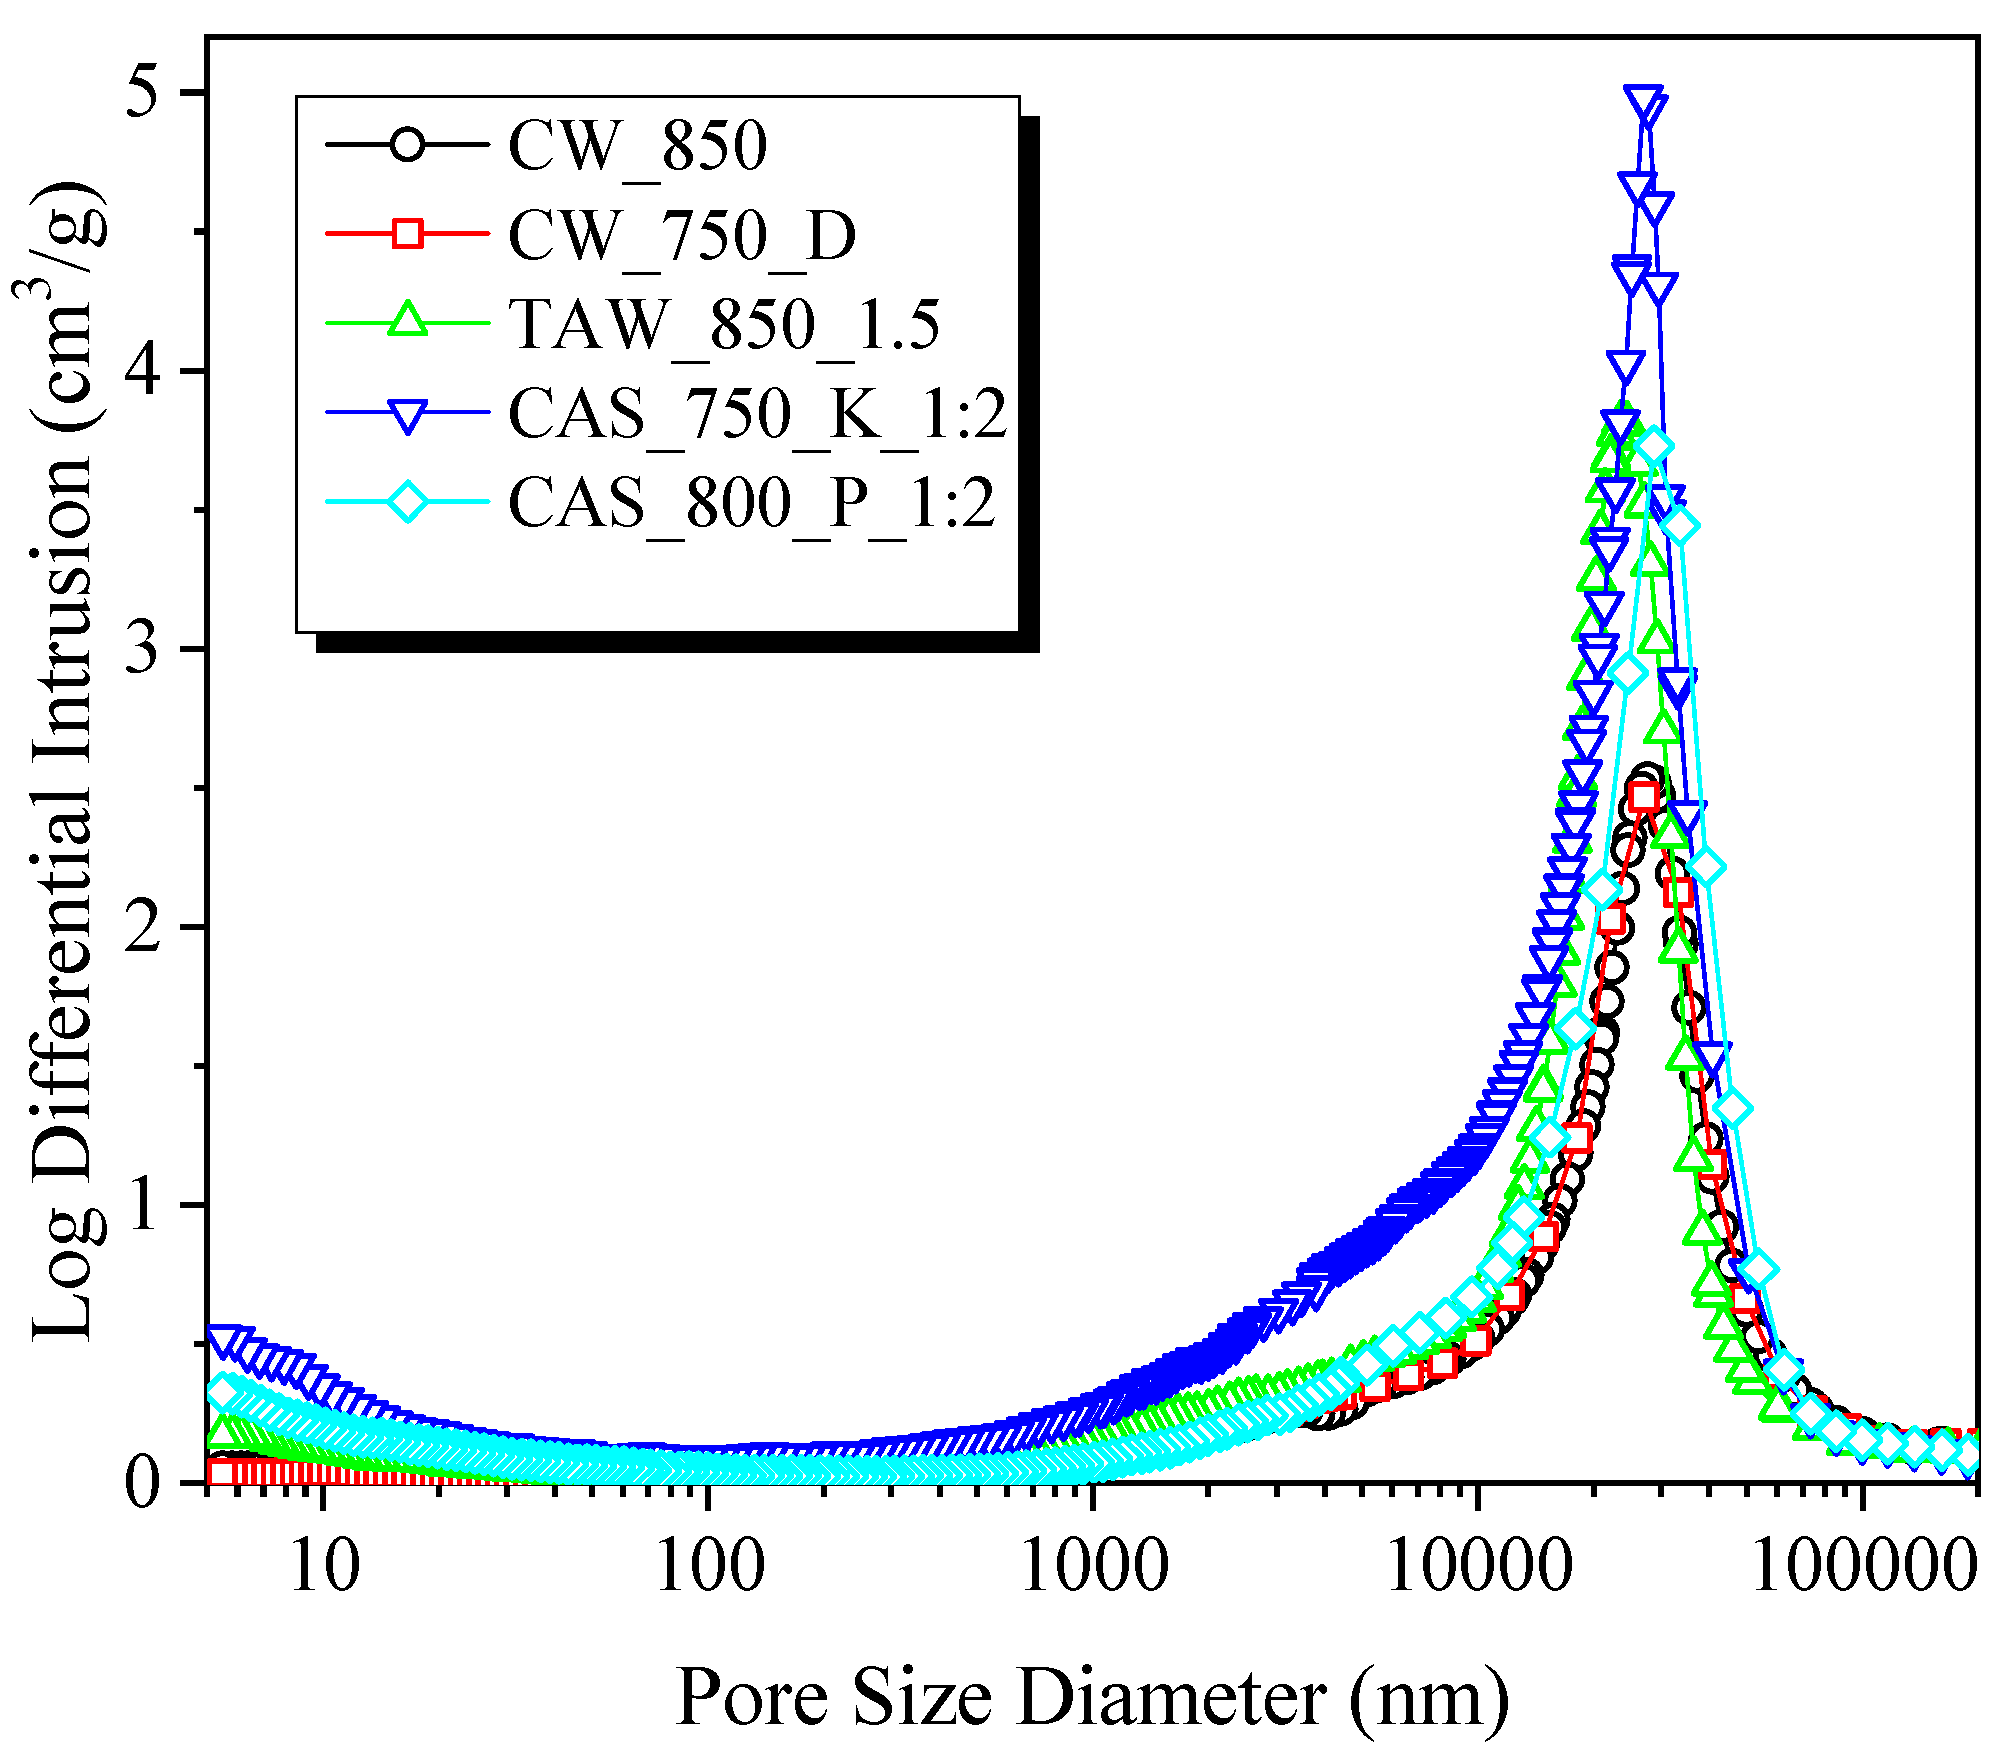
| Sample | VHg a (cm3/g) | Vmacro b (cm3/g) | Vmeso c (cm3/g) | dmax d (µm) | ρHg (g/cm3) | s e (wt.%) |
|---|---|---|---|---|---|---|
| CW_850 | 1.435 | 1.435 | - | 27.3 | 0.85 | 57 |
| CW_750_D | 1.493 | 1.469 | - | 27.1 | 0.85 | 59 |
| TA_850_1.5 | 1.947 | 1.854 | 0.094 | 23.7 | 0.62 | 70 |
| CAS_750_K_1:2 | 2.378 | 2.134 | 0.245 | 27.0 | 0.38 | 82 |
| CAS_800_P_1:2 | 2.038 | 1.884 | 0.145 | 28.8 | 0.57 | 72 |
| Sample | C a (wt.%) | H a (wt.%) | N a (wt.%) | S a (wt.%) | O a (wt.%) | Moisture b (wt.%) | Ash b (wt.%) | pHPZC |
|---|---|---|---|---|---|---|---|---|
| CW_850 | 68.0 | 1.2 | 2.3 | 0.2 | 13.4 | 12.2 | 6.1 | 11.1 |
| CW_750_D | 88.5 | 0.8 | 3.0 | 0.2 | 6.6 | 6.2 | 2.7 | 5.2 |
| TA_850_1.5 | 64.5 | 0.8 | 3.0 | 0.2 | 14.0 | 13.7 | 18.1 | 11.3 |
| CAS_750_K_1:2 | 88.3 | 0.5 | 3.2 | 0.2 | 6.7 | 9.6 | 3.0 | 4.8 |
| CAS_800_P_1:2 | 82.3 | 1.2 | 3.1 | 0.0 | 11.4 | 7.8 | 3.8 | 2.4 |
Disclaimer/Publisher’s Note: The statements, opinions and data contained in all publications are solely those of the individual author(s) and contributor(s) and not of MDPI and/or the editor(s). MDPI and/or the editor(s) disclaim responsibility for any injury to people or property resulting from any ideas, methods, instructions or products referred to in the content. |
© 2023 by the authors. Licensee MDPI, Basel, Switzerland. This article is an open access article distributed under the terms and conditions of the Creative Commons Attribution (CC BY) license (https://creativecommons.org/licenses/by/4.0/).
Share and Cite
Llamas-Unzueta, R.; Ramírez-Montoya, L.A.; Menéndez, J.A.; Montes-Morán, M.A. Customised Microporous Carbon 3D Structures with Good Mechanical Properties and High Nitrogen Content Obtained from Whey Powders. C 2023, 9, 100. https://doi.org/10.3390/c9040100
Llamas-Unzueta R, Ramírez-Montoya LA, Menéndez JA, Montes-Morán MA. Customised Microporous Carbon 3D Structures with Good Mechanical Properties and High Nitrogen Content Obtained from Whey Powders. C. 2023; 9(4):100. https://doi.org/10.3390/c9040100
Chicago/Turabian StyleLlamas-Unzueta, Raúl, Luis A. Ramírez-Montoya, J. Angel Menéndez, and Miguel A. Montes-Morán. 2023. "Customised Microporous Carbon 3D Structures with Good Mechanical Properties and High Nitrogen Content Obtained from Whey Powders" C 9, no. 4: 100. https://doi.org/10.3390/c9040100