Article

From Waste to Resource: Utilizing Sweet Chestnut Waste to Produce Hydrothermal Carbon for Water Decontamination

by
Silvia Izquierdo
1,*,
Nazaret Pacheco
1,
Carlos J. Durán-Valle
2 and
Ignacio M. López-Coca
3,*
1
Environmental and Sustainable Chemistry Research Group, School of Technology, University of Extremadura, 10003 Cáceres, Spain
2
Environmental and Sustainable Chemistry Research Group, IACYS, Faculty of Sciences, University of Extremadura, 06006 Badajoz, Spain
3
Environmental and Sustainable Chemistry Research Group, INTERRA, School of Technology, University of Extremadura, 10003 Cáceres, Spain
*
Authors to whom correspondence should be addressed.
Submission received: 30 March 2023 / Revised: 8 May 2023 / Accepted: 29 May 2023 / Published: 1 June 2023
(This article belongs to the Special Issue Biomass—a Renewable Resource for Carbon Materials (2nd Edition))

Abstract

:
Carbonaceous materials are a highly appealing class of adsorbents, owing to their exceptional properties, such as high surface area and thermal and chemical stability. These materials have found successful applications in water purification. Sweet chestnut (Castanea sativa) cupules are disposed of as waste. Valorization of these residues is a step forward in terms of circular economy and sustainability. Meanwhile, per- and poly-fluoroalkyl substances (PFASs) pose significant concerns due to their persistence, bioaccumulation, and toxicity, emerging as contaminants of concern for human health and the environment. This study focuses on preparing carbonaceous material by hydrothermal carbonization from chestnut cupules, followed by their use as adsorbents for PFAS removal from polluted water. The cupule waste material was crushed, ground, sieved, and subjected to hydrothermal treatment at temperatures ranging from 180–200 °C to produce hydrothermal carbons. The adsorbents obtained were characterized by various techniques such as nitrogen adsorption isotherm, porosimetry, point of zero charge, Fourier-transform infrared, scanning electron microscopy, and thermal, elemental, and energy dispersive X-ray analyses. Surface area (SBET) values of 42.3–53.2 m2·g−1 were obtained; pHPZC ranged from 3.8 to 4.8. This study also determined the adsorption kinetics and isotherms for removing perfluorooctanoate-contaminated water. The equilibrium was established at 72 h and qe = 1029.47 mg·g−1. To summarize, this research successfully valorized a biomass residue by transforming it into hydrothermal carbon, which was then utilized as an adsorbent for water decontamination.

1. Introduction

Carbonaceous materials constitute an attractive group of adsorbents due to their properties, such as large surface area and thermal and chemical stability. In addition, activated carbons with different pore sizes can be obtained, thus adapting them to the functions they are designed for. On the other hand, functionalizing the surface of activated carbons is possible, giving them specific chemical properties adapted to a particular purpose. It is also of great importance that carbonaceous materials are considered safe, accessible, and affordable [1]. Various types of biomass residues, due to their low cost and abundance, have been evaluated to obtain functional carbonaceous materials. Many methods provide materials whose physicochemical properties can be tuned at will, thus obtaining materials that have shown promising results in different fields, such as adsorption or energy storage [2]. For this reason, they are considered suitable candidates for obtaining sustainable materials. These materials have been successfully applied in catalysis, water purification, and soil remediation since they can remove heavy metals, agrochemicals, antibiotics, and other organic compounds. Excellent reviews on these aspects can be found in Soffian et al. [3], Adegoke et al. [4], Gęca et al. [5], Borchardt et al. [6], and Ma et al. [2]. One such type of carbonaceous material is biochar, which can be produced from biomass waste through hydrothermal carbonization, chemical carbonization, gasification, torrefaction, and pyrolysis [3,7,8,9].
Sweet chestnut (Castanea sativa) is a deciduous tree of the Fagaceae family, native to humid temperate regions of the Northern Hemisphere and widely distributed throughout Europe. It can reach 35 m in height and 2 m (exceptionally more) in diameter. Sweet chestnut trees live to an age of 600 years or even more. By autumn, the female flowers develop into spiny cupules containing 3–7 brownish nuts, which are shed in October [10,11,12]. After the chestnuts are harvested, the spiny dome is disposed of as waste and used as fuel for fireplaces.
On the other hand, per- and poly-fluoroalkyl substances (PFASs) are a group of synthetic chemicals that have been used in a wide range of industrial and consumer products, such as firefighting foams, non-stick coatings, and water-repellent fabrics [13,14]. Due to their persistence, bioaccumulation, and toxicity, PFASs are considered Contaminants of Emerging Concern (CECs), with potentially adverse effects on human health and the environment [15,16,17,18,19,20,21]. These substances have been detected in various environmental media, including water, soil, air, and biota, and have attracted increasing attention from regulators, scientists, and the public worldwide [22]. Among the different methods for treating PFAS-contaminated water, adsorption has been recognized as a promising technology, given its effectiveness, versatility, and ease of implementation [23,24]. Carbonaceous materials are widely used as adsorbents for PFAS removal due to their high surface area, microporous structure, and affinity for hydrophobic compounds. One of the classic and best-known carbonaceous materials is activated carbon (AC) [25,26,27]. It is usually obtained at high temperatures in a double carbonization and activation process. This material is characterized by a highly developed porous structure, a generally alkaline character, and a predominantly hydrophobic surface [28,29]. It is well known that these properties can be modified by adjusting the conditions of the activation processes or employing suitable chemical or thermal treatment [30,31].
In recent years, numerous studies have investigated using these adsorbents for PFAS adsorption in water, aiming to optimize the adsorbent properties and conditions, understand the adsorption mechanisms, and evaluate the performance and feasibility of the technology. The effectiveness of AC as an adsorbent for PFAS removal depends on its physicochemical properties, which can be tailored by adjusting the activation process and conditions. The surface area, pore size, surface chemistry, and surface charge of AC determine its adsorption capacity, selectivity, and kinetics for PFAS removal. The larger the surface area and the more mesopores present, the higher the adsorption capacity; this is due to the increased availability of adsorption sites and the enhanced accessibility of PFAS molecules to the internal surface of the carbonaceous material. The surface chemistry can also affect PFAS adsorption, as hydrophobic interactions between PFASs and the nonpolar surface are favored over electrostatic interactions with the polar surface of water molecules. Therefore, adsorbents with a higher content of surface functional groups, such as oxygen-containing or nitrogen-containing groups, may have a lower adsorption capacity for PFASs than non-functionalized ones due to the reduced hydrophobicity and the increased competition for adsorption sites.
In the last decade or so, a new type of carbonaceous material, hydrothermal carbons (HC), has attracted considerable interest from researchers in this field [32,33]. It is obtained by treating carbon-rich materials with water at a moderate temperature in a closed vessel so that endogenous water vapor pressure acts on this material [34]. Generally, some biomass is used as raw material. This type of material is characterized by low pore development, acidity, and a hydrophilic surface, with many surface groups. As in the previous case, these properties can be modified by thermal or chemical treatments. This has the advantage of being a more environmentally friendly manufacturing process, as it is carried out in hermetically sealed containers and at a lower temperature. This allows for easier management of possible waste and lower energy consumption. Additionally, despite its limited specific surface area, its high proportion of functional groups can give rise to adequate adsorption capacity. We have been working on the obtention and use of hydrothermal carbons from chestnut cupules for the last few years. Our preliminary results (unpublished) show that these carbons are suitable adsorbents in the decontamination of heavy metals, such as thorium, from water. Given these results, we thought it would be apt to check for the adsorption capacity of apolar organic molecules such as PFAS. Adsorption onto carbonaceous materials has been established as a promising technology for PFAS removal from water [20,35,36,37,38,39,40,41,42].
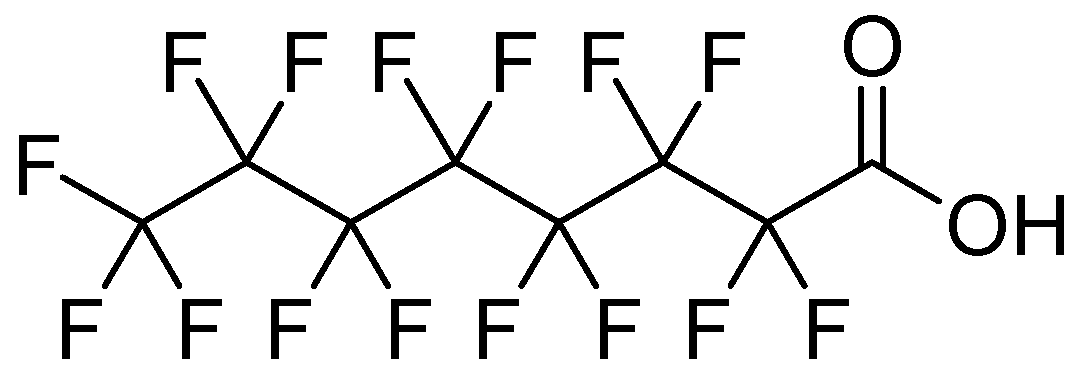
The objective of this work is to investigate the use of chestnut cupule waste as sustainable biomass raw material to obtain hydrothermal carbons—hence, adding value to it—and its use as adsorbent material for the removal from water of sodium perfluorooctanoate (PFONa), the anion of perfluorooctanoic acid, one of the most significant PFASs.

2. Materials and Methods

2.1. Materials

Sodium perfluorooctanoate 97%, CAS 335-95-5 (Figure 1), was purchased from Thermo Fisher. Milli-Q water was used as a solvent in all determinations. Sweet chestnut (Castanea sativa) cupules were collected from chestnut groves in Valle del Jerte, in Cáceres, Spain.

2.2. Methods

2.2.1. Synthesis of the Hydrothermal Carbons

The chestnut cupules were allowed to dry naturally. They were subsequently ground and sieved, collecting three fractions: large size (1–2 mm), medium size (0.5–1 mm), and small size (less than 0.5 mm). Then, they were subjected to hydrothermal treatment in a duralumin-coated Teflon™ reactor.
To obtain HC-A, in a hydrothermal reactor, 100 mL of distilled water and 15 g of small-size sieved cupule were added. The reactor was closed, placed in an oven previously programmed at 180 °C, and kept for 24 h. The reactor was then removed from the oven and, once cold, opened. The final product was filtered and washed with plenty of distilled water (ca. 200 mL) on a filter. Subsequently, it was dried in an oven at 110 °C for 8 h. The other carbons were prepared similarly, according to the data in Table 1.

2.2.2. Characterization of the Hydrothermal Carbons

Textural characterization was performed by N2 adsorption isotherms at 77 K in a Quantachrome Quadrasorb Evo (Quantachrome Ltd., Hook, UK), and the specific surface area was calculated by applying the BET method [43]. Porosimetry was performed in a Quantachrome Poremaster 60 (Quantachrome, Hook, UK). Thermal analysis was carried out in an STA 449 F3 Jupiter thermobalance (Netzsch, Selb, Bavaria, Germany). Fourier-transform infrared spectra were recorded in a Bruker Vertex70 spectrometer in the 400–4000 cm−1 range, with a DLaTGS detector and a 0.4 cm−1 spectral resolution. A KBr tablet was prepared with 1/250 dilution (Bruker, Billerica, Massachusetts, USA). Elemental analysis (C, H, N, S, O) was performed using a Leco CHMS-932 elemental analyzer (Leco, St. Joseph, MI, USA). C, H, N, and S were analyzed, and the difference was assigned to ash (measured from proximate analysis) and oxygen content. The point of zero charge (PZC) values were determined using the method proposed by Valente Nabais and Carrott [44]. To carry out this measurement, a 0.1 M solution of sodium nitrate was prepared, and 7% in weight of the carbon was added, followed by stirring for 48 h at 25 °C in a thermostatic bath. Subsequently, it was filtered, and the pH of the filtered solution was measured with a pH meter. This pH value corresponded to the point of zero charge. A field emission scanning electron microscope (SEM) Quanta 3D FEG (FEI Company, Hillsboro, OR, USA) was used to explore the surface morphological characteristics of all samples. The sample analysis was performed under high vacuum with a secondary electron. The surface of the samples was coated with gold due to their low conductivity. Energy dispersive X-ray analyses (EDX) were recorded with the same equipment.

2.2.3. Adsorption Experiments

The conjugate base sodium salt (PFONa), instead of the perfluorooctanoic acid, was used to carry out the adsorption experiments, since the acid has a Ka ca. -1 and dissociates completely in water.
  • Adsorption kinetics
To determine the PFONa adsorption over time, the following procedure was used:
A 200 mg/L PFONa water solution was prepared by dissolving 10 mg of PFONa in a 50 mL volumetric flask. It was then transferred to an Erlenmeyer flask, and 50 mg of hydrothermal carbon (HC) was added, so the HC to PFONa ratio was 5:1. All flasks were thermostated at 25 °C and magnetically stirred at 400 rpm. Assays were performed in duplicate; 2 mL samples were taken at 2, 4, 24, 48, 72, and 96 h, then filtered with a 0.22 µm pore filter, and, finally, aliquots were analyzed for PFONa concentration.
2.
Adsorption isotherm
Different PFONa solutions of 40, 70, 100, 130, 165, and 200 mg/L were prepared in 10 mL volumetric flasks. They were then transferred to separate Erlenmeyer flasks, and 10 mg of hydrothermal carbon was added to each one, so the HC to PFONa mass quotient was 25.0, 14.3, 10.0, 7.7, 6.1, and 5.0, respectively. All flasks were thermostated at 25 °C and magnetically stirred at 400 rpm. Assays were performed in duplicate; 2 mL samples were taken at 96 h, then filtered with a 0.22 µm pore filter, and, finally, aliquots were analyzed for PFONa concentration.

2.2.4. Analytical Determinations

The samples were analyzed using liquid chromatography (Agilent 1290 Infinity II LC (Agilent Technologies, Santa Clara, California, USA)) coupled to a triple quadrupole mass spectrometer (Agilent 6460 triple quad LC/MS (Agilent Technologies)). Aliquots of 3 μL were injected, and elution was carried out by operating in gradient mode at 0.4 mL/min with a reverse phase HPLC Zorbax Extend C18 column (3 μm, 100 mm × 1.8 mm) at 30 °C. As the mobile phase, 0.1% formic acid in ultrapure water (A) and 0.1% formic acid in acetonitrile (B) were used, as shown in Table 2.
Ionization was carried out in negative mode. The equipment parameters were gas temperature 225 °C, gas flow 10 L/min, nebulizer 45 psi, sheath gas temperature 350 °C, sheath gas flow 11 L/min, capillary voltage 3.6 kV, nozzle voltage 1500 V, and delta EMV 400. The MassHunter B.07.00 (Agilent) software was used for data acquisition and equipment control. Multiple Reaction Monitoring (MRM) was used, with the transitions sought to be 412.9 → 368.9 and 412.9 → 169, the former used in the quantification of the compound. The fragmentation and collision energy voltages were 86 V and 5 V, respectively.

3. Results and Discussion

3.1. Characterization of the Hydrothermal Carbons

The nitrogen adsorption isotherms (Figure 2) corresponded to type III, according to the IUPAC classification [45,46]; therefore, the interaction between the N2 molecules and the surface must have been weak. The surface obtained by the BET method produced values that were higher than those obtained by the DFT method but in the same order of magnitude (Table 3) [43,47]. Nevertheless, since the isotherms were of Type III, the BET model was not to be considered highly reliable. All three carbons showed a minimal surface area, low microporosity, and a considerably greater volume of large pores, i.e., mesopores and macropores (Figure 3, Figure 4 and Figure 5). The HC-A coal had the least-developed porosity. The DFT method was used to study the distribution of micropores and mesopores. The results show that the three carbons presented a similar pore distribution. A high volume of narrow mesopores was detected, whereas no micropores were present. The HC-B carbon had a larger volume of narrow mesopores, while the HC-C showed more volume when the pores widened. The HC-A carbon showed a more significant development of wide porosity than the other two adsorbents. It should be noted that HC-B and HC-C carbons showed a more developed narrow mesoporosity than HC-A. However, the mesopore and macropore structure was very similar in the three materials.
The DFT method was used to study the distribution of porosity in micro and mesopores, and the results are shown in Figure 3. The cumulative volume plot obtained from porosimetry is shown in Figure 4, and the width pore distribution plot, also obtained from porosimetry, is shown in Figure 5.
The measurements of the PZC show that all three materials were acidic (Table 4), as is usual in hydrothermal carbons. It must be considered that basic oxygenated functional groups (carbonyl) are more labile than those that provide acidic properties (alcohol and carboxylic), so it is to be expected that the former will degrade in a more significant proportion than the latter. In addition, as the degree of graphitization was low, as observed from the elemental composition with low carbon content, there was not a substantial contribution of basicity by the aromatic structures.
The Fourier-transform infrared (FTIR) spectra obtained are shown in Figure 6. Numerous observable bands in the FTIR spectra belonging to many functional groups indicate that the degree of graphitization of these materials was not high. The most intense band at 3400 cm−1 corresponded to either alcohol or carboxylic O-H bonds. The band at 2935 cm−1 was assigned to C-H bonds, but its low wavenumber suggested they were mainly aliphatic bonds, since the aromatic ones give a signal at higher values. The 1710 cm−1 band was due to C-O double bonds that can be carbonyl or carboxylic, whereas the neighboring band of 1610 cm−1 was characteristic of C-C conjugated double bonds. Several bands between 1550 cm−1 and 1300 cm−1 can be attributed to the carbon backbone of these materials, for instance, those at 1515 cm−1 and 1460 cm−1; however, the presence of O-H and C-O bands in this region made assigning them somewhat problematic. Between 1300 cm−1 and 100 cm−1, the bands were mainly due to oxygenated or nitrogenous functional groups (C-O or C-N bonds) [50].
The scanning electron microscopy images of the samples in which hydrothermal carbonization had been carried out (Figure 7, Figure 8 and Figure 9) showed a more defined structure than in the original material (Figure 10), in which the cells of the lignocellulosic material were more clearly observed. The treatment, therefore, removes matter from the original material, increasing the porosity. In some images, small spheres on the surface could be seen; it is known that obtaining hydrothermal coals from carbohydrates gives rise to spherical particles, so they could have come from dissolved substances of the chestnut cupule that underwent hydrothermal carbonization. Another option is that they were wax deposited on the surface of the biochar; given the similarity of composition in both cases, it is difficult to determine which of the processes gave rise to these structures.
The thermal analysis program can be found in the Supplementary Material (Table S1). Thermograms (Figure 11) show that the moisture of these materials was low, as well as the amount of residual ash, which was less than 1% in the three carbons. Regarding the volatile matter (from 50 to 80 min approximately), it followed the order HC-A > HC-B > HC-C, and the fixed carbon followed the opposite order. Therefore, they can be considered simply as carbonaceous materials with a low content of mineral matter.
The results of the organic elemental analysis (C, H, N, S, and O) and the ash content (Table 5) show that the samples prepared at a higher temperature (HC-B and HC-C) presented more carbon, nitrogen, and ash, and less hydrogen and oxygen. This indicates that the carbonization process was more intense when the temperature was raised. The size did not seem to be crucial, though, since the smaller the particle size, the more intense the effect of pressurized water should have been, and this was not observed in the results. The data in the table agree with the fixed carbon content, which tended to increase with elemental carbon content, and the volatile matter, which tended to increase with oxygen and hydrogen content.
On the other hand, EDX analyses were performed on all three hydrothermal carbons and the raw chestnut cupule (Table 6). This determination, which studied a more superficial area than the elemental analysis, confirmed the same trend. All carbons had been enriched in carbon and depleted in oxygen. It is worth noticing that the HC-C sample contained the most significant mineral matter. This effect is larger than the one found in the elemental analysis, which indicates that the hydrothermal treatment affected the surface more than the interior of the material particles.

3.2. Adsorption Experiments

The kinetic study of adsorption processes makes it possible to relate the amount of adsorbate adsorbed per gram of adsorbent with the elapsed contact time between adsorbent and adsorbate. The variation in the excess PFONa concentration over time data is shown in Table 7. At 96 h, equilibrium can be considered established, having reached the maximum adsorption. Our preliminary studies show that HC-A and HC-B have adsorption of around 15%, while HC-C adsorbs 26%; therefore, further decontamination studies presented herein focused on the most promising adsorbent, HC-C.
The Lagergren adsorption kinetic model assumes that the adsorption rate is proportional to the number of unoccupied sites available for adsorption. However, when we applied it, we found it to be inappropriate for our data. On the other hand, the pseudo-second-order adsorption kinetic model assumes that the rate-limiting step is the chemical adsorption process, and it can be expressed mathematically, as shown in Equation (1):
t q t = 1 k · q e 2 + t q e
where t is the time, qt is the amount of solute adsorbed at time t, qe is the amount of solute adsorbed at equilibrium, and k is the rate constant. The data are shown in Table 8, whereas the graph of t/qt vs. t is plotted in Figure 12.
The data points follow a straight line, suggesting that the pseudo-second-order adsorption kinetic model applies to this system. The slope was 9.7137 × 10⁻⁴, and the intercept was 1.1612 × 10⁻³, so we can calculate the rate constant (k = 8.126·10−4 h−1·mg−1·g) and the amount of solute adsorbed at equilibrium (qe = 1029.47 mg·g−1).
Experiments were conducted with different HC-C to PFONa ratios to determine the carbon adsorption isotherm. The values obtained are shown in Table 9 and plotted in Figure 13.
We found that the data obtained did not mathematically fit the Langmuir adsorption model, i.e., the adjustment of the model to the experimental data was inconsistent. On the other hand, the Freundlich model fit these results. Data for the Freundlich model are shown in Table 10.
Using Equation (2) and the adjusted values, the Freundlich model constants can be calculated:
ln q e = 1 n ln c e + ln K F
The calculated values of Freundlich isotherm constants were KF = 12.3099; and 1/n = 1.9513 (r2 = 0.9962).
The consistency with the Freundlich model indicates some degree of heterogeneity on the surface (not all active sites are identical) and the possibility that more than one layer can be adsorbed. Since the material used as adsorbent was amorphous, this relative heterogeneity can be expected. Moreover, the value of n indicates that the interaction between adsorbent and sorbate is mainly of the chemisorption type. Our results are promising, with a qe = 1029.47 mg·g−1; interestingly, they suggest that the maximum adsorption capacity had not been achieved at high concentrations. To put these results in perspective, we can refer to the excellent review by Liang et al.; in it, the authors compared the different adsorption methods for removing PFAS from water [37]. Analyzing the results obtained in water at pH 7, we found that, for granular activated carbon (GAC), a value of qe = 2.34–102.7 mg·g−1 is reported; and for powdered activated carbon (PAC), qe values of 16.9–500 mg·g−1 are found. On the other hand, for biochar derived from hardwood sawdust, the value obtained for qe at pH 7.2 is 2.4 mg·g−1, and for pinewood at the same pH, qe is 2.1 mg·g−1. Liang et al. found that ion exchange resins (qe = 525–1500 mg·g−1) and carbon nanotubes (qe = 140–1110 mg·g−1) show the highest adsorption capacities, yet they interestingly concluded that low-cost adsorbents with high adsorptive capacity are highly recommended in place of commercial AC due to their local availability, technical feasibility, and cost-effectiveness.
The mechanisms affecting PFAS adsorption have been reviewed by Liang et al. in an excellent review [37]. Diffusion, electrostatic interaction, hydrophobic interaction, ion exchange, and hydrogen bonds all can play a role in the adsorption process and are affected by the physicochemical characteristics of the adsorbent, such as pore size, pore distribution, and functional groups. In our case, HC-C is the carbon with the largest volume of mesopores; since PFONa is a large PFAS, it is essential for diffusion and adsorption that there are large numbers of mesopores. It is also the most graphitized hydrothermal carbon, i.e., the least polar; this also plays a vital role in the PFONa adsorption mechanism onto HC-C. Because of the hydrophobic nature of PFAS chains, the sorption of anionic PFAS can be dominated by hydrophobic interactions between the negatively-charged hydrophobic fluorinated tail and the surface of hydrophobic adsorbents, regardless of the electrostatic repulsion [51,52]. Particularly at high pH, hydrophobic interaction, which is not sensitive to changes in pH, should be the primary PFAS adsorption mechanism [53,54].
Given these results, and due to the advantages of the hydrothermal carbon herein reported, further work is underway to gain insight into the full potential of this adsorbent in water decontamination.

4. Conclusions

The preparation conditions of the hydrothermal carbons greatly influence the result; this allows for obtention of coals with tuned properties by optimizing the obtention process.
Carbonaceous material obtained by hydrothermal carbonization of sweet chestnut (Castanea sativa) cupule residues is a cost-effective, environmentally benign adsorbent, which effectively adds value to this biomass waste.
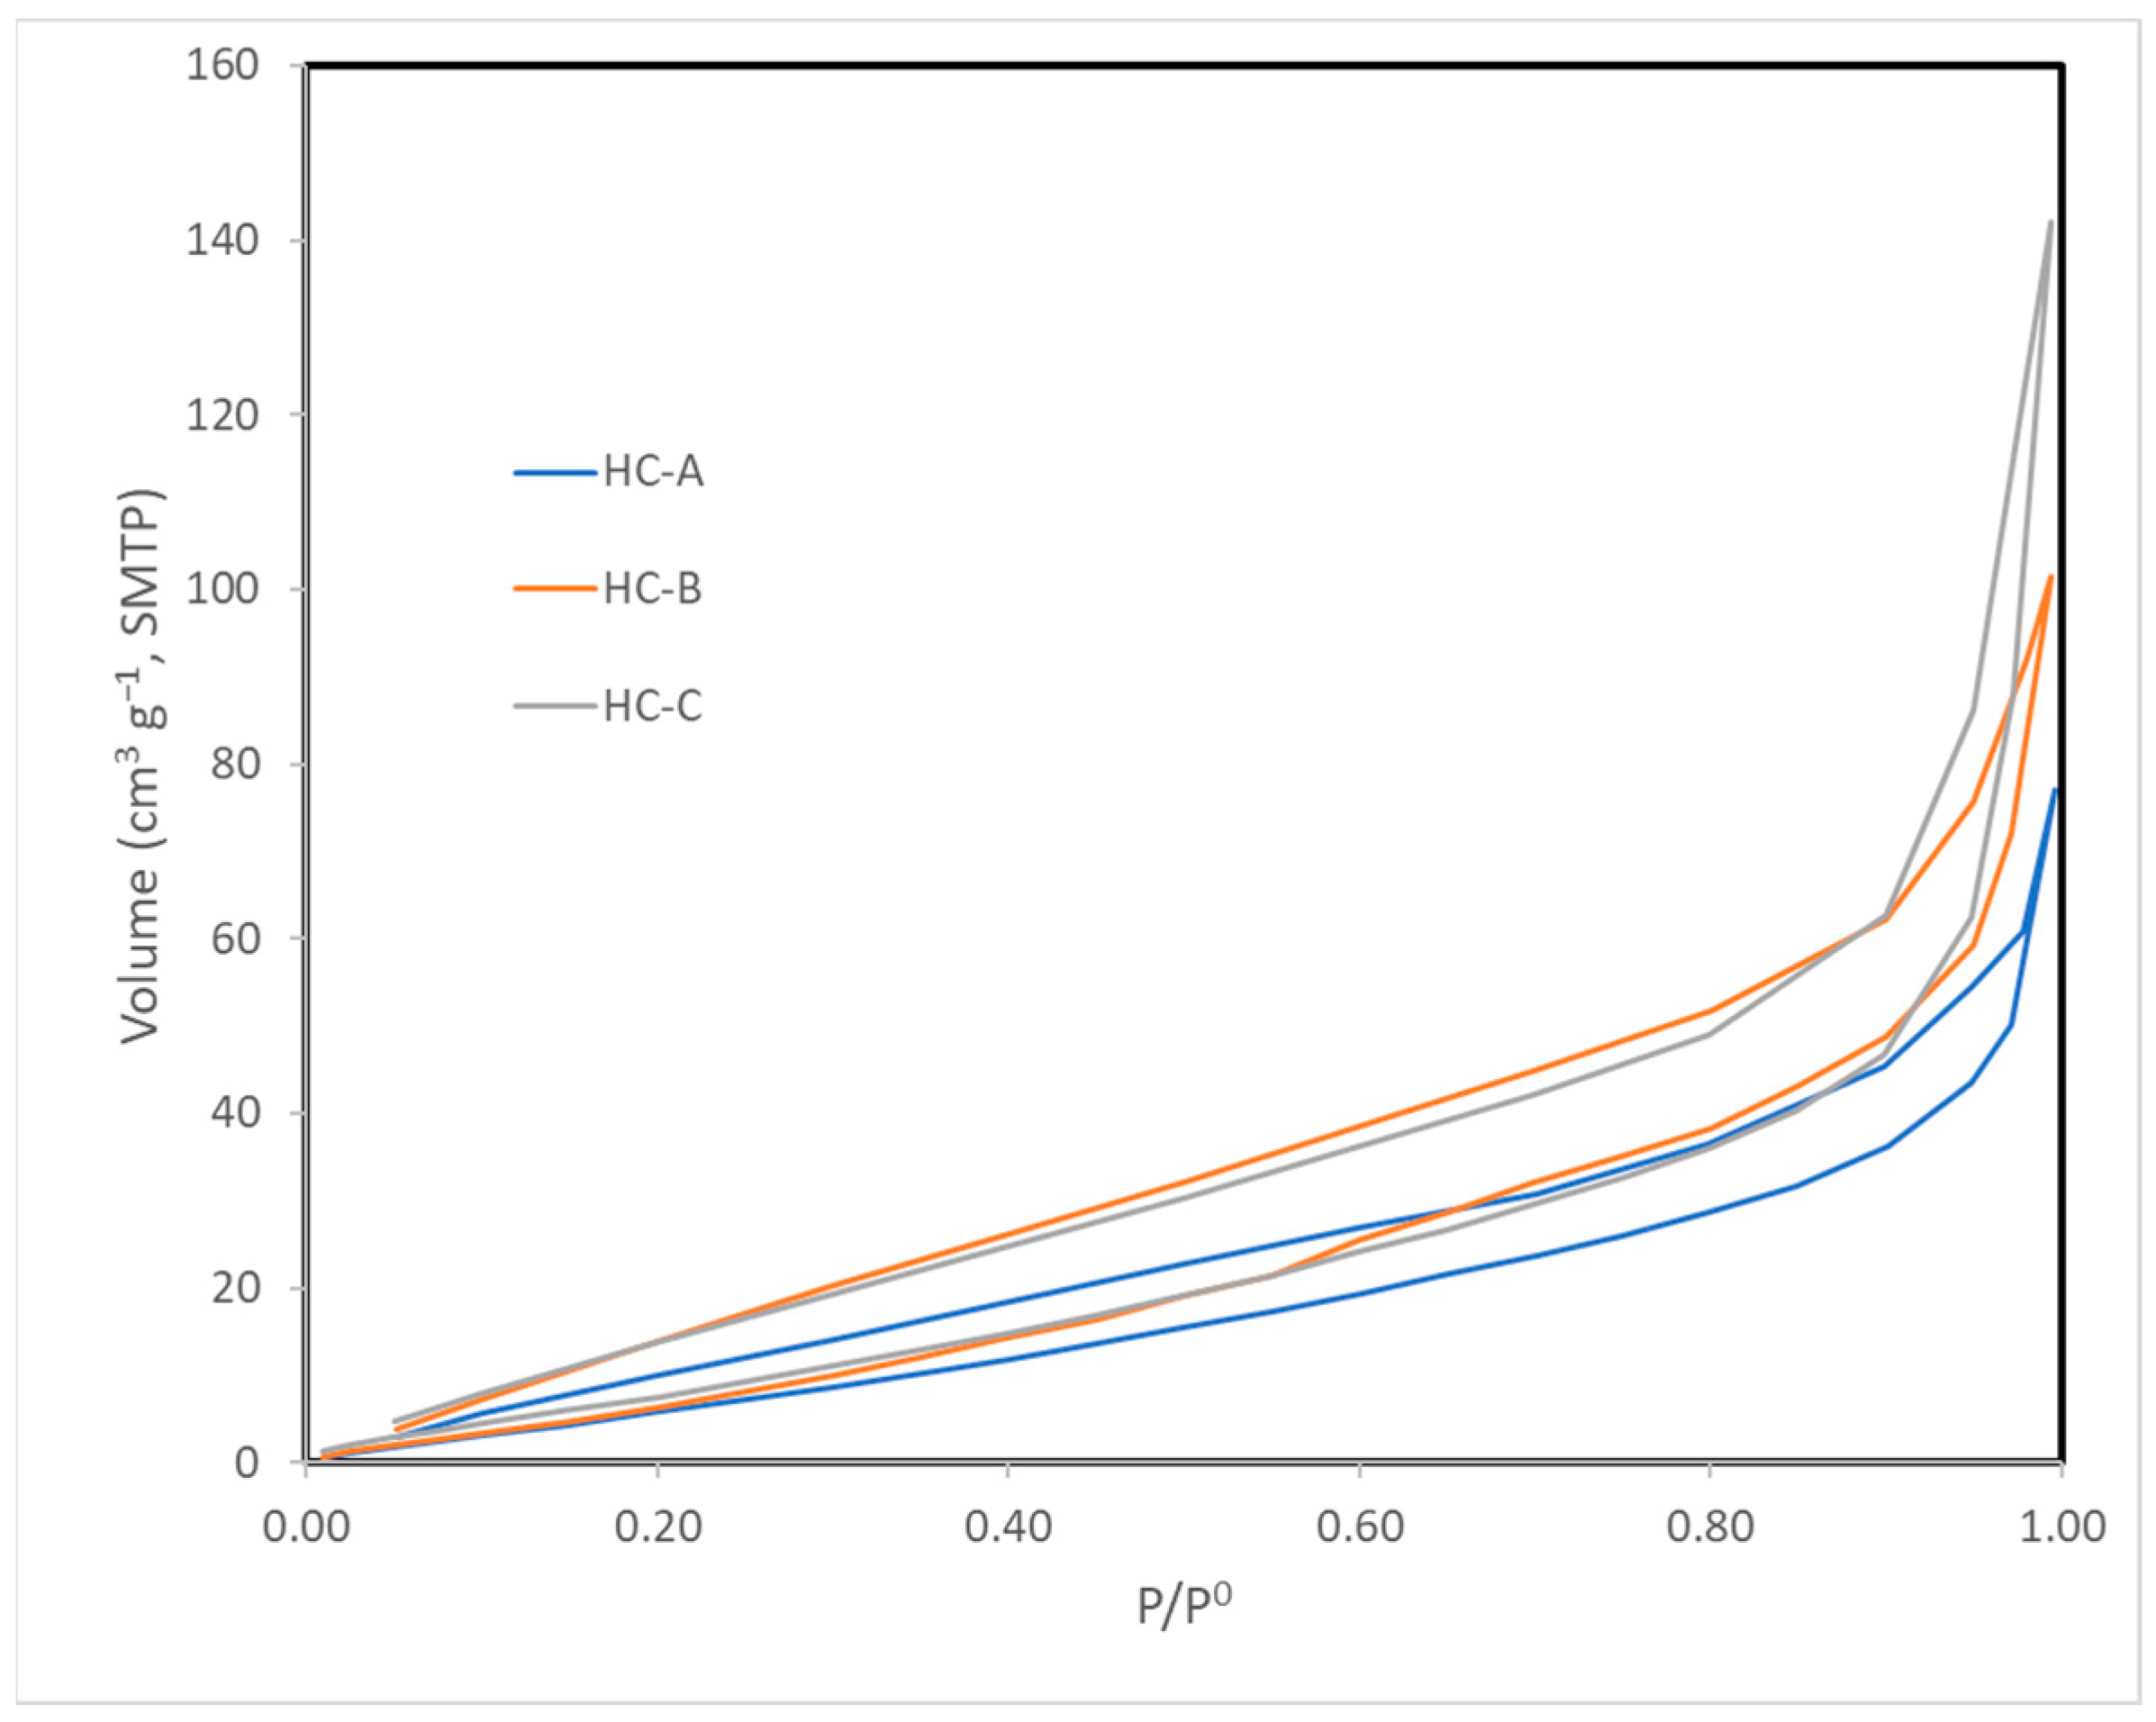
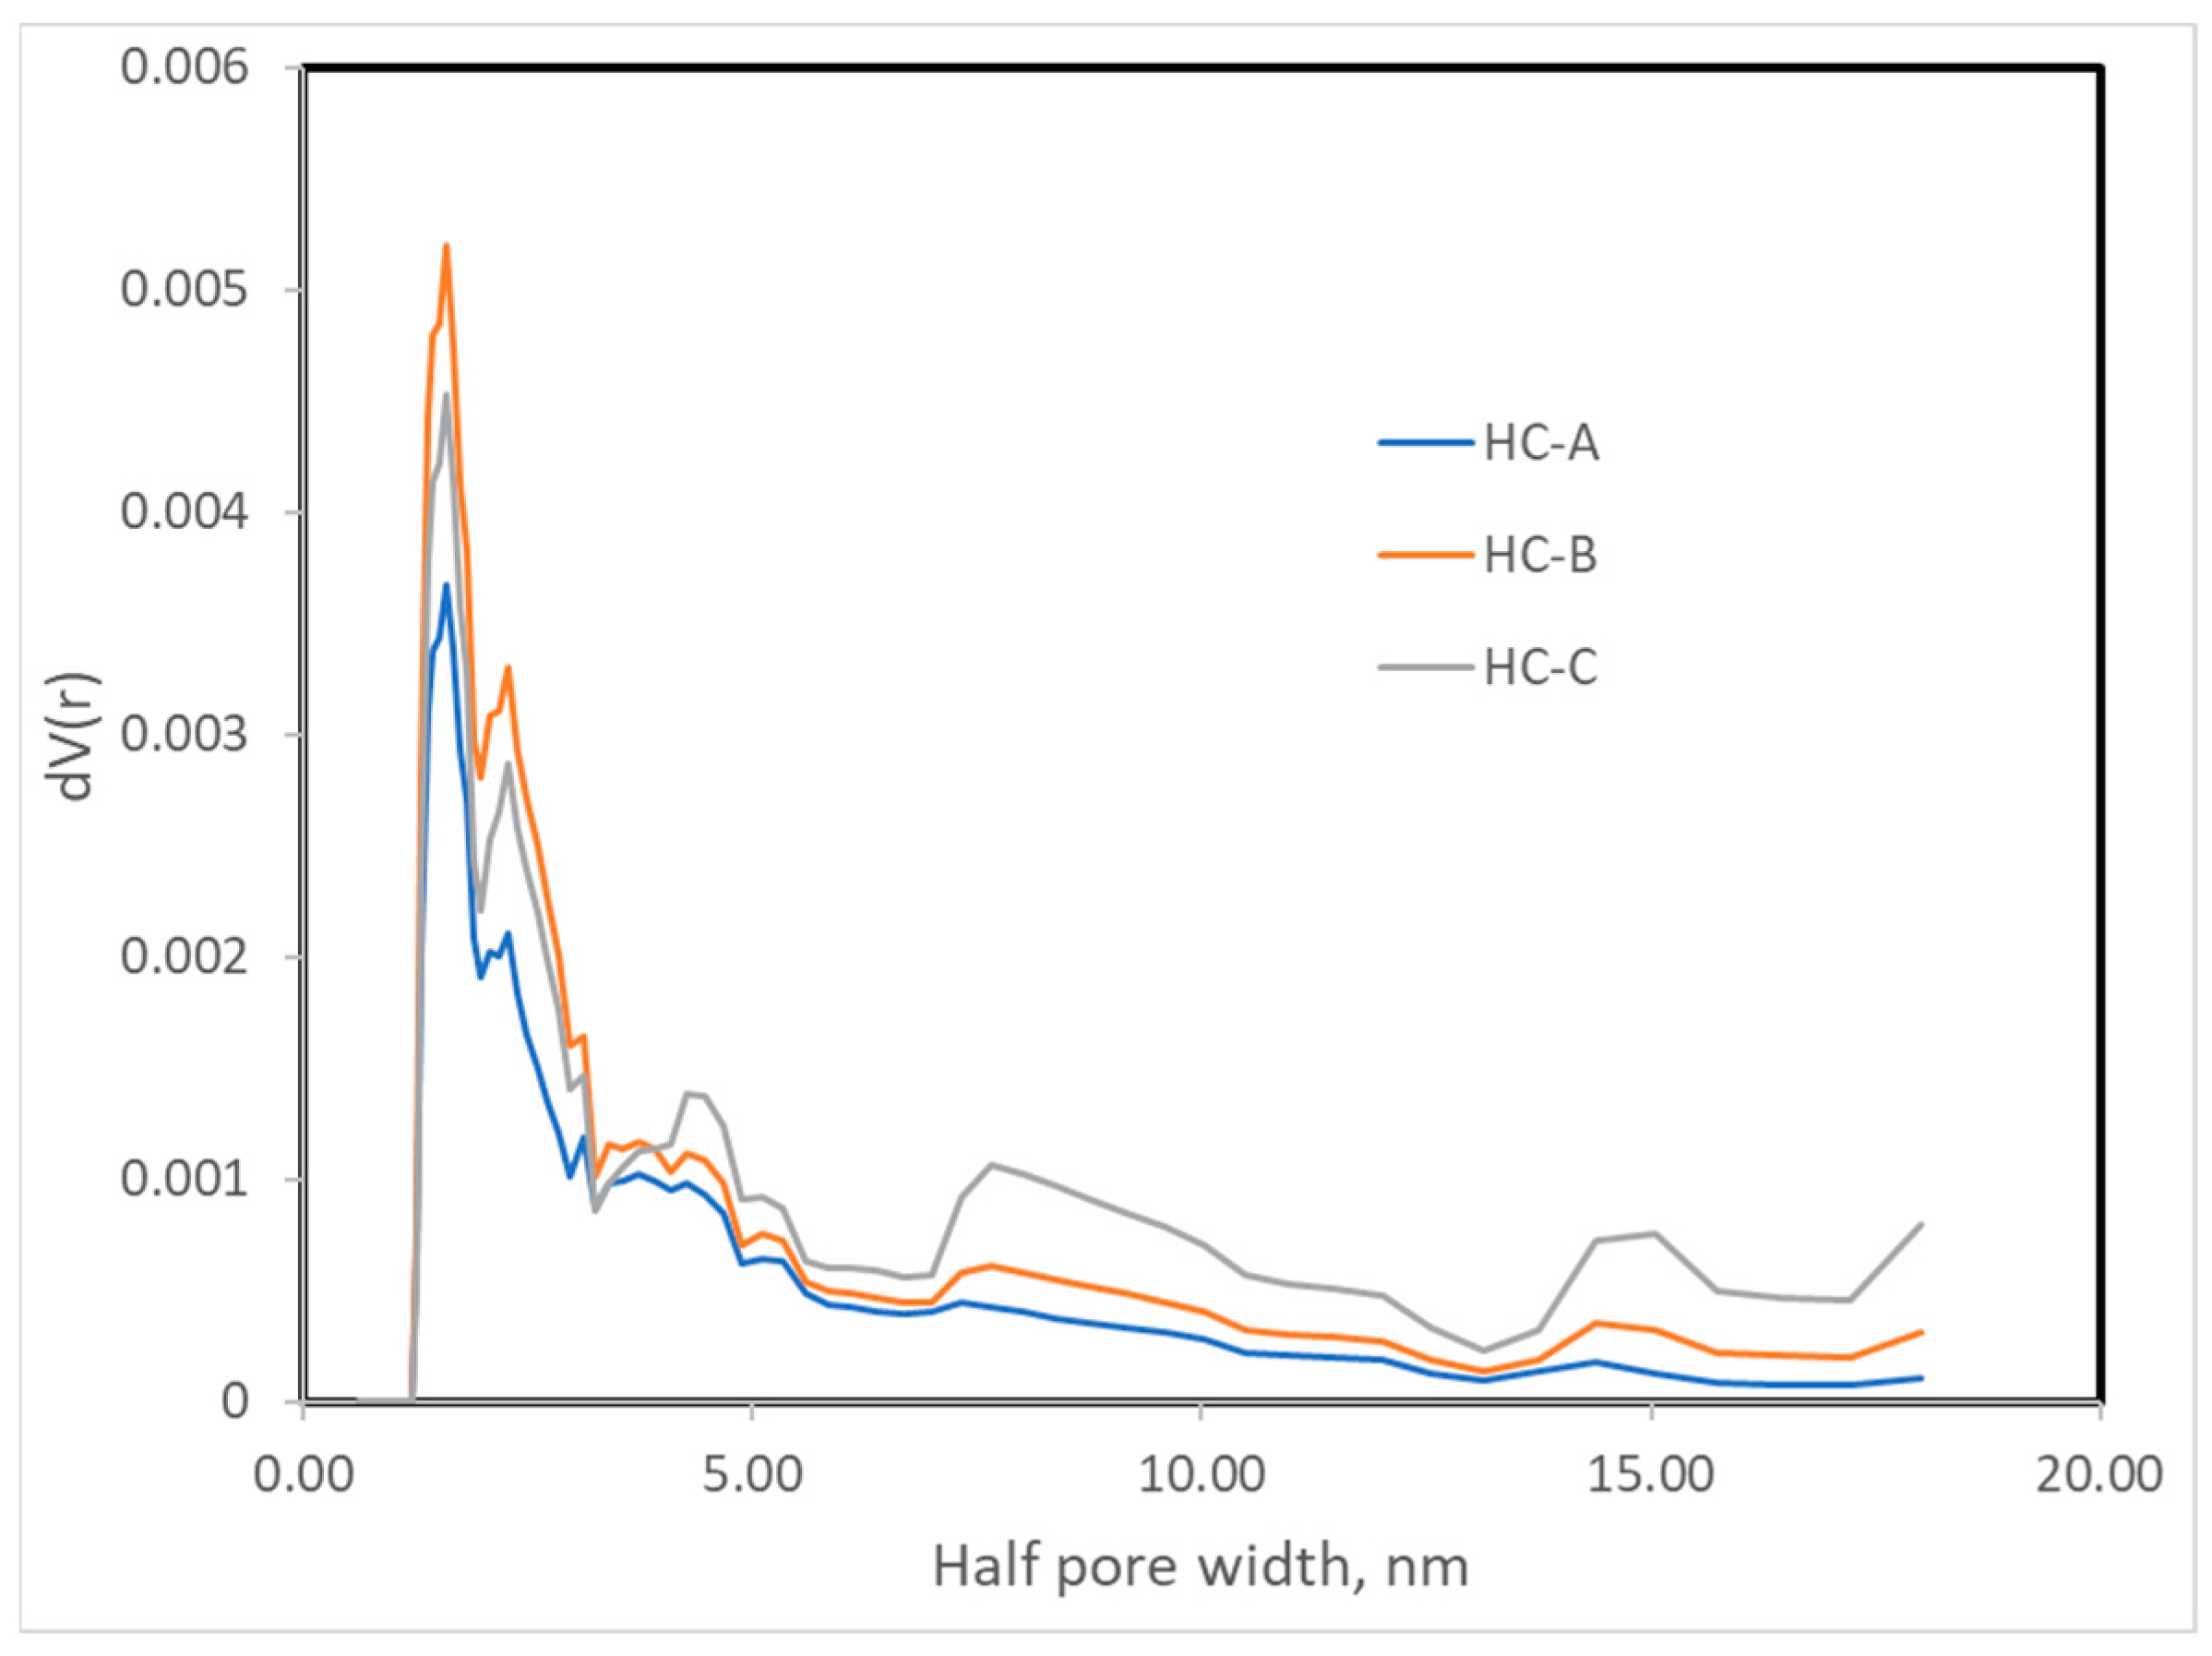
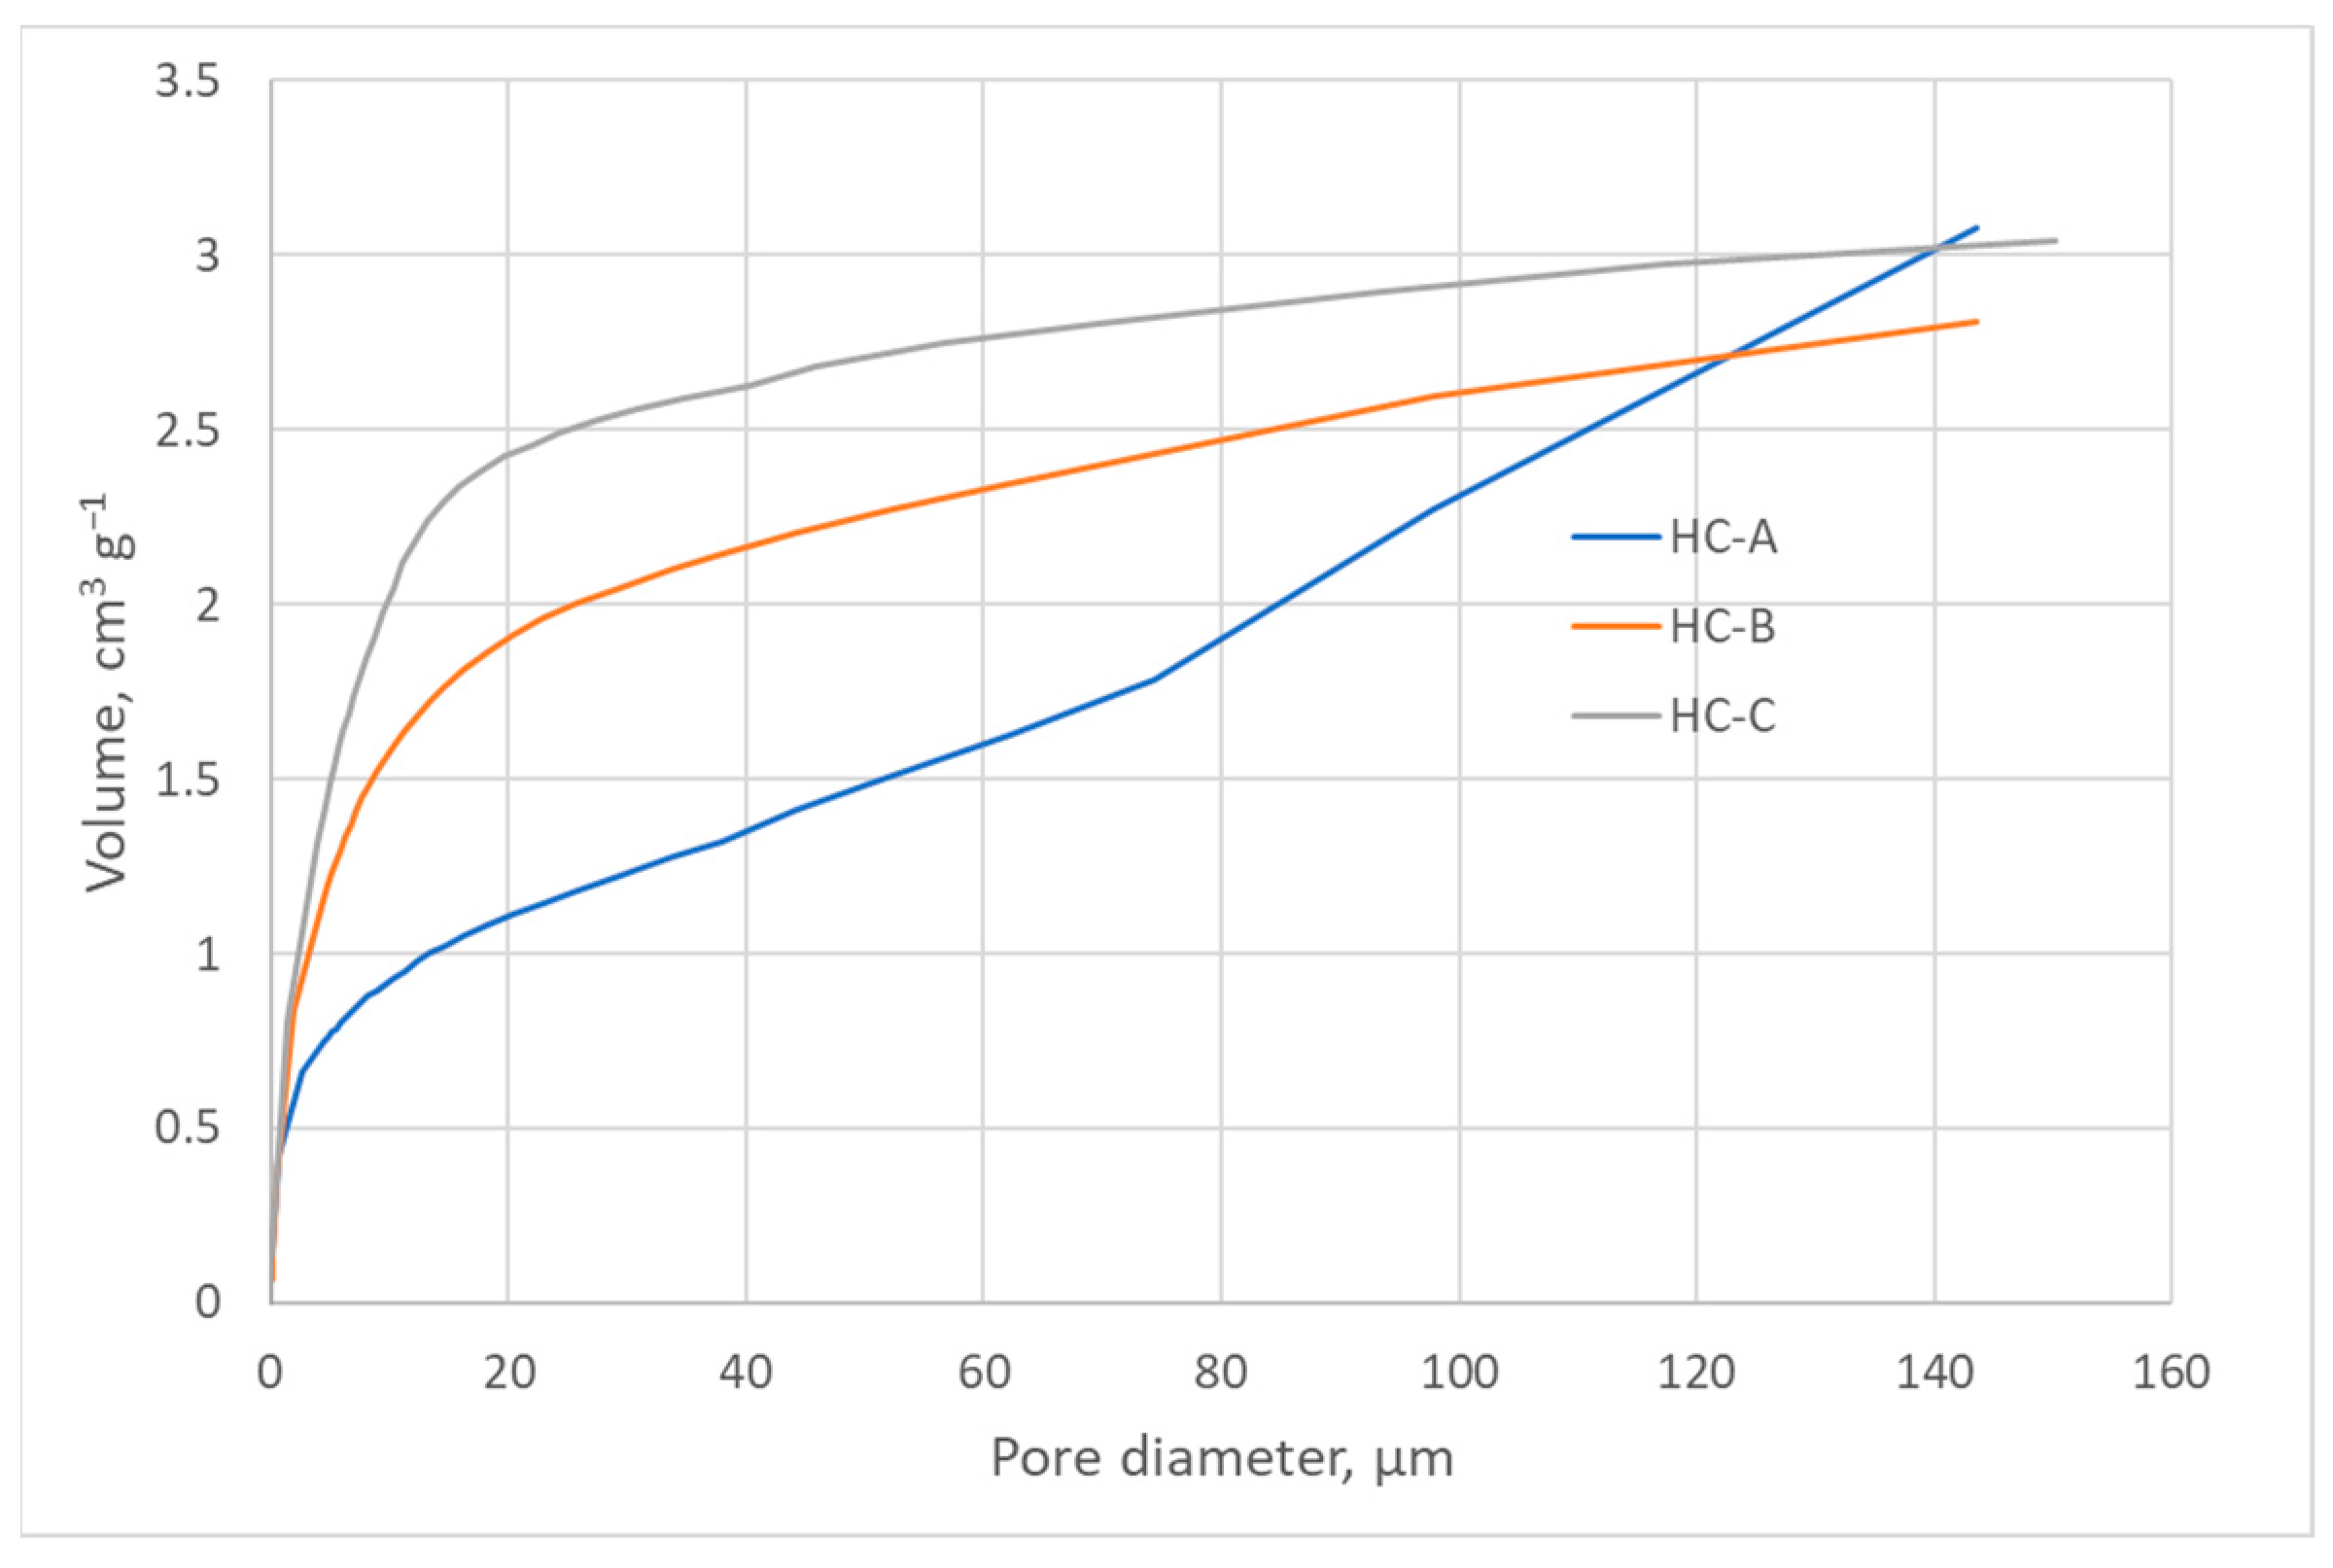
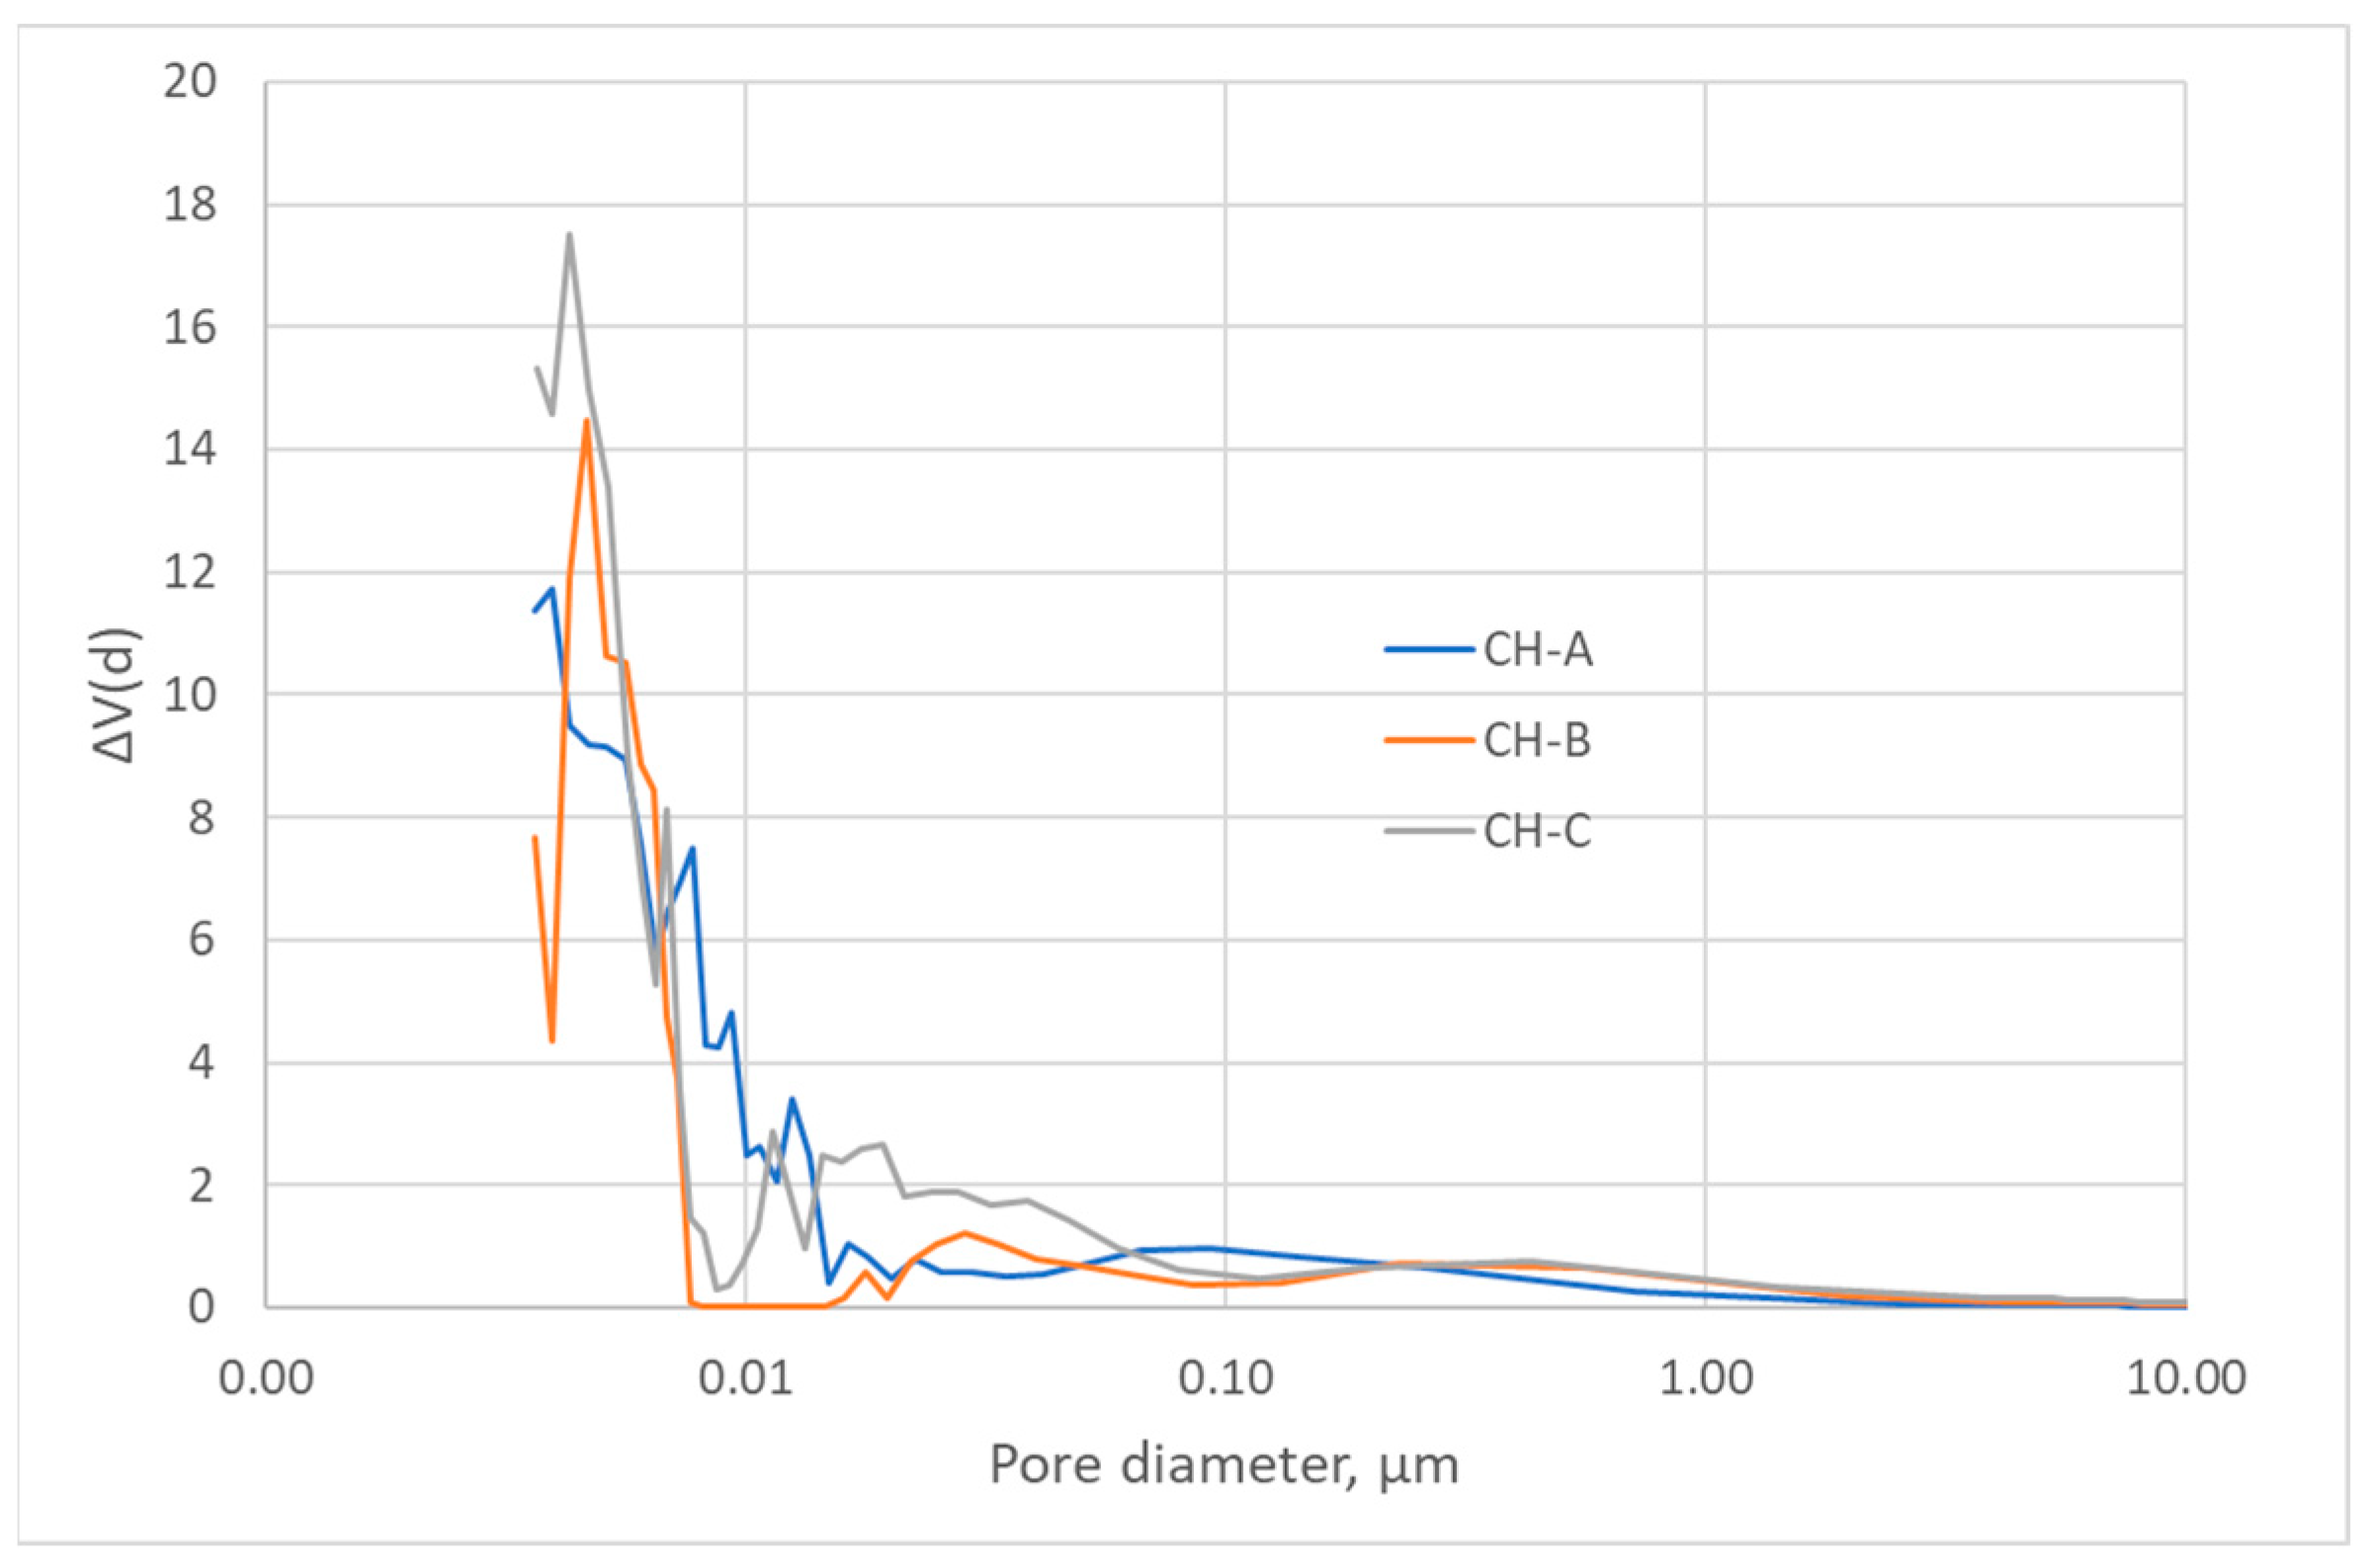
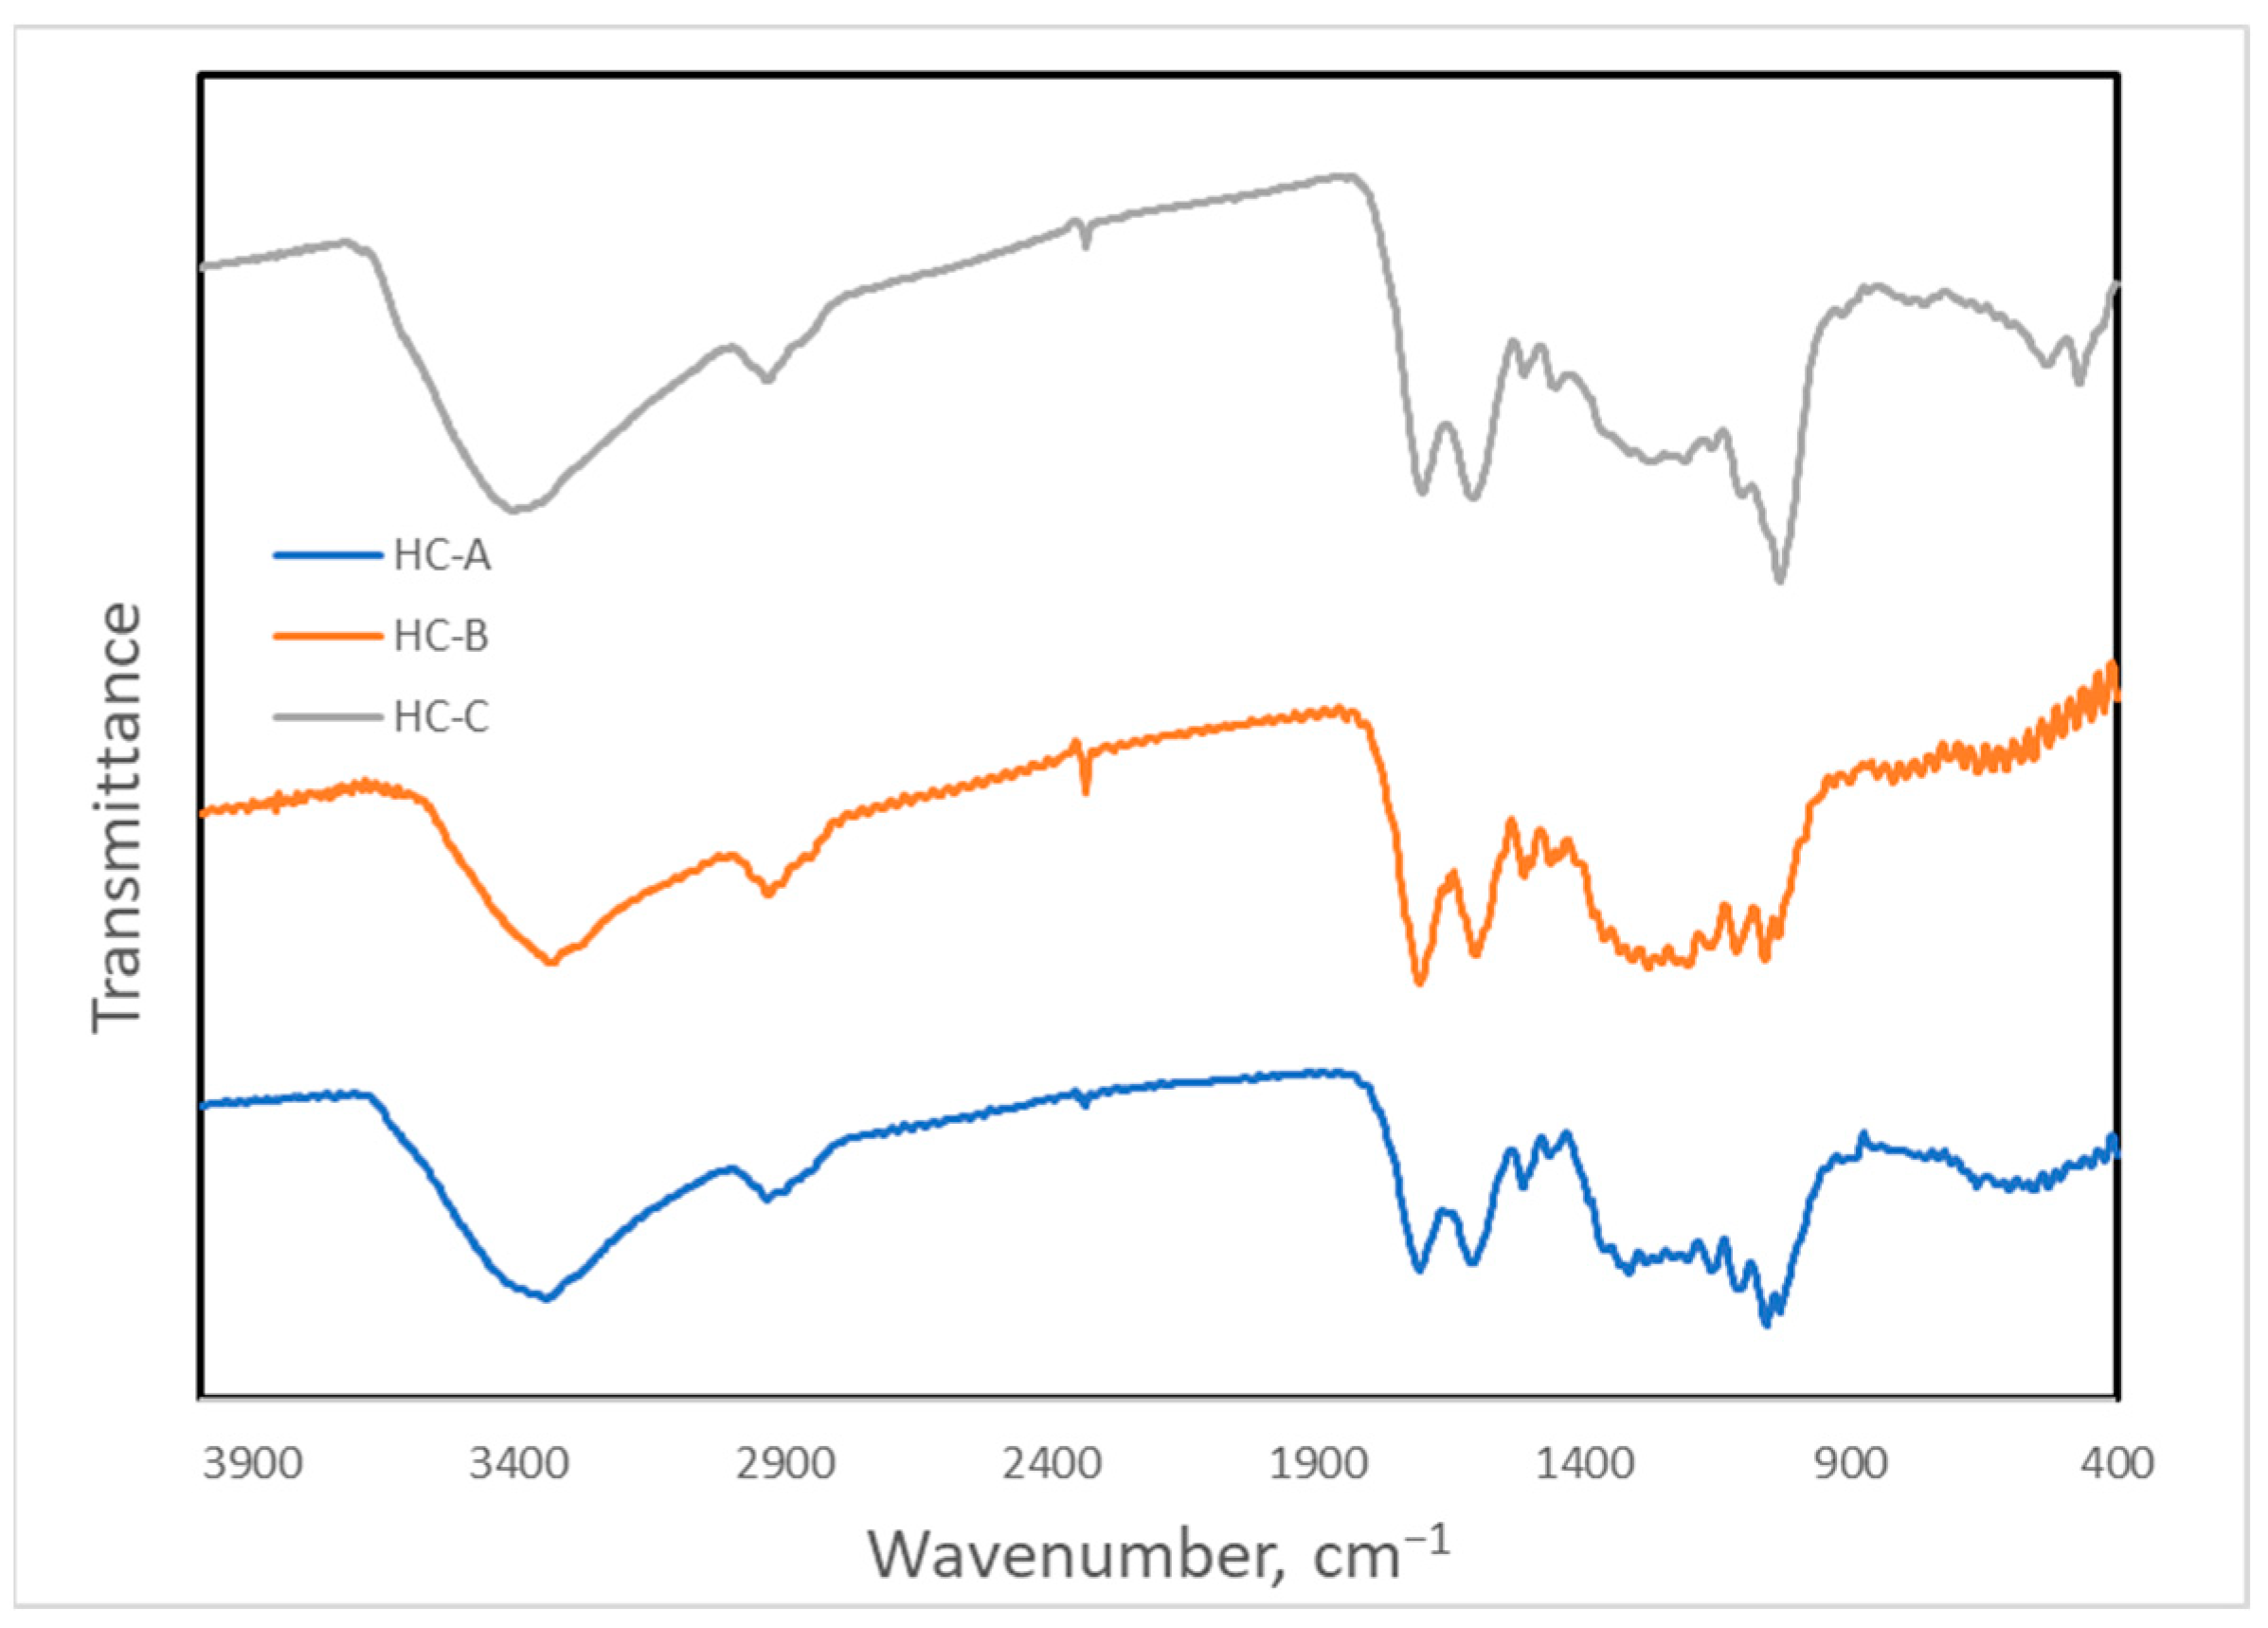
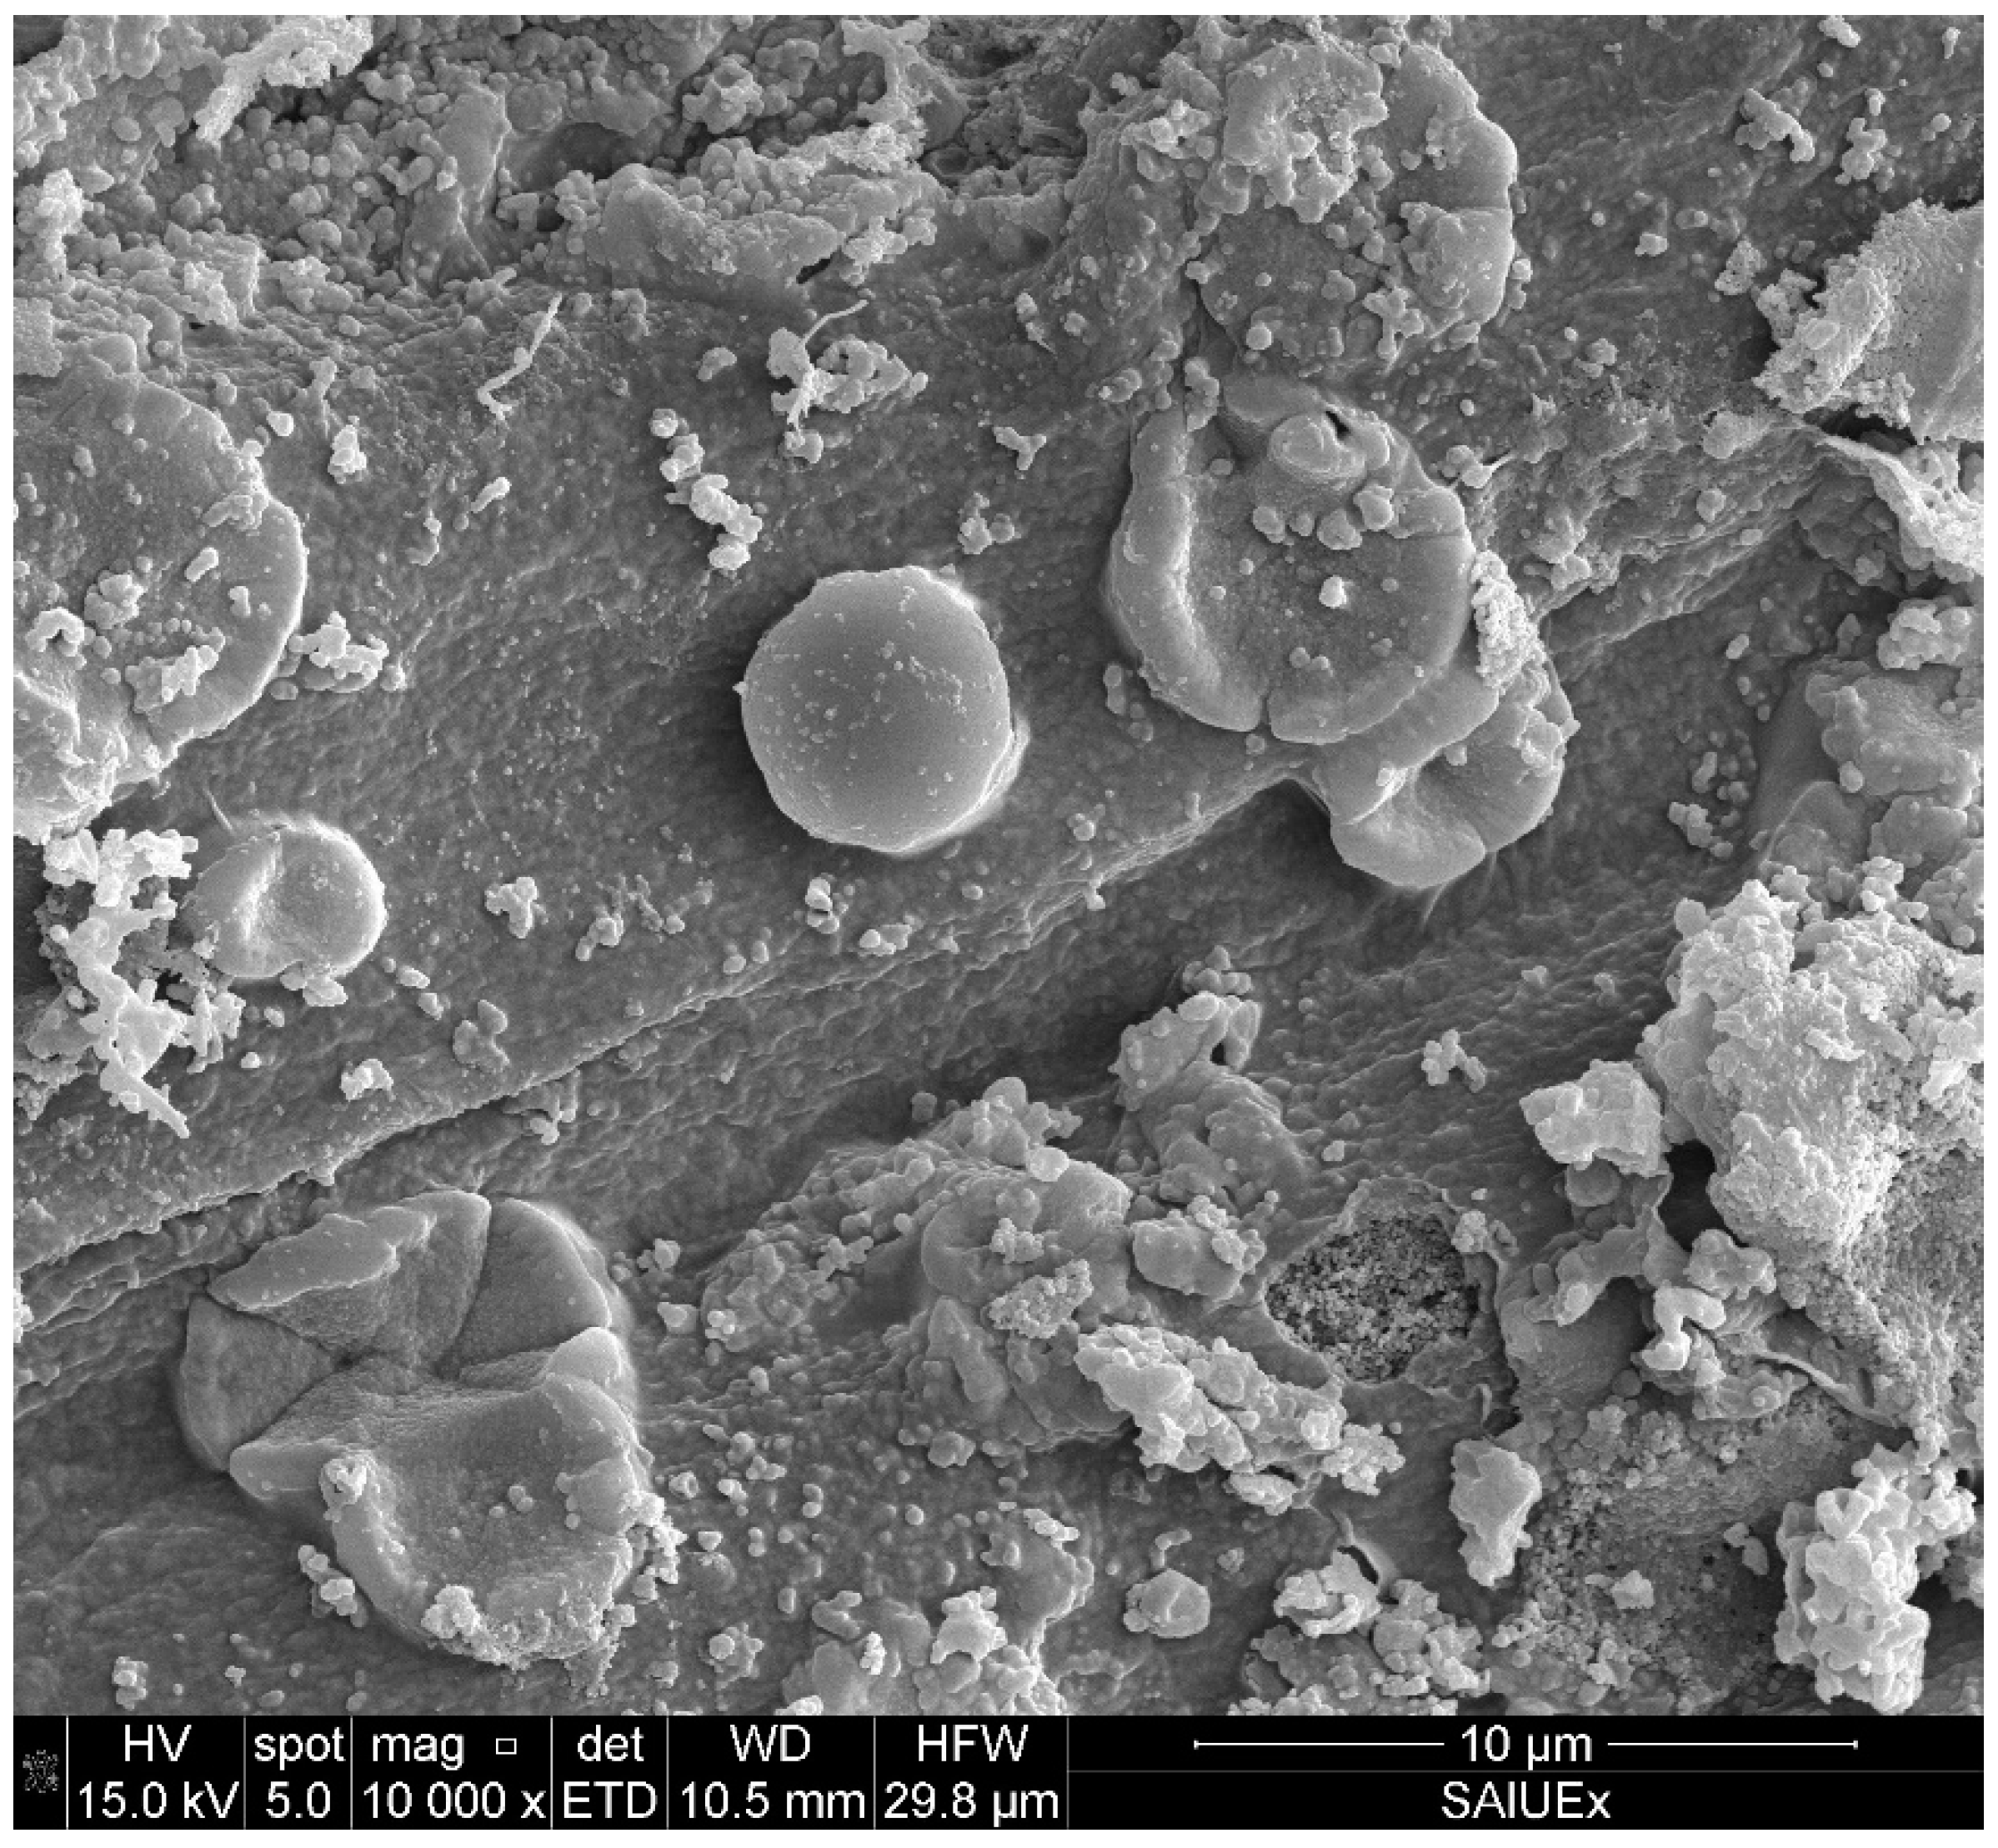
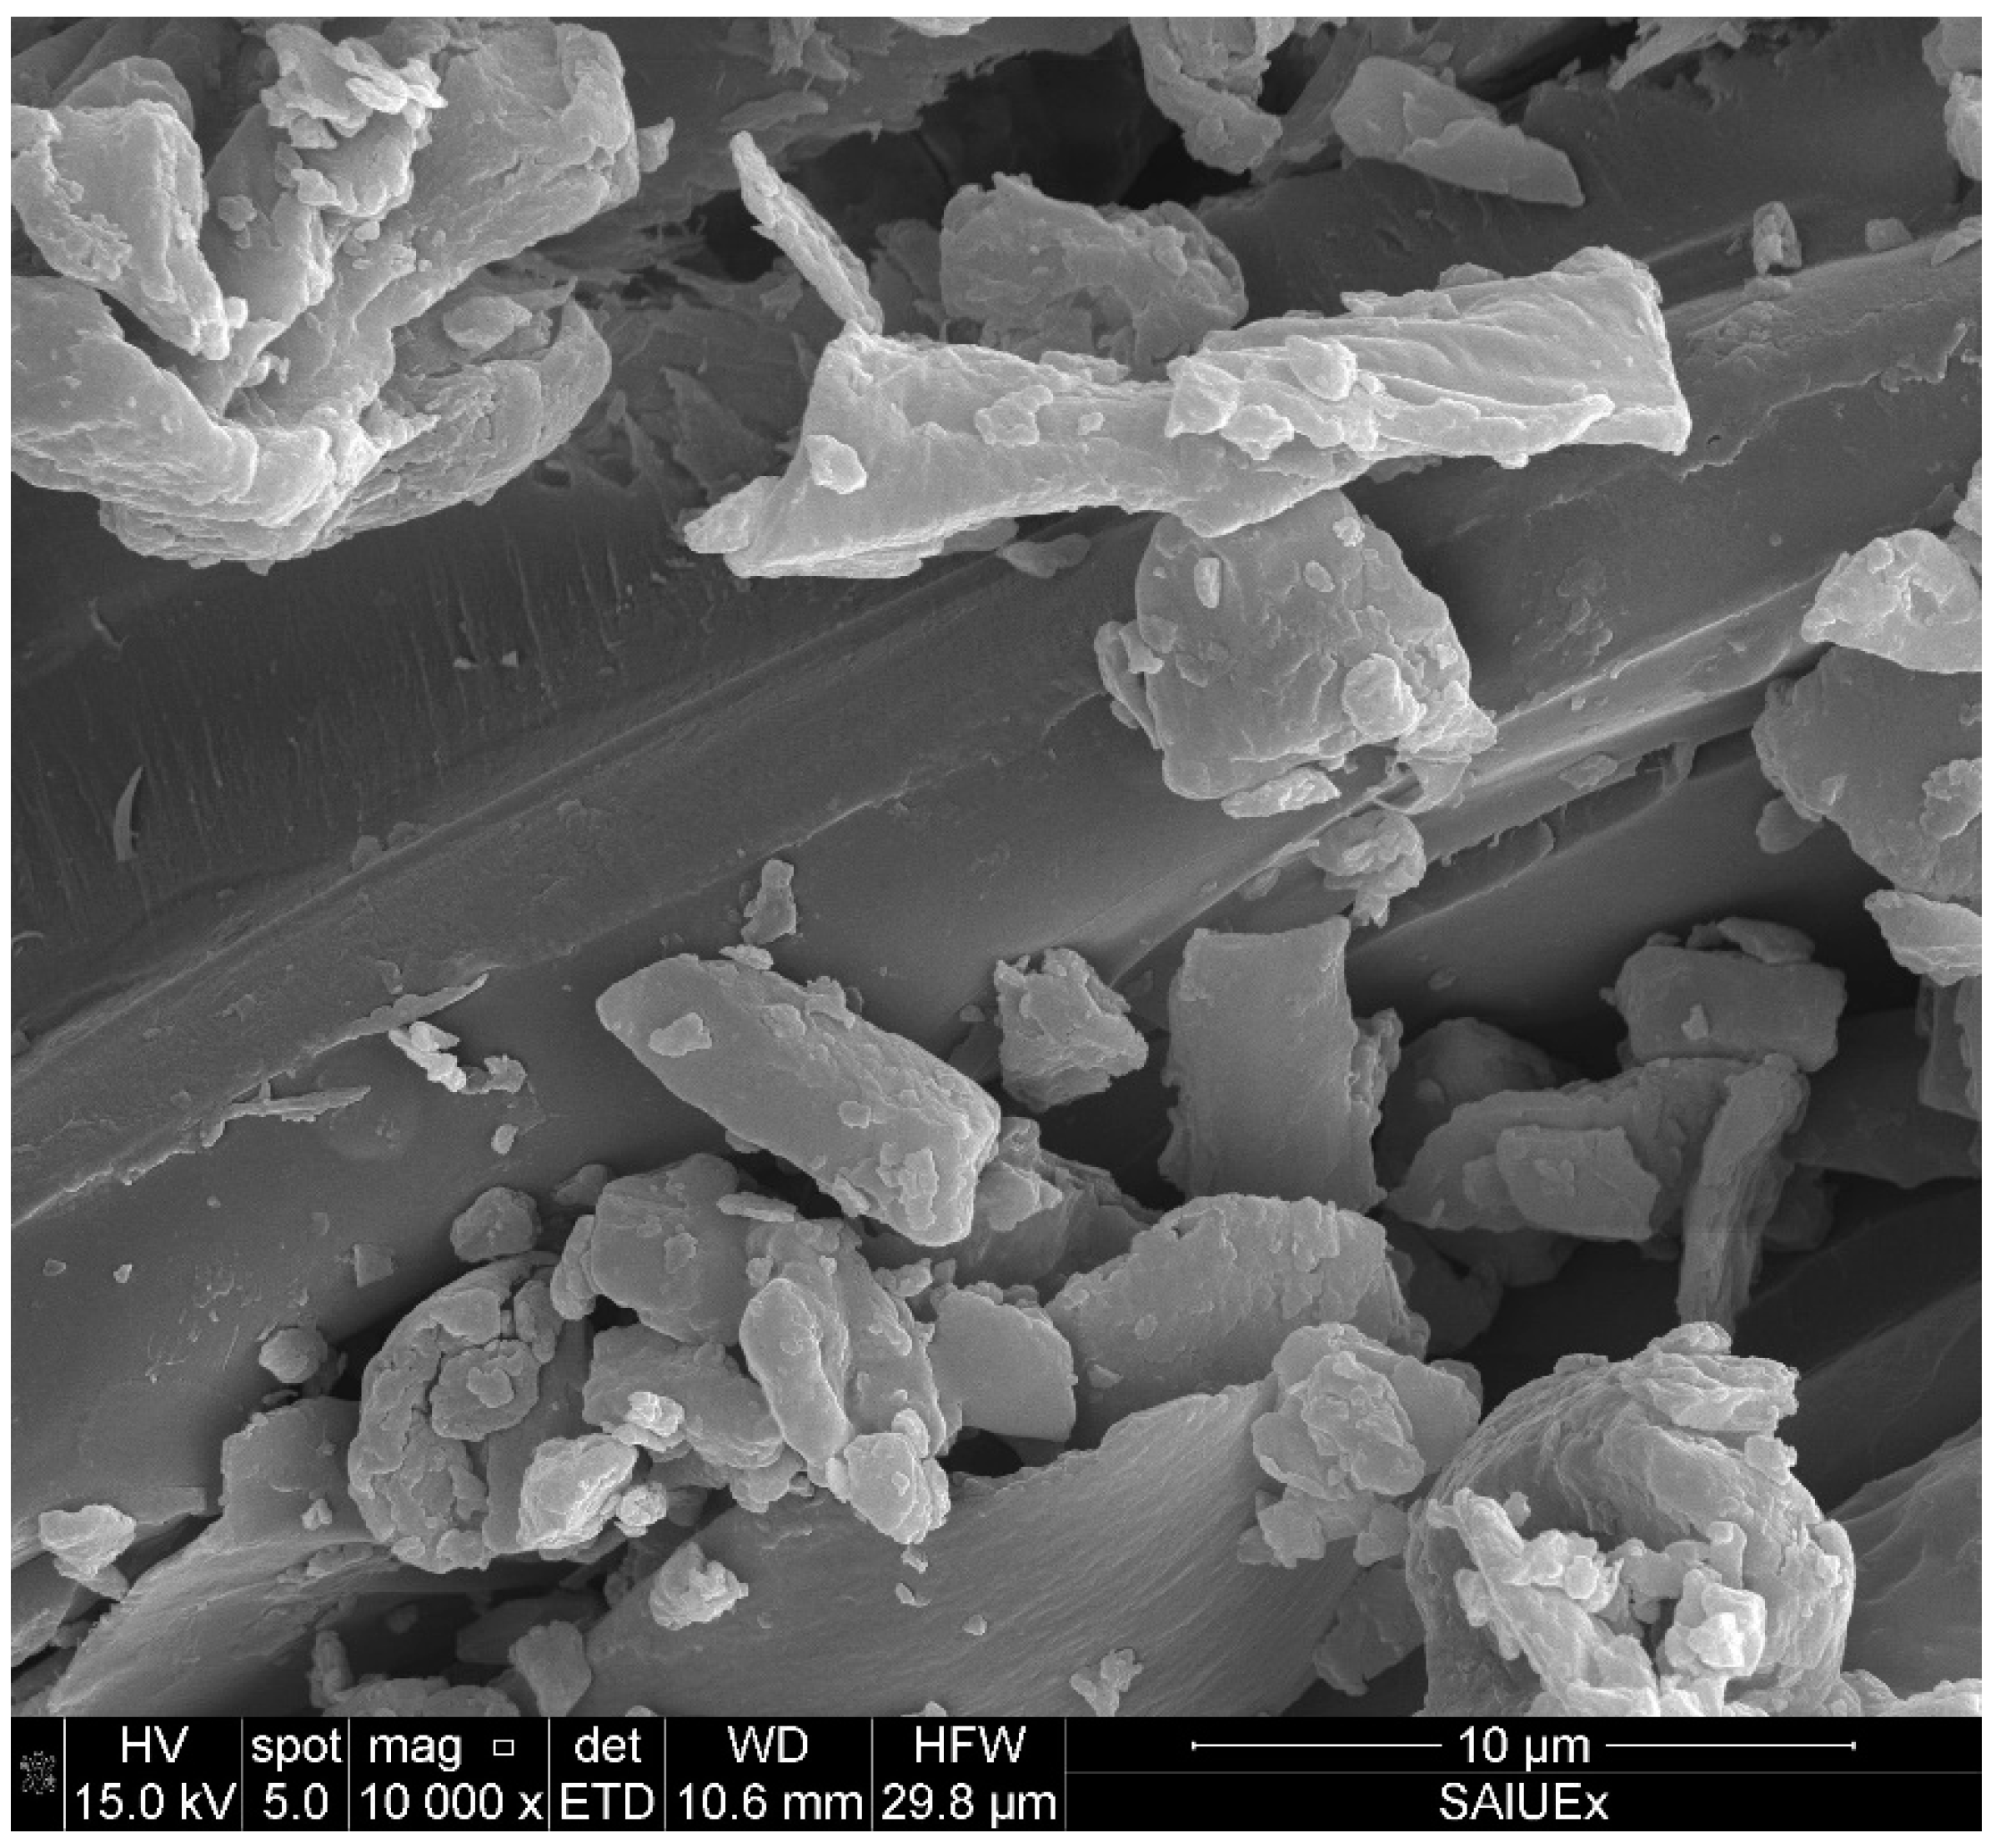
The carbons thus obtained show a limited surface area and a low microporosity while having a large volume of mesopores and macropores. All of them are acidic, with a low graphitization index, minimal moisture, and slight residual ash content; they are carbonaceous materials with a low mineral matter content.
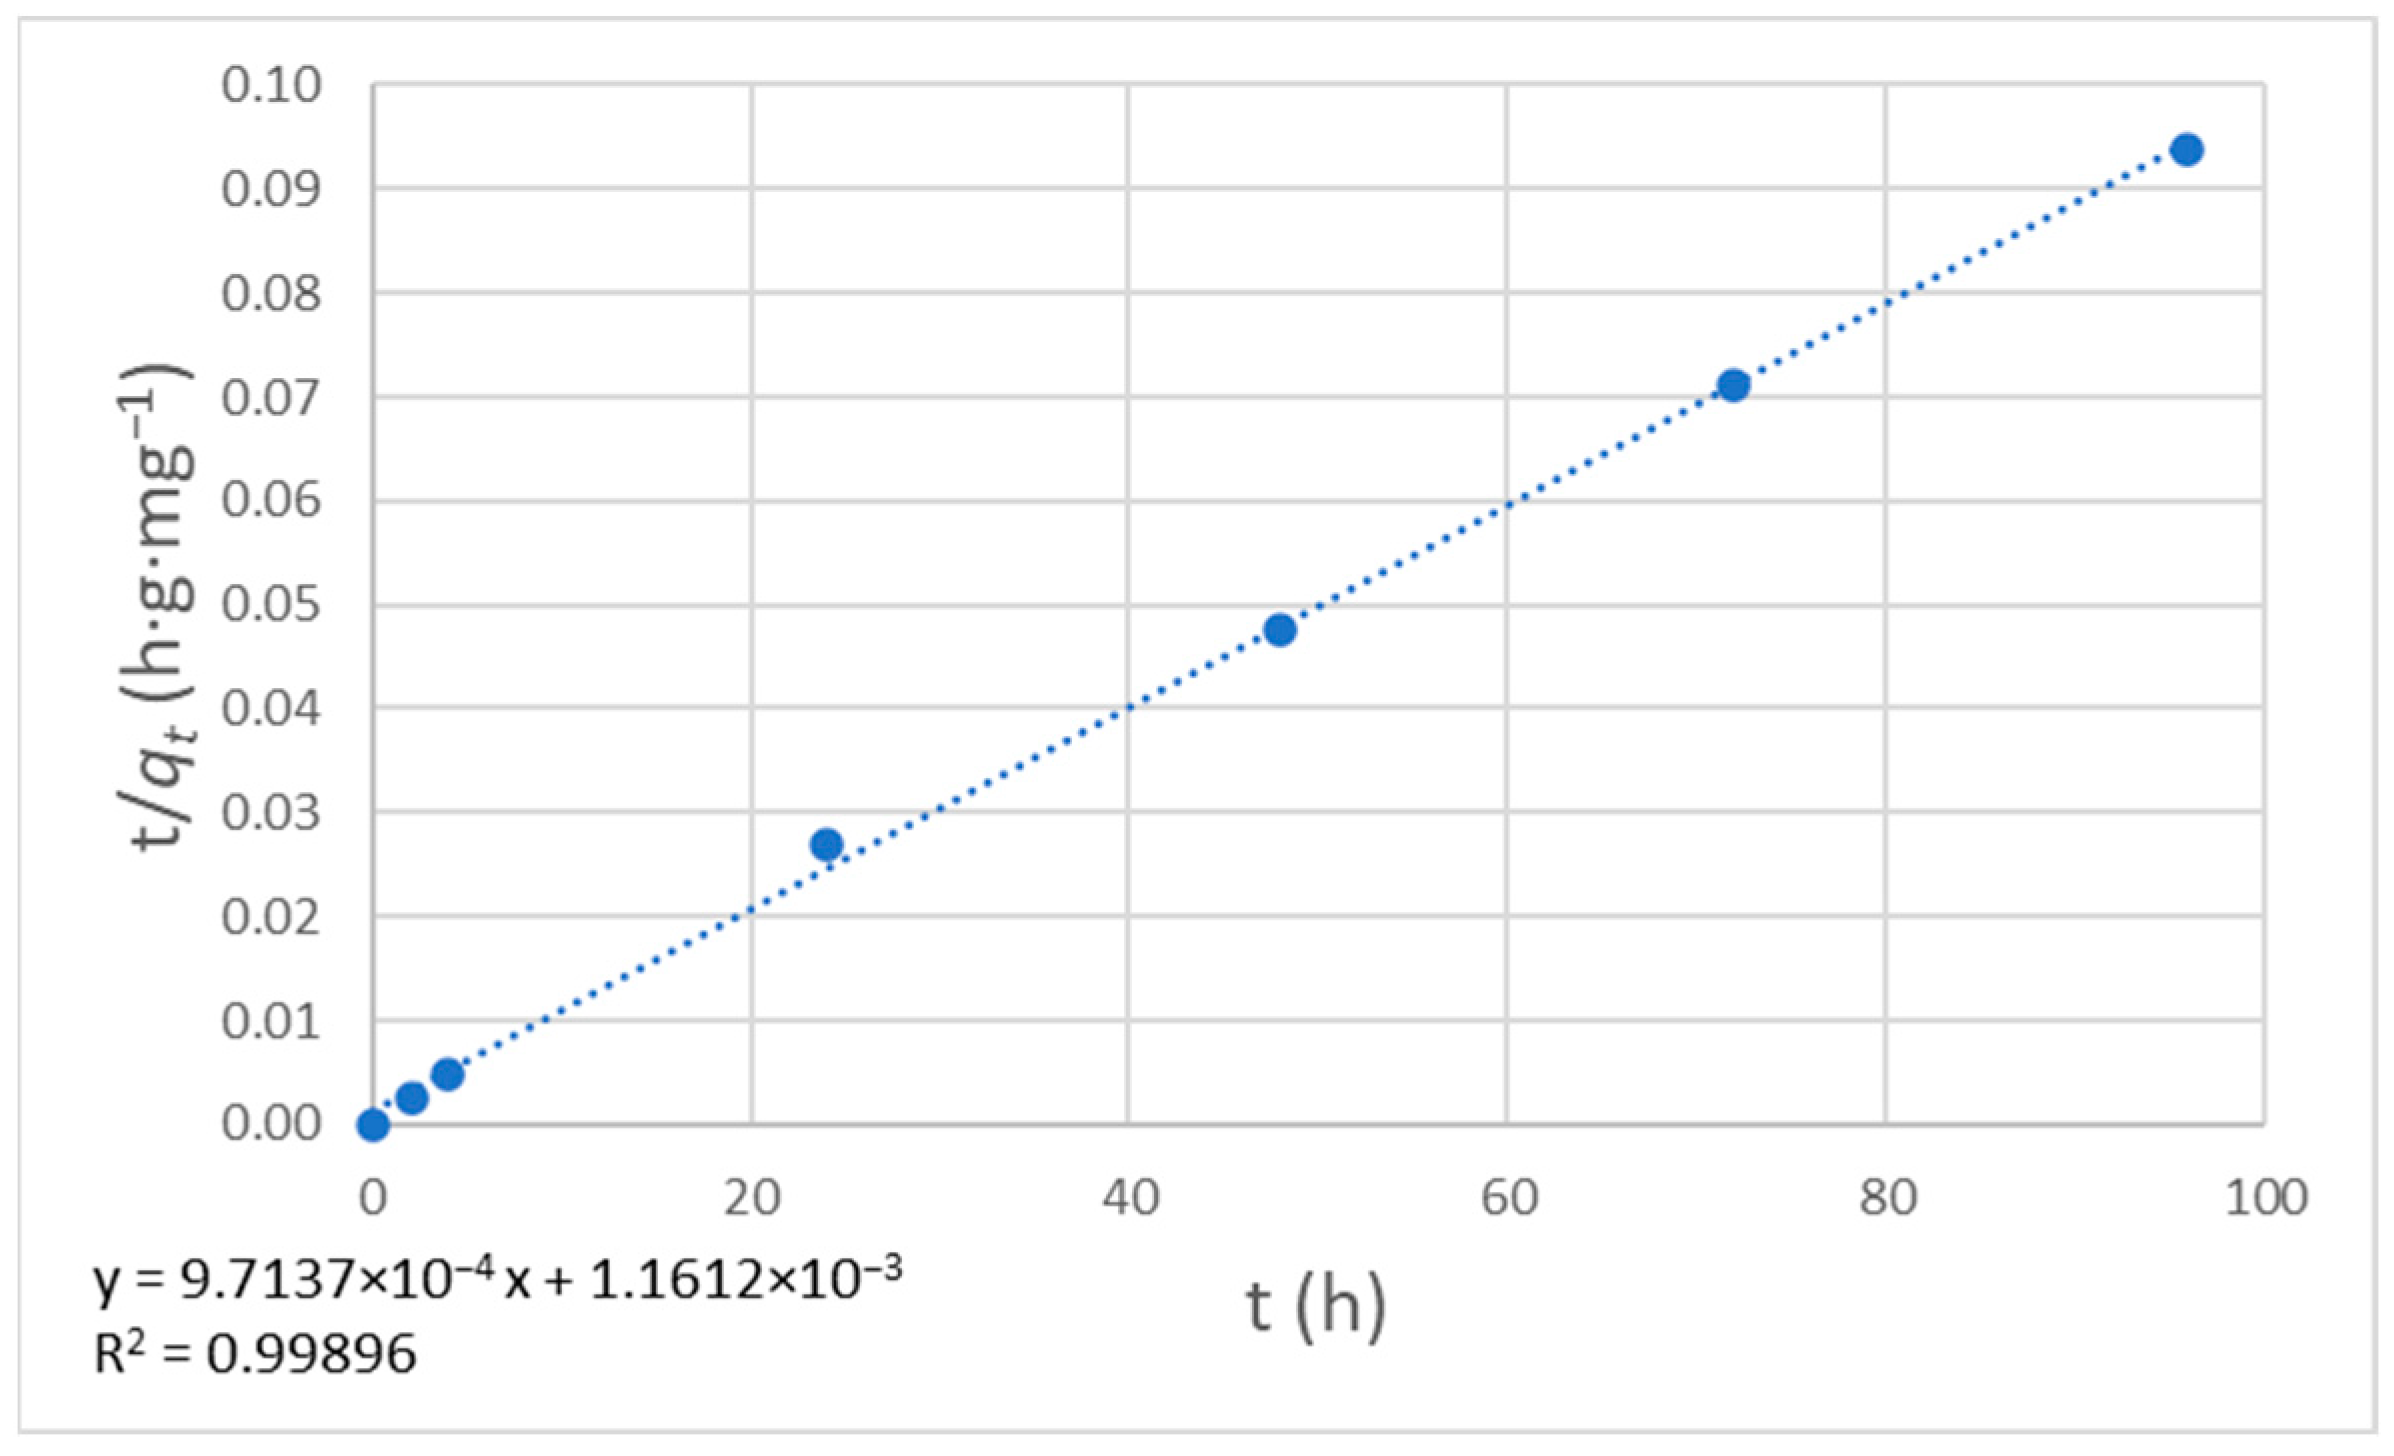
It is possible to purify water contaminated with perfluorooctanoate by adsorption on this type of hydrothermal carbon. The adsorption process follows pseudo-second-order kinetics. Additionally, it fits the Freundlich model, showing that more than one layer can be adsorbed, which is expected in such an amorphous adsorbent.

Supplementary Materials

The following supporting information can be downloaded at: https://www.mdpi.com/article/10.3390/c9020057/s1, Table S1. Thermal Analysis Program; Figure S1. SEM Images of HC-A; Figure S2. SEM Images of HC-B; Figure S3. SEM Images of HC-C; Figure S4. SEM Images of raw chestnut cupule.

Author Contributions

Conceptualization, I.M.L.-C. and S.I.; methodology, I.M.L.-C. and C.J.D.-V.; investigation, S.I., N.P., C.J.D.-V. and I.M.L.-C.; writing—original draft preparation, S.I., C.J.D.-V. and I.M.L.-C.; writing—review and editing, S.I., N.P., C.J.D.-V. and I.M.L.-C.; funding acquisition, C.J.D.-V. All authors have read and agreed to the published version of the manuscript.

Funding

This research was funded by the Spanish Regional Government ‘Junta de Extremadura’ and European Regional Development Fund (ERDF), grants IB20026 and GR21107.

Data Availability Statement

Data may be obtained from the authors under reasonable request.

Conflicts of Interest

The authors declare no conflict of interest.

References

  1. Tang, W.; Zhang, Y.; Zhong, Y.; Shen, T.; Wang, X.; Xia, X.; Tu, J. Natural biomass-derived carbons for electrochemical energy storage. Mater. Res. Bull. 2017, 88, 234–241. [Google Scholar] [CrossRef]
  2. Ma, Q.; Yu, Y.; Sindoro, M.; Fane, A.G.; Wang, R.; Zhang, H. Carbon-Based Functional Materials Derived from Waste for Water Remediation and Energy Storage. Adv. Mater. 2017, 29, 1605361. [Google Scholar] [CrossRef] [PubMed]
  3. Soffian, M.S.; Abdul Halim, F.Z.; Aziz, F.; Rahman, M.A.; Mohamed Amin, M.A.; Awang Chee, D.N. Carbon-based material derived from biomass waste for wastewater treatment. Environ. Adv. 2022, 9, 100259. [Google Scholar] [CrossRef]
  4. Adegoke, K.A.; Akinnawo, S.O.; Ajala, O.A.; Adebusuyi, T.A.; Maxakato, N.W.; Bello, O.S. Progress and challenges in batch and optimization studies on the adsorptive removal of heavy metals using modified biomass-based adsorbents. Bioresour. Technol. Rep. 2022, 19, 101115. [Google Scholar] [CrossRef]
  5. Gęca, M.; Wiśniewska, M.; Nowicki, P. Biochars and activated carbons as adsorbents of inorganic and organic compounds from multicomponent systems—A review. Adv. Colloid Interface Sci. 2022, 305, 102687. [Google Scholar] [CrossRef]
  6. Borchardt, L.; Zhu, Q.-L.; Casco, M.E.; Berger, R.; Zhuang, X.; Kaskel, S.; Feng, X.; Xu, Q. Toward a molecular design of porous carbon materials. Mater. Today 2017, 20, 592–610. [Google Scholar] [CrossRef]
  7. Enaime, G.; Baçaoui, A.; Yaacoubi, A.; Lübken, M. Biochar for Wastewater Treatment—Conversion Technologies and Applications. Appl. Sci. 2020, 10, 3492. [Google Scholar] [CrossRef]
  8. Dzyazko, Y.S.; Palchik, O.V.; Ogenko, V.M.; Shtemberg, L.Y.; Bogomaz, V.I.; Protsenko, S.A.; Khomenko, V.G.; Makeeva, I.S.; Chernysh, O.V.; Dzyazko, O.G. Nanoporous Biochar for Removal of Toxic Organic Compounds from Water. In Proceedings of the 6th International Conference Nanotechnology and Nanomaterials (NANO2018), Kyiv, Ukraine, 27–30 August 2018; pp. 209–224. [Google Scholar]
  9. Altundogan, H.S.; Bahar, N.; Mujde, B.; Tumen, F. The use of sulphuric acid-carbonization products of sugar beet pulp in Cr(VI) removal. J. Hazard. Mater. 2007, 144, 255–264. [Google Scholar] [CrossRef]
  10. Kew, R.B.G. Castanea Sativa. 2023. Available online: https://powo.science.kew.org/taxon/urn:lsid:ipni.org:names:295349-1/general-information#descriptions (accessed on 3 February 2023).
  11. Caudullo, G.; Welk, E.; San-Miguel-Ayanz, J. Chorological maps for the main European woody species. Data Br. 2017, 12, 662–666. [Google Scholar] [CrossRef]
  12. Conedera, M.; Manetti, M.C.; Giudici, F.; Amorini, E. Distribution and economic potential of the Sweet chestnut (Castanea sativa Mill.) in Europe. Ecol. Mediterr. 2004, 30, 179–193. [Google Scholar] [CrossRef]
  13. Schultz, M.M.; Barofsky, D.F.; Field, J.A. Fluorinated Alkyl Surfactants. Environ. Eng. Sci. 2003, 20, 487–501. [Google Scholar] [CrossRef]
  14. Wang, Z.; DeWitt, J.C.; Higgins, C.P.; Cousins, I.T. A Never-Ending Story of Per- and Polyfluoroalkyl Substances (PFASs)? Environ. Sci. Technol. 2017, 51, 2508–2518. [Google Scholar] [CrossRef] [PubMed]
  15. Andersson, E.M.; Scott, K.; Xu, Y.Y.; Li, Y.; Olsson, D.S.; Fletcher, T.; Jakobsson, K. High exposure to perfluorinated compounds in drinking water and thyroid disease. A cohort study from Ronneby, Sweden. Environ. Res. 2019, 176, 108540. [Google Scholar] [CrossRef] [PubMed]
  16. Domingo, J.L.; Nadal, M. Human exposure to per- and polyfluoroalkyl substances (PFAS) through drinking water: A review of the recent scientific literature. Environ. Res. 2019, 177, 108648. [Google Scholar] [CrossRef] [PubMed]
  17. Geissen, V.; Mol, H.; Klumpp, E.; Umlauf, G.; Nadal, M.; van der Ploeg, M.; van de Zee, S.E.A.T.M.; Ritsema, C.J. Emerging pollutants in the environment: A challenge for water resource management. Int. Soil Water Conserv. Res. 2015, 3, 57–65. [Google Scholar] [CrossRef]
  18. Knutsen, H.K.; Alexander, J.; Barregård, L.; Bignami, M.; Brüschweiler, B.; Ceccatelli, S.; Cottrill, B.; Dinovi, M.; Edler, L.; Grasl-Kraupp, B.; et al. Risk to human health related to the presence of perfluorooctane sulfonic acid and perfluorooctanoic acid in food. EFSA J. 2018, 16, e05194. [Google Scholar] [CrossRef]
  19. Gao, K.; Zhuang, T.; Liu, X.; Fu, J.; Zhang, J.; Fu, J.; Wang, L.; Zhang, A.; Liang, Y.; Song, M.; et al. Prenatal Exposure to Per- and Polyfluoroalkyl Substances (PFASs) and Association between the Placental Transfer Efficiencies and Dissociation Constant of Serum Proteins–PFAS Complexes. Environ. Sci. Technol. 2019, 53, 6529–6538. [Google Scholar] [CrossRef]
  20. Park, M.; Wu, S.; Lopez, I.J.; Chang, J.Y.; Karanfil, T.; Snyder, S.A. Adsorption of perfluoroalkyl substances (PFAS) in groundwater by granular activated carbons: Roles of hydrophobicity of PFAS and carbon characteristics. Water Res. 2020, 170, 115364. [Google Scholar] [CrossRef]
  21. Susmann, H.P.; Schaider, L.A.; Rodgers, K.M.; Rudel, R.A. Dietary Habits Related to Food Packaging and Population Exposure to PFASs. Environ. Health Perspect. 2019, 127, 107003. [Google Scholar] [CrossRef]
  22. European Environment Agency. Emerging Chemical Risks in Europe-PFAS? Publications Office, 2019; Available online: https://data.europa.eu/doi/10.2800/486213 (accessed on 3 February 2023).
  23. Taylor, S.; Terkildsen, M.; Stevenson, G.; de Araujo, J.; Yu, C.; Yates, A.; McIntosh, R.R.; Gray, R. Per and polyfluoroalkyl substances (PFAS) at high concentrations in neonatal Australian pinnipeds. Sci. Total Environ. 2021, 786, 147446. [Google Scholar] [CrossRef]
  24. Li, F.; Duan, J.; Tian, S.; Ji, H.; Zhu, Y.; Wei, Z.; Zhao, D. Short-chain per- and polyfluoroalkyl substances in aquatic systems: Occurrence, impacts and treatment. Chem. Eng. J. 2020, 380, 122506. [Google Scholar] [CrossRef]
  25. Wong, S.; Ngadi, N.; Inuwa, I.M.; Hassan, O. Recent advances in applications of activated carbon from biowaste for wastewater treatment: A short review. J. Clean. Prod. 2018, 175, 361–375. [Google Scholar] [CrossRef]
  26. Abioye, A.M.; Ani, F.N. Recent development in the production of activated carbon electrodes from agricultural waste biomass for supercapacitors: A review. Renew. Sustain. Energy Rev. 2015, 52, 1282–1293. [Google Scholar] [CrossRef]
  27. McNamara, J.D.; Franco, R.; Mimna, R.; Zappa, L. Comparison of Activated Carbons for Removal of Perfluorinated Compounds From Drinking Water. J. Am. Water Works Assoc. 2018, 110, E2–E14. [Google Scholar] [CrossRef]
  28. Diamadopoulos, E.; Samaras, P.; Sakellaropoulos, G.P. The Effect of Activated Carbon Properties on the Adsorption of Toxic Substances. Water Sci. Technol. 1992, 25, 153–160. [Google Scholar] [CrossRef]
  29. Jeguirim, M.; Belhachemi, M.; Limousy, L.; Bennici, S. Adsorption/reduction of nitrogen dioxide on activated carbons: Textural properties versus surface chemistry—A review. Chem. Eng. J. 2018, 347, 493–504. [Google Scholar] [CrossRef]
  30. Durán-Valle, C.J.; Madrigal-Martínez, M.; Martínez-Gallego, M.; Fonseca, I.M.; Matos, I.; Botelho do Rego, A.M. Activated carbon as a catalyst for the synthesis of N-alkylimidazoles and imidazolium ionic liquids. Catal. Today 2012, 187, 108–114. [Google Scholar] [CrossRef]
  31. Figueiredo, J.; Pereira, M.F.; Freitas, M.M.; Órfão, J.J. Modification of the surface chemistry of activated carbons. Carbon 1999, 37, 1379–1389. [Google Scholar] [CrossRef]
  32. Zhao, L.; Baccile, N.; Gross, S.; Zhang, Y.; Wei, W.; Sun, Y.; Antonietti, M.; Titirici, M.-M. Sustainable nitrogen-doped carbonaceous materials from biomass derivatives. Carbon 2010, 48, 3778–3787. [Google Scholar] [CrossRef]
  33. Titirici, M.-M.; White, R.J.; Falco, C.; Sevilla, M. Black perspectives for a green future: Hydrothermal carbons for environment protection and energy storage. Energy Environ. Sci. 2012, 5, 6796. [Google Scholar] [CrossRef]
  34. Durán-Valle, C.J.; Botet-Jiménez, A.B.; Omenat-Morán, D. Hydrothermal Carbonisation: An Eco-Friendly Method for the Production of Carbon Adsorbents. In Adsorption Processes for Water Treatment and Purification; Springer International Publishing: Cham, Switzerland, 2017; pp. 77–108. [Google Scholar]
  35. Kucharzyk, K.H.; Darlington, R.; Benotti, M.; Deeb, R.; Hawley, E. Novel treatment technologies for PFAS compounds: A critical review. J. Environ. Manag. 2017, 204, 757–764. [Google Scholar] [CrossRef] [PubMed]
  36. Lei, X.; Lian, Q.; Zhang, X.; Karsili, T.K.; Holmes, W.; Chen, Y.; Zappi, M.E.; Gang, D.D. A review of PFAS adsorption from aqueous solutions: Current approaches, engineering applications, challenges, and opportunities. Environ. Pollut. 2023, 321, 121138. [Google Scholar] [CrossRef] [PubMed]
  37. Zhang, D.Q.; Zhang, W.L.; Liang, Y.N. Adsorption of perfluoroalkyl and polyfluoroalkyl substances (PFASs) from aqueous solution—A review. Sci. Total Environ. 2019, 694, 133606. [Google Scholar] [CrossRef] [PubMed]
  38. Gagliano, E.; Sgroi, M.; Falciglia, P.P.; Vagliasindi, F.G.A.; Roccaro, P. Removal of poly- and perfluoroalkyl substances (PFAS) from water by adsorption: Role of PFAS chain length, effect of organic matter and challenges in adsorbent regeneration. Water Res. 2020, 171, 115381. [Google Scholar] [CrossRef]
  39. Zhang, K.; Sumita; Li, C.; Sun, C.; Marmier, N. A Review of the Treatment Process of Perfluorooctane Compounds in the Waters: Adsorption, Flocculation, and Advanced Oxidative Process. Water 2022, 14, 2692. [Google Scholar] [CrossRef]
  40. Son, H.; Kim, T.; Yoom, H.-S.; Zhao, D.; An, B. The Adsorption Selectivity of Short and Long Per- and Polyfluoroalkyl Substances (PFASs) from Surface Water Using Powder-Activated Carbon. Water 2020, 12, 3287. [Google Scholar] [CrossRef]
  41. Chen, R.; Huang, X.; Li, G.; Yu, Y.; Shi, B. Performance of in-service granular activated carbon for perfluoroalkyl substances removal under changing water quality conditions. Sci. Total Environ. 2022, 848, 157723. [Google Scholar] [CrossRef]
  42. Du, Z.; Deng, S.; Bei, Y.; Huang, Q.; Wang, B.; Huang, J.; Yu, G. Adsorption behavior and mechanism of perfluorinated compounds on various adsorbents-A review. J. Hazard. Mater. 2014, 274, 443–454. [Google Scholar] [CrossRef]
  43. Brunauer, S.; Emmett, P.H.; Teller, E. Adsorption of Gases in Multimolecular Layers. J. Am. Chem. Soc. 1938, 60, 309–319. [Google Scholar] [CrossRef]
  44. Valente Nabais, J.M.; Carrott, P.J.M. Chemical Characterization of Activated Carbon Fibers and Activated Carbons. J. Chem. Educ. 2006, 83, 436. [Google Scholar] [CrossRef]
  45. Thommes, M.; Kaneko, K.; Neimark, A.V.; Olivier, J.P.; Rodriguez-Reinoso, F.; Rouquerol, J.; Sing, K.S.W. Physisorption of gases, with special reference to the evaluation of surface area and pore size distribution (IUPAC Technical Report). Pure Appl. Chem. 2015, 87, 1051–1069. [Google Scholar] [CrossRef]
  46. Bläker, C.; Muthmann, J.; Pasel, C.; Bathen, D. Characterization of Activated Carbon Adsorbents—State of the Art and Novel Approaches. ChemBioEng Rev. 2019, 6, 119–138. [Google Scholar] [CrossRef]
  47. Lastoskie, C.; Gubbins, K.E.; Quirke, N. Pore size distribution analysis of microporous carbons: A density functional theory approach. J. Phys. Chem. 1993, 97, 4786–4796. [Google Scholar] [CrossRef]
  48. Dubinin, M.M.; Radushkevich, L.V. The Equation of the Characteristic Curve of Activated Charcoal. Proc. USSR Acad. Sci. 1947, 55, 331. [Google Scholar]
  49. Dubinin, M.M. The Potential Theory of Adsorption of Gases and Vapors for Adsorbents with Energetically Nonuniform Surfaces. Chem. Rev. 1960, 60, 235–241. [Google Scholar] [CrossRef]
  50. Ţucureanu, V.; Matei, A.; Avram, A.M. FTIR Spectroscopy for Carbon Family Study. Crit. Rev. Anal. Chem. 2016, 46, 502–520. [Google Scholar] [CrossRef]
  51. Chen, X.; Xia, X.; Wang, X.; Qiao, J.; Chen, H. A comparative study on sorption of perfluorooctane sulfonate (PFOS) by chars, ash and carbon nanotubes. Chemosphere 2011, 83, 1313–1319. [Google Scholar] [CrossRef] [PubMed]
  52. Yu, Q.; Zhang, R.; Deng, S.; Huang, J.; Yu, G. Sorption of perfluorooctane sulfonate and perfluorooctanoate on activated carbons and resin: Kinetic and isotherm study. Water Res. 2009, 43, 1150–1158. [Google Scholar] [CrossRef]
  53. Gao, Y.; Deng, S.; Du, Z.; Liu, K.; Yu, G. Adsorptive removal of emerging polyfluoroalky substances F-53B and PFOS by anion-exchange resin: A comparative study. J. Hazard. Mater. 2017, 323, 550–557. [Google Scholar] [CrossRef]
  54. Pan, G.; Jia, C.; Zhao, D.; You, C.; Chen, H.; Jiang, G. Effect of cationic and anionic surfactants on the sorption and desorption of perfluorooctane sulfonate (PFOS) on natural sediments. Environ. Pollut. 2009, 157, 325–330. [Google Scholar] [CrossRef]
Figure 1. Structural formula of sodium perfluorooctanoate.
Carbon 09 00057 g001
Figure 2. Isotherms of N2 adsorption at 77 K.
Carbon 09 00057 g002
Figure 3. Distribution of porosity of the hydrothermal carbons.
Carbon 09 00057 g003
Figure 4. Cumulative pore volume of the hydrothermal carbons.
Carbon 09 00057 g004
Figure 5. Pore width distribution of the hydrothermal carbons.
Carbon 09 00057 g005
Figure 6. Fourier-transform infrared spectra of the hydrothermal carbons.
Carbon 09 00057 g006
Figure 7. SEM image of HC-A.
Carbon 09 00057 g007
Figure 8. SEM image of HC-B.
Carbon 09 00057 g008
Figure 9. SEM image of HC-C.
Carbon 09 00057 g009
Figure 10. SEM image of raw chestnut cupule.
Carbon 09 00057 g010
Figure 11. Thermograms of the hydrothermal carbons.
Carbon 09 00057 g011
Figure 12. Plot for pseudo-second-order kinetics.
Carbon 09 00057 g012
Figure 13. Adsorption isotherm for PFONa onto HC-C.
Carbon 09 00057 g013
Table 1. Operating conditions for the preparation of hydrothermal carbons.
CarbonRaw MaterialOven Temperature
Particle Size (mm)Mass (g)(°C)
HC-A<0.515180
HC-B0.5–15200
HC-C1–215200
Table 2. Mobile phase composition.
t, minA, %B, %
08020
9496
100100
110100
128020
158020
Table 3. Porosity and specific surface area of carbons.
MaterialBET 1DR 2PorosimetryDFT 3
S, m2 g−1Vmicro, cm3 g−1Vmeso, cm3 g−1S, m2 g−1Vtotal, cm3 g−1
HC-A42.30.0070.07827.680.085
HC-B53.20.0070.06139.130.122
1 Brunauer, Emmett, and Teller model [43]. 2 Dubinin and Radushkevich model [48,49]. 3 Density Functional Theory [47].
Table 4. Point of zero charge of the carbons.
MaterialPZC
HC-A4.0
HC-B3.8
HC-C4.8
Table 5. Elemental analyses of the hydrothermal carbons.
SampleC, %H, %N, %S, %O, %Ash, %
HC-A57.506.560.530.0535.310.05
HC-B61.705.930.580.0531.550.19
HC-C63.705.891.060.0528.460.84
Table 6. EDX analyses of the hydrothermal carbons.
Raw MaterialHC-AHC-BHC-C
C54.269.672.572.0
O43.630.027.426.9
Mg0.10.00.00.0
Al0.10.10.00.0
Si0.20.10.00.0
P0.10.00.00.2
K1.00.00.10.2
Ca0.70.10.00.5
Fe0.10.00.00.0
S0.00.10.10.1
Table 7. Adsorption kinetics results for HC-C.
TimePFONa 1
(h)Excess (mg/L)Adsorbed (mg/L)Adsorbed (%)
21613919
41594121
241564422
481505025
721495126
961495126
1 Average value of duplicate runs.
Table 8. Data for the pseudo-second-order kinetic model.
Time, t (h)t/qt (h·g·mg−1)
00
22.5907 × 10−03
44.8603 × 10−03
242.7027 × 10−02
484.7619 × 10−02
727.1146 × 10−02
969.3842 × 10−02
Table 9. Adsorption isotherm results for HC-C 1.
c0 (mg/L)ce (mg/L)qe (mg/g)
4036.63.40
7061.18.95
10081.518.55
130103.226.80
165126.638.40
200148.951.15
1 Time = 96 h.
Table 10. Data points for the Freundlich model.
ExperimentLog(ce)Log(qe)
11.5634810.531479
21.7856860.951823
31.9108911.268344
42.0136801.428135
52.1024341.584331
62.1727491.708846
Disclaimer/Publisher’s Note: The statements, opinions and data contained in all publications are solely those of the individual author(s) and contributor(s) and not of MDPI and/or the editor(s). MDPI and/or the editor(s) disclaim responsibility for any injury to people or property resulting from any ideas, methods, instructions or products referred to in the content.

