
Simultaneous Electrochemical Sensing of Dopamine, Ascorbic Acid, and Uric Acid Using Nitrogen-Doped Graphene Sheet-Modified Glassy Carbon Electrode

Abstract
:1. Introduction
2. Experimental
2.1. Instruments and Chemicals
2.2. Synthesis of N-GSs
2.3. Preparation of the N-GSs/GCE Sensor
3. Results and discussion
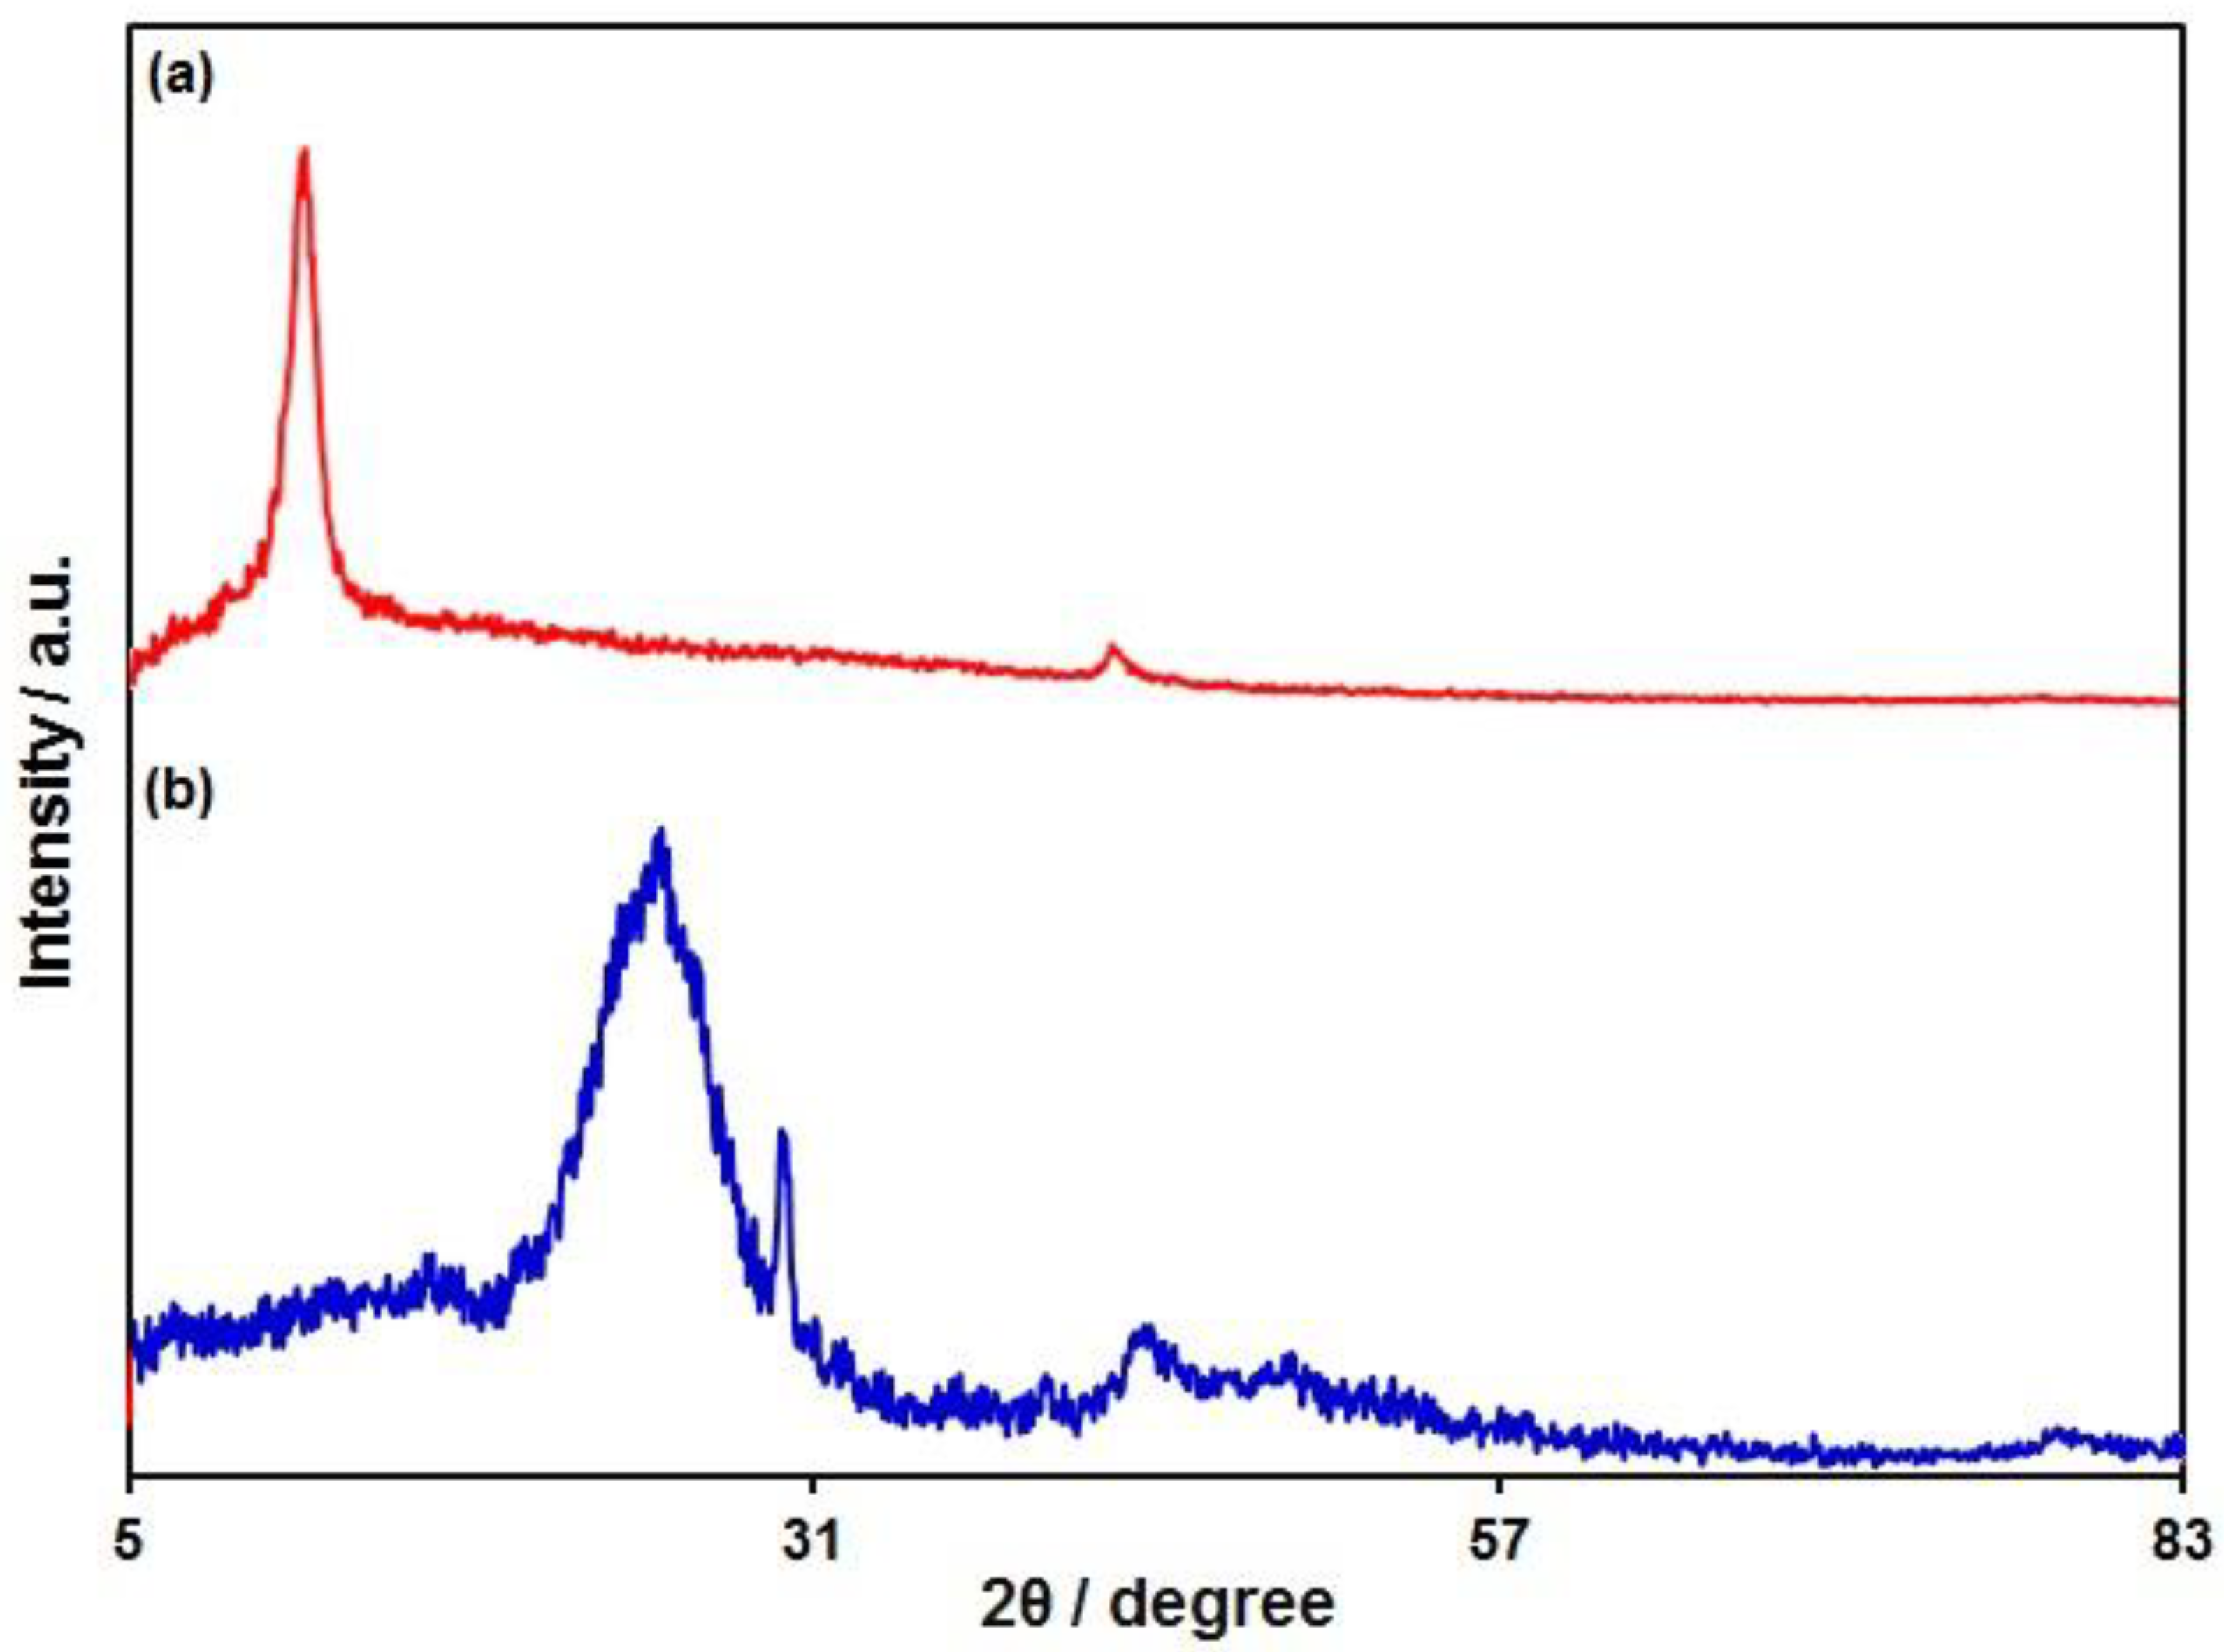
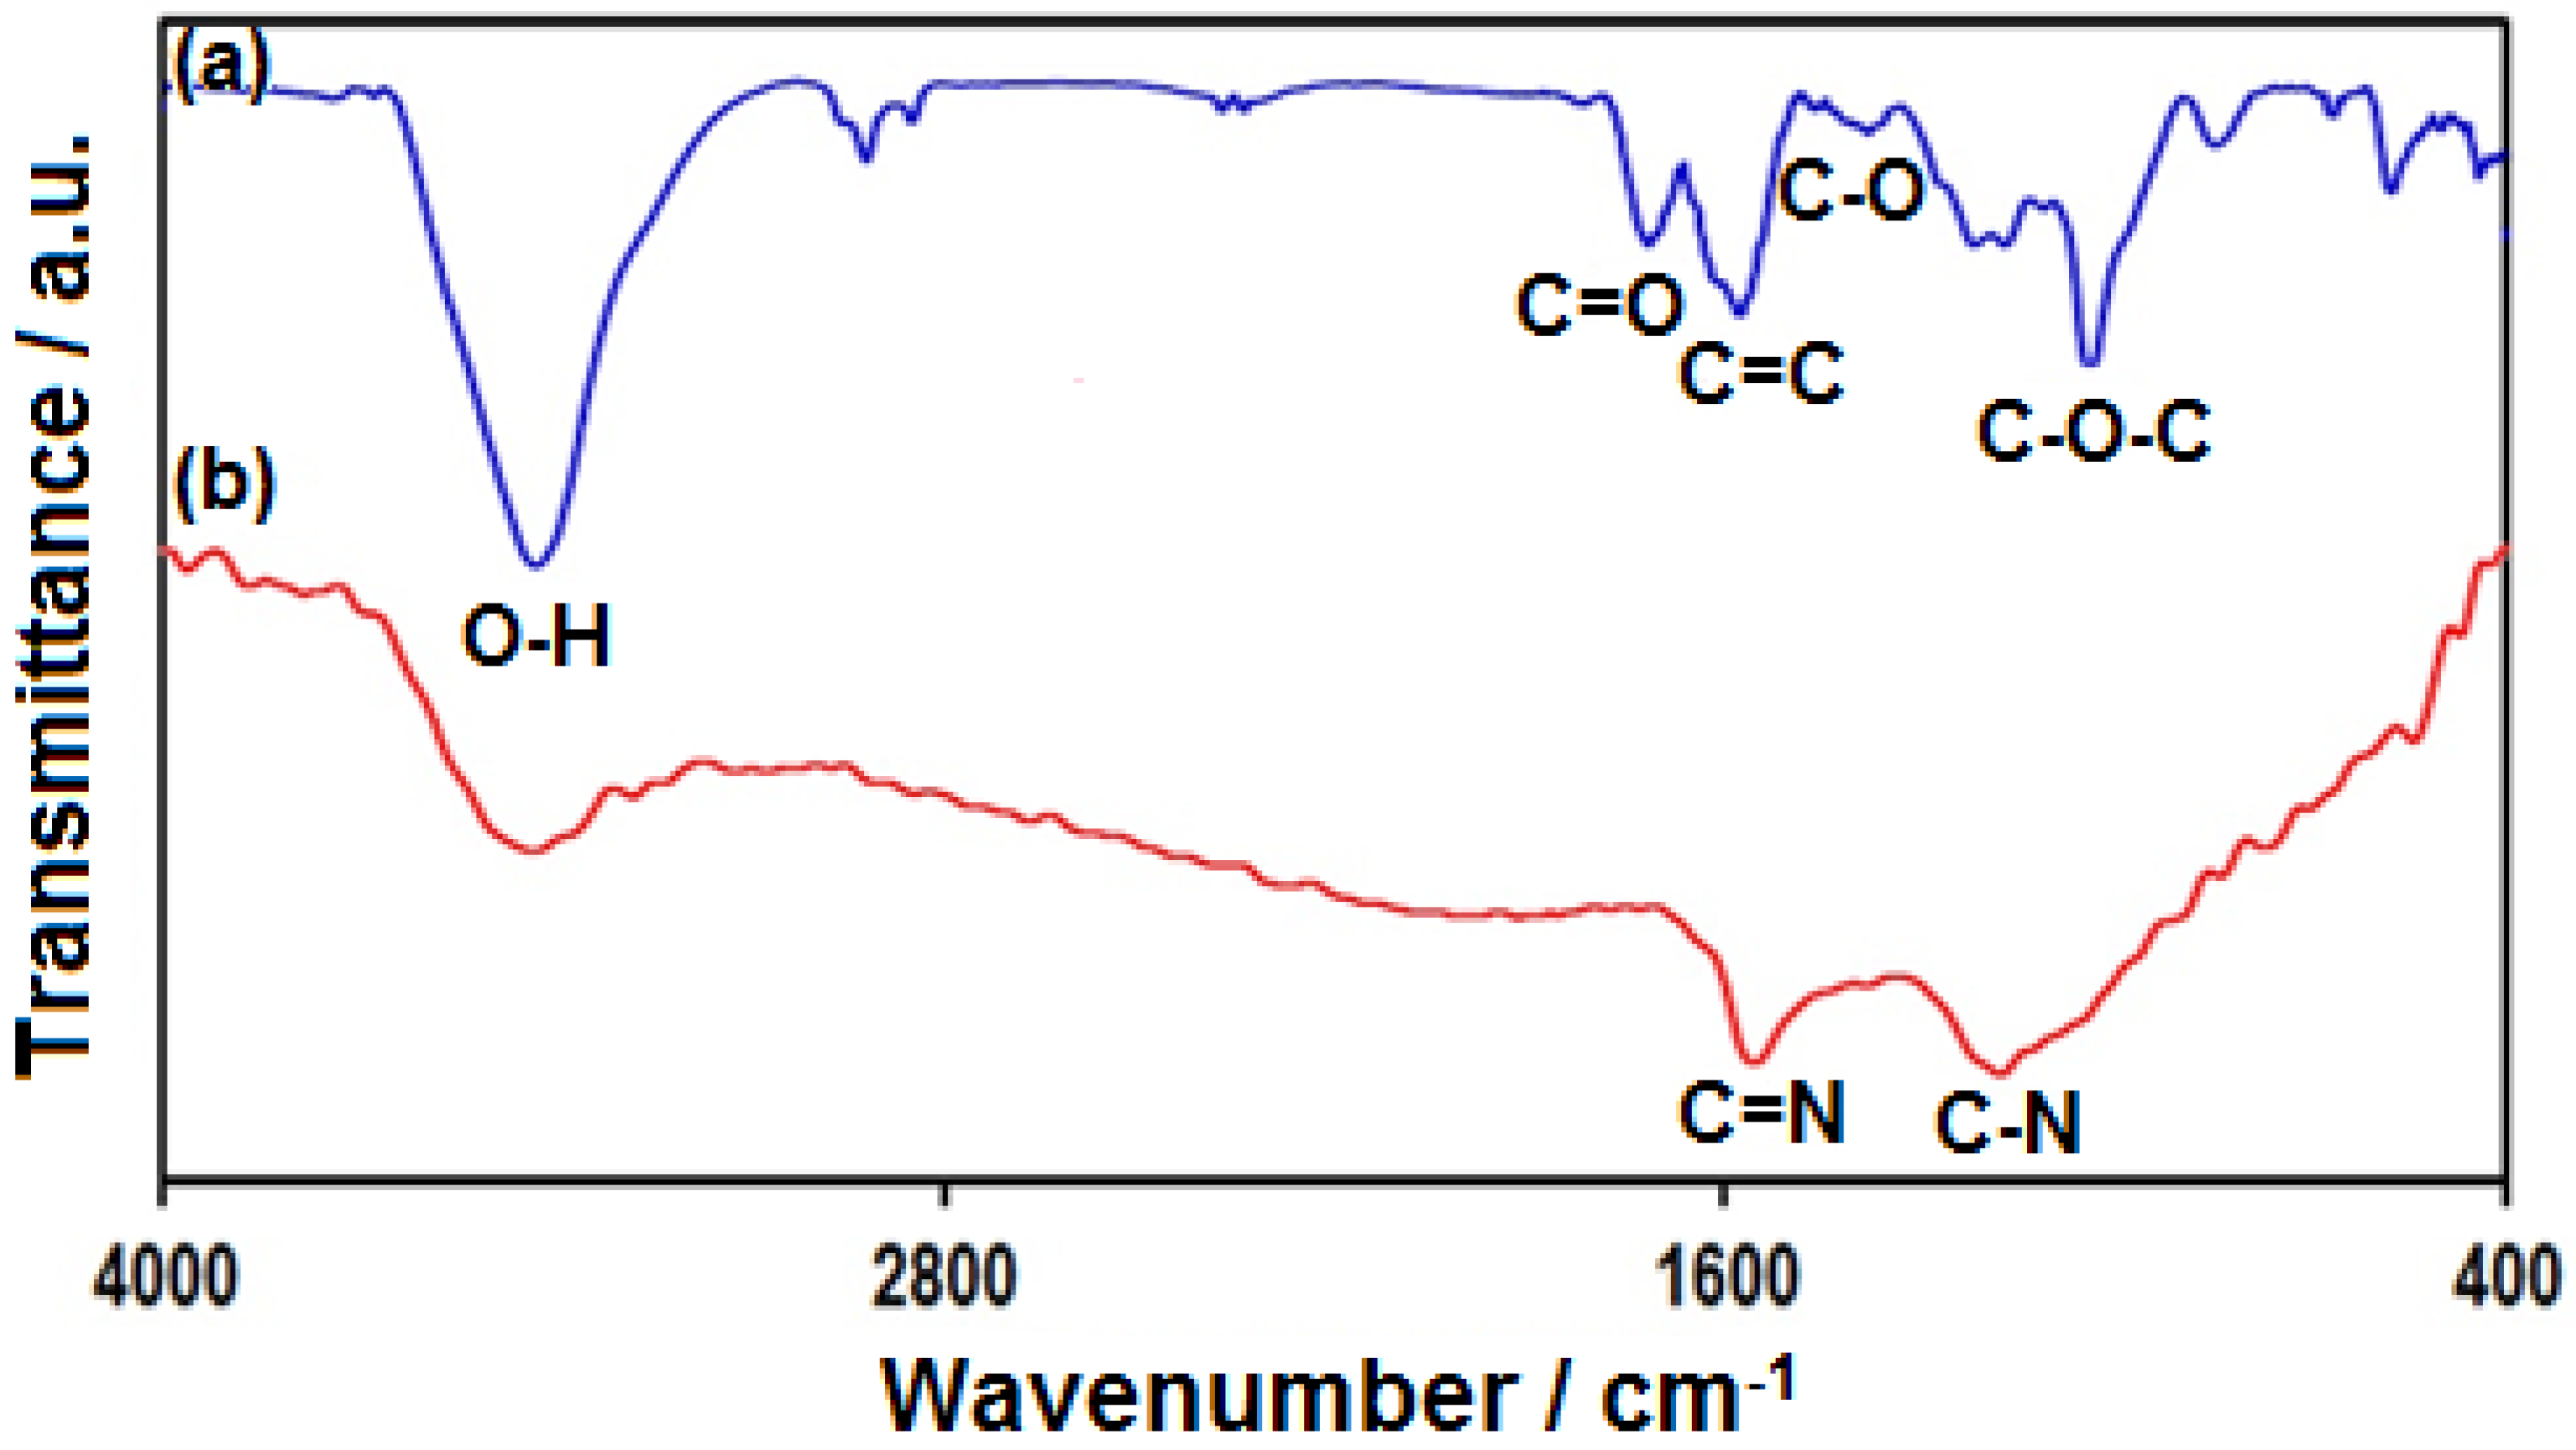
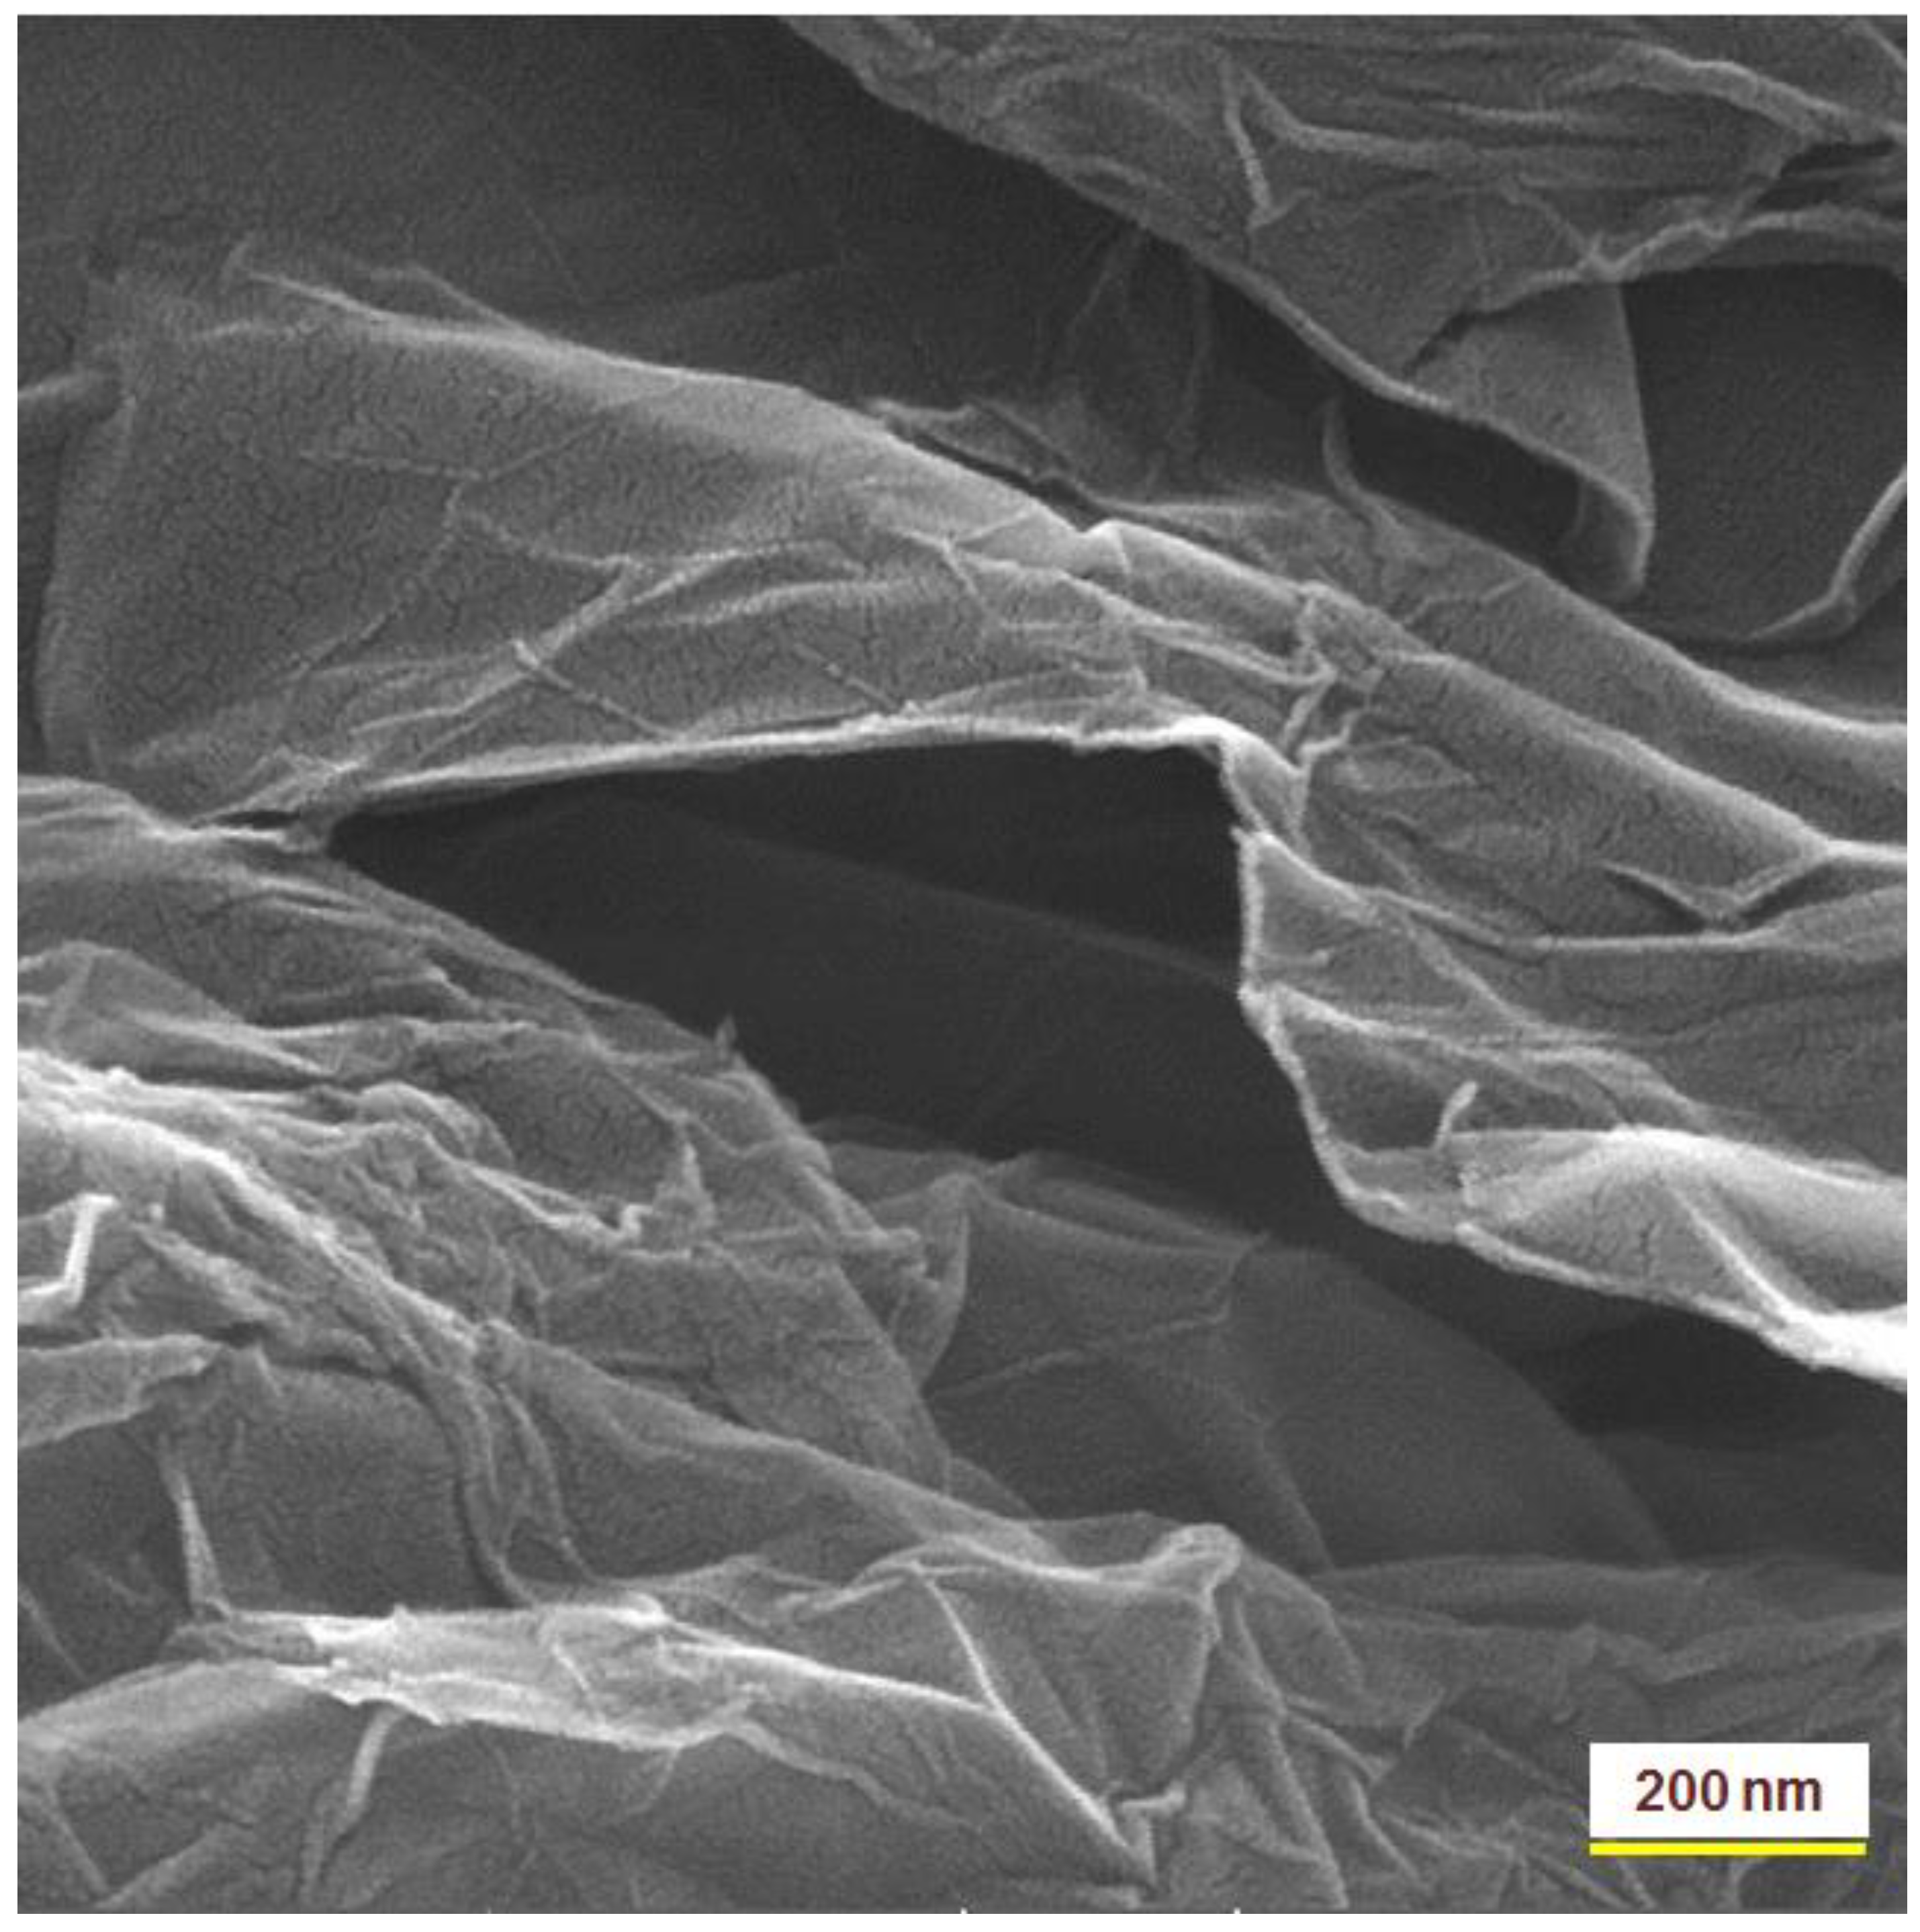
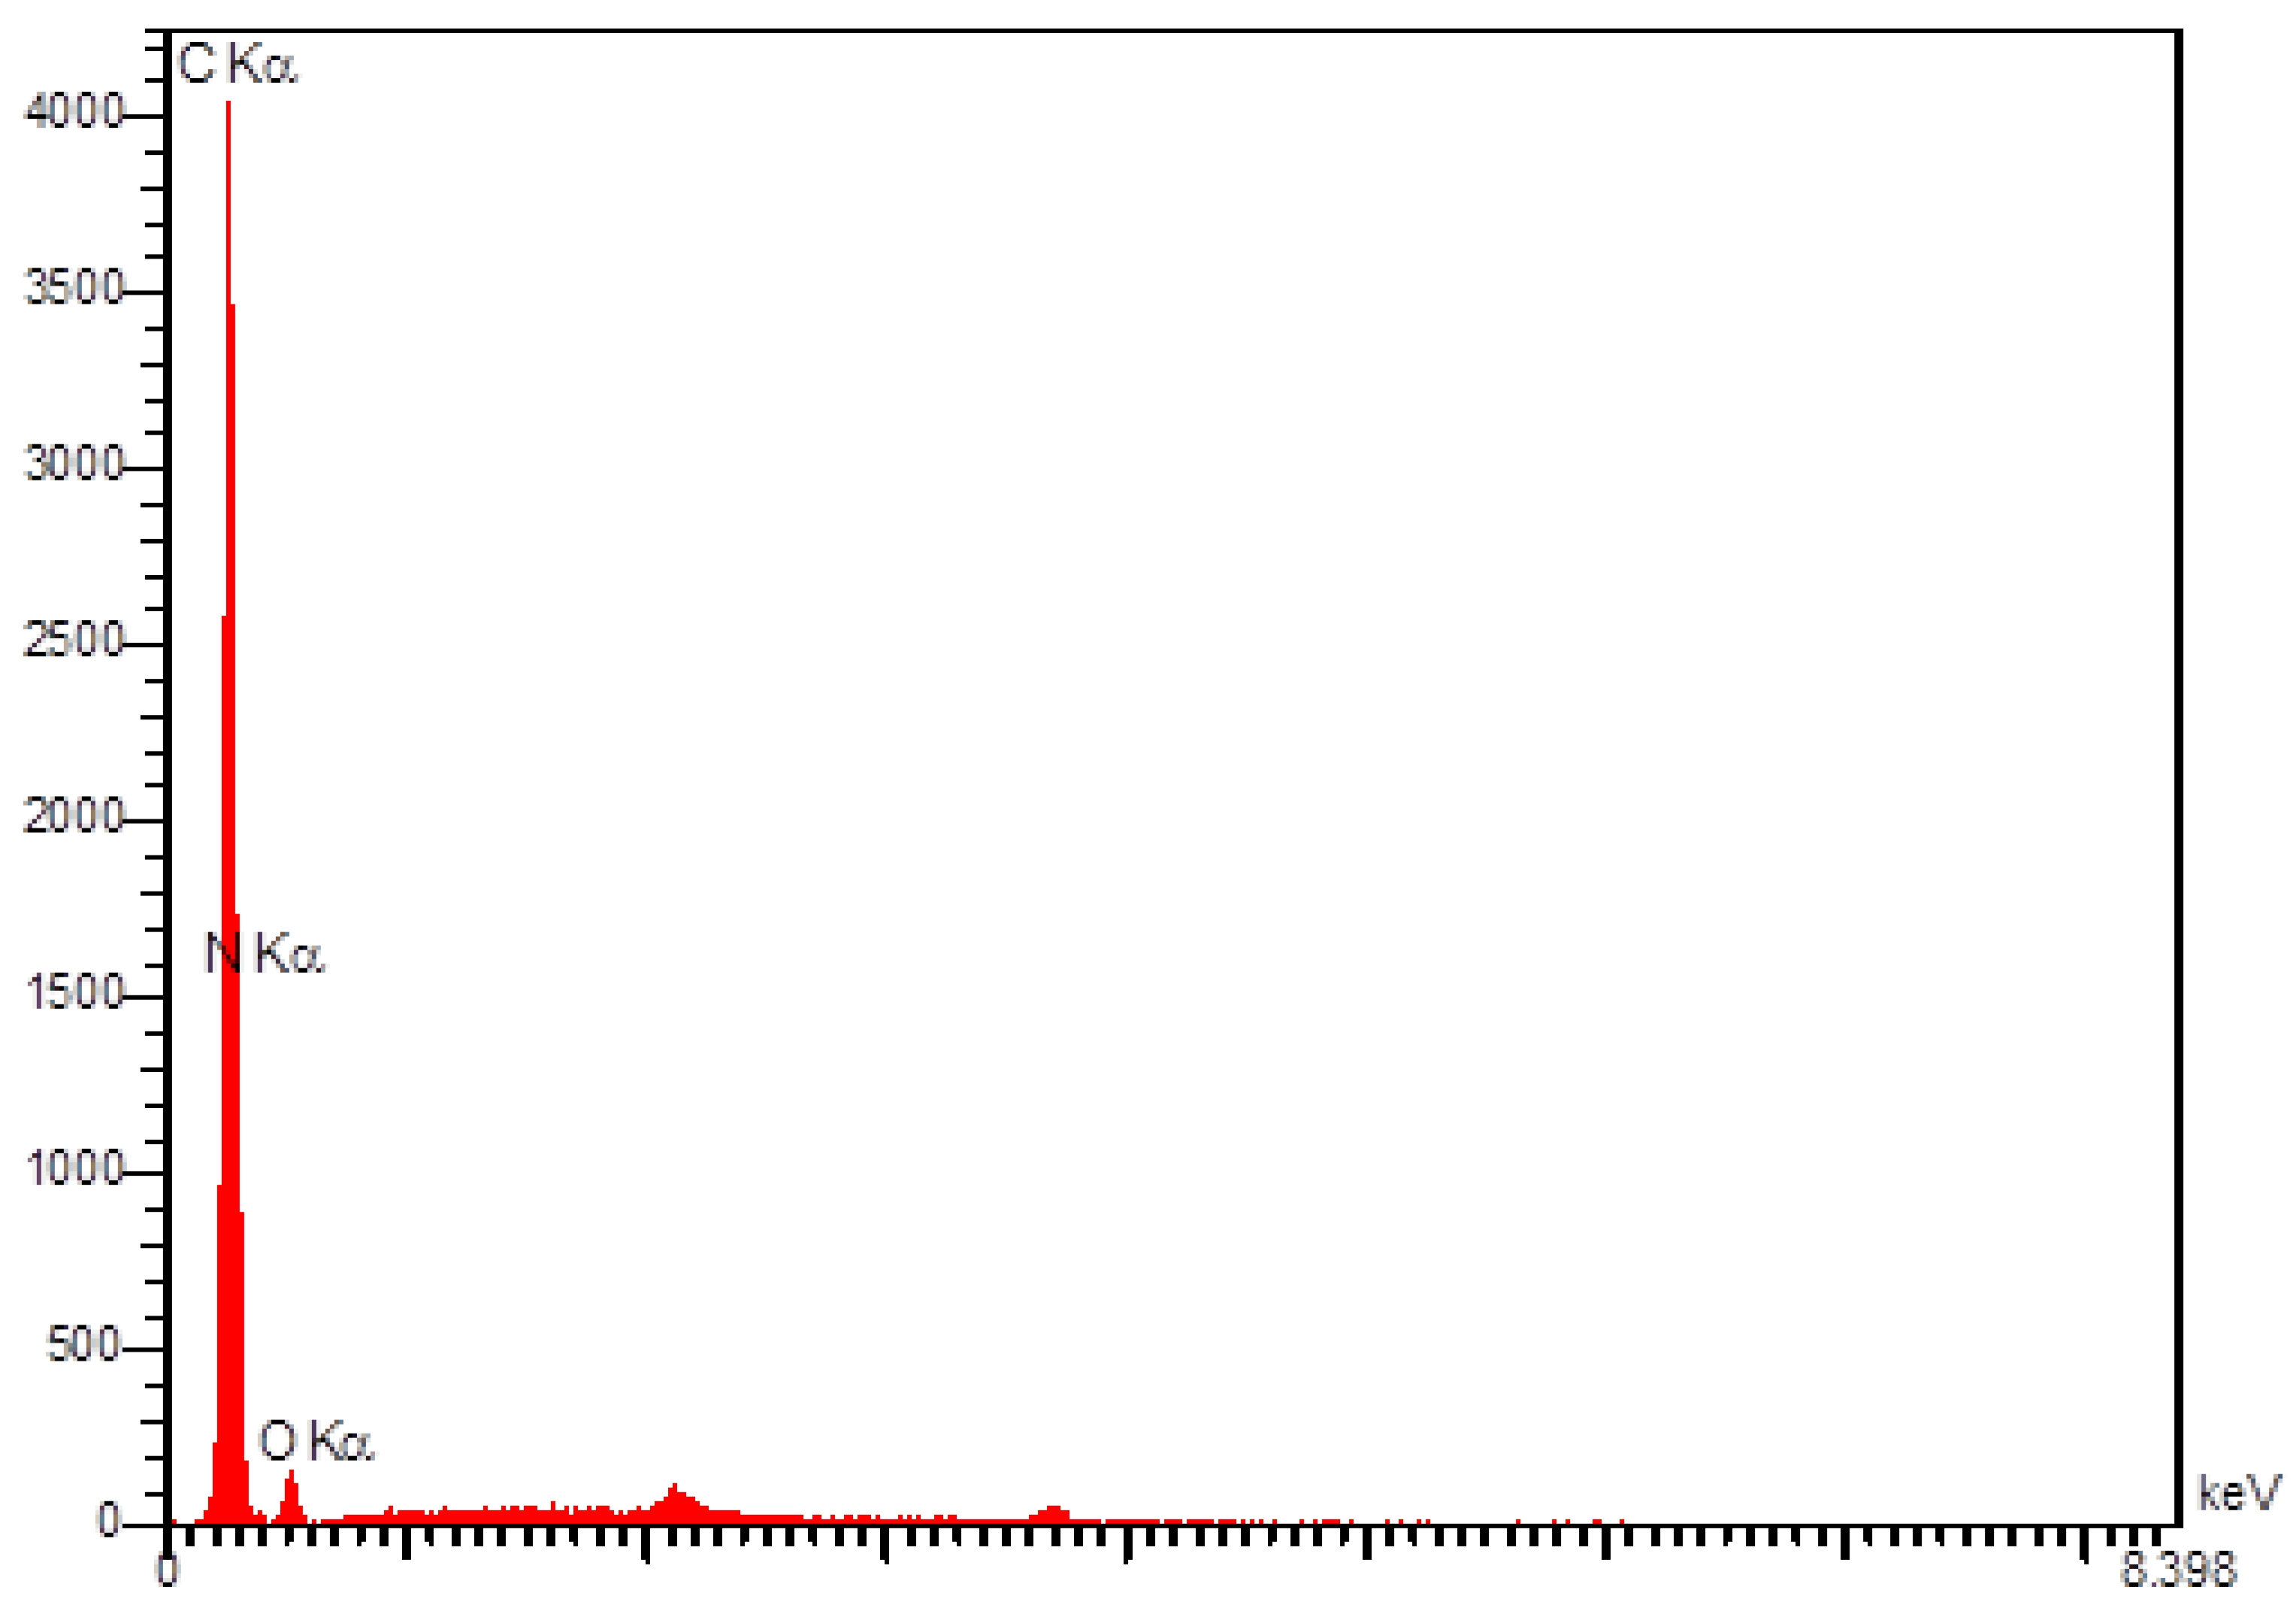
3.1. Characterization of N-GSs
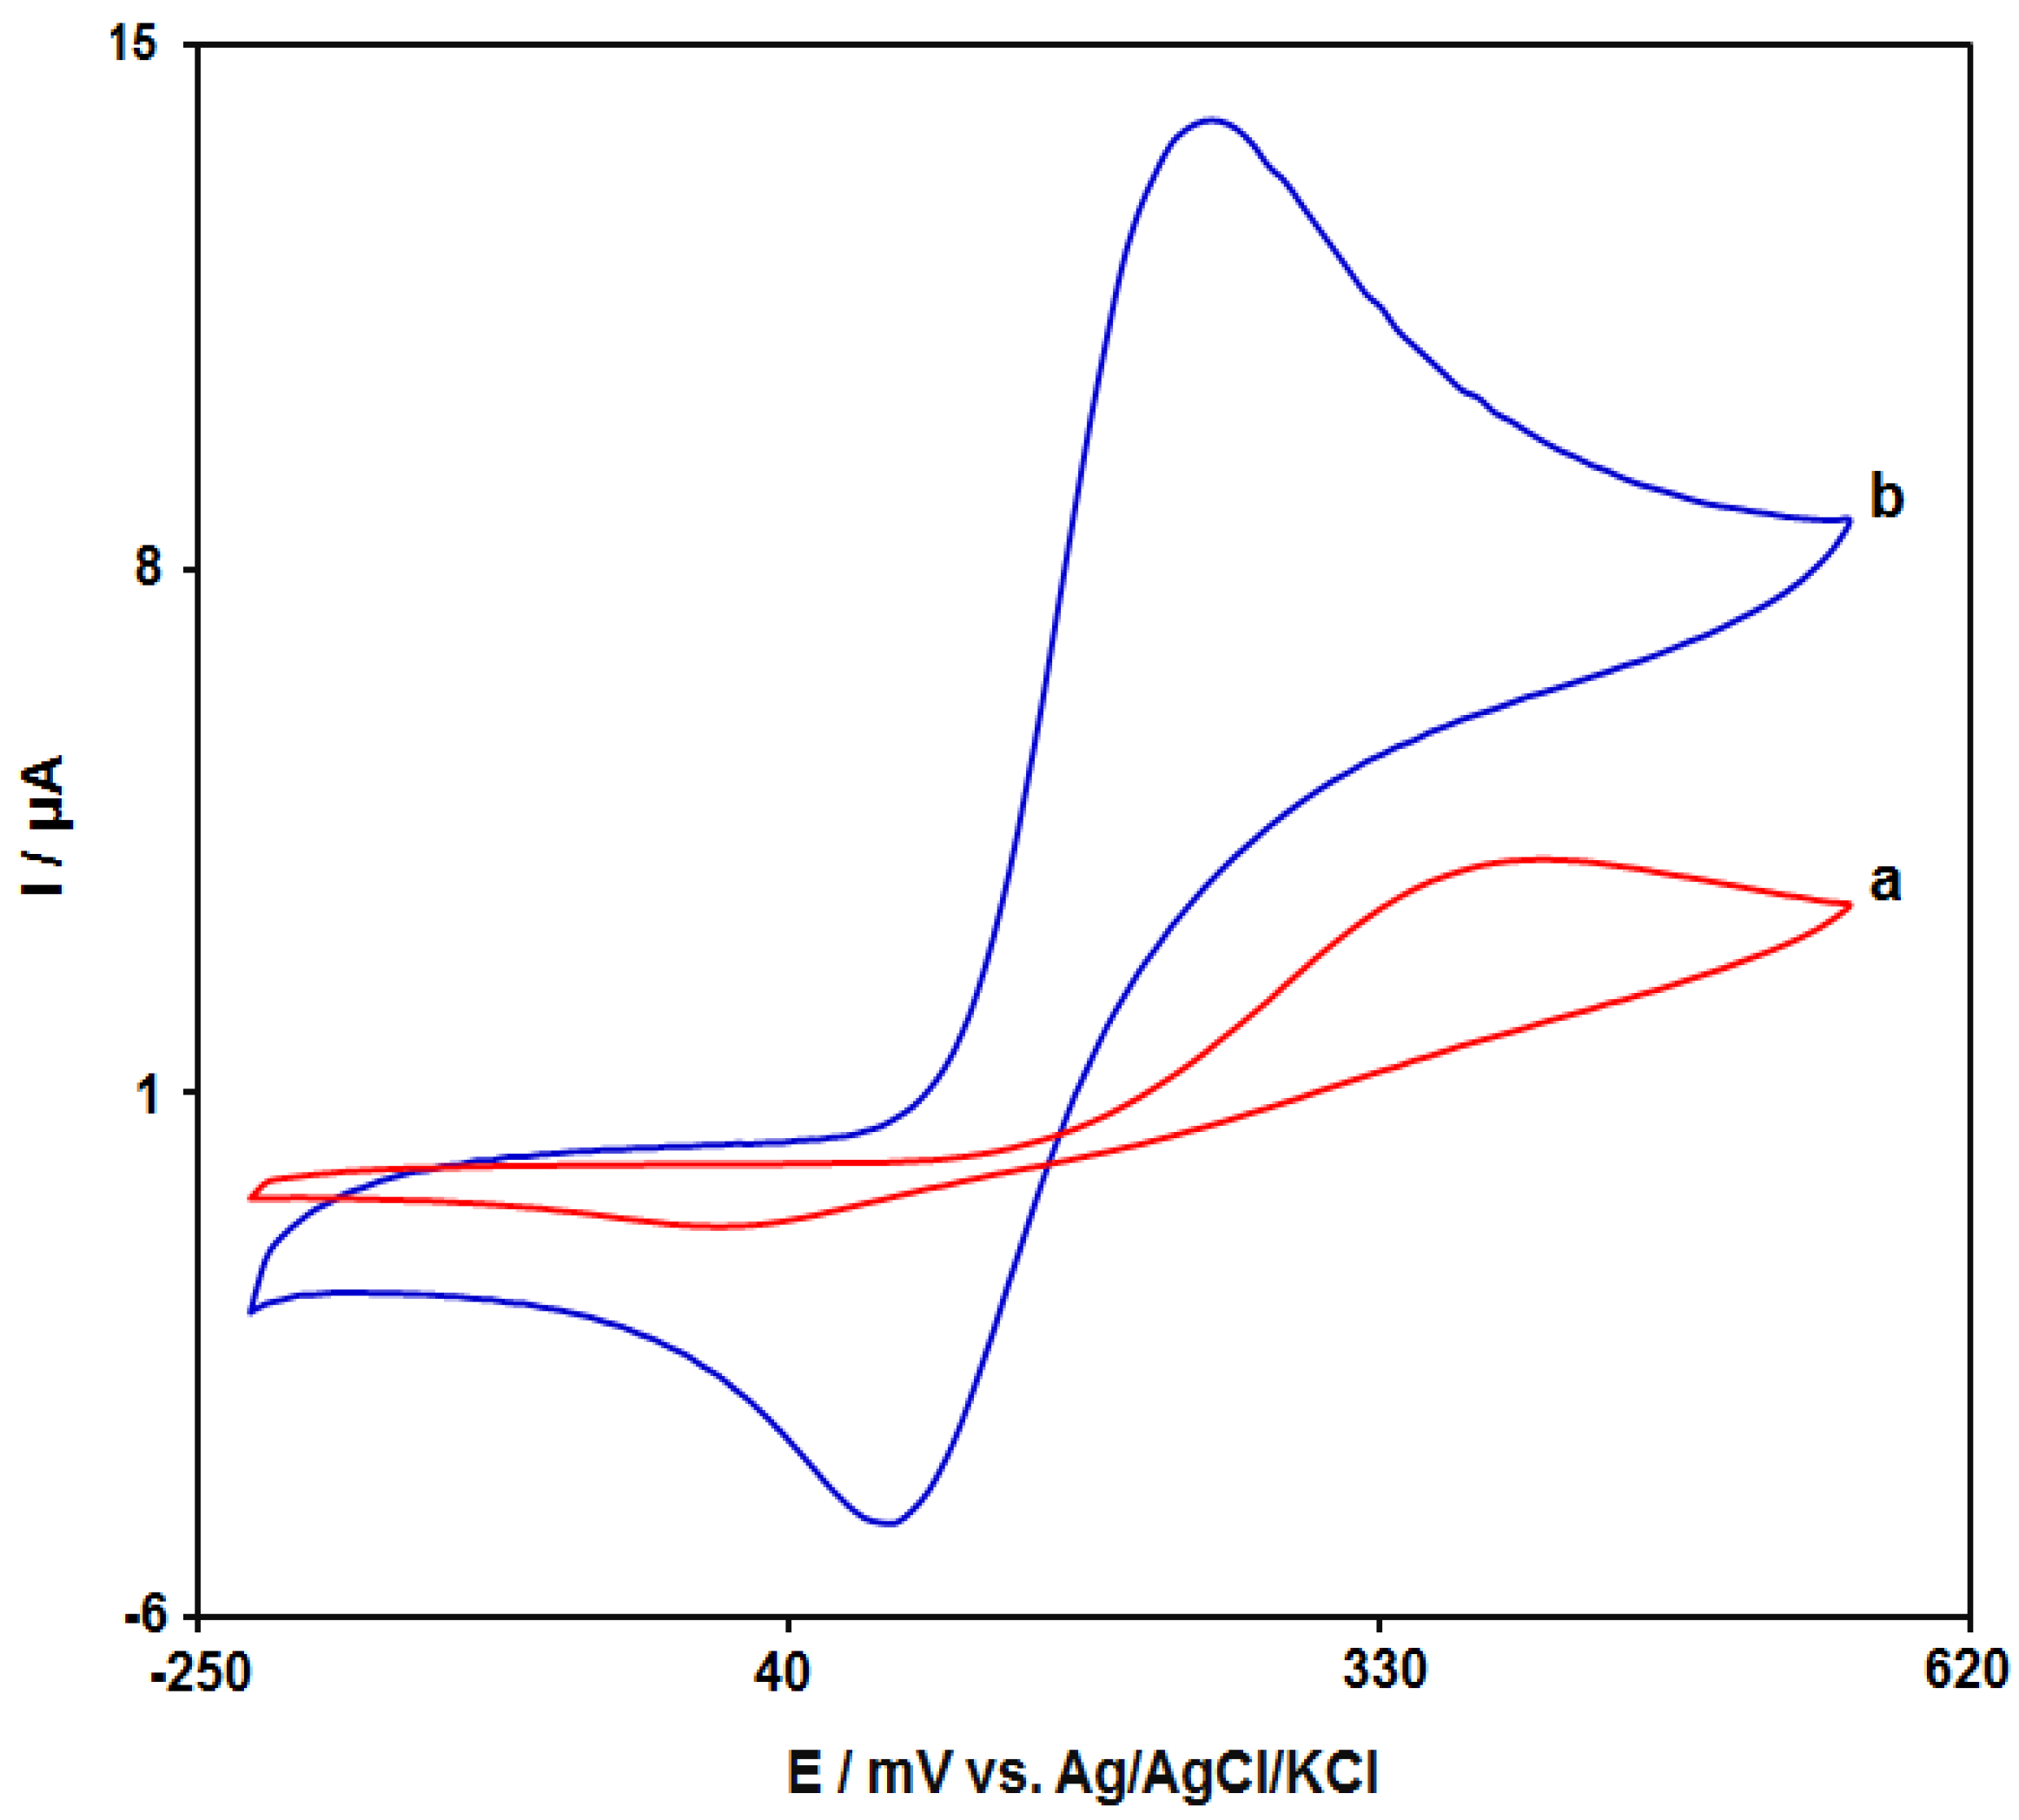
3.2. Electrochemical Response of DA at the Various Electrodes Surfaces
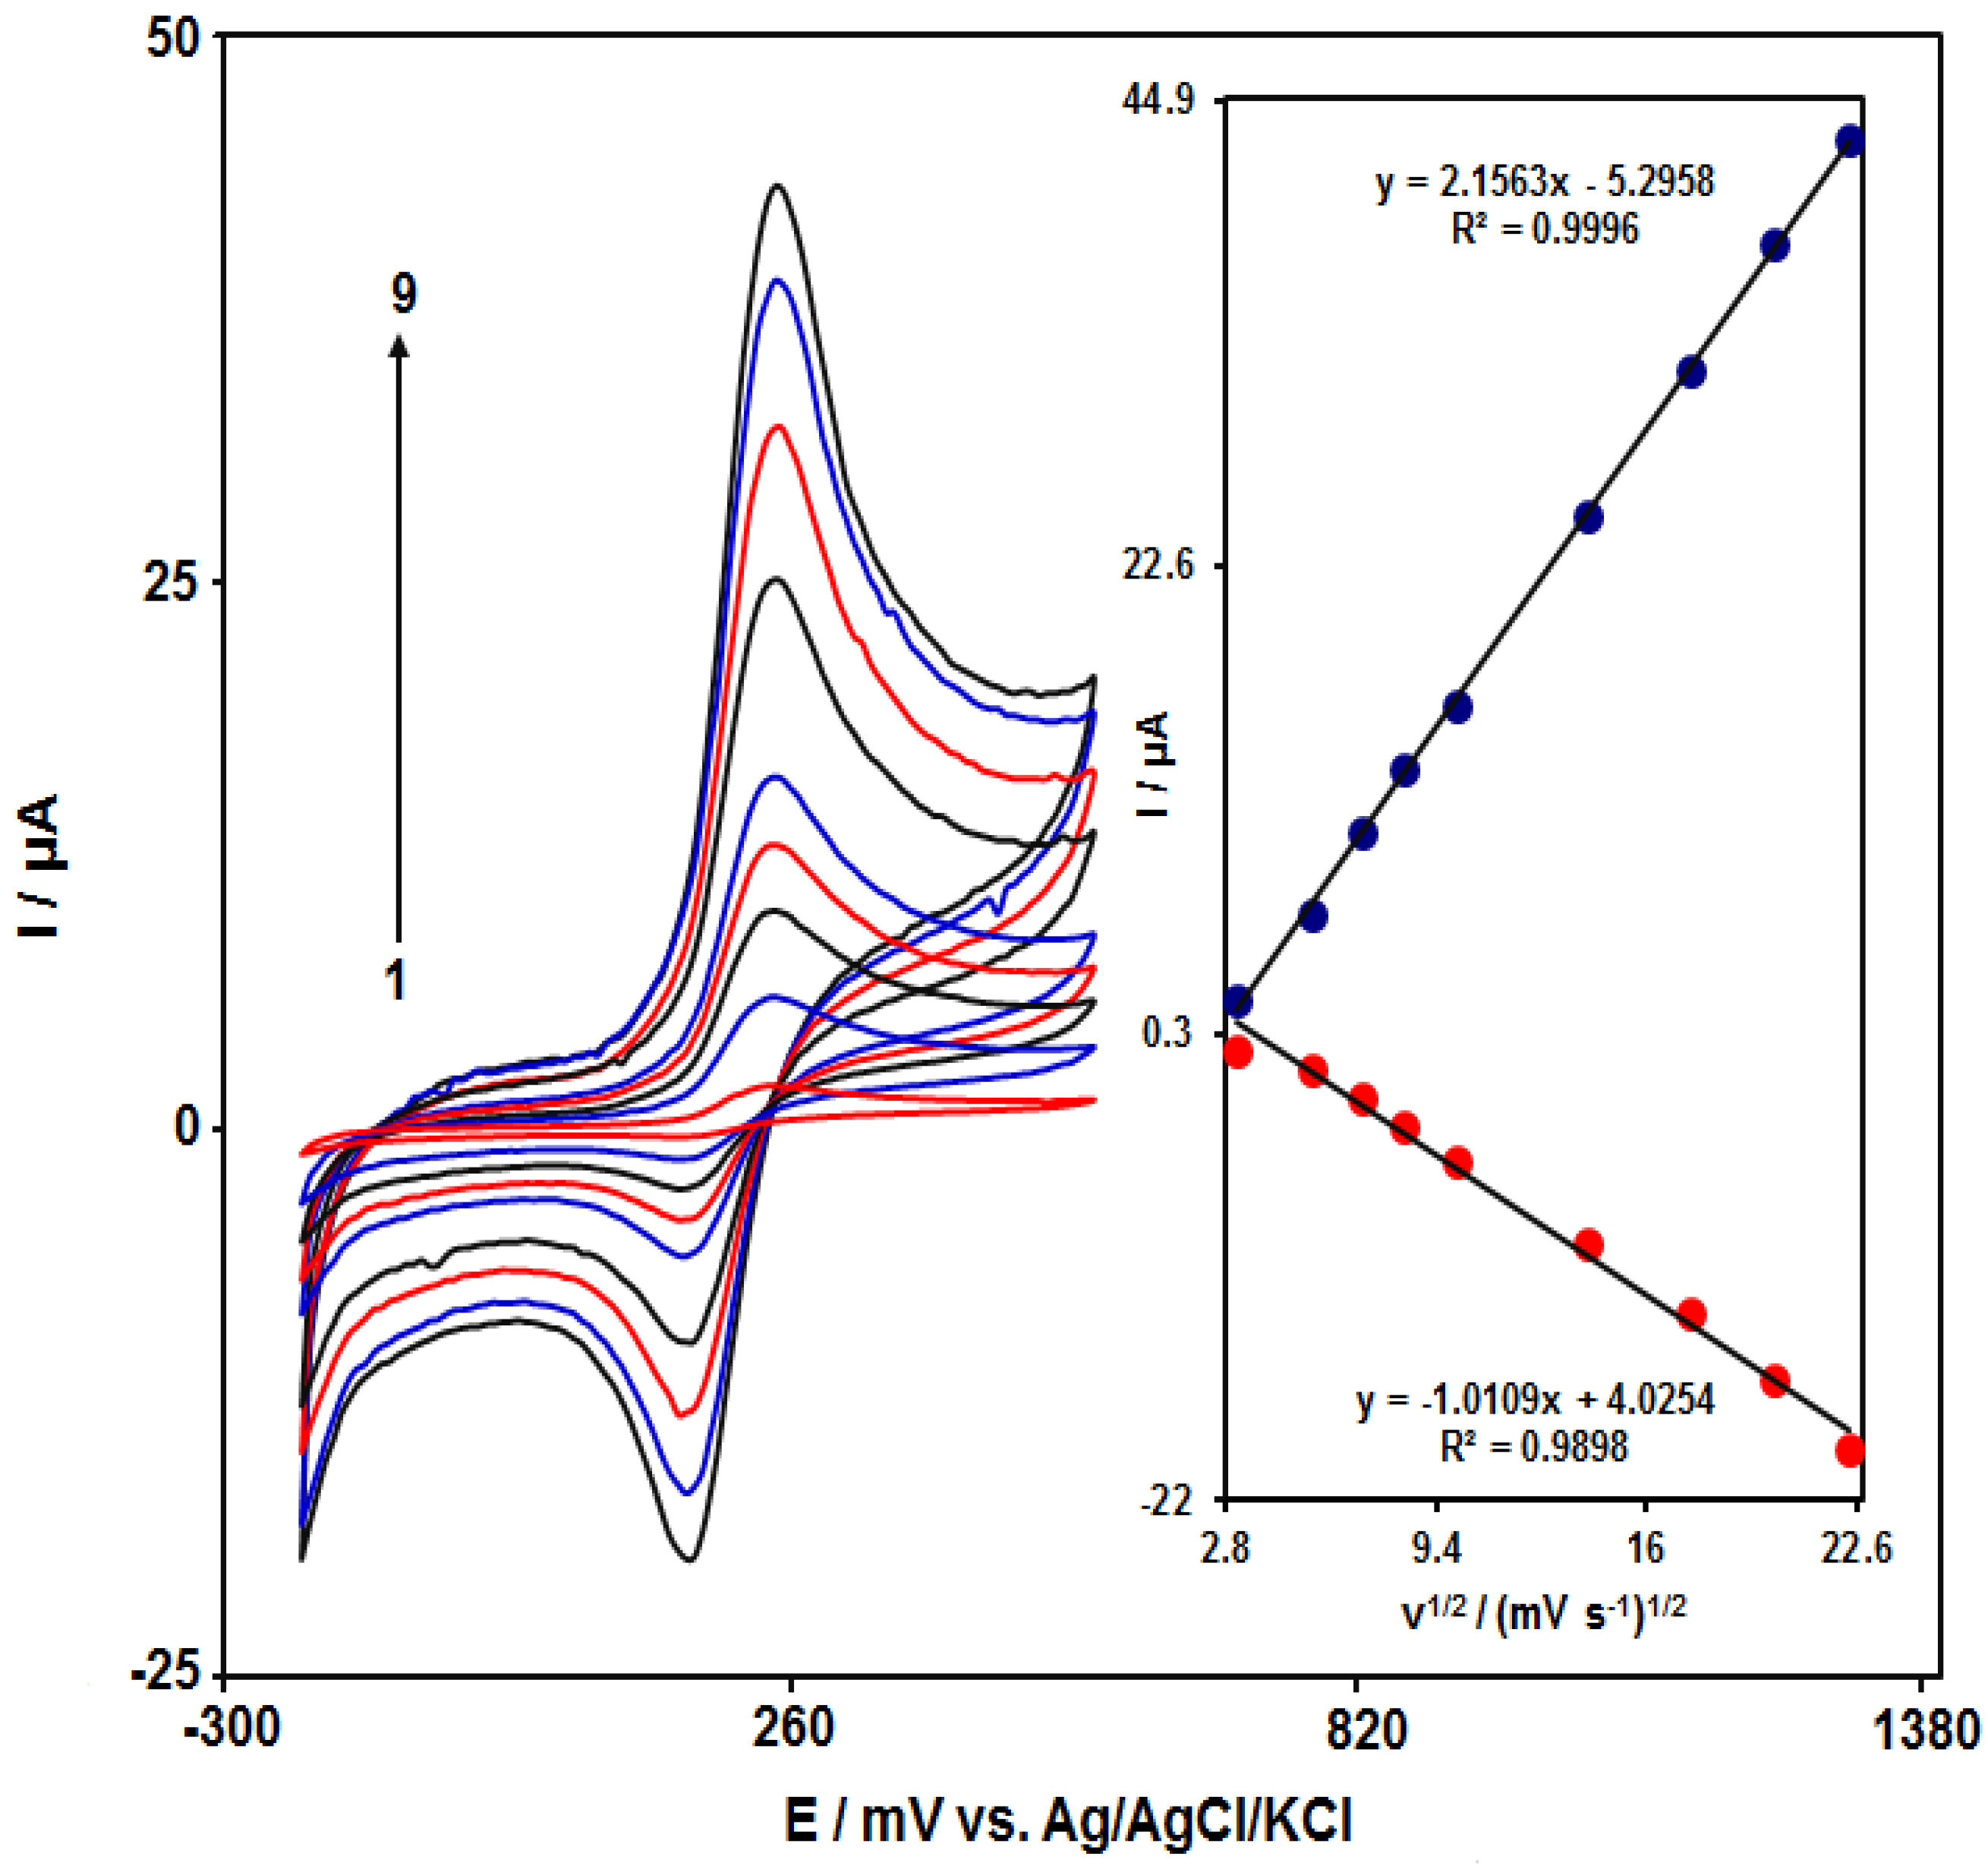
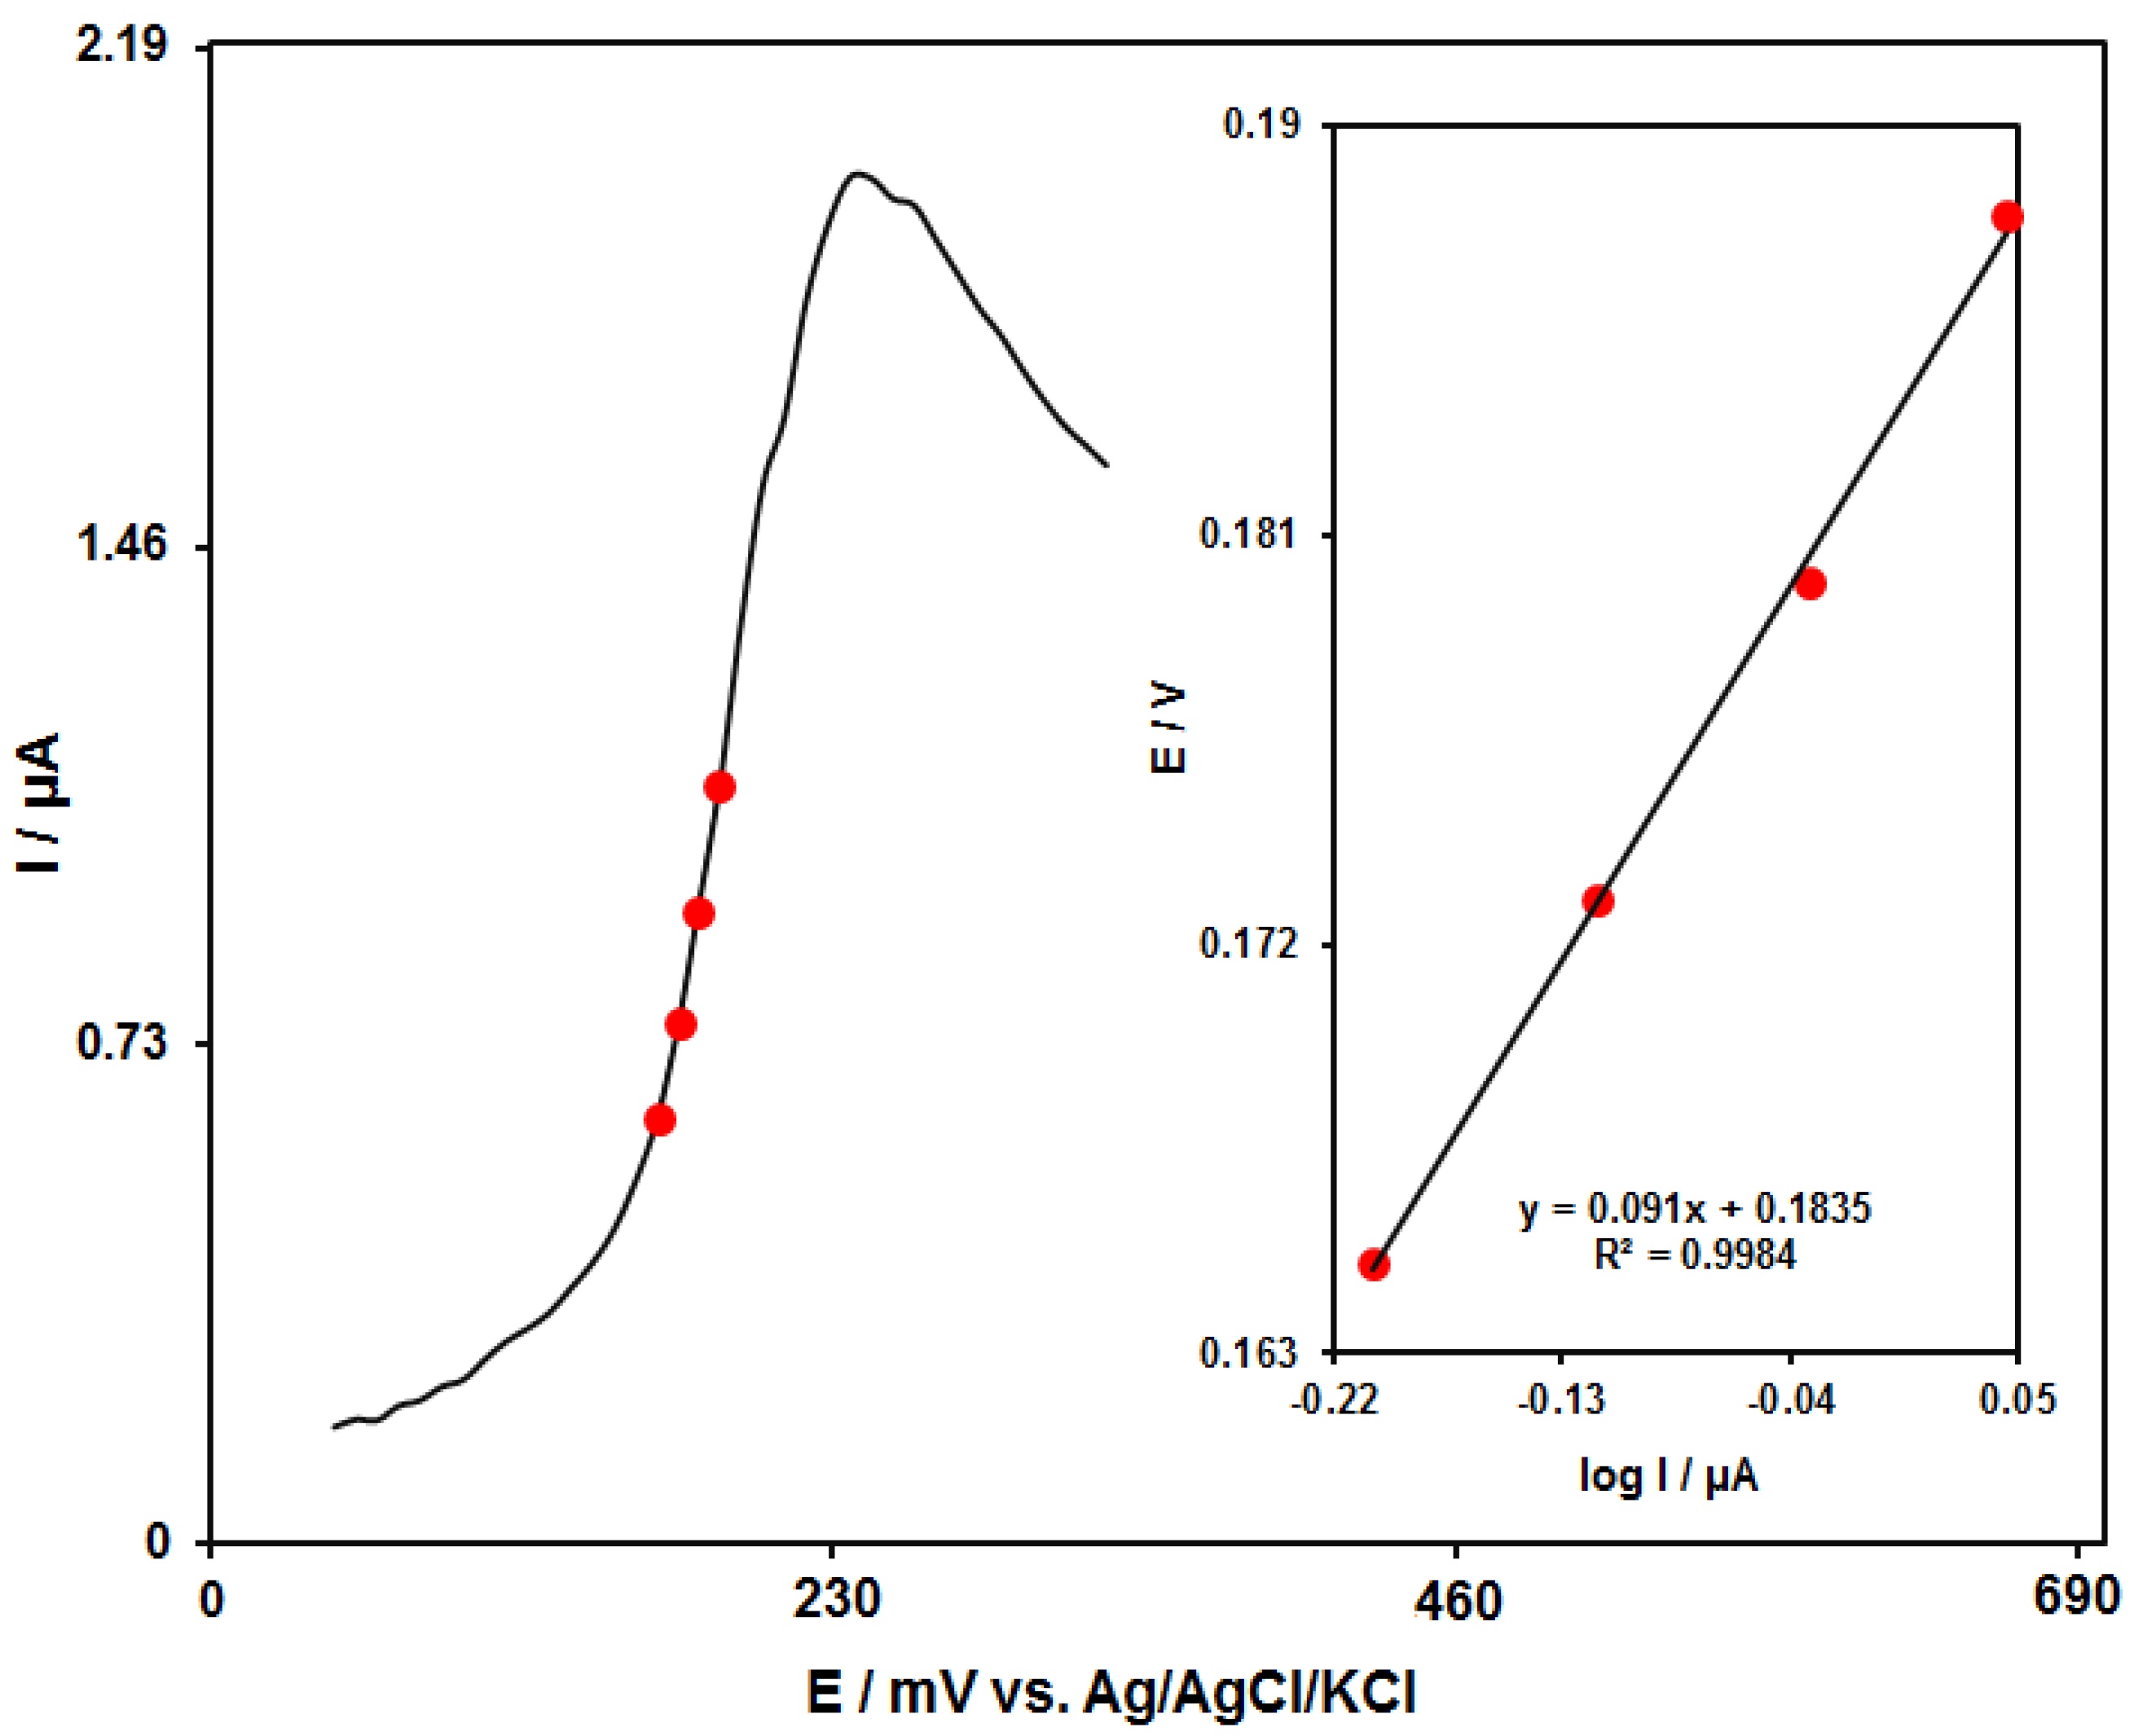
3.3. Effect of Scan Rate
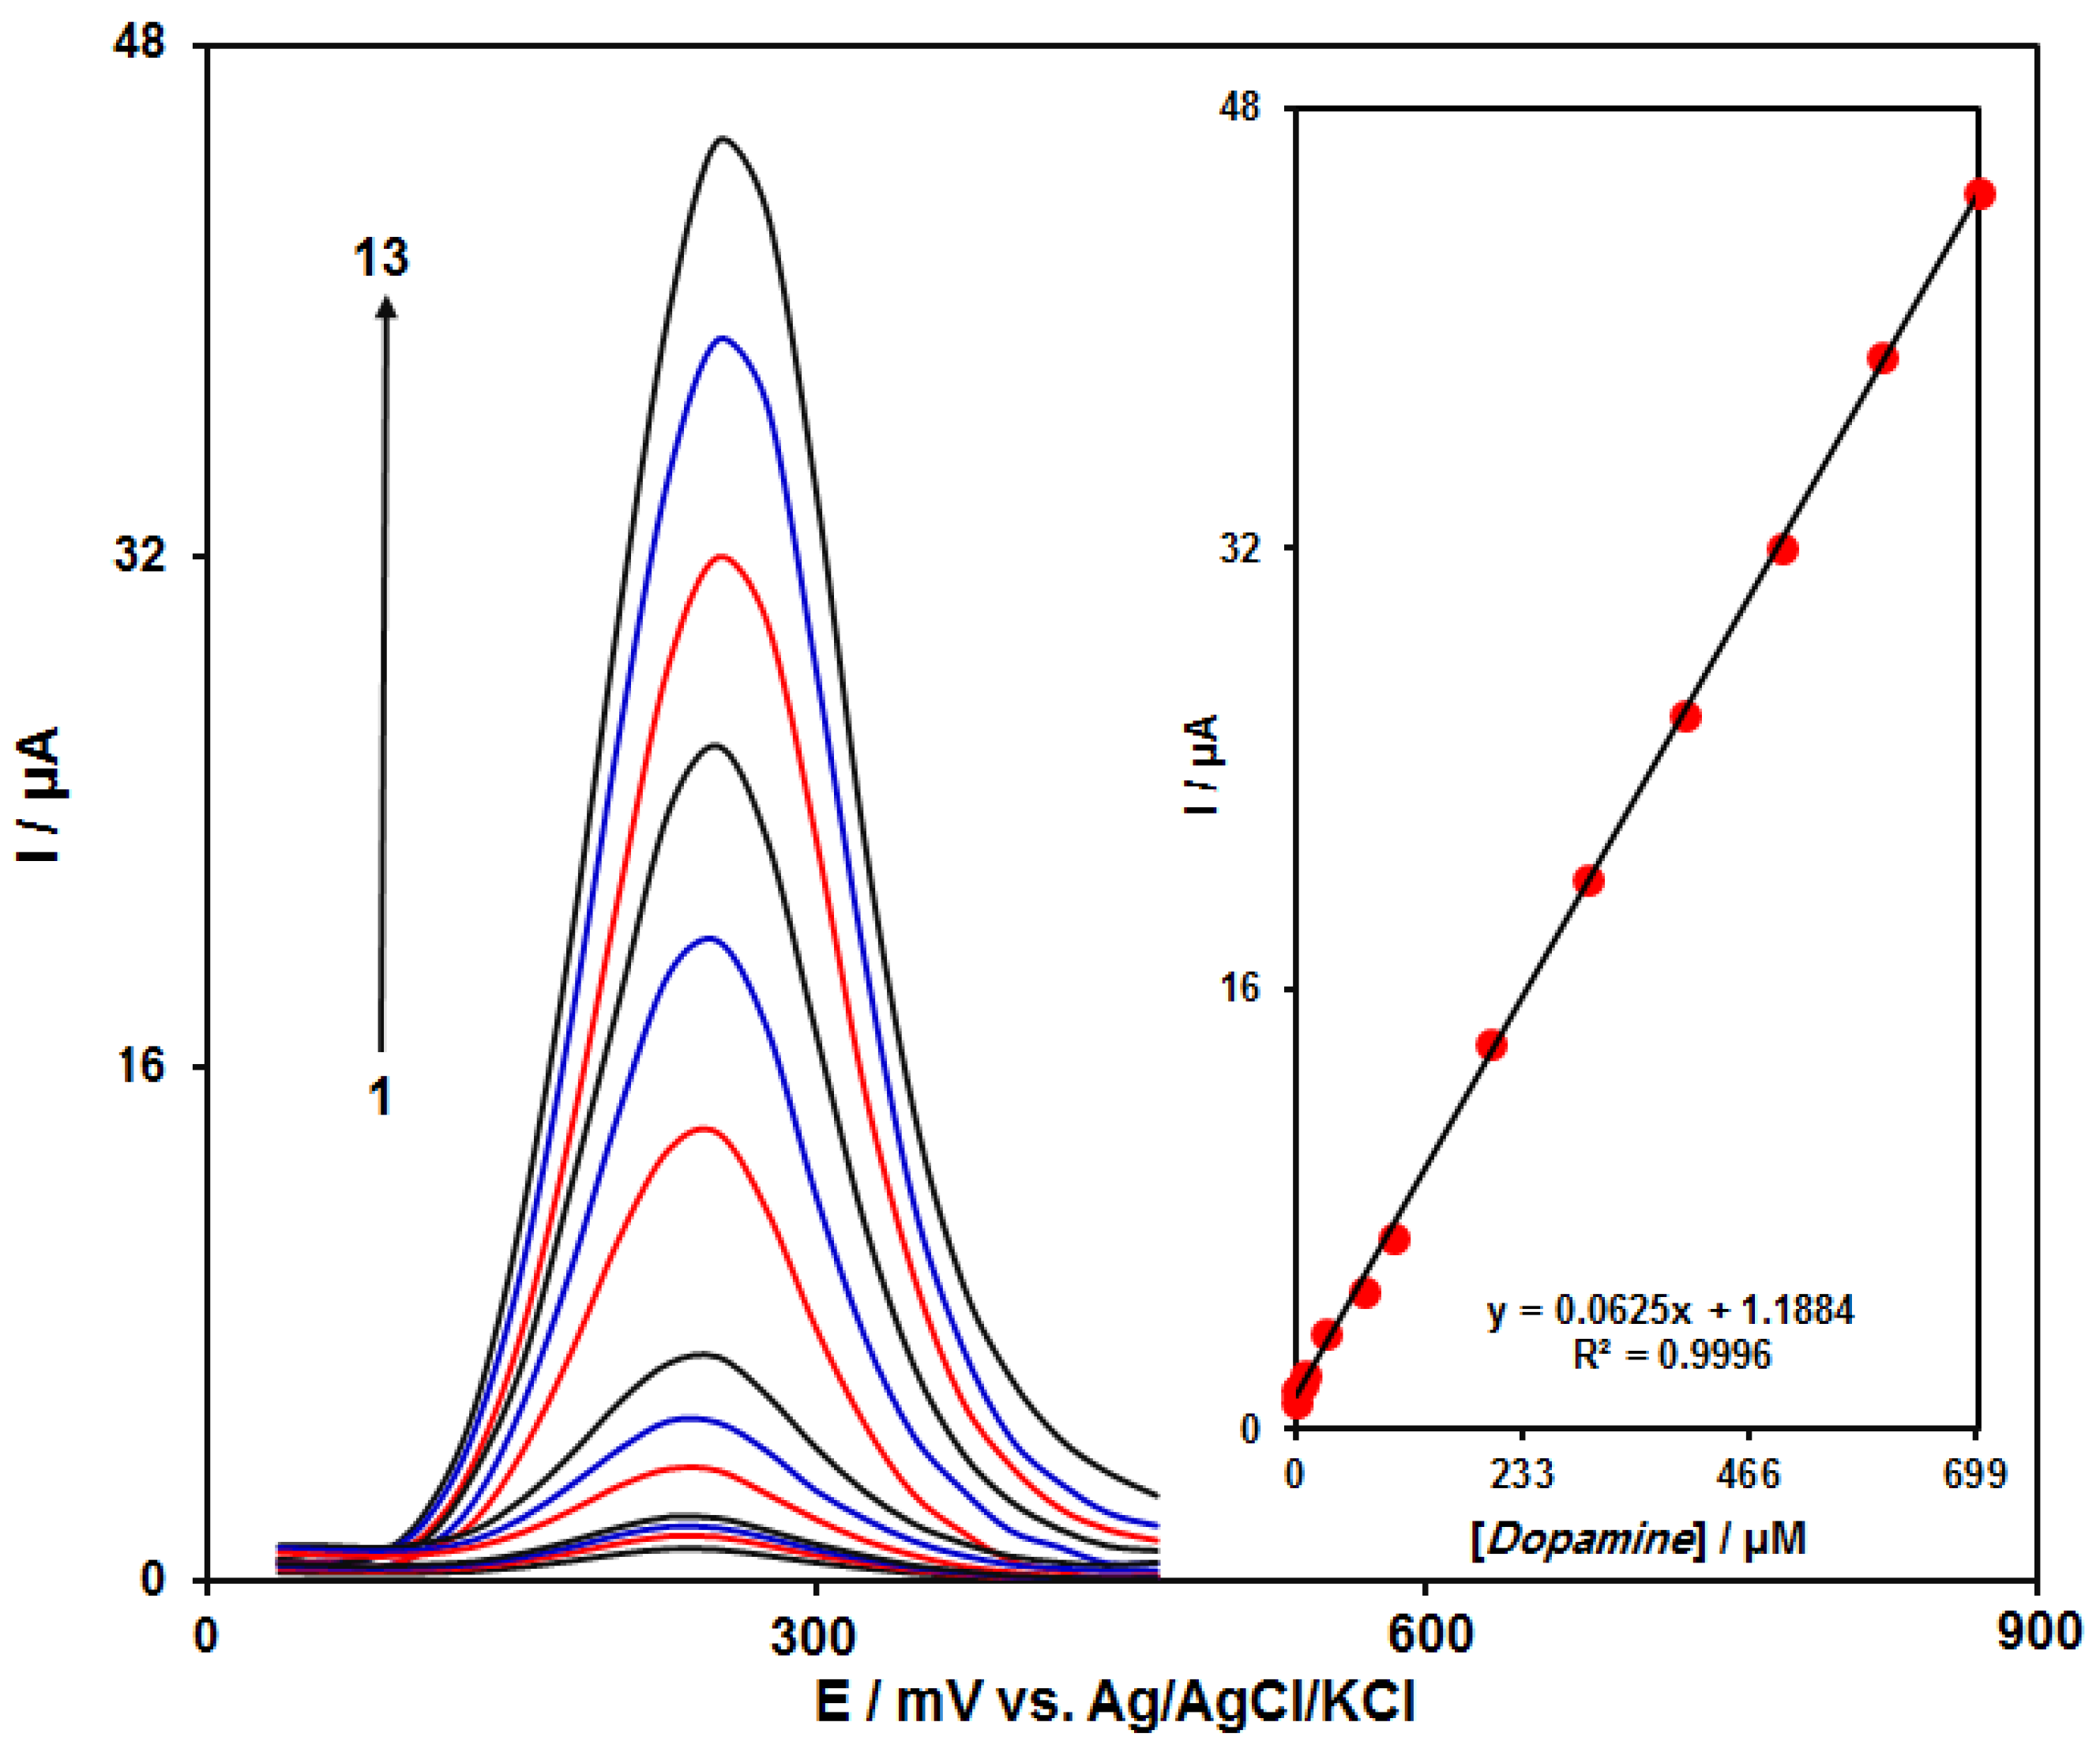
3.4. Calibration Curve (DPV Analysis of DA)
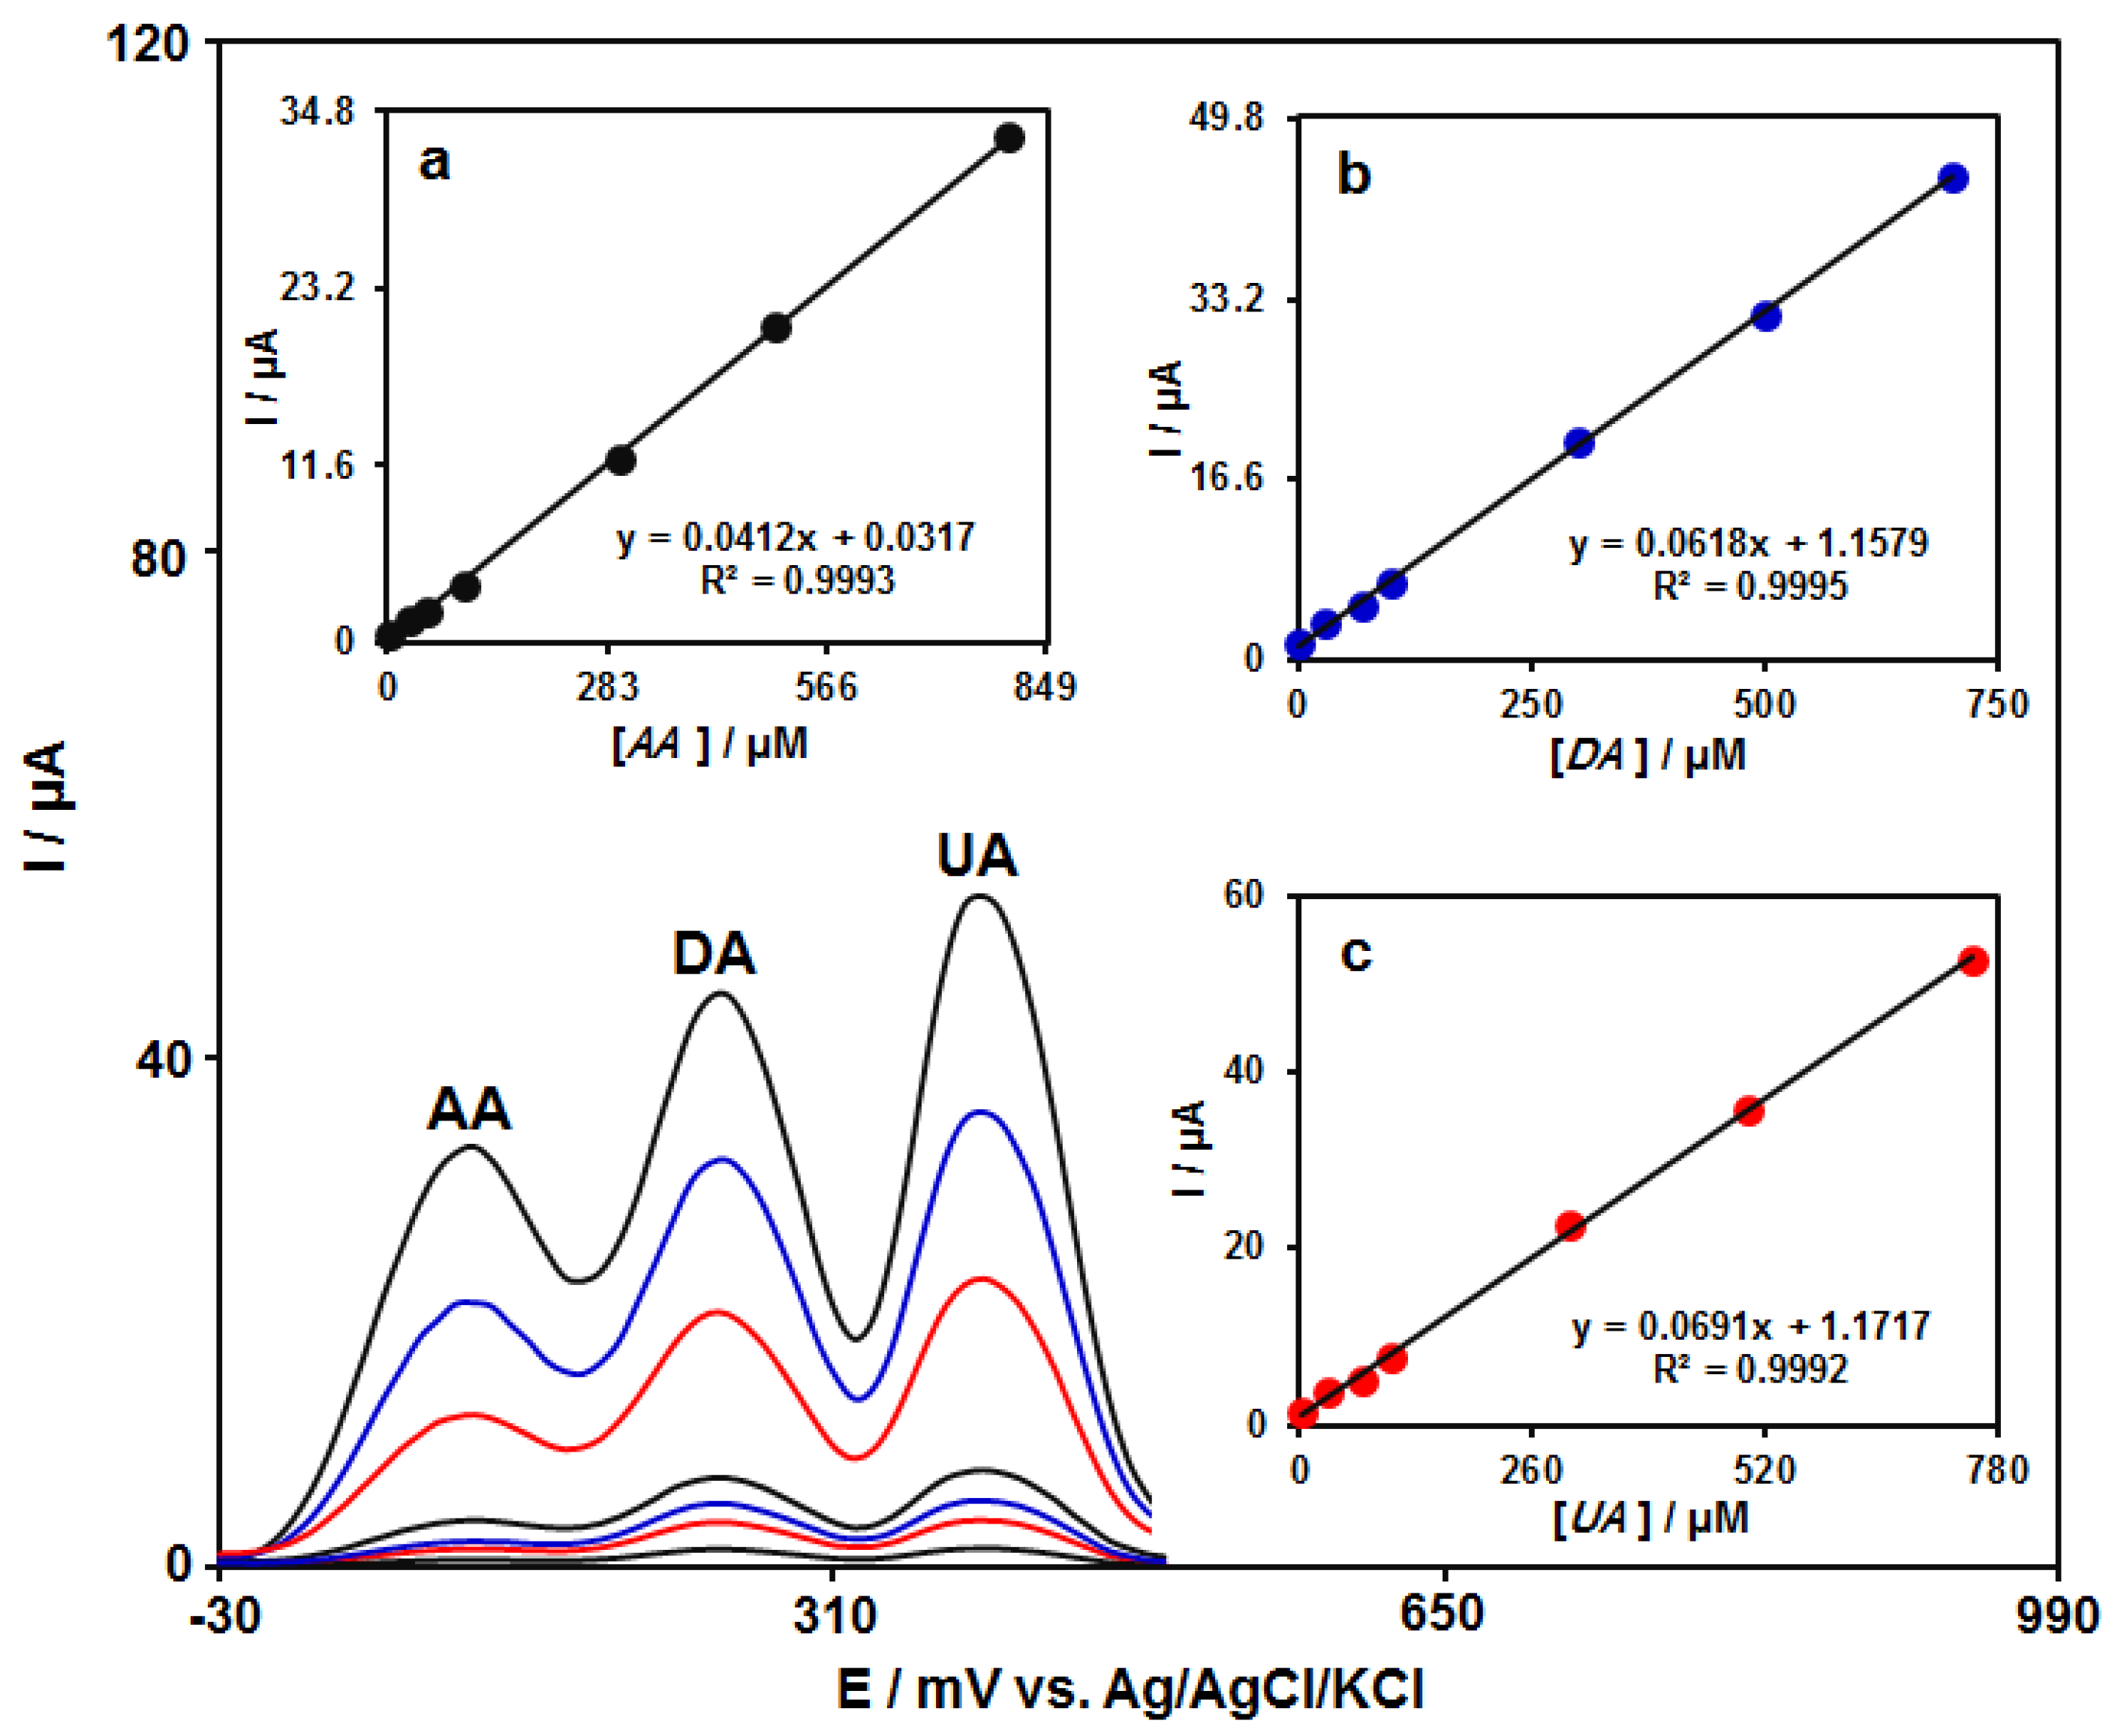
3.5. DPV Analysis of DA in the Presence of AA and UA
3.6. Real Samples Analysis
4. Conclusions
Author Contributions
Funding
Data Availability Statement
Conflicts of Interest
References
- O’Neill, R.D. Microvoltammetric techniques and sensors for monitoring neurochemical dynamics in vivo. Analyst 1994, 119, 767–779. [Google Scholar] [CrossRef]
- Fayemi, O.E.; Adekunle, A.S.; Swamy, B.K.; Ebenso, E.E. Electrochemical sensor for the detection of dopamine in real samples using polyaniline/NiO, ZnO, and Fe3O4 nanocomposites on glassy carbon electrode. J. Electroanal. Chem. 2018, 818, 236–249. [Google Scholar] [CrossRef]
- Jin, H.; Zhao, C.; Gui, R.; Gao, X.; Wang, Z. Reduced graphene oxide/nile blue/gold nanoparticles complex-modified glassy carbon electrode used as a sensitive and label-free aptasensor for ratiometric electrochemical sensing of dopamine. Anal. Chim. Acta 2018, 1025, 154–162. [Google Scholar] [CrossRef]
- Morón, J.A.; Brockington, A.; Wise, R.A.; Rocha, B.A.; Hope, B.T. Dopamine uptake through the norepinephrine transporter in brain regions with low levels of the dopamine transporter: Evidence from knock-out mouse lines. J. Neurosci. 2002, 15, 389–395. [Google Scholar] [CrossRef] [Green Version]
- Yamamoto, B.K.; Novotney, S. Regulation of extracellular dopamine by the norepinephrine transporter. J. Neurochem. 1998, 71, 274–280. [Google Scholar] [CrossRef]
- Zhang, L.; Hou, Y.; Lv, C.; Liu, W.; Zhang, Z.; Peng, X. Copper-based metal–organic xerogels on paper for chemiluminescence detection of dopamine. Anal. Methods 2020, 12, 4191–4198. [Google Scholar] [CrossRef]
- Lin, Z.; Wang, H.; Hu, L.; Li, J.; Lin, J.; Liu, B.; Zhao, Z.; Rao, Y. Simultaneous determination of N-ethylpentylone, dopamine, 5-hydroxytryptamine and their metabolites in rat brain microdialysis by liquid chromatography tandem mass spectrometry. Biomed. Chromatogr. 2019, 33, e4626. [Google Scholar] [CrossRef]
- Wang, J.; Hu, Y.; Zhou, Q.; Hu, L.; Fu, W.; Wang, Y. Peroxidase-like activity of metal–organic framework [Cu (PDA)(DMF)] and its application for colorimetric detection of dopamine. ACS Appl. Mater. Interfaces 2019, 11, 44466–44473. [Google Scholar] [CrossRef] [PubMed]
- Ma, Y.; Chen, A.Y.; Xie, X.F.; Wang, X.Y.; Wang, D.; Wang, P.; Li, H.J.; Yang, J.H.; Li, Y. Doping effect and fluorescence quenching mechanism of N-doped graphene quantum dots in the detection of dopamine. Talanta 2019, 196, 563–571. [Google Scholar] [CrossRef] [PubMed]
- Roychoudhury, A.; Francis, K.A.; Patel, J.; Jha, S.K.; Basu, S. A decoupler-free simple paper microchip capillary electrophoresis device for simultaneous detection of dopamine, epinephrine and serotonin. RSC Adv. 2020, 10, 25487–25495. [Google Scholar] [CrossRef]
- Karimi-Maleh, H.; Sheikhshoaie, M.; Sheikhshoaie, I.; Ranjbar, M.; Alizadeh, J.; Maxakato, N.W.; Abbaspourrad, A. A novel electrochemical epinine sensor using amplified CuO nanoparticles and an-hexyl-3-methylimidazolium hexafluorophosphate electrode. New J. Chem. 2019, 43, 2362–2367. [Google Scholar] [CrossRef]
- Shivanna, M.; Manjunath, S.; Sidlingappa, M.; Dharmaprakash, M.S. Electrochemical Detection of Serotonin Using t-ZrO2 Nanoparticles Modified Carbon Paste Electrode. J. Electrochem. Soc. 2020, 167, 155512. [Google Scholar]
- Kouadio, K.E.; Kambiré, O.; Koffi, K.S.; Ouattara, L. Electrochemical oxidation of paracetamol on boron-doped diamond electrode: Analytical performance and paracetamol degradation. J. Electrochem. Sci. Eng. 2021, 11, 71–86. [Google Scholar]
- Payehghadr, M.; Taherkhani, Y.; Maleki, A.; Nourifard, F. Selective and sensitive voltammetric sensor for methocarbamol determination by molecularly imprinted polymer modified carbon paste electrode. Eurasian Chem. Commun. 2020, 2, 982–990. [Google Scholar]
- Deshmukh, M.A.; Celiesiute, R.; Ramanaviciene, A.; Shirsat, M.D.; Ramanavicius, A. EDTA_PANI/SWCNTs nanocomposite modified electrode for electrochemical determination of copper (II), lead (II) and mercury (II) ions. Electrochim. Acta 2018, 259, 930–938. [Google Scholar] [CrossRef]
- Raoof, J.B.; Ojani, R.; Beitollahi, H. Electrocatalytic determination of ascorbic acid at chemically modified carbon paste electrode with 2,7-bis (ferrocenyl ethynyl) fluoren-9-one. Int. J. Electrochem. Sci. 2007, 2, 534–548. [Google Scholar]
- Rshad, S.; Mofidi-Rasi, R. Electrocatalytic oxidation of sulfite Ion at the surface carbon ceramic modified electrode with prussian blue. Eurasian Chem. Commun. 2019, 1, 43–52. [Google Scholar]
- Kumar, D.R.; Baynosa, M.L.; Dhakal, G.; Shim, J.J. Sphere-like Ni3S4/NiS2/MoOx composite modified glassy carbon electrode for the electrocatalytic determination of d-penicillamine. J. Mol. Liq. 2020, 301, 112447. [Google Scholar] [CrossRef]
- Mohanraj, J.; Durgalakshmi, D.; Rakkesh, R.A.; Balakumar, S.; Rajendran, S.; Karimi-Maleh, H. Facile synthesis of paper based graphene electrodes for point of care devices: A double stranded DNA (dsDNA) biosensor. J. Colloid Interface Sci. 2020, 566, 463–472. [Google Scholar] [CrossRef]
- Karimi-Maleh, H.; Karimi, F.; Orooji, Y.; Mansouri, G.; Razmjou, A.; Aygun, A.; Sen, F. A new nickel-based co-crystal complex electrocatalyst amplified by NiO dope Pt nanostructure hybrid; a highly sensitive approach for determination of cysteamine in the presence of serotonin. Sci. Rep. 2020, 10, 11699. [Google Scholar] [CrossRef]
- Montazarolmahdi, M.; Masrournia, M.; Nezhadali, A. A new electrochemical approach for the determination of phenylhydrazine in water and wastewater samples using amplified carbon paste electrode. Chem. Methodol. 2020, 4, 732–742. [Google Scholar]
- Wang, L.; Yang, R.; Qu, L.; Harrington, P.D.B. Electrostatic repulsion strategy for high-sensitive and selective determination of dopamine in the presence of uric acid and ascorbic acid. Talanta 2020, 210, 120626. [Google Scholar] [CrossRef]
- Shashikumara, J.K.; Swamy, B.K. Electrochemical investigation of dopamine in presence of uric acid and ascorbic acid at poly (reactive blue) modified carbon paste electrode: A voltammetric study. Sens. Int. 2020, 1, 100008. [Google Scholar] [CrossRef]
- Kunpatee, K.; Traipop, S.; Chailapakul, O.; Chuanuwatanakul, S. Simultaneous determination of ascorbic acid, dopamine, and uric acid using graphene quantum dots/ionic liquid modified screen-printed carbon electrode. Sens. Actuators B Chem. 2020, 314, 128059. [Google Scholar] [CrossRef]
- Mahalakshmi, S.; Sridevi, V. In situ electrodeposited gold nanoparticles on polyaniline-modified electrode surface for the detection of dopamine in presence of ascorbic acid and uric acid. Electrocatalysis 2021, 12, 415–435. [Google Scholar] [CrossRef]
- Beitollahi, H.; Khalilzadeh, M.A.; Tajik, S.; Safaei, M.; Zhang, K.; Jang, H.W.; Shokouhimehr, M. Recent advances in applications of voltammetric sensors modified with ferrocene and its derivatives. ACS Omega 2020, 5, 2049–2059. [Google Scholar] [CrossRef] [PubMed]
- Pyman, H.; Roshanfekr, H.; Ansari, S. DNA-based electrochemical biosensor using chitosan–carbon nanotubes composite film for biodetection of Pirazon. Eurasian Chem. Commun. 2020, 2, 213–225. [Google Scholar]
- Garkani-Nejad, F.; Sheikhshoaie, I.; Beitollahi, H. Simultaneous detection of carmoisine and tartrazine in food samples using GO-Fe3O4-PAMAM and ionic liquid based electrochemical sensor. Food Chem. Toxicol. 2022, 162, 112864. [Google Scholar] [CrossRef]
- Abrishamkar, M.; Ehsani-Tilami, S.; Hosseini-Kaldozakh, S. Electrocatalytic oxidation of cefixime at the surface of modified carbon paste electrode with synthesized nano zeolite. Adv. J. Chem. A 2020, 3, 767–776. [Google Scholar]
- Kamble, B.; Garadkar, K.M.; Sharma, K.K.; Kamble, P.; Tayade, S.; Ajalkar, B.D. Determination of 4-nitrophenol using MoO3 loaded glassy carbon electrode via electrochemical sensing approach. J. Electrochem. Sci. Eng. 2021, 11, 143–159. [Google Scholar] [CrossRef]
- Tajik, S.; Beitollahi, H.; Torkzadeh-Mahani, M. Electrochemical immunosensor for the detection of anti-thyroid peroxidase antibody by gold nanoparticles and ionic liquid-modified carbon paste electrode. J. Nanostruct. Chem. 2022, 12, 581–588. [Google Scholar] [CrossRef]
- Shetti, N.P.; Nayak, D.S.; Malode, S.J.; Kulkarni, R.M. An electrochemical sensor for clozapine at ruthenium doped TiO2 nanoparticles modified electrode. Sens. Actuators B Chem. 2017, 247, 858–867. [Google Scholar] [CrossRef]
- Karimi-Maleh, H.; Darabi, R.; Shabani-Nooshabadi, M.; Baghayeri, M.; Karimi, F.; Rouhi, J.; Karaman, C. Determination of D&C Red 33 and Patent Blue V Azo dyes using an impressive electrochemical sensor based on carbon paste electrode modified with ZIF-8/g-C3N4/Co and ionic liquid in mouthwash and toothpaste as real samples. Food Chem. Toxicol. 2022, 162, 112907. [Google Scholar]
- Mirbaloochzehi, M.R.; Rezvani, A.; Samimi, A.; Shayesteh, M. Application of a novel surfactant-modified natural nano-zeolite for removal of heavy metals from drinking water. Adv. J. Chem. A 2020, 3, 612–620. [Google Scholar]
- Zhang, L.; Guo, H.; Xue, R.; Yue, L.; Li, Q.; Liu, H.; Yang, W. In-situ facile synthesis of flower shaped NiS2@regenerative graphene oxide derived from waste dry battery nano-composites for high-performance supercapacitors. J. Energy Storage 2020, 31, 101630. [Google Scholar] [CrossRef]
- Beitollahi, H.; Garkani Nejad, F.; Dourandish, Z.; Tajik, S. A novel voltammetric amaranth sensor based on screen printed electrode modified with polypyrrole nanotubes. Environ. Res. 2022, 214, 113725. [Google Scholar] [CrossRef]
- Mohammadi, S.S.; Ghasemi, N.; Ramezani, M. Bio-fabrication of silver nanoparticles using naturally available wild herbaceous plant and its antibacterial activity. Eurasian Chem. Commun. 2020, 2, 87–102. [Google Scholar]
- Karimi-Maleh, H.; Karaman, C.; Karaman, O.; Karimi, F.; Vasseghian, Y.; Fu, L.; Mirabi, A. Nanochemistry approach for the fabrication of Fe and N co-decorated biomass-derived activated carbon frameworks: A promising oxygen reduction reaction electrocatalyst in neutral media. J. Nanostruct. Chem. 2022, 12, 429–439. [Google Scholar] [CrossRef]
- Kashkooli, F.M.; Soltani, M.; Souri, M. Controlled anti-cancer drug release through advanced nano-drug delivery systems: Static and dynamic targeting strategies. J. Control. Release 2020, 327, 316–349. [Google Scholar] [CrossRef]
- Khakyzadeh, V.; Rezaei-Vahidian, H.; Sediqi, S.; Azimi, S.; Karimi-Nami, R. Programming adsorptive removal of organic azo dye from aqueous media using magnetic carbon nano-composite. Chem. Methodol. 2021, 5, 324–330. [Google Scholar]
- Karimi-Maleh, H.; Cellat, K.; Arıkan, K.; Savk, A.; Karimi, F.; Şen, F. Palladium–nickel nanoparticles decorated on functionalized-MWCNT for high precision non-enzymatic glucose sensing. Mater. Chem. Phys. 2020, 250, 123042. [Google Scholar] [CrossRef]
- Shi, R.; Liang, J.; Zhao, Z.; Liu, A.; Tian, Y. An electrochemical bisphenol A sensor based on one step electrochemical reduction of cuprous oxide wrapped graphene oxide nanoparticles modified electrode. Talanta 2017, 169, 37–43. [Google Scholar] [CrossRef] [PubMed]
- Miraki, M.; Karimi-Maleh, H.; Taher, M.A.; Cheraghi, S.; Karimi, F.; Agarwal, S.; Gupta, V.K. Voltammetric amplified platform based on ionic liquid/NiO nanocomposite for determination of benserazide and levodopa. J. Mol. Liq. 2019, 278, 672–676. [Google Scholar] [CrossRef]
- Sadeghi, H.; Shahidi, S.A.; Naghizadeh Raeisi, S.; Ghorbani-HasanSaraei, A.; Karimi, F. Electrochemical determination of folic acid in fruit juices samples using electroanalytical sensor amplified with CuO/SWCNTs and 1-butyl-2,3-dimethylimidazolium hexafluorophosphate. Chem. Methodol. 2020, 4, 743–753. [Google Scholar]
- Baghizadeh, A.; Karimi-Maleh, H.; Khoshnama, Z.; Hassankhani, A.; Abbasghorbani, M. A voltammetric sensor for simultaneous determination of vitamin C and vitamin B6 in food samples using ZrO2 nanoparticle/ionic liquids carbon paste electrode. Food Anal. Methods 2015, 8, 549–557. [Google Scholar] [CrossRef]
- Emir, G.; Dilgin, Y.; Ramanaviciene, A.; Ramanavicius, A. Amperometric nonenzymatic glucose biosensor based on graphite rod electrode modified by Ni-nanoparticle/polypyrrole composite. Microchem. J. 2021, 161, 105751. [Google Scholar] [CrossRef]
- Garkani-Nejad, F.; Beitollahi, H.; Alizadeh, R. Sensitive determination of hydroxylamine on ZnO nanorods/graphene oxide nanosheets modified graphite screen printed electrode. Anal. Bioanal. Electrochem. 2017, 9, 134–144. [Google Scholar]
- Sengar, M.; Saxena, S.; Satsangee, S.; Jain, R. Silver nanoparticles decorated functionalized multiwalled carbon nanotubes modified screen printed sensor for the voltammetric determination of butorphanol. J. Appl. Organomet. Chem. 2021, 1, 95–108. [Google Scholar]
- Beitollahi, H.; Tajik, S.; Aflatoonian, M.R.; Makarem, A. Glutathione detection at carbon paste electrode modified with ethyl 2-(4-ferrocenyl-[1,2,3]triazol-1-yl)acetate, ZnFe2O4 nanoparticles and ionic liquid. J. Electrochem. Sci. Eng. 2022, 12, 209–217. [Google Scholar] [CrossRef]
- Sunder, G.S.S.; Rohanifar, A.; Devasurendra, A.M.; Kirchhoff, J.R. Selective determination of l-DOPA at a graphene oxide/yttrium oxide modified glassy carbon electrode. Electrochim. Acta 2019, 301, 192–199. [Google Scholar] [CrossRef]
- Ren, Q.; Shen, X.; Sun, Y.; Fan, R.; Zhang, J. A highly sensitive competitive immunosensor based on branched polyethyleneimine functionalized reduced graphene oxide and gold nanoparticles modified electrode for detection of melamine. Food Chem. 2020, 304, 125397. [Google Scholar] [CrossRef] [PubMed]
- Karimi-Maleh, H.; Arotiba, O.A. Simultaneous determination of cholesterol, ascorbic acid and uric acid as three essential biological compounds at a carbon paste electrode modified with copper oxide decorated reduced graphene oxide nanocomposite and ionic liquid. J. Colloid Interface Sci. 2020, 560, 208–212. [Google Scholar] [CrossRef]
- Barsan, M.M.; Prathish, K.P.; Sun, X.; Brett, C.M. Nitrogen doped graphene and its derivatives as sensors and efficient direct electron transfer platform for enzyme biosensors. Sens. Actuators B Chem. 2014, 203, 579–587. [Google Scholar] [CrossRef]
- Xing, H.; Xu, J.; Zhu, X.; Duan, X.; Lu, L.; Wang, W.; Shang, Y.; Yang, T. Highly sensitive simultaneous determination of cadmium (II), lead (II), copper (II), and mercury (II) ions on N-doped graphene modified electrode. J. Electroanal. Chem. 2016, 760, 52–58. [Google Scholar] [CrossRef]
- Fan, H.; Li, Y.; Wu, D.; Ma, H.; Mao, K.; Fan, D.; Du, B.; Li, H.; Wei, Q. Electrochemical bisphenol A sensor based on N-doped graphene sheets. Anal. Chim. Acta 2012, 711, 24–28. [Google Scholar] [CrossRef]
- Yan, Y.; Jamal, R.; Yu, Z.; Zhang, R.; Zhang, W.; Ge, Y.; Liu, Y.; Abdiryim, T. Composites of thiol-grafted PEDOT with N-doped graphene or graphitic carbon nitride as an electrochemical sensor for the detection of paracetamol. J. Mater. Sci. 2020, 55, 5571–5586. [Google Scholar]
- Bai, L.; Chen, Y.; Liu, X.; Zhou, J.; Cao, J.; Hou, L.; Guo, S. Ultrasensitive electrochemical detection of Mycobacterium tuberculosis IS6110 fragment using gold nanoparticles decorated fullerene nanoparticles/nitrogen-doped graphene nanosheet as signal tags. Anal. Chim. Acta 2019, 1080, 75–83. [Google Scholar] [CrossRef] [PubMed]
- Bard, A.J.; Faulkner, L.R. Electrochemical Methods: Fundamentals and Applications, 2nd ed.; John Wiley & Sons: New York, NY, USA, 2001. [Google Scholar]
- Liu, Y.; Ma, J.; Wu, T.; Wang, X.; Huang, G.; Liu, Y.; Qiu, H.; Li, Y.; Wang, W.; Gao, J. Cost-effective reduced graphene oxide-coated polyurethane sponge as a highly efficient and reusable oil-absorbent. ACS Appl. Mater. Interfaces 2013, 5, 10018–10026. [Google Scholar] [CrossRef]
- Rahmani, Z.; Rashidi, A.M.; Samadi, M.T.; Rahmani, A.R. N-doped reduced graphene oxide aerogel for the selective adsorption of oil pollutants from water: Isotherm and kinetic study. J. Ind. Eng. Chem. 2018, 61, 416–426. [Google Scholar] [CrossRef]
- Ben Aoun, S. Nanostructured carbon electrode modified with N-doped graphene quantum dots–chitosan nanocomposite: A sensitive electrochemical dopamine sensor. R. Soc. Open Sci. 2017, 4, 171199. [Google Scholar] [CrossRef] [PubMed] [Green Version]
- Aparna, T.K.; Sivasubramanian, R.; Dar, M.A. One-pot synthesis of Au-Cu2O/rGO nanocomposite based electrochemical sensor for selective and simultaneous detection of dopamine and uric acid. J. Alloys Compd. 2018, 741, 1130–1141. [Google Scholar] [CrossRef]
- Yue, H.Y.; Zhang, H.J.; Huang, S.; Lu, X.X.; Gao, X.; Song, S.S.; Wang, Z.; Wang, W.Q.; Guan, E.H. Highly sensitive and selective dopamine biosensor using Au nanoparticles-ZnO nanocone arrays/graphene foam electrode. Mater. Sci. Eng. C 2020, 108, 110490. [Google Scholar] [CrossRef]
- Huang, Z.; Zhang, L.; Cao, P.; Wang, N.; Lin, M. Electrochemical sensing of dopamine using a Ni-based metal-organic framework modified electrode. Ionics 2021, 27, 1339–1345. [Google Scholar] [CrossRef]
- Zheng, S.; Huang, R.; Ma, X.; Tang, J.; Li, Z.; Wang, X.; Wei, J.; Wang, J. A highly sensitive dopamine sensor based on graphene quantum dots modified glassy carbon electrode. Int. J. Electrochem. Sci. 2018, 13, 5723. [Google Scholar] [CrossRef]
- Zablocka, I.; Wysocka-Zolopa, M.; Winkler, K. Electrochemical detection of dopamine at a gold electrode modified with a polypyrrole–mesoporous silica molecular sieves (MCM-48) film. Int. J. Mol. Sci. 2019, 20, 111. [Google Scholar] [CrossRef] [PubMed] [Green Version]
- Wang, Y.; Wang, L.; Zhuang, Q. A ratiometric electrochemical sensor for dopamine detection based on hierarchical manganese dioxide nanoflower/multiwalled carbon nanotube nanocomposite modified glassy carbon electrode. J. Alloys Compd. 2019, 802, 326–334. [Google Scholar] [CrossRef]


| Electrochemical Sensor | Electrochemical Method | Linear Range | LOD | Ref. |
|---|---|---|---|---|
| N-doped graphene quantum dots–chitosan nanocomposite/screen printed carbon electrode | DPV | 1–100 and 100–200 ìM | 0.145 ìM | [61] |
| Au-Cu2O/reduced graphene oxide/glassy carbon electrode | DPV | 10–90 ìM | 3.9 ìM | [62] |
| Au nanoparticle–ZnO nanocone arrays/graphene foam electrode | DPV | - | 0.04 ìM | [63] |
| Ni-based metal–organic framework/GCE | 0.2–100.0 ìM | 60 nM | [64] | |
| Graphene quantum dots /glassy carbon electrode | DPV | 0.4–100 ìM | 0.05 ìM | [65] |
| Polypyrrole–mesoporous silica molecular sieves (MCM-48)/Au electrode | Square-wave voltammetry | 2–250 ìM | 0.7 ìM | [66] |
| Hierarchical MnO2 nanoflower/multiwalled carbon nanotube nanocomposite/glassy carbon electrode | DPV | 0.5–30.0 ìM | 0.17 ìM | [67] |
| NGSs/GCE | DPV | 0.1–700.0 μM | 30.0 nM | This work |
| Sample | Spiked (µM) | Found (µM) | Recovery (%) | (%) R.S.D. | ||||||||
|---|---|---|---|---|---|---|---|---|---|---|---|---|
| AA | DA | UA | AA | DA | UA | AA | DA | UA | AA | DA | UA | |
| DA Ampule | 0 | 0 | 0 | - | 5.0 | - | - | - | - | - | 2.9 | - |
| 5.0 | 2.0 | 6.0 | 4.9 | 7.3 | 6.1 | 98.0 | 104.3 | 101.7 | 3.5 | 1.9 | 2.3 | |
| 7.5 | 3.0 | 7.0 | 7.6 | 7.9 | 7.3 | 101.3 | 98.7 | 104.3 | 1.7 | 3.4 | 1.6 | |
| 10.0 | 4.0 | 8.0 | 9.9 | 9.1 | 7.7 | 99.0 | 101.1 | 96.2 | 2.9 | 2.2 | 3.0 | |
| 12.5 | 5.0 | 9.0 | 12.8 | 9.6 | 8.9 | 102.4 | 96.0 | 98.9 | 2.8 | 2.4 | 2.3 | |
| AA Ampule | 0 | 0 | 0 | 3.5 | - | - | - | - | - | 3.4 | - | - |
| 2.0 | 4.5 | 4.0 | 5.6 | 4.4 | 4.1 | 101.8 | 97.8 | 102.5 | 2.0 | 1.9 | 3.4 | |
| 4.0 | 6.5 | 5.0 | 7.3 | 6.7 | 4.8 | 97.3 | 103.1 | 96.0 | 2.9 | 3.5 | 1.8 | |
| 6.0 | 8.5 | 6.0 | 9.4 | 8.4 | 6.1 | 98.9 | 98.8 | 101.7 | 2.4 | 2.7 | 2.5 | |
| 8.0 | 10.5 | 7.0 | 11.9 | 10.6 | 6.8 | 103.5 | 100.9 | 97.1 | 2.6 | 2.1 | 2.9 | |
| Urine | 0 | 0 | 0 | - | - | 3.0 | - | - | - | - | - | 3.1 |
| 5.0 | 6.0 | 3.0 | 4.9 | 6.2 | 5.9 | 98.0 | 103.3 | 98.3 | 3.4 | 2.3 | 1.7 | |
| 10.0 | 8.0 | 4.0 | 10.3 | 7.8 | 7.1 | 103.0 | 97.5 | 101.4 | 2.4 | 2.6 | 3.0 | |
| 15.0 | 10.0 | 5.0 | 14.9 | 10.1 | 7.7 | 99.3 | 101.0 | 96.2 | 1.6 | 3.1 | 2.1 | |
| 20.0 | 12.0 | 6.0 | 20.2 | 11.9 | 9.3 | 101.0 | 99.2 | 103.3 | 2.9 | 1.9 | 2.3 | |
Publisher’s Note: MDPI stays neutral with regard to jurisdictional claims in published maps and institutional affiliations. |
© 2022 by the authors. Licensee MDPI, Basel, Switzerland. This article is an open access article distributed under the terms and conditions of the Creative Commons Attribution (CC BY) license (https://creativecommons.org/licenses/by/4.0/).
Share and Cite
Moradpour, H.; Beitollahi, H. Simultaneous Electrochemical Sensing of Dopamine, Ascorbic Acid, and Uric Acid Using Nitrogen-Doped Graphene Sheet-Modified Glassy Carbon Electrode. C 2022, 8, 50. https://doi.org/10.3390/c8040050
Moradpour H, Beitollahi H. Simultaneous Electrochemical Sensing of Dopamine, Ascorbic Acid, and Uric Acid Using Nitrogen-Doped Graphene Sheet-Modified Glassy Carbon Electrode. C. 2022; 8(4):50. https://doi.org/10.3390/c8040050
Chicago/Turabian StyleMoradpour, Hediyeh, and Hadi Beitollahi. 2022. "Simultaneous Electrochemical Sensing of Dopamine, Ascorbic Acid, and Uric Acid Using Nitrogen-Doped Graphene Sheet-Modified Glassy Carbon Electrode" C 8, no. 4: 50. https://doi.org/10.3390/c8040050