
Organotypic 3D Cell-Architecture Impacts the Expression Pattern of miRNAs–mRNAs Network in Breast Cancer SKBR3 Cells
 , , ,
, , ,  ,
,  , and
, and
Abstract
:1. Introduction
2. Results
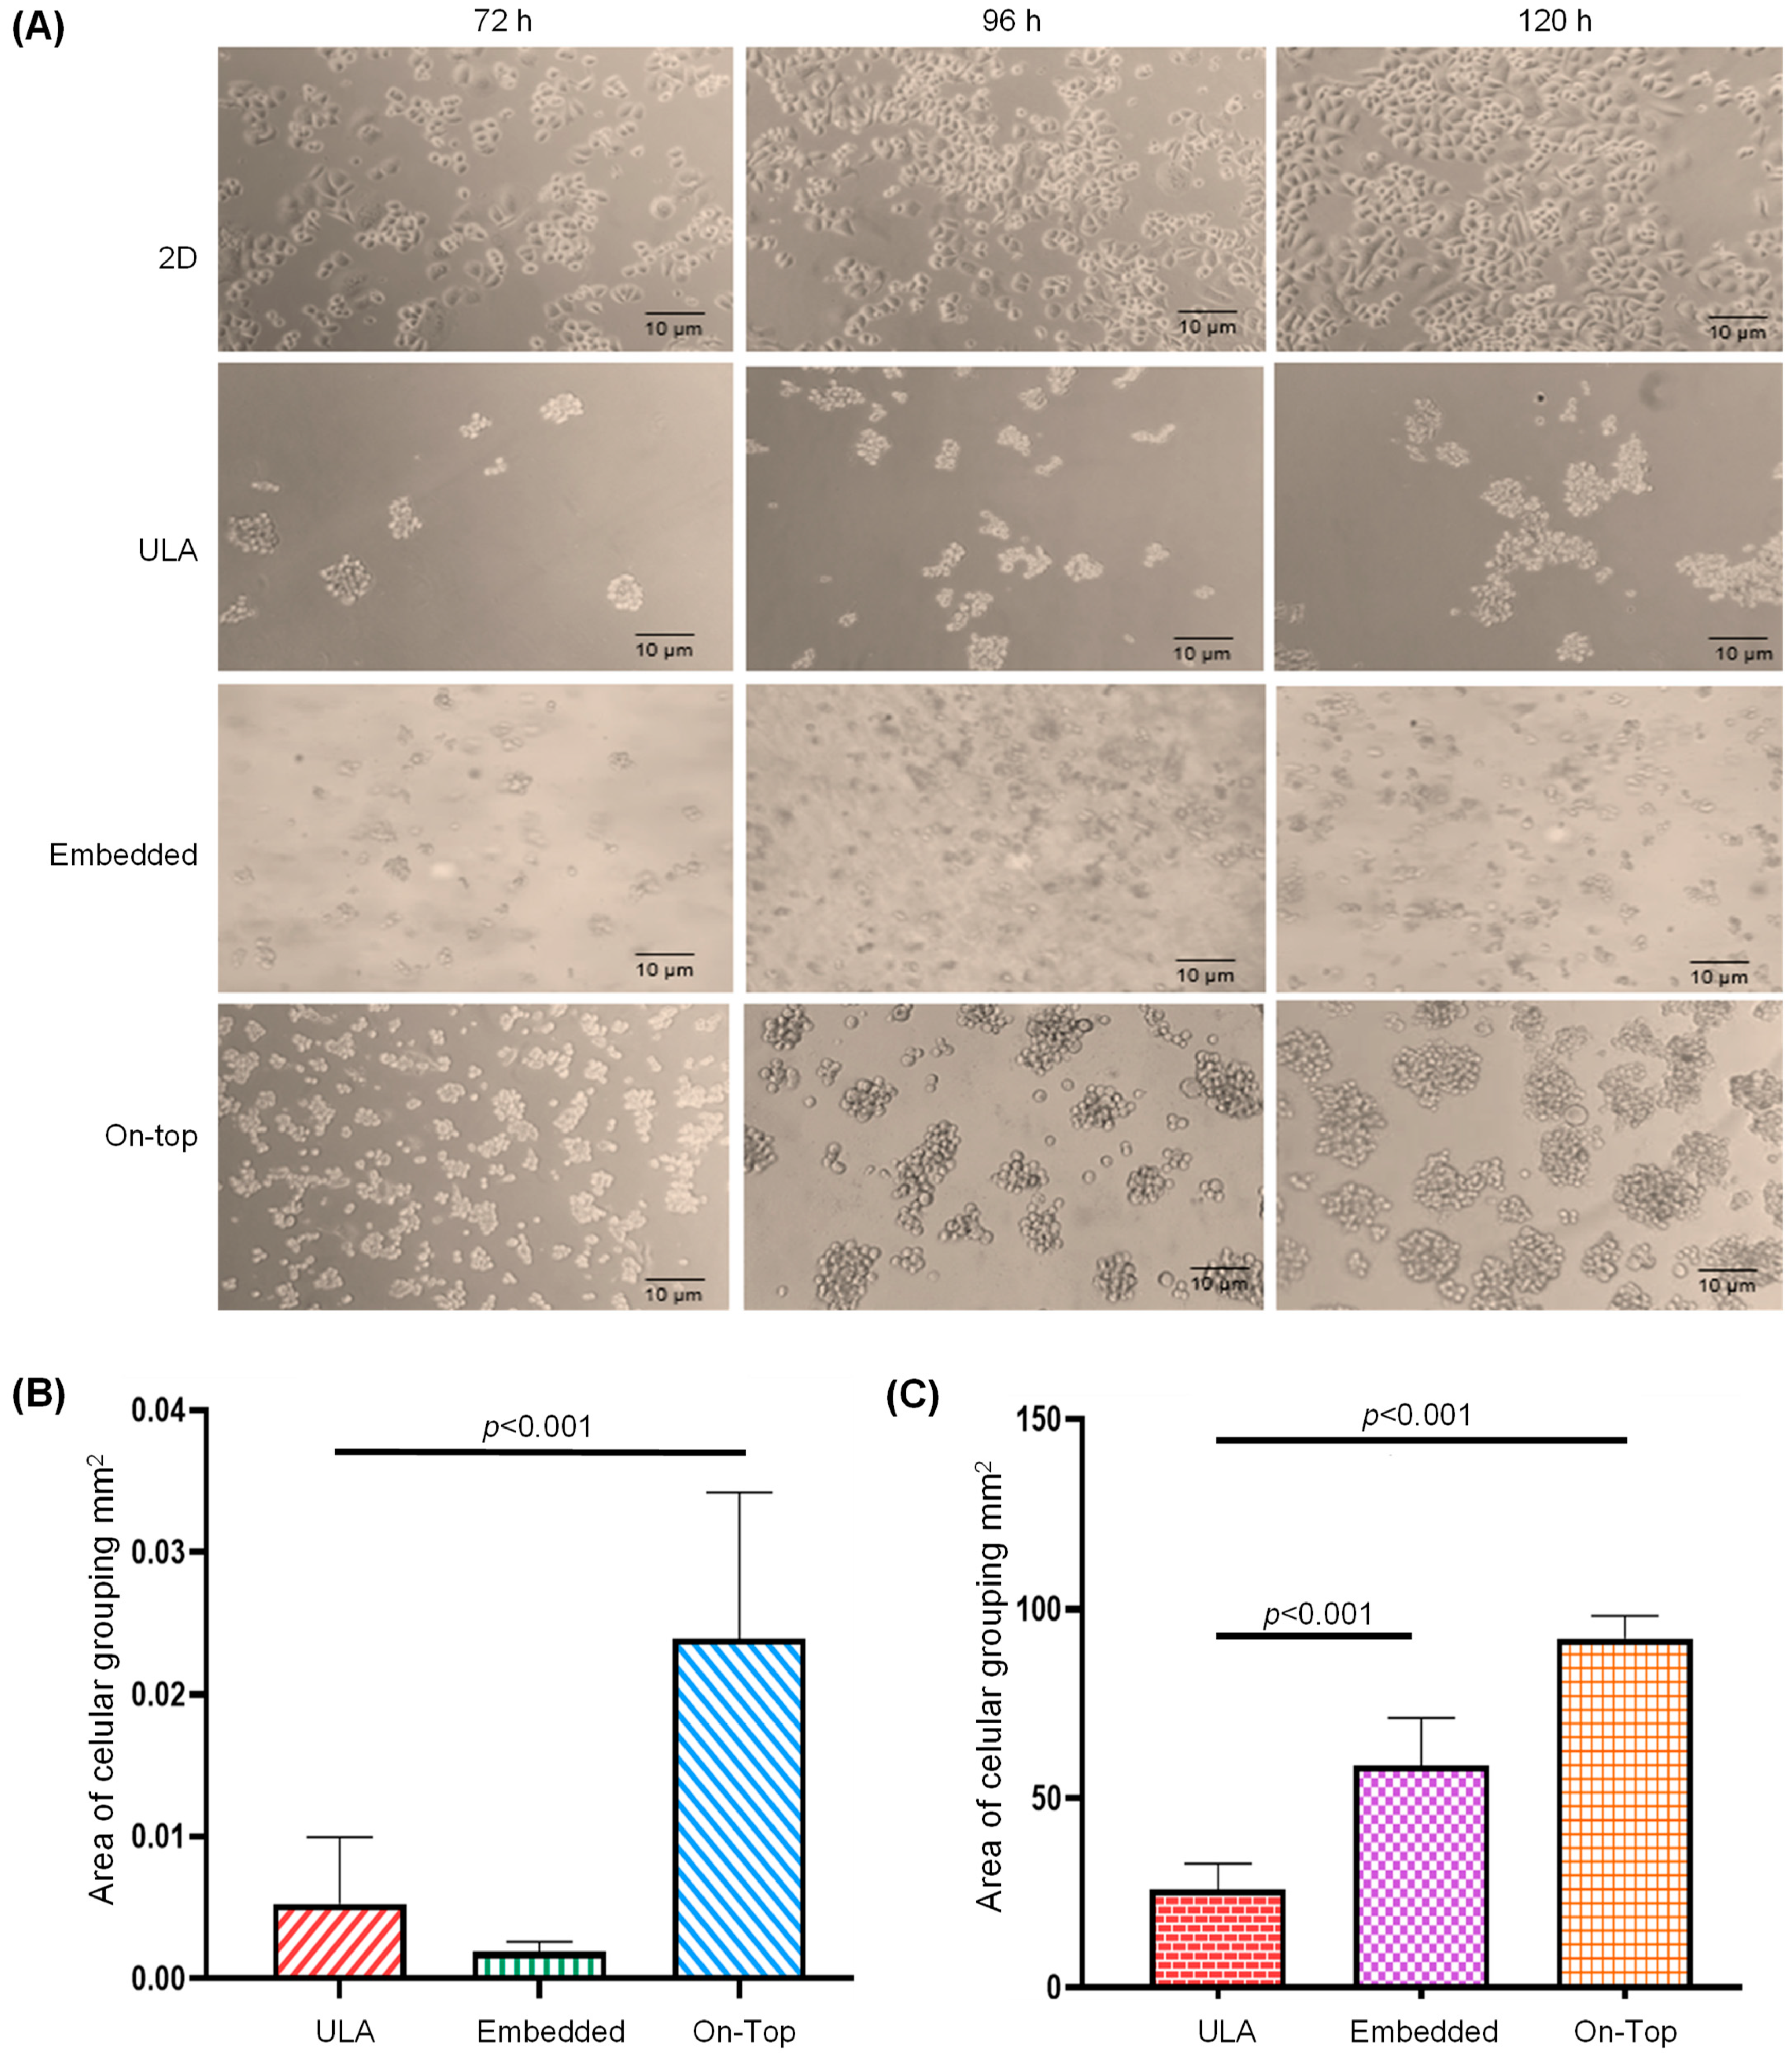
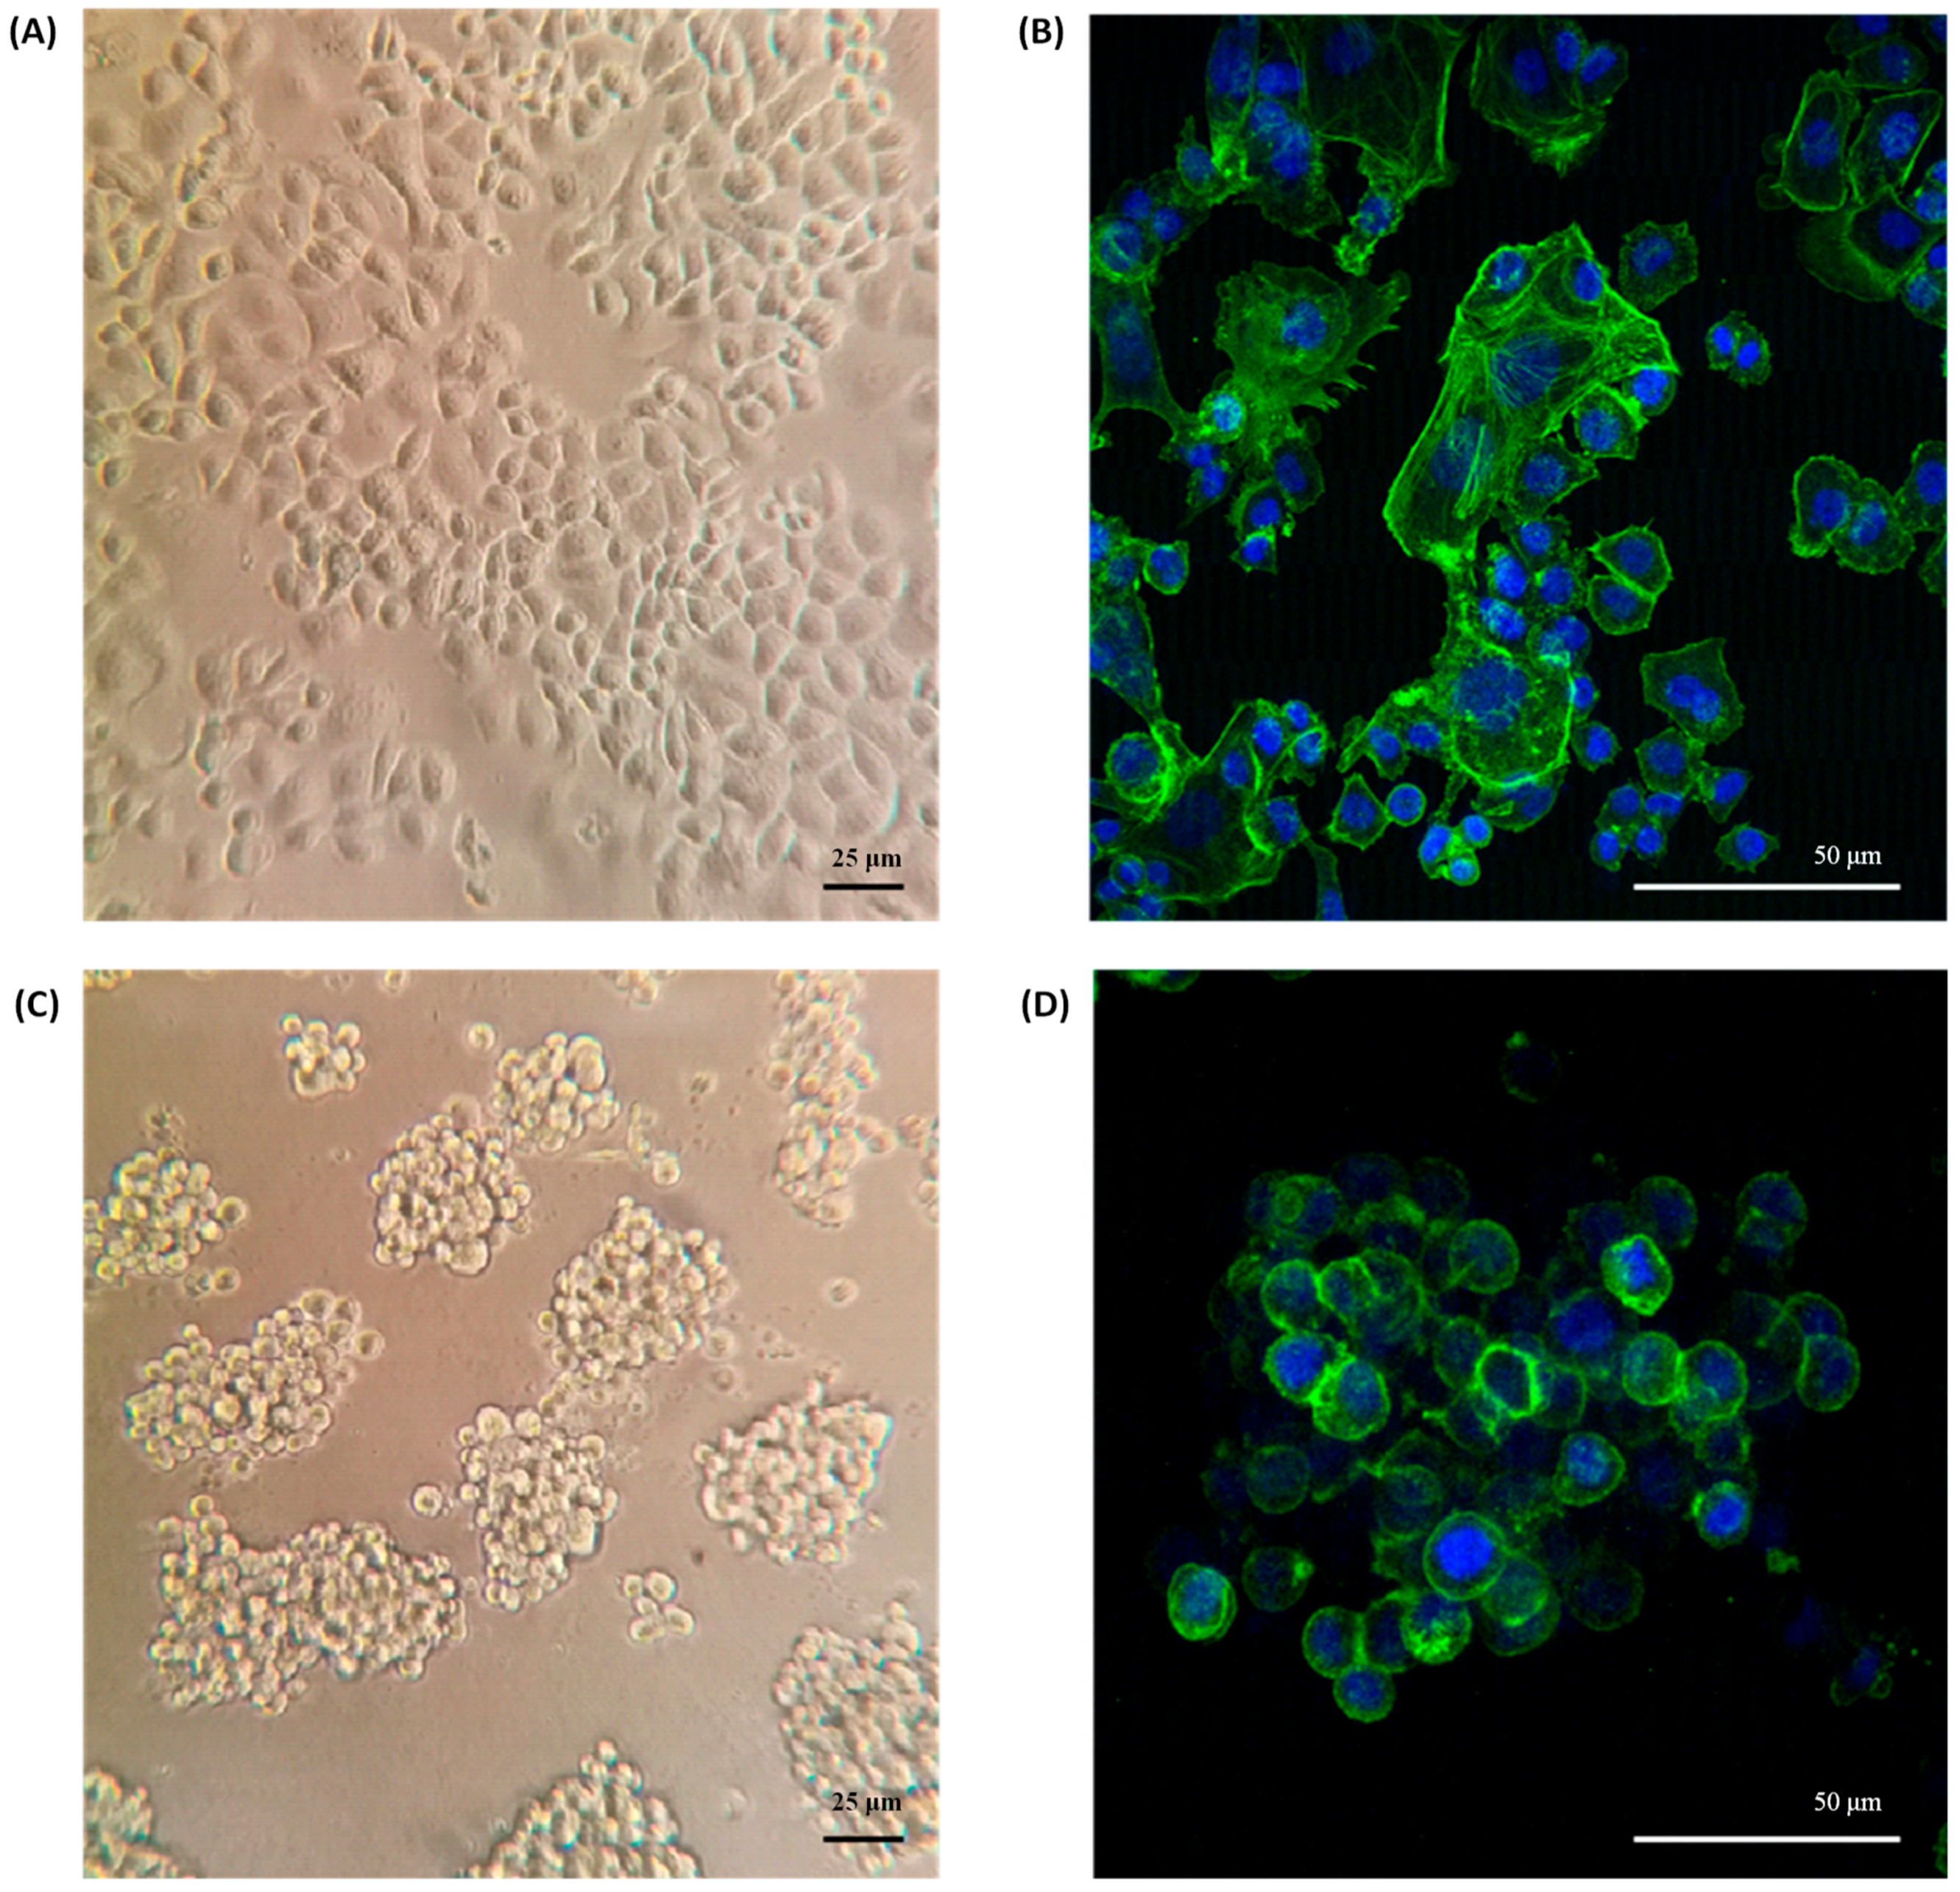
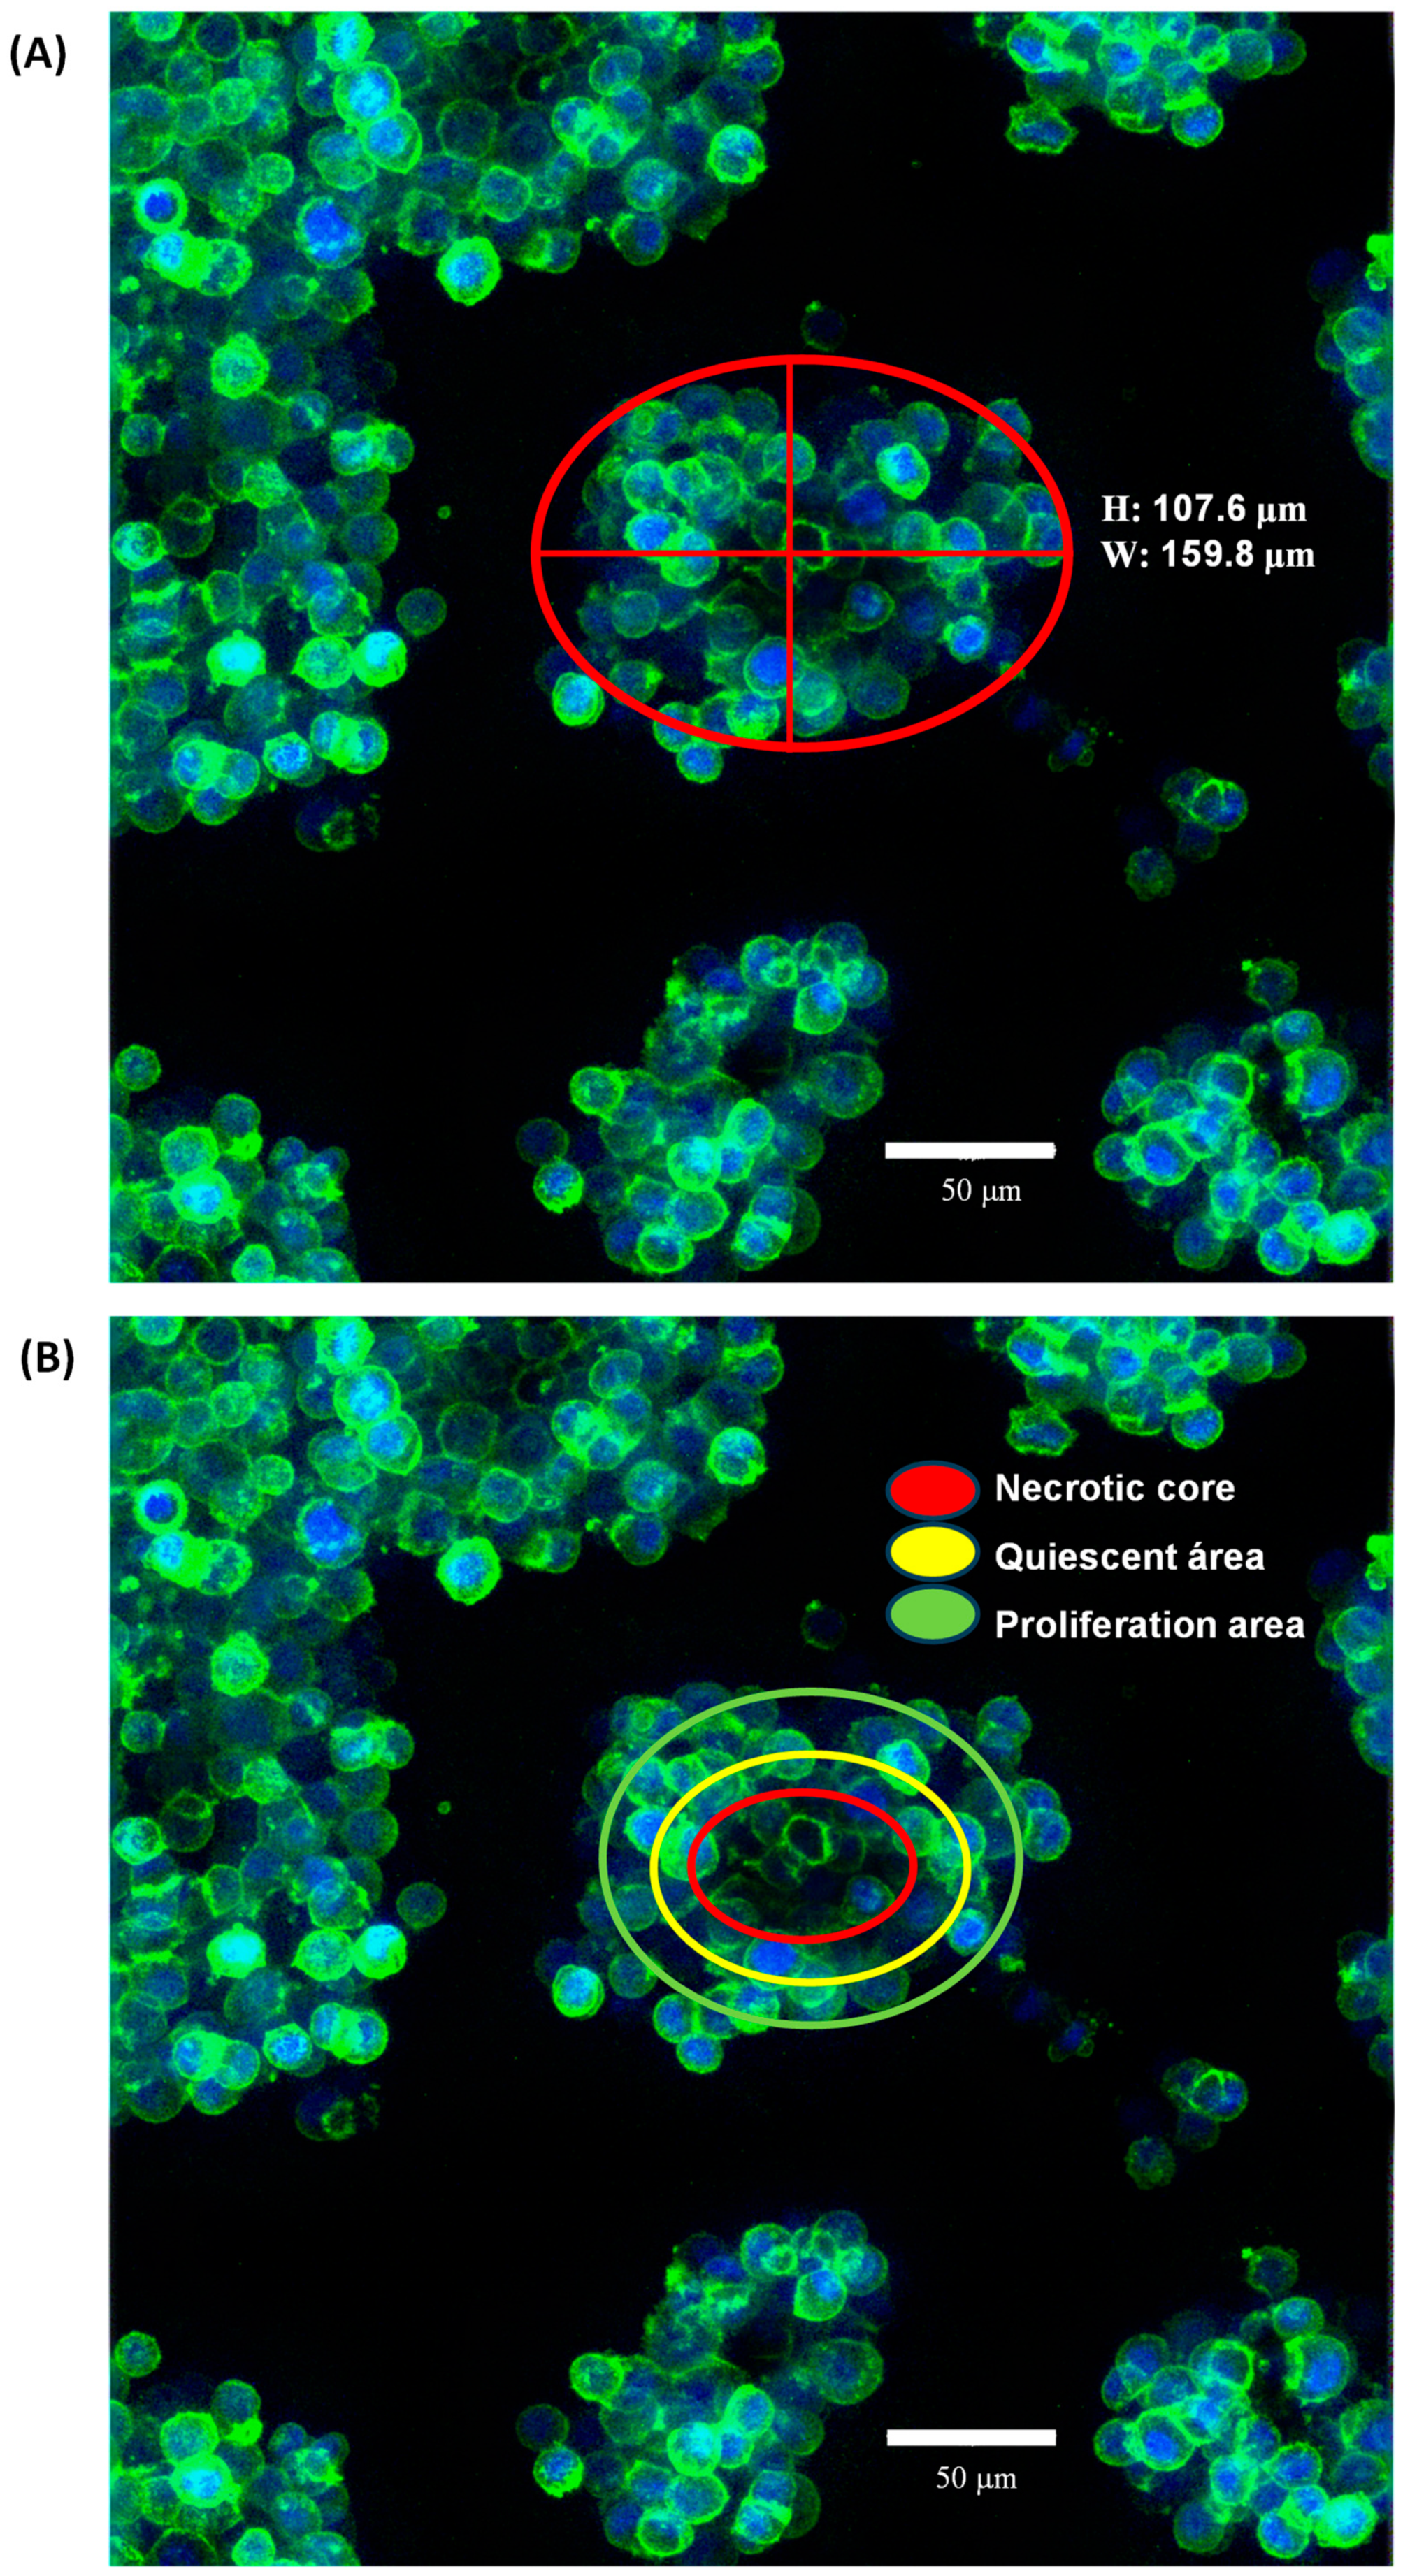
2.1. Organotypic 3D On-Top Cultures of SKBR3 form Grape Cluster-like Organoids
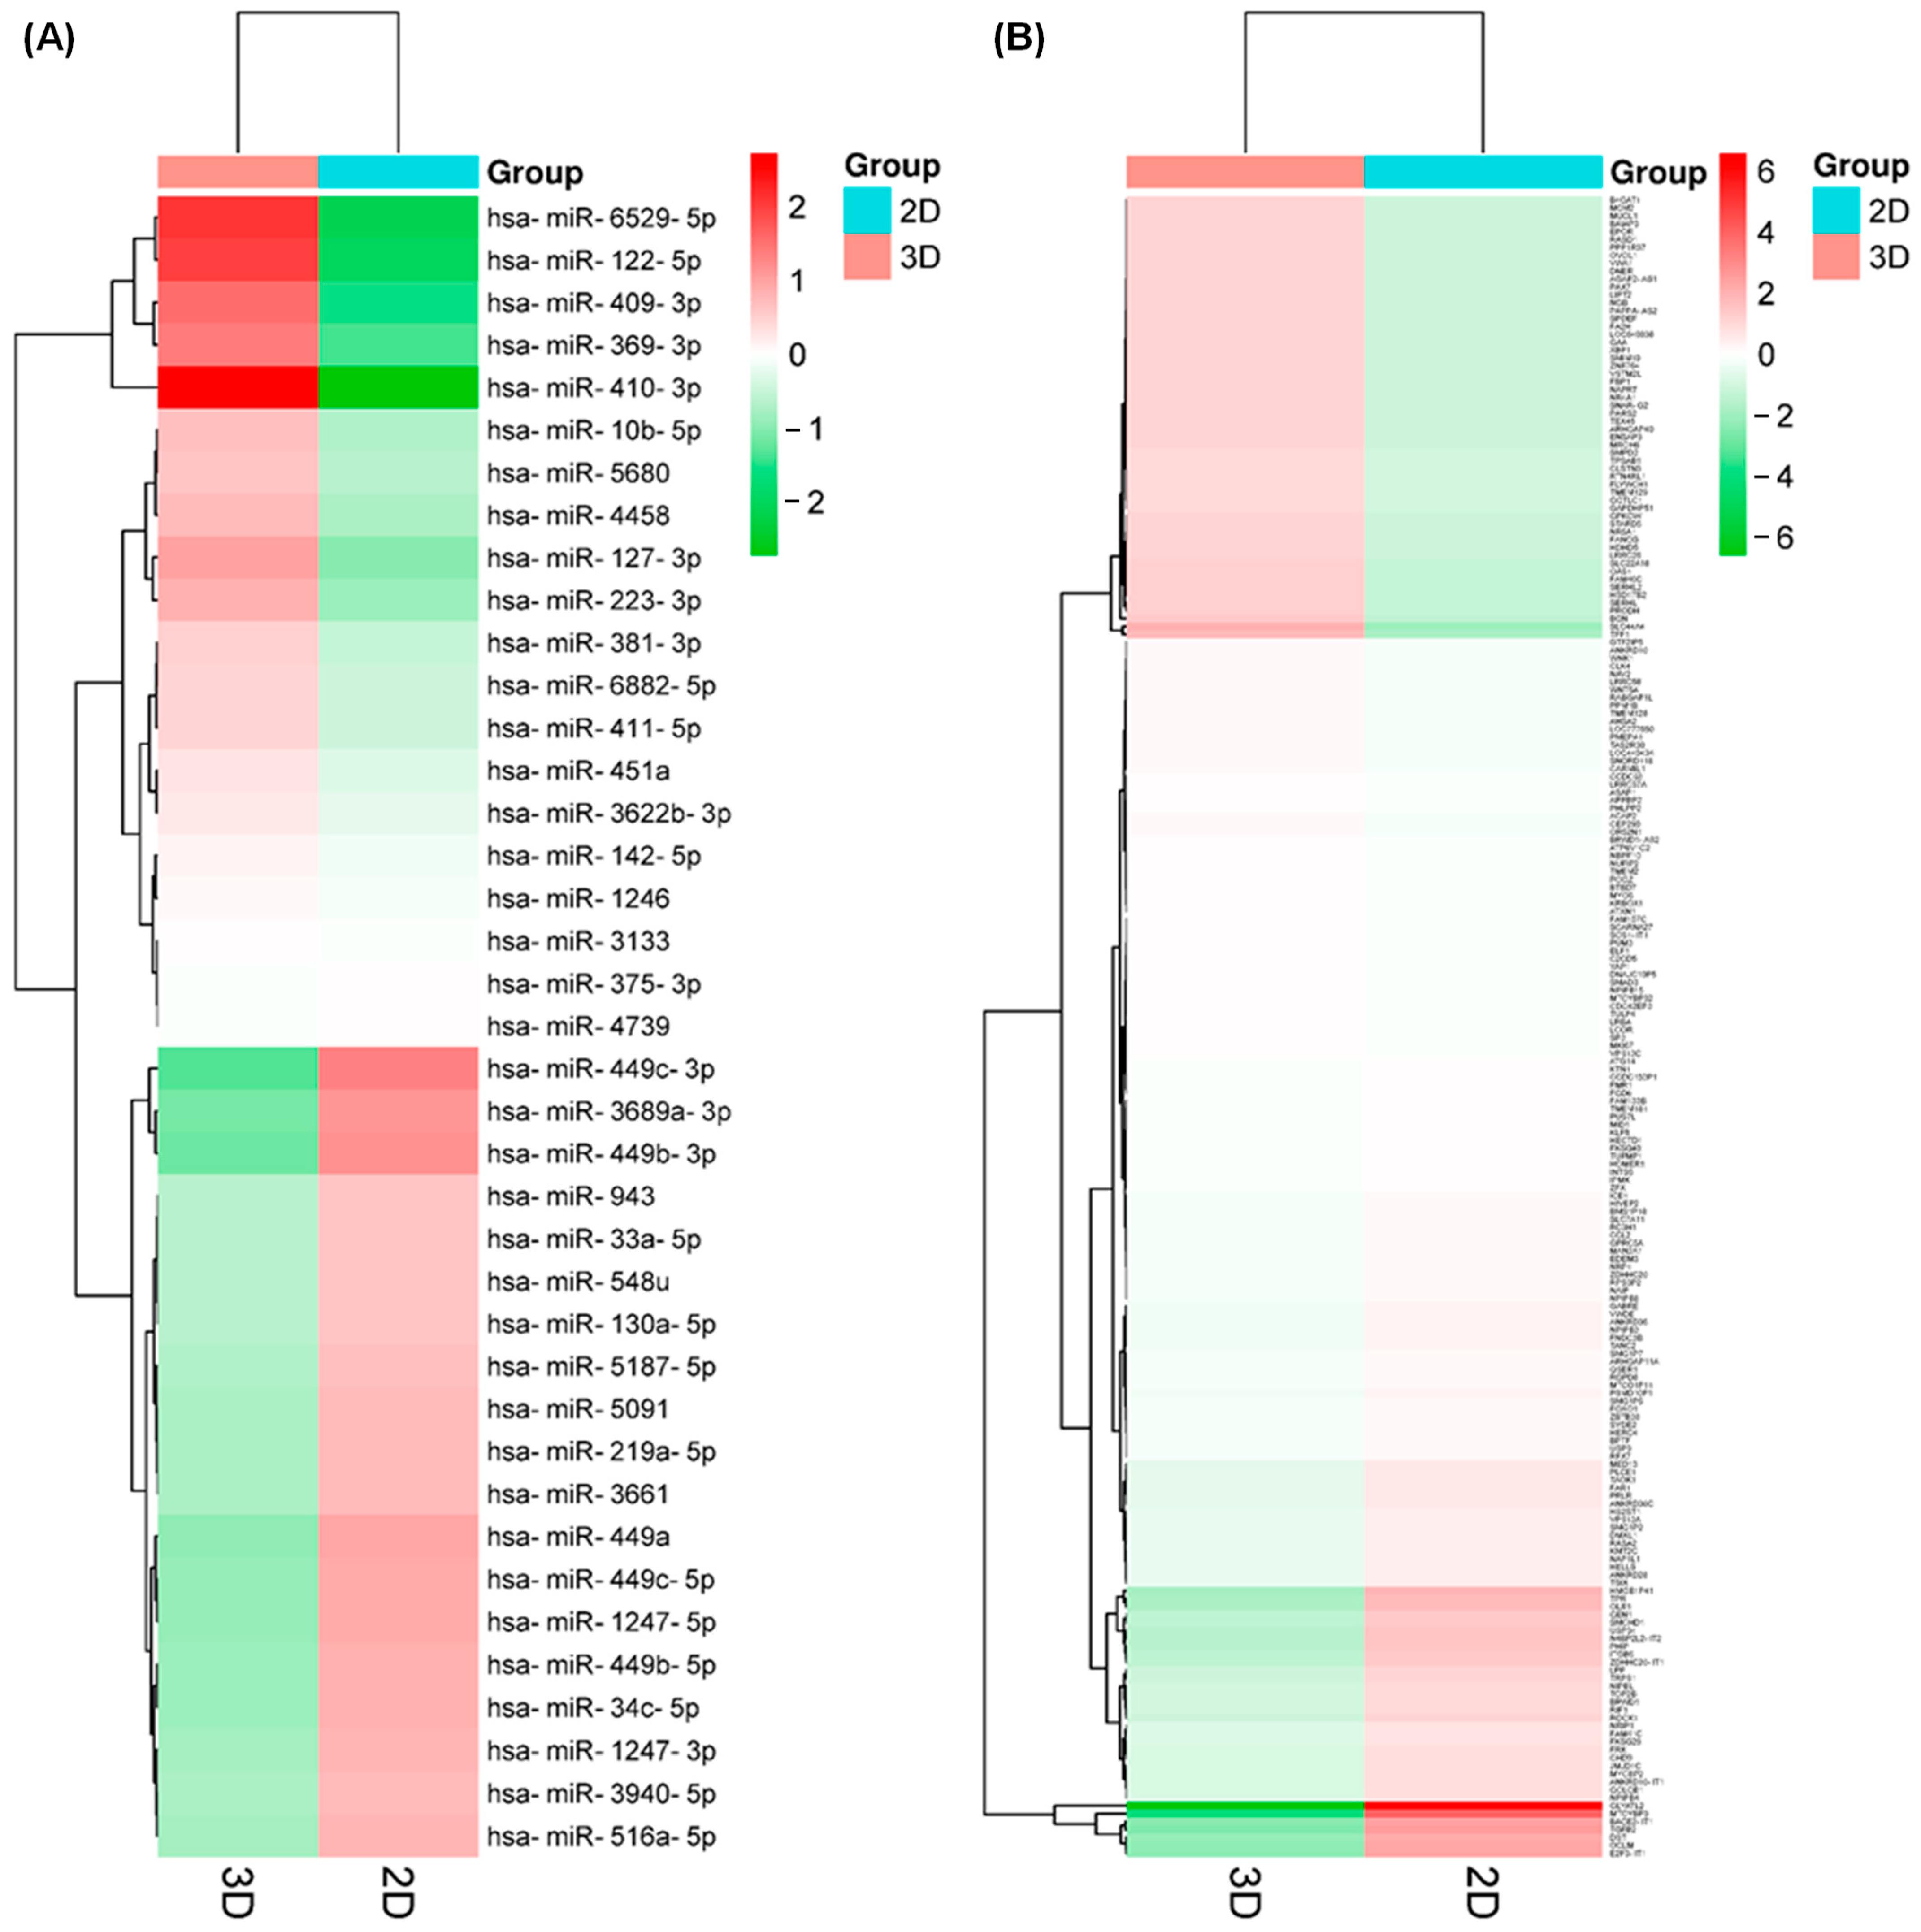
2.2. 3D Culture Induces Important Changes in Small RNAs Expression in SKBR3 Cells
2.3. The Expression Profile of mRNAs Is Downregulated under 3D Culture Conditions
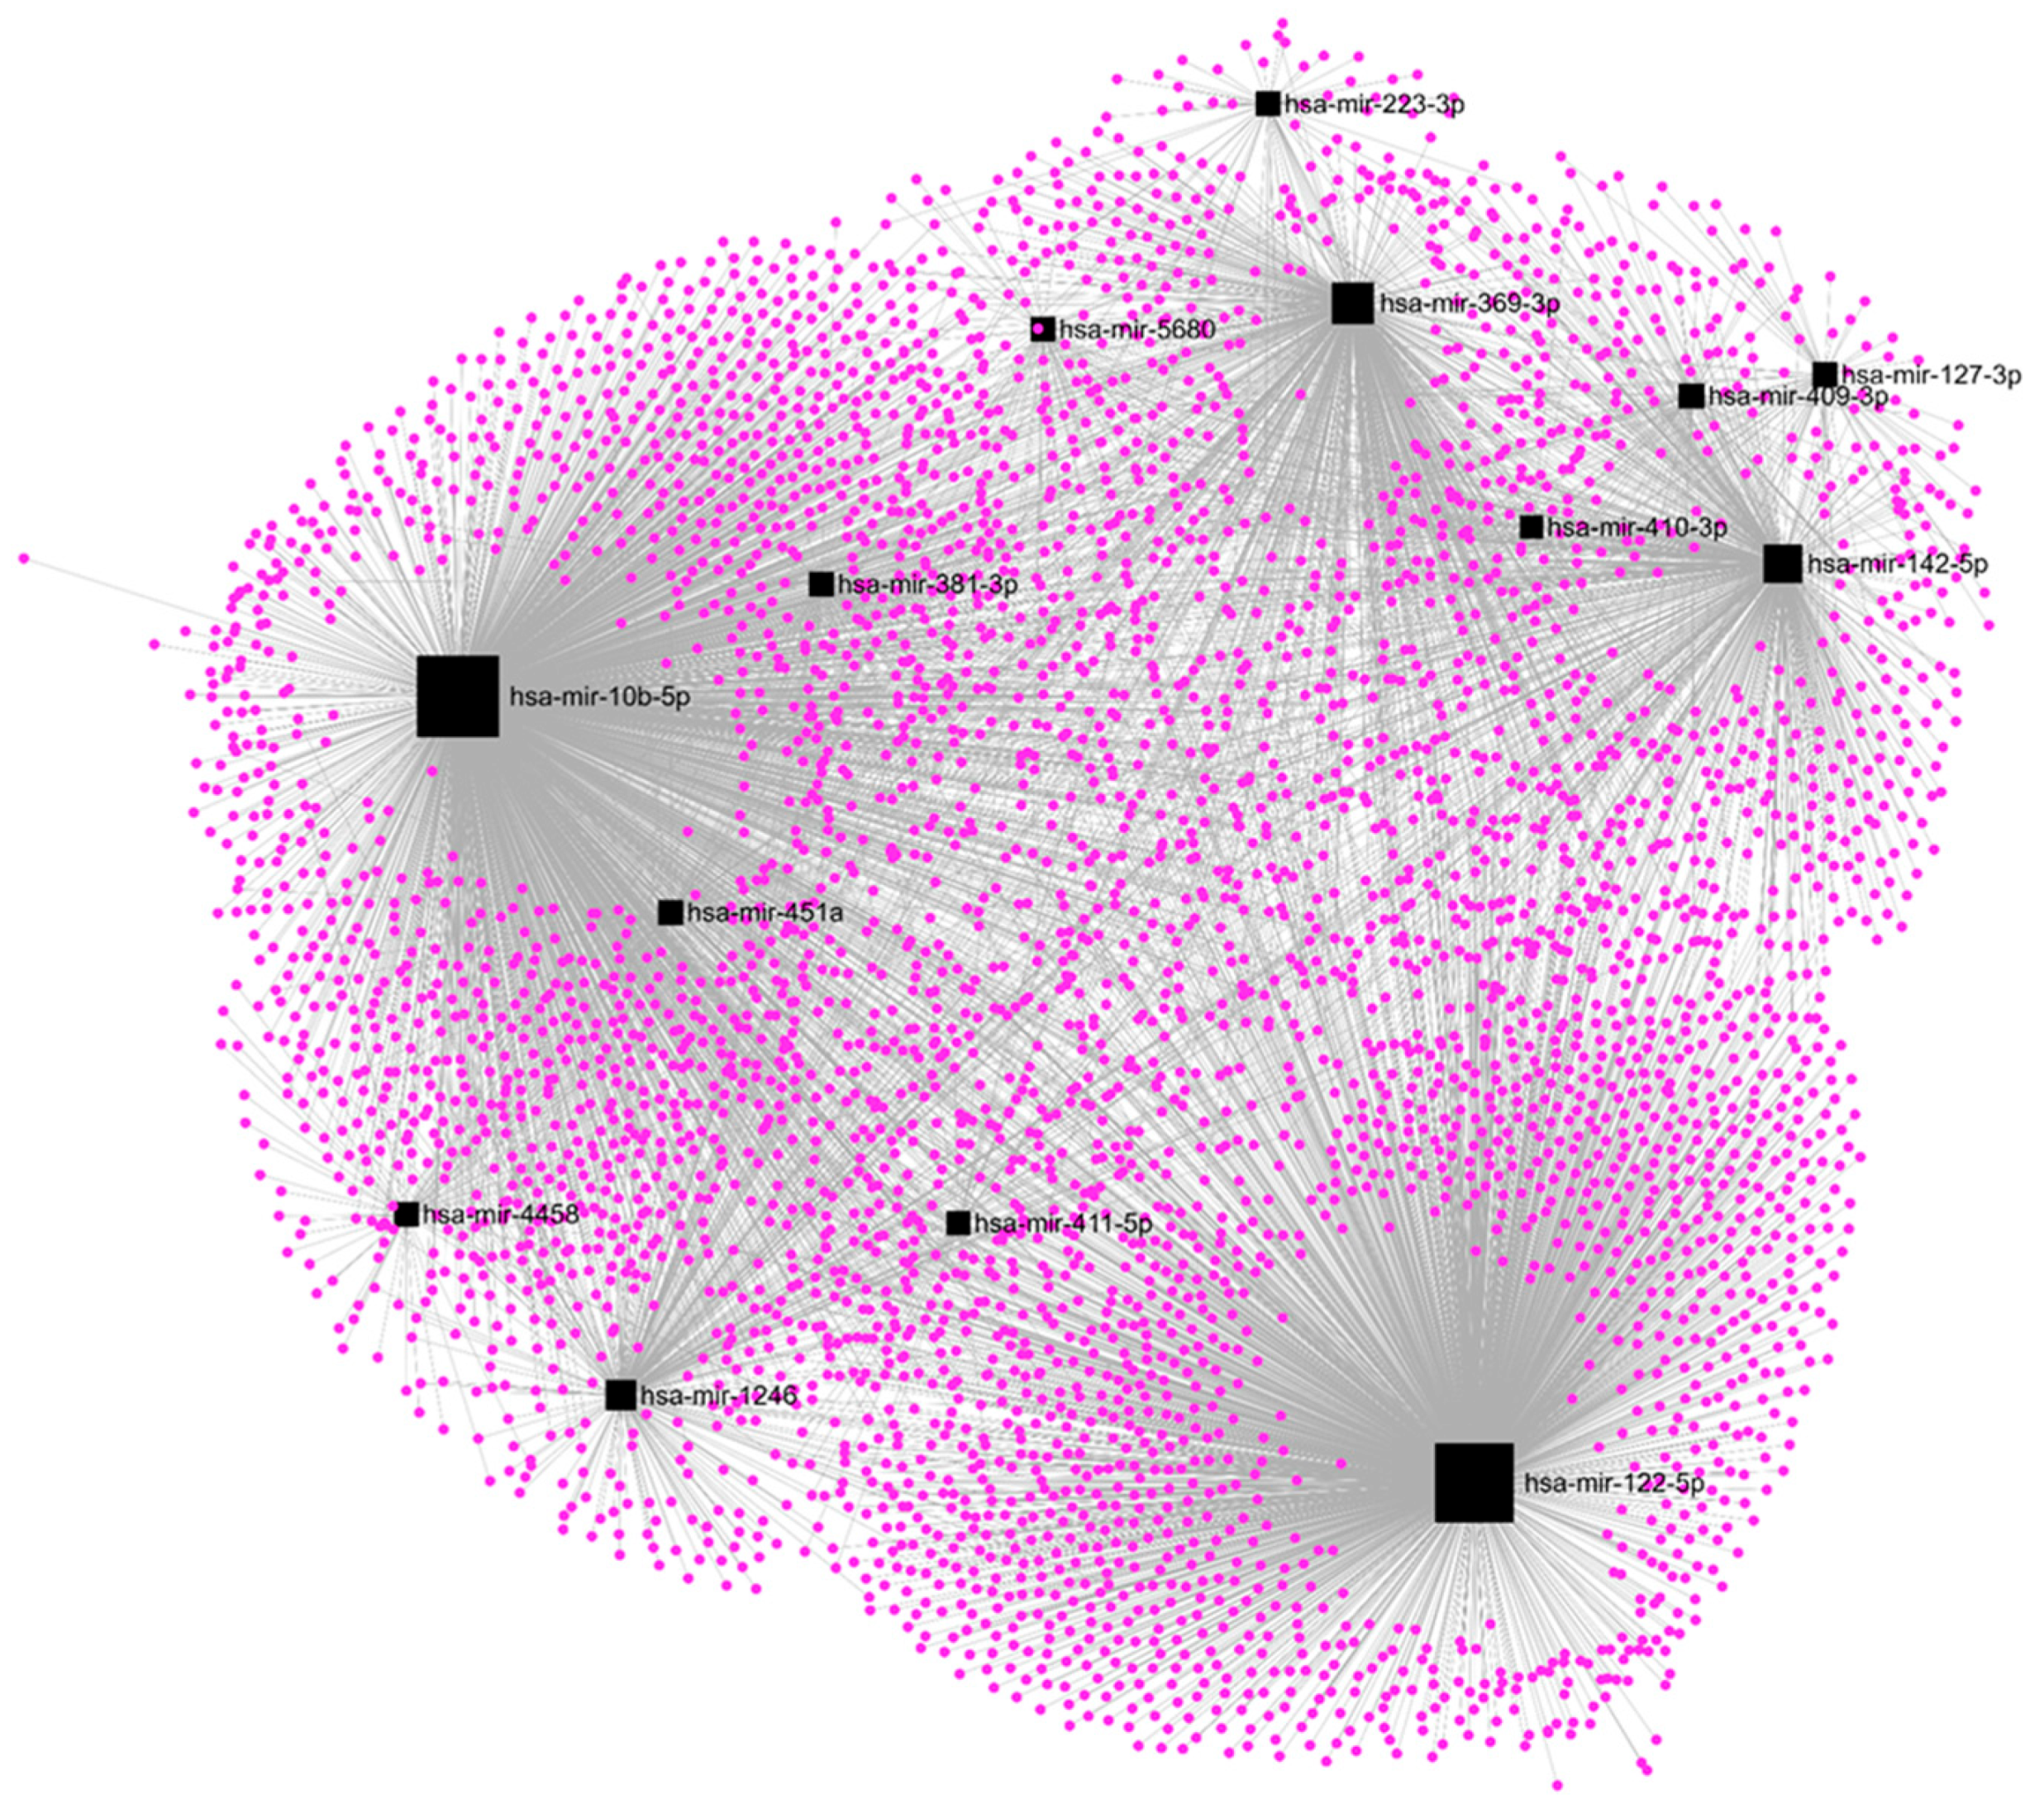
2.4. Upregulation of hsa-mir-122-5p, hsa-mir-369-3p, and hsa-mir-10b-5p Affects Most of the DE-mRNAs
3. Materials and Methods
3.1. Cell Culture
3.2. 3D Cell Culture System
3.3. Confocal Immunofluorescence Microscopy
3.4. RNA Isolation
3.5. Small RNA Sequencing (RNAseq)
3.6. Microarrays Hybridization and Analysis
3.7. In Silico Analysis
3.8. Statistical Analysis
4. Discussion
5. Conclusions
Supplementary Materials
Author Contributions
Funding
Institutional Review Board Statement
Informed Consent Statement
Data Availability Statement
Conflicts of Interest
References
- WHO. Cancer Fact Sheet. Available online: https://www.who.int/news-room/fact-sheets/detail/cancer (accessed on 9 January 2023).
- Siegel, R.L.; Miller, K.D.; Wagle, N.S.; Jemal, A. Cancer statistics, 2023. CA Cancer J. Clin. 2023, 73, 17–48. [Google Scholar] [CrossRef]
- Marusyk, A.; Polyak, K. Tumor heterogeneity: Causes and consequences. Biochim. Biophys. Acta 2010, 1805, 105–117. [Google Scholar] [CrossRef]
- Nunez-Olvera, S.I.; Aguilar-Arnal, L.; Cisneros-Villanueva, M.; Hidalgo-Miranda, A.; Marchat, L.A.; Salinas-Vera, Y.M.; Ramos-Payan, R.; Perez-Plasencia, C.; Carlos-Reyes, A.; Puente-Rivera, J.; et al. Breast Cancer Cells Reprogram the Oncogenic lncRNAs/mRNAs Coexpression Networks in Three-Dimensional Microenvironment. Cells 2022, 11, 3458. [Google Scholar] [CrossRef]
- Dai, X.; Cheng, H.; Bai, Z.; Li, J. Breast Cancer Cell Line Classification and Its Relevance with Breast Tumor Subtyping. J. Cancer 2017, 8, 3131–3141. [Google Scholar] [CrossRef]
- Watkins, E.J. Overview of breast cancer. JAAPA 2019, 32, 13–17. [Google Scholar] [CrossRef]
- Pernas, S.; Tolaney, S.M. HER2-positive breast cancer: New therapeutic frontiers and overcoming resistance. Adv. Med. Oncol 2019, 11, 1758835919833519. [Google Scholar] [CrossRef]
- Cukierman, E.; Pankov, R.; Stevens, D.R.; Yamada, K.M. Taking cell-matrix adhesions to the third dimension. Science 2001, 294, 1708–1712. [Google Scholar] [CrossRef]
- Nickerson, C.A.; Goodwin, T.J.; Terlonge, J.; Ott, C.M.; Buchanan, K.L.; Uicker, W.C.; Emami, K.; LeBlanc, C.L.; Ramamurthy, R.; Clarke, M.S.; et al. Three-dimensional tissue assemblies: Novel models for the study of Salmonella enterica serovar Typhimurium pathogenesis. Infect. Immun. 2001, 69, 7106–7120. [Google Scholar] [CrossRef]
- Kelm, J.M.; Timmins, N.E.; Brown, C.J.; Fussenegger, M.; Nielsen, L.K. Method for generation of homogeneous multicellular tumor spheroids applicable to a wide variety of cell types. Biotechnol. Bioeng. 2003, 83, 173–180. [Google Scholar] [CrossRef]
- Delarue, M.; Montel, F.; Vignjevic, D.; Prost, J.; Joanny, J.F.; Cappello, G. Compressive stress inhibits proliferation in tumor spheroids through a volume limitation. Biophys. J. 2014, 107, 1821–1828. [Google Scholar] [CrossRef]
- Nath, S.; Devi, G.R. Three-dimensional culture systems in cancer research: Focus on tumor spheroid model. Pharmacol. Ther. 2016, 163, 94–108. [Google Scholar] [CrossRef] [PubMed]
- Baal, N.; Widmer-Teske, R.; McKinnon, T.; Preissner, K.T.; Zygmunt, M.T. In vitro spheroid model of placental vasculogenesis: Does it work? Lab. Investig. 2009, 89, 152–163. [Google Scholar] [CrossRef] [PubMed]
- Ma, H.L.; Jiang, Q.; Han, S.; Wu, Y.; Cui Tomshine, J.; Wang, D.; Gan, Y.; Zou, G.; Liang, X.J. Multicellular tumor spheroids as an in vivo-like tumor model for three-dimensional imaging of chemotherapeutic and nano material cellular penetration. Mol. Imaging 2012, 11, 487–498. [Google Scholar] [CrossRef] [PubMed]
- Huanwen, W.; Zhiyong, L.; Xiaohua, S.; Xinyu, R.; Kai, W.; Tonghua, L. Intrinsic chemoresistance to gemcitabine is associated with constitutive and laminin-induced phosphorylation of FAK in pancreatic cancer cell lines. Mol. Cancer 2009, 8, 125. [Google Scholar] [CrossRef] [PubMed]
- Longati, P.; Jia, X.; Eimer, J.; Wagman, A.; Witt, M.R.; Rehnmark, S.; Verbeke, C.; Toftgard, R.; Lohr, M.; Heuchel, R.L. 3D pancreatic carcinoma spheroids induce a matrix-rich, chemoresistant phenotype offering a better model for drug testing. BMC Cancer 2013, 13, 95. [Google Scholar] [CrossRef]
- Souza, A.G.; Silva, I.B.B.; Campos-Fernandez, E.; Barcelos, L.S.; Souza, J.B.; Marangoni, K.; Goulart, L.R.; Alonso-Goulart, V. Comparative Assay of 2D and 3D Cell Culture Models: Proliferation, Gene Expression and Anticancer Drug Response. Curr. Pharm. Des. 2018, 24, 1689–1694. [Google Scholar] [CrossRef]
- Kiss, D.L.; Windus, L.C.; Avery, V.M. Chemokine receptor expression on integrin-mediated stellate projections of prostate cancer cells in 3D culture. Cytokine 2013, 64, 122–130. [Google Scholar] [CrossRef]
- Schmidt, M.; Scholz, C.J.; Polednik, C.; Roller, J. Spheroid-based 3-dimensional culture models: Gene expression and functionality in head and neck cancer. Oncol. Rep. 2016, 35, 2431–2440. [Google Scholar] [CrossRef]
- Li, X.; Zeng, Z.; Wang, J.; Wu, Y.; Chen, W.; Zheng, L.; Xi, T.; Wang, A.; Lu, Y. MicroRNA-9 and breast cancer. Biomed. Pharmacother. Biomed. Pharmacother. 2020, 122, 109687. [Google Scholar] [CrossRef]
- Calin, G.A.; Croce, C.M. MicroRNA signatures in human cancers. Nat. Rev. Cancer 2006, 6, 857–866. [Google Scholar] [CrossRef]
- Lin, S.; Gregory, R.I. MicroRNA biogenesis pathways in cancer. Nat. Rev. Cancer 2015, 15, 321–333. [Google Scholar] [CrossRef] [PubMed]
- Lerner, R.G.; Petritsch, C. A microRNA-operated switch of asymmetric-to-symmetric cancer stem cell divisions. Nat. Cell Biol. 2014, 16, 212–214. [Google Scholar] [CrossRef] [PubMed]
- Pencheva, N.; Tavazoie, S.F. Control of metastatic progression by microRNA regulatory networks. Nat. Cell Biol. 2013, 15, 546–554. [Google Scholar] [CrossRef] [PubMed]
- Koedoot, E.; Wolters, L.; Smid, M.; Stoilov, P.; Burger, G.A.; Herpers, B.; Yan, K.; Price, L.S.; Martens, J.W.M.; Le Devedec, S.E.; et al. Differential reprogramming of breast cancer subtypes in 3D cultures and implications for sensitivity to targeted therapy. Sci. Rep. 2021, 11, 7259. [Google Scholar] [CrossRef]
- Kunigenas, L.; Stankevicius, V.; Dulskas, A.; Budginaite, E.; Alzbutas, G.; Stratilatovas, E.; Cordes, N.; Suziedelis, K. 3D Cell Culture-Based Global miRNA Expression Analysis Reveals miR-142-5p as a Theranostic Biomarker of Rectal Cancer Following Neoadjuvant Long-Course Treatment. Biomolecules 2020, 10, 613. [Google Scholar] [CrossRef]
- Salinas-Vera, Y.M.; Valdes, J.; Hidalgo-Miranda, A.; Cisneros-Villanueva, M.; Marchat, L.A.; Nunez-Olvera, S.I.; Ramos-Payan, R.; Perez-Plasencia, C.; Arriaga-Pizano, L.A.; Prieto-Chavez, J.L.; et al. Three-Dimensional Organotypic Cultures Reshape the microRNAs Transcriptional Program in Breast Cancer Cells. Cancers 2022, 14, 2490. [Google Scholar] [CrossRef]
- Franchi, M.; Piperigkou, Z.; Riti, E.; Masola, V.; Onisto, M.; Karamanos, N.K. Long filopodia and tunneling nanotubes define new phenotypes of breast cancer cells in 3D cultures. Matrix Biol. Plus 2020, 6–7, 100026. [Google Scholar] [CrossRef]
- Han, S.J.; Kwon, S.; Kim, K.S. Challenges of applying multicellular tumor spheroids in preclinical phase. Cancer Cell Int. 2021, 21, 152. [Google Scholar] [CrossRef]
- Kenny, P.A.; Lee, G.Y.; Myers, C.A.; Neve, R.M.; Semeiks, J.R.; Spellman, P.T.; Lorenz, K.; Lee, E.H.; Barcellos-Hoff, M.H.; Petersen, O.W.; et al. The morphologies of breast cancer cell lines in three-dimensional assays correlate with their profiles of gene expression. Mol. Oncol. 2007, 1, 84–96. [Google Scholar] [CrossRef]
- Huang, H.; Ding, Y.; Sun, X.S.; Nguyen, T.A. Peptide hydrogelation and cell encapsulation for 3D culture of MCF-7 breast cancer cells. PLoS ONE 2013, 8, e59482. [Google Scholar] [CrossRef]
- Schroeder, A.; Mueller, O.; Stocker, S.; Salowsky, R.; Leiber, M.; Gassmann, M.; Lightfoot, S.; Menzel, W.; Granzow, M.; Ragg, T. The RIN: An RNA integrity number for assigning integrity values to RNA measurements. BMC Mol. Biol. 2006, 7, 3. [Google Scholar] [CrossRef] [PubMed]
- Streuli, C.H.; Bailey, N.; Bissell, M.J. Control of mammary epithelial differentiation: Basement membrane induces tissue-specific gene expression in the absence of cell-cell interaction and morphological polarity. J. Cell Biol. 1991, 115, 1383–1395. [Google Scholar] [CrossRef]
- Loessner, D.; Stok, K.S.; Lutolf, M.P.; Hutmacher, D.W.; Clements, J.A.; Rizzi, S.C. Bioengineered 3D platform to explore cell-ECM interactions and drug resistance of epithelial ovarian cancer cells. Biomaterials 2010, 31, 8494–8506. [Google Scholar] [CrossRef]
- Pirsko, V.; Cakstina, I.; Priedite, M.; Dortane, R.; Feldmane, L.; Nakazawa-Miklasevica, M.; Daneberga, Z.; Gardovskis, J.; Miklasevics, E. An Effect of Culture Media on Epithelial Differentiation Markers in Breast Cancer Cell Lines MCF7, MDA-MB-436 and SkBr3. Medicina 2018, 54, 11. [Google Scholar] [CrossRef] [PubMed]
- Boyer, J.Z.; Phillips, G.D.L.; Nitta, H.; Garsha, K.; Admire, B.; Kraft, R.; Dennis, E.; Vela, E.; Towne, P. Activity of trastuzumab emtansine (T-DM1) in 3D cell culture. Breast Cancer Res. Treat. 2021, 188, 65–75. [Google Scholar] [CrossRef] [PubMed]
- Froehlich, K.; Haeger, J.D.; Heger, J.; Pastuschek, J.; Photini, S.M.; Yan, Y.; Lupp, A.; Pfarrer, C.; Mrowka, R.; Schleussner, E.; et al. Generation of Multicellular Breast Cancer Tumor Spheroids: Comparison of Different Protocols. J. Mammary Gland Biol. Neoplasia 2016, 21, 89–98. [Google Scholar] [CrossRef]
- Nguyen, H.T.; Li, C.; Lin, Z.; Zhuang, Y.; Flemington, E.K.; Burow, M.E.; Lin, Y.I.; Shan, B. The microRNA expression associated with morphogenesis of breast cancer cells in three-dimensional organotypic culture. Oncol. Rep. 2012, 28, 117–126. [Google Scholar] [CrossRef]
- Wang, Z.; Li, S.; Xu, F.; Fu, J.; Sun, J.; Gan, X.; Yang, C.; Mao, Z. ncRNAs-mediated high expression of TIMM8A correlates with poor prognosis and act as an oncogene in breast cancer. Cancer Cell Int. 2022, 22, 177. [Google Scholar] [CrossRef]
- Liu, J.; Wang, P.; Zhang, P.; Zhang, X.; Du, H.; Liu, Q.; Huang, B.; Qian, C.; Zhang, S.; Zhu, W.; et al. An integrative bioinformatics analysis identified miR-375 as a candidate key regulator of malignant breast cancer. J. Appl. Genet. 2019, 60, 335–346. [Google Scholar] [CrossRef]
- Zhang, Y.; Dong, X.; Guo, X.; Li, C.; Fan, Y.; Liu, P.; Yuan, D.; Ma, X.; Wang, J.; Zheng, J.; et al. LncRNA-BC069792 suppresses tumor progression by targeting KCNQ4 in breast cancer. Mol. Cancer 2023, 22, 41. [Google Scholar] [CrossRef]
- Xiao, B.; Zhang, W.; Chen, L.; Hang, J.; Wang, L.; Zhang, R.; Liao, Y.; Chen, J.; Ma, Q.; Sun, Z.; et al. Analysis of the miRNA-mRNA-lncRNA network in human estrogen receptor-positive and estrogen receptor-negative breast cancer based on TCGA data. Gene 2018, 658, 28–35. [Google Scholar] [CrossRef] [PubMed]
- Pizzamiglio, S.; Cosentino, G.; Ciniselli, C.M.; De Cecco, L.; Cataldo, A.; Plantamura, I.; Triulzi, T.; El-Abed, S.; Wang, Y.; Bajji, M.; et al. What if the future of HER2-positive breast cancer patients was written in miRNAs? An exploratory analysis from NeoALTTO study. Cancer Med. 2022, 11, 332–339. [Google Scholar] [CrossRef] [PubMed]
- Zheng, Y.; Wang, M.; Wang, S.; Xu, P.; Deng, Y.; Lin, S.; Li, N.; Liu, K.; Zhu, Y.; Zhai, Z.; et al. LncRNA MEG3 rs3087918 was associated with a decreased breast cancer risk in a Chinese population: A case-control study. BMC Cancer 2020, 20, 659. [Google Scholar] [CrossRef]
- Rawlings-Goss, R.A.; Campbell, M.C.; Tishkoff, S.A. Global population-specific variation in miRNA associated with cancer risk and clinical biomarkers. BMC Med. Genom. 2014, 7, 53. [Google Scholar] [CrossRef] [PubMed]
- Chen, Z.; Zhong, S.; Zhang, Z.; Tang, J. PHF20 is a Novel Prognostic Biomarker and Correlated with Immune Status in Breast Cancer. Biochem. Genet. 2023, 61, 1369–1386. [Google Scholar] [CrossRef] [PubMed]
- Zheng, L.; Wang, J.; Jiang, H.; Dong, H. A Novel Necroptosis-Related miRNA Signature for Predicting the Prognosis of Breast Cancer Metastasis. Dis. Markers 2022, 2022, 3391878. [Google Scholar] [CrossRef]
- Liu, X.; Wang, J.; Zhang, G. miR-4458 regulates cell proliferation and apoptosis through targeting SOCS1 in triple-negative breast cancer. J. Cell. Biochem. 2019, 120, 12943–12948. [Google Scholar] [CrossRef]
- Wu, J.; Miao, J.; Ding, Y.; Zhang, Y.; Huang, X.; Zhou, X.; Tang, R. MiR-4458 inhibits breast cancer cell growth, migration, and invasiveness by targeting CPSF4. Biochem. Cell Biol. Biochim. Biol. Cell. 2019, 97, 722–730. [Google Scholar] [CrossRef]
- Elango, R.; Alsaleh, K.A.; Vishnubalaji, R.; Manikandan, M.; Ali, A.M.; Abd El-Aziz, N.; Altheyab, A.; Al-Rikabi, A.; Alfayez, M.; Aldahmash, A.; et al. MicroRNA Expression Profiling on Paired Primary and Lymph Node Metastatic Breast Cancer Revealed Distinct microRNA Profile Associated With LNM. Front. Oncol. 2020, 10, 756. [Google Scholar] [CrossRef]
- Wang, P.; Chen, W.; Zhang, Y.; Zhong, Q.; Li, Z.; Wang, Y. MicroRNA-1246 suppresses the metastasis of breast cancer cells by targeting the DYRK1A/PGRN axis to prevent the epithelial-mesenchymal transition. Mol. Biol. Rep. 2022, 49, 2711–2721. [Google Scholar] [CrossRef]
- Denkiewicz, M.; Saha, I.; Rakshit, S.; Sarkar, J.P.; Plewczynski, D. Identification of Breast Cancer Subtype Specific MicroRNAs Using Survival Analysis to Find Their Role in Transcriptomic Regulation. Front. Genet. 2019, 10, 1047. [Google Scholar] [CrossRef] [PubMed]
- Pane, K.; Zanfardino, M.; Grimaldi, A.M.; Baldassarre, G.; Salvatore, M.; Incoronato, M.; Franzese, M. Discovering Common miRNA Signatures Underlying Female-Specific Cancers via a Machine Learning Approach Driven by the Cancer Hallmark ERBB. Biomedicines 2022, 10, 1306. [Google Scholar] [CrossRef] [PubMed]
- Fang, R.; Zhu, Y.; Hu, L.; Khadka, V.S.; Ai, J.; Zou, H.; Ju, D.; Jiang, B.; Deng, Y.; Hu, X. Plasma MicroRNA Pair Panels as Novel Biomarkers for Detection of Early Stage Breast Cancer. Front. Physiol. 2018, 9, 1879. [Google Scholar] [CrossRef] [PubMed]
- Zhang, Z.; Zhang, L.; Yu, G.; Sun, Z.; Wang, T.; Tian, X.; Duan, X.; Zhang, C. Exosomal miR-1246 and miR-155 as predictive and prognostic biomarkers for trastuzumab-based therapy resistance in HER2-positive breast cancer. Cancer Chemother. Pharmacol. 2020, 86, 761–772. [Google Scholar] [CrossRef]
- Zhai, L.Y.; Li, M.X.; Pan, W.L.; Chen, Y.; Li, M.M.; Pang, J.X.; Zheng, L.; Chen, J.X.; Duan, W.J. In Situ Detection of Plasma Exosomal MicroRNA-1246 for Breast Cancer Diagnostics by a Au Nanoflare Probe. ACS Appl. Mater. Interfaces 2018, 10, 39478–39486. [Google Scholar] [CrossRef]
- Liu, H.; Yang, Z.; Lu, W.; Chen, Z.; Chen, L.; Han, S.; Wu, X.; Cai, T.; Cai, Y. Chemokines and chemokine receptors: A new strategy for breast cancer therapy. Cancer Med. 2020, 9, 3786–3799. [Google Scholar] [CrossRef]
- Yoshimura, T. The chemokine MCP-1 (CCL2) in the host interaction with cancer: A foe or ally? Cell Mol. Immunol. 2018, 15, 335–345. [Google Scholar] [CrossRef]
- Xu, M.; Wang, Y.; Xia, R.; Wei, Y.; Wei, X. Role of the CCL2-CCR2 signalling axis in cancer: Mechanisms and therapeutic targeting. Cell Prolif. 2021, 54, e13115. [Google Scholar] [CrossRef]
- Asem, M.S.; Buechler, S.; Wates, R.B.; Miller, D.L.; Stack, M.S. Wnt5a Signaling in Cancer. Cancers 2016, 8, 79. [Google Scholar] [CrossRef]
- Serra, R.; Easter, S.L.; Jiang, W.; Baxley, S.E. Wnt5a as an effector of TGFbeta in mammary development and cancer. J. Mammary Gland Biol. Neoplasia 2011, 16, 157–167. [Google Scholar] [CrossRef]
- Prasad, C.P.; Chaurasiya, S.K.; Guilmain, W.; Andersson, T. WNT5A signaling impairs breast cancer cell migration and invasion via mechanisms independent of the epithelial-mesenchymal transition. J. Exp. Clin. Cancer Res. CR 2016, 35, 144. [Google Scholar] [CrossRef] [PubMed]
- Borcherding, N.; Kusner, D.; Kolb, R.; Xie, Q.; Li, W.; Yuan, F.; Velez, G.; Askeland, R.; Weigel, R.J.; Zhang, W. Paracrine WNT5A Signaling Inhibits Expansion of Tumor-Initiating Cells. Cancer Res. 2015, 75, 1972–1982. [Google Scholar] [CrossRef] [PubMed]
- Dong, Y.; Ma, W.-M.; Shi, Z.-D.; Zhang, Z.-G.; Zhou, J.-H.; Li, Y.; Zhang, S.-Q.; Pang, K.; Li, B.-B.; Zhang, W.-D.; et al. Role of NRP1 in Bladder Cancer Pathogenesis and Progression. Front. Oncol. 2021, 11, 685980. [Google Scholar] [CrossRef] [PubMed]
- Kawakami, T.; Tokunaga, T.; Hatanaka, H.; Kijima, H.; Yamazaki, H.; Abe, Y.; Osamura, Y.; Inoue, H.; Ueyama, Y.; Nakamura, M. Neuropilin 1 and neuropilin 2 co-expression is significantly correlated with increased vascularity and poor prognosis in nonsmall cell lung carcinoma. Cancer 2002, 95, 2196–2201. [Google Scholar] [CrossRef] [PubMed]
- Jubb, A.M.; Strickland, L.A.; Liu, S.D.; Mak, J.; Schmidt, M.; Koeppen, H. Neuropilin-1 expression in cancer and development. J. Pathol. 2012, 226, 50–60. [Google Scholar] [CrossRef]
- Liu, R.; Zhou, Z.; Huang, J.; Chen, C. PMEPA1 promotes androgen receptor-negative prostate cell proliferation through suppressing the Smad3/4-c-Myc-p21 Cip1 signaling pathway. J. Pathol. 2011, 223, 683–694. [Google Scholar] [CrossRef]
- Vo Nguyen, T.T.; Watanabe, Y.; Shiba, A.; Noguchi, M.; Itoh, S.; Kato, M. TMEPAI/PMEPA1 enhances tumorigenic activities in lung cancer cells. Cancer Sci. 2014, 105, 334–341. [Google Scholar] [CrossRef]
- Singha, P.K.; Pandeswara, S.; Geng, H.; Lan, R.; Venkatachalam, M.A.; Saikumar, P. TGF-beta induced TMEPAI/PMEPA1 inhibits canonical Smad signaling through R-Smad sequestration and promotes non-canonical PI3K/Akt signaling by reducing PTEN in triple negative breast cancer. Genes Cancer 2014, 5, 320–336. [Google Scholar] [CrossRef]
- Watanabe, Y.; Itoh, S.; Goto, T.; Ohnishi, E.; Inamitsu, M.; Itoh, F.; Satoh, K.; Wiercinska, E.; Yang, W.; Shi, L.; et al. TMEPAI, a transmembrane TGF-beta-inducible protein, sequesters Smad proteins from active participation in TGF-beta signaling. Mol. Cell 2010, 37, 123–134. [Google Scholar] [CrossRef]
- Puteri, M.U.; Watanabe, Y.; Wardhani, B.W.K.; Amalia, R.; Abdelaziz, M.; Kato, M. PMEPA1/TMEPAI isoforms function via its PY and Smad-interaction motifs for tumorigenic activities of breast cancer cells. Genes Cells 2020, 25, 375–390. [Google Scholar] [CrossRef]
- Farhan, M.; Wang, H.; Gaur, U.; Little, P.J.; Xu, J.; Zheng, W. FOXO Signaling Pathways as Therapeutic Targets in Cancer. Int. J. Biol. Sci 2017, 13, 815–827. [Google Scholar] [CrossRef]
- Chae, Y.C.; Kim, J.Y.; Park, J.W.; Kim, K.B.; Oh, H.; Lee, K.H.; Seo, S.B. FOXO1 degradation via G9a-mediated methylation promotes cell proliferation in colon cancer. Nucleic Acids Res. 2019, 47, 1692–1705. [Google Scholar] [CrossRef] [PubMed]
- Kim, C.G.; Lee, H.; Gupta, N.; Ramachandran, S.; Kaushik, I.; Srivastava, S.; Kim, S.-H.; Srivastava, S.K. Role of Forkhead Box Class O proteins in cancer progression and metastasis. Semin. Cancer Biol. 2018, 50, 142–151. [Google Scholar] [CrossRef] [PubMed]
- Paik, J.H.; Kollipara, R.; Chu, G.; Ji, H.; Xiao, Y.; Ding, Z.; Miao, L.; Tothova, Z.; Horner, J.W.; Carrasco, D.R.; et al. FoxOs are lineage-restricted redundant tumor suppressors and regulate endothelial cell homeostasis. Cell 2007, 128, 309–323. [Google Scholar] [CrossRef] [PubMed]
- Shiraishi-Yamaguchi, Y.; Furuichi, T. The Homer family proteins. Genome Biol. 2007, 8, 206. [Google Scholar] [CrossRef] [PubMed]
- Liu, Q.; He, L.; Li, S.; Li, F.; Deng, G.; Huang, X.; Yang, M.; Xiao, Y.; Chen, X.; Ouyang, Y.; et al. HOMER3 facilitates growth factor-mediated beta-Catenin tyrosine phosphorylation and activation to promote metastasis in triple negative breast cancer. J. Hematol. Oncol. 2021, 14, 6. [Google Scholar] [CrossRef]
- Cui, X.; Liang, H.; Hao, C.; Jing, X. Homer1 is a Potential Biomarker for Prognosis in Human Colorectal Carcinoma, Possibly in Association with G3BP1 Signaling. Cancer Manag. Res. 2020, 12, 2899–2909. [Google Scholar] [CrossRef]
- Pan, D. The hippo signaling pathway in development and cancer. Dev. Cell 2010, 19, 491–505. [Google Scholar] [CrossRef]
- Yu, F.X.; Zhao, B.; Panupinthu, N.; Jewell, J.L.; Lian, I.; Wang, L.H.; Zhao, J.; Yuan, H.; Tumaneng, K.; Li, H.; et al. Regulation of the Hippo-YAP pathway by G-protein-coupled receptor signaling. Cell 2012, 150, 780–791. [Google Scholar] [CrossRef]
- Luo, J.; Yu, F.X. GPCR-Hippo Signaling in Cancer. Cells 2019, 8, 426. [Google Scholar] [CrossRef]
- Shibata, M.; Ham, K.; Hoque, M.O. A time for YAP1: Tumorigenesis, immunosuppression and targeted therapy. Int. J. Cancer 2018, 143, 2133–2144. [Google Scholar] [CrossRef] [PubMed]
- Wada, K.; Itoga, K.; Okano, T.; Yonemura, S.; Sasaki, H. Hippo pathway regulation by cell morphology and stress fibers. Development 2011, 138, 3907–3914. [Google Scholar] [CrossRef] [PubMed]
- Dupont, S.; Morsut, L.; Aragona, M.; Enzo, E.; Giulitti, S.; Cordenonsi, M.; Zanconato, F.; Le Digabel, J.; Forcato, M.; Bicciato, S.; et al. Role of YAP/TAZ in mechanotransduction. Nature 2011, 474, 179–183. [Google Scholar] [CrossRef] [PubMed]
- Aragona, M.; Panciera, T.; Manfrin, A.; Giulitti, S.; Michielin, F.; Elvassore, N.; Dupont, S.; Piccolo, S. A mechanical checkpoint controls multicellular growth through YAP/TAZ regulation by actin-processing factors. Cell 2013, 154, 1047–1059. [Google Scholar] [CrossRef]
- Yu, F.X.; Zhao, B.; Guan, K.L. Hippo Pathway in Organ Size Control, Tissue Homeostasis, and Cancer. Cell 2015, 163, 811–828. [Google Scholar] [CrossRef]
- Codelia, V.A.; Sun, G.; Irvine, K.D. Regulation of YAP by mechanical strain through Jnk and Hippo signaling. Curr. Biol. 2014, 24, 2012–2017. [Google Scholar] [CrossRef]
- Benham-Pyle, B.W.; Pruitt, B.L.; Nelson, W.J. Cell adhesion. Mechanical strain induces E-cadherin-dependent Yap1 and beta-catenin activation to drive cell cycle entry. Science 2015, 348, 1024–1027. [Google Scholar] [CrossRef]
- Zhu, L.; Tian, Q.; Gao, H.; Wu, K.; Wang, B.; Ge, G.; Jiang, S.; Wang, K.; Zhou, C.; He, J.; et al. PROX1 promotes breast cancer invasion and metastasis through WNT/beta-catenin pathway via interacting with hnRNPK. Int. J. Biol. Sci. 2022, 18, 2032–2046. [Google Scholar] [CrossRef]
- Tocci, J.M.; Felcher, C.M.; Garcia Sola, M.E.; Kordon, E.C. R-spondin-mediated WNT signaling potentiation in mammary and breast cancer development. IUBMB Life 2020, 72, 1546–1559. [Google Scholar] [CrossRef]
- Li, S.; Mai, H.; Zhu, Y.; Li, G.; Sun, J.; Li, G.; Liang, B.; Chen, S. MicroRNA-4500 Inhibits Migration, Invasion, and Angiogenesis of Breast Cancer Cells via RRM2-Dependent MAPK Signaling Pathway. Mol. Ther. Nucleic Acids 2020, 21, 278–289. [Google Scholar] [CrossRef]
- Qiu, X.; Li, X.; Yan, Y.; Cai, Y.; Liang, Q.; Peng, B.; Xu, Z.; Xiao, M.; Xia, F.; Peng, J. Identification of m6A-Associated Gene DST as a Prognostic and Immune-Associated Biomarker in Breast Cancer Patients. Int. J. Gen. Med. 2022, 15, 523–534. [Google Scholar] [CrossRef] [PubMed]
- Sun, X.; Fu, X.; Xu, S.; Qiu, P.; Lv, Z.; Cui, M.; Zhang, Q.; Xu, Y. OLR1 is a prognostic factor and correlated with immune infiltration in breast cancer. Int. Immunopharmacol. 2021, 101, 108275. [Google Scholar] [CrossRef]
- Turnbull, C.; Hines, S.; Renwick, A.; Hughes, D.; Pernet, D.; Elliott, A.; Seal, S.; Warren-Perry, M.; Gareth Evans, D.; Eccles, D.; et al. Mutation and association analysis of GEN1 in breast cancer susceptibility. Breast Cancer Res. Treat. 2010, 124, 283–288. [Google Scholar] [CrossRef] [PubMed]
- Zhu, Z.; Teng, Z.; van Duijnhoven, F.J.B.; Dong, M.; Qian, Y.; Yu, H.; Yang, J.; Han, R.; Su, J.; Du, W.; et al. Interactions between RASA2, CADM1, HIF1AN gene polymorphisms and body fatness with breast cancer: A population-based case-control study in China. Oncotarget 2017, 8, 98258–98269. [Google Scholar] [CrossRef] [PubMed]
- Damiano, J.S.; Wasserman, E. Molecular pathways: Blockade of the PRLR signaling pathway as a novel antihormonal approach for the treatment of breast and prostate cancer. Clin. Cancer Res. 2013, 19, 1644–1650. [Google Scholar] [CrossRef]
- Gerashchenko, T.S.; Zavyalova, M.V.; Denisov, E.V.; Krakhmal, N.V.; Pautova, D.N.; Litviakov, N.V.; Vtorushin, S.V.; Cherdyntseva, N.V.; Perelmuter, V.M. Intratumoral Morphological Heterogeneity of Breast Cancer As an Indicator of the Metastatic Potential and Tumor Chemosensitivity. Acta Nat. 2017, 9, 56–67. [Google Scholar] [CrossRef]
- Wang, Z.; Li, T.E.; Chen, M.; Pan, J.J.; Shen, K.W. miR-106b-5p contributes to the lung metastasis of breast cancer via targeting CNN1 and regulating Rho/ROCK1 pathway. Aging 2020, 12, 1867–1887. [Google Scholar] [CrossRef]
- Sun, W.L.; He, L.Y.; Liang, L.; Liu, S.Y.; Luo, J.; Lv, M.L.; Cai, Z.W. Ambra1 regulates apoptosis and chemosensitivity in breast cancer cells through the Akt-FoxO1-Bim pathway. Apoptosis Int. J. Program. Cell Death 2022, 27, 329–341. [Google Scholar] [CrossRef]
- Watanabe, S.; Watanabe, K.; Akimov, V.; Bartkova, J.; Blagoev, B.; Lukas, J.; Bartek, J. JMJD1C demethylates MDC1 to regulate the RNF8 and BRCA1-mediated chromatin response to DNA breaks. Nat. Struct. Mol. Biol. 2013, 20, 1425–1433. [Google Scholar] [CrossRef]
- Nusse, R. Wnt signaling and stem cell control. Cell Res. 2008, 18, 523–527. [Google Scholar] [CrossRef]
- Schulte, G. International Union of Basic and Clinical Pharmacology. LXXX. The class Frizzled receptors. Pharmacol. Rev. 2010, 62, 632–667. [Google Scholar] [CrossRef] [PubMed]
- Roarty, K.; Serra, R. Wnt5a is required for proper mammary gland development and TGF-beta-mediated inhibition of ductal growth. Development 2007, 134, 3929–3939. [Google Scholar] [CrossRef] [PubMed]
- Jonsson, M.; Dejmek, J.; Bendahl, P.O.; Andersson, T. Loss of Wnt-5a protein is associated with early relapse in invasive ductal breast carcinomas. Cancer Res. 2002, 62, 409–416. [Google Scholar]
- Escuin, D.; Lopez-Vilaro, L.; Mora, J.; Bell, O.; Moral, A.; Perez, I.; Arqueros, C.; Garcia-Valdecasas, B.; Ramon, Y.C.T.; Lerma, E.; et al. Circulating microRNAs in Early Breast Cancer Patients and Its Association With Lymph Node Metastases. Front. Oncol. 2021, 11, 627811. [Google Scholar] [CrossRef] [PubMed]
- Terkelsen, T.; Russo, F.; Gromov, P.; Haakensen, V.D.; Brunak, S.; Gromova, I.; Krogh, A.; Papaleo, E. Secreted breast tumor interstitial fluid microRNAs and their target genes are associated with triple-negative breast cancer, tumor grade, and immune infiltration. Breast Cancer Res. 2020, 22, 73. [Google Scholar] [CrossRef]
- Fassan, M.; Baffa, R.; Palazzo, J.P.; Lloyd, J.; Crosariol, M.; Liu, C.G.; Volinia, S.; Alder, H.; Rugge, M.; Croce, C.M.; et al. MicroRNA expression profiling of male breast cancer. Breast Cancer Res. 2009, 11, R58. [Google Scholar] [CrossRef]
- Ma, L.; Teruya-Feldstein, J.; Weinberg, R.A. Tumour invasion and metastasis initiated by microRNA-10b in breast cancer. Nature 2007, 449, 682–688. [Google Scholar] [CrossRef] [PubMed]
- Zhao, F.L.; Hu, G.D.; Wang, X.F.; Zhang, X.H.; Zhang, Y.K.; Yu, Z.S. Serum overexpression of microRNA-10b in patients with bone metastatic primary breast cancer. J. Int. Med. Res. 2012, 40, 859–866. [Google Scholar] [CrossRef]
- Ahmad, A.; Sethi, S.; Chen, W.; Ali-Fehmi, R.; Mittal, S.; Sarkar, F.H. Up-regulation of microRNA-10b is associated with the development of breast cancer brain metastasis. Am. J. Transl. Res. 2014, 6, 384–390. [Google Scholar]
- Liang, A.L.; Zhang, T.T.; Zhou, N.; Wu, C.Y.; Lin, M.H.; Liu, Y.J. MiRNA-10b sponge: An anti-breast cancer study in vitro. Oncol. Rep. 2016, 35, 1950–1958. [Google Scholar] [CrossRef]
- Kim, J.; Siverly, A.N.; Chen, D.; Wang, M.; Yuan, Y.; Wang, Y.; Lee, H.; Zhang, J.; Muller, W.J.; Liang, H.; et al. Ablation of miR-10b Suppresses Oncogene-Induced Mammary Tumorigenesis and Metastasis and Reactivates Tumor-Suppressive Pathways. Cancer Res. 2016, 76, 6424–6435. [Google Scholar] [CrossRef] [PubMed]
- Bahena-Ocampo, I.; Espinosa, M.; Ceballos-Cancino, G.; Lizarraga, F.; Campos-Arroyo, D.; Schwarz, A.; Maldonado, V.; Melendez-Zajgla, J.; Garcia-Lopez, P. miR-10b expression in breast cancer stem cells supports self-renewal through negative PTEN regulation and sustained AKT activation. EMBO Rep. 2016, 17, 648–658. [Google Scholar] [CrossRef] [PubMed]
- Shen, X.; Fang, J.; Lv, X.; Pei, Z.; Wang, Y.; Jiang, S.; Ding, K. Heparin impairs angiogenesis through inhibition of microRNA-10b. J. Biol. Chem. 2011, 286, 26616–26627. [Google Scholar] [CrossRef]
- Eissa, S.; Matboli, M.; Shehata, H.H.; Essawy, N.O. MicroRNA-10b and minichromosome maintenance complex component 5 gene as prognostic biomarkers in breast cancer. Tumour Biol 2015, 36, 4487–4494. [Google Scholar] [CrossRef] [PubMed]
- Min, W.; Wang, B.; Li, J.; Han, J.; Zhao, Y.; Su, W.; Dai, Z.; Wang, X.; Ma, Q. The expression and significance of five types of miRNAs in breast cancer. Med. Sci. Monit. Basic Res. 2014, 20, 97–104. [Google Scholar] [CrossRef] [PubMed]
- Liu, Y.; Zhao, J.; Zhang, P.Y.; Zhang, Y.; Sun, S.Y.; Yu, S.Y.; Xi, Q.S. MicroRNA-10b targets E-cadherin and modulates breast cancer metastasis. Med. Sci. Monit. 2012, 18, BR299–BR308. [Google Scholar] [CrossRef]
- Chang, C.H.; Fan, T.C.; Yu, J.C.; Liao, G.S.; Lin, Y.C.; Shih, A.C.; Li, W.H.; Yu, A.L. The prognostic significance of RUNX2 and miR-10a/10b and their inter-relationship in breast cancer. J. Transl. Med. 2014, 12, 257. [Google Scholar] [CrossRef]
- Anfossi, S.; Giordano, A.; Gao, H.; Cohen, E.N.; Tin, S.; Wu, Q.; Garza, R.J.; Debeb, B.G.; Alvarez, R.H.; Valero, V.; et al. High serum miR-19a levels are associated with inflammatory breast cancer and are predictive of favorable clinical outcome in patients with metastatic HER2+ inflammatory breast cancer. PLoS ONE 2014, 9, e83113. [Google Scholar] [CrossRef]
- Uen, Y.; Wang, J.W.; Wang, C.; Jhang, Y.; Chung, J.Y.; Tseng, T.; Sheu, M.; Lee, S. Mining of potential microRNAs with clinical correlation—Regulation of syndecan-1 expression by miR-122-5p altered mobility of breast cancer cells and possible correlation with liver injury. Oncotarget 2018, 9, 28165–28175. [Google Scholar] [CrossRef]
- Fong, M.Y.; Zhou, W.; Liu, L.; Alontaga, A.Y.; Chandra, M.; Ashby, J.; Chow, A.; O’Connor, S.T.; Li, S.; Chin, A.R.; et al. Breast-cancer-secreted miR-122 reprograms glucose metabolism in premetastatic niche to promote metastasis. Nat. Cell Biol. 2015, 17, 183–194. [Google Scholar] [CrossRef]
- Wang, Z.; Wang, X. miR-122-5p promotes aggression and epithelial-mesenchymal transition in triple-negative breast cancer by suppressing charged multivesicular body protein 3 through mitogen-activated protein kinase signaling. J. Cell Physiol. 2020, 235, 2825–2835. [Google Scholar] [CrossRef] [PubMed]
- Wang, B.; Wang, H.; Yang, Z. MiR-122 inhibits cell proliferation and tumorigenesis of breast cancer by targeting IGF1R. PLoS ONE 2012, 7, e47053. [Google Scholar] [CrossRef] [PubMed]


| DE-microRNAs Up | FC | p-Value | DE-microRNAs Down | FC | p-Value |
|---|---|---|---|---|---|
| hsa-miR-410-3p | 20.1 | 0.0000 | hsa-miR-449c-3p | −6.9 | 0.0000 |
| hsa-miR-6529-5p | 15.9 | 0.0000 | hsa-miR-449b-3p | −5.7 | 0.0000 |
| hsa-miR-122-5p | 15.4 | 0.0000 | hsa-miR-3689a-3p | −5.3 | 0.0071 |
| hsa-miR-409-3p | 12.2 | 0.0000 | hsa-miR-449a | −4.2 | 0.0000 |
| hsa-miR-369-3p | 11.4 | 0.0000 | hsa-miR-1247-5p | −3.9 | 0.0000 |
| hsa-miR-127-3p | 8.7 | 0.0000 | hsa-miR-449c-5p | −3.8 | 0.0000 |
| hsa-miR-223-3p | 7.7 | 0.0054 | hsa-miR-34c-5p | −3.6 | 0.0014 |
| hsa-miR-4458 | 6.8 | 0.0005 | hsa-miR-449b-5p | −3.5 | 0.0000 |
| hsa-miR-10b-5p | 6.5 | 0.0000 | hsa-miR-1247-3p | −3.2 | 0.0000 |
| hsa-miR-5680 | 6.4 | 0.0000 | hsa-miR-516a-5p | −3.0 | 0.0002 |
| hsa-miR-381-3p | 5.4 | 0.0000 | hsa-miR-3940-5p | −2.9 | 0.0057 |
| hsa-miR-6882-5p | 5.3 | 0.0100 | hsa-miR-219a-5p | −2.7 | 0.0039 |
| hsa-miR-411-5p | 5.1 | 0.0000 | hsa-miR-3661 | −2.7 | 0.0007 |
| hsa-miR-451a | 4.0 | 0.0000 | hsa-miR-5091 | −2.6 | 0.0032 |
| hsa-miR-3622b-3p | 3.8 | 0.0004 | hsa-miR-5187-5p | −2.4 | 0.0020 |
| hsa-miR-142-5p | 3.0 | 0.0000 | hsa-miR-548u | −2.1 | 0.0004 |
| hsa-miR-1246 | 2.6 | 0.0000 | hsa-miR-130a-5p | −2.1 | 0.0017 |
| hsa-miR-3133 | 2.1 | 0.0022 | hsa-miR-943 | −2.0 | 0.0053 |
| hsa-miR-375-3p | 2.0 | 0.0000 | hsa-miR-33a-5p | −2.0 | 0.0000 |
| hsa-miR-4739 | 2.0 | 0.0009 |
| DE-mRNAs Up | FC | Adjusted p-Value | DE-mRNAs Down | FC | Adjusted p-Value | DE-mRNAs Down | FC | Adjusted p-Value |
|---|---|---|---|---|---|---|---|---|
| SLC44A4 | 6.7 | 0.0080 | GLYATL2 | −36.1 | 0.0013 | ZDHHC20 | −4.0 | 0.0081 |
| TFF1 | 5.5 | 0.0006 | TGFB2 | −16.1 | 0.0097 | NRP1 | −4.0 | 0.0030 |
| BGN | 3.9 | 0.0054 | DST | −14.4 | 0.0037 | EDEM3 | −4.0 | 0.0048 |
| PRODH | 3.1 | 0.0032 | OLR1 | −12.2 | 0.0052 | SLC7A11 | −3.9 | 0.0065 |
| SLC22A18 | 2.9 | 0.0002 | TPR | −12.0 | 0.0083 | HIVEP2 | −3.9 | 0.0076 |
| OAS1 | 2.9 | 0.0023 | USP34 | −10.8 | 0.0019 | ICE1 | −3.9 | 0.0076 |
| TENT5C | 2.9 | 0.0046 | PHIP | −10.6 | 0.0050 | IPMK | −3.8 | 0.0078 |
| SERHL2 | 2.8 | 0.0069 | ITGB6 | −10.3 | 0.0045 | ZFX | −3.8 | 0.0092 |
| HSD17B2 | 2.8 | 0.0007 | GEN1 | −10.0 | 0.0043 | INTS6 | −3.8 | 0.0043 |
| GPKOW | 2.6 | 0.0040 | SMCHD1 | −10.0 | 0.0078 | HOMER1 | −3.8 | 0.0078 |
| STARD5 | 2.6 | 0.0038 | TRPS1 | −8.9 | 0.0071 | HECTD1 | −3.7 | 0.0044 |
| NR5A1 | 2.6 | 0.0027 | LPP | −8.8 | 0.0051 | FAM133B | −3.6 | 0.0024 |
| FANCG | 2.6 | 0.0029 | ROCK1 | −8.5 | 0.0048 | MID1 | −3.5 | 0.0026 |
| HDHD5 | 2.5 | 0.0038 | RIF1 | −8.4 | 0.0028 | KLF8 | −3.5 | 0.0035 |
| LRRC26 | 2.5 | 0.0087 | BRWD1 | −8.3 | 0.0041 | PUS7L | −3.5 | 0.0084 |
| SMIM19 | 2.4 | 0.0028 | TOP2B | −8.2 | 0.0002 | TMEM181 | −3.5 | 0.0036 |
| ZNF764 | 2.4 | 0.0074 | NIPBL | −8.1 | 0.0070 | FMR1 | −3.4 | 0.0038 |
| VSTM2L | 2.4 | 0.0086 | MYCBP2 | −7.8 | 0.0047 | FGD6 | −3.4 | 0.0085 |
| LIPT2 | 2.3 | 0.0093 | JMJD1C | −7.7 | 0.0074 | KTN1 | −3.3 | 0.0041 |
| NGB | 2.3 | 0.0014 | GOLGB1 | −7.6 | 0.0060 | ATG14 | −3.3 | 0.0052 |
| SPDEF | 2.3 | 0.0025 | NPIPB4 | −7.6 | 0.0078 | LRBA | −3.2 | 0.0016 |
| FA2H | 2.3 | 0.0010 | FRK | −7.3 | 0.0006 | LCOR | −3.2 | 0.0067 |
| GAA | 2.3 | 0.0078 | CHD9 | −7.3 | 0.0074 | SP3 | −3.2 | 0.0082 |
| XBP1 | 2.3 | 0.0050 | NRIP1 | −6.8 | 0.0025 | MKI67 | −3.2 | 0.0039 |
| B4GAT1 | 2.2 | 0.0003 | PRLR | −6.1 | 0.0049 | VPS13C | −3.2 | 0.0093 |
| MCM2 | 2.2 | 0.0045 | ANKRD36C | −6.1 | 0.0002 | SMAD3 | −3.1 | 0.0006 |
| MUCL1 | 2.2 | 0.0042 | FAR1 | −6.1 | 0.0023 | NPIPB15 | −3.1 | 0.0017 |
| BAIAP3 | 2.2 | 0.0078 | PLCE1 | −6.0 | 0.0053 | CDC42EP3 | −3.1 | 0.0045 |
| EPOR | 2.2 | 0.0045 | TAOK1 | −6.0 | 0.0002 | TULP4 | −3.1 | 0.0021 |
| RASD1 | 2.2 | 0.0046 | MED13 | −5.9 | 0.0059 | PUM3 | −3.0 | 0.0045 |
| PPP1R37 | 2.2 | 0.0086 | KMT2C | −5.7 | 0.0053 | ELF1 | −3.0 | 0.0040 |
| OVOL1 | 2.2 | 0.0021 | ANKRD28 | −5.5 | 0.0039 | C2CD5 | −2.9 | 0.0015 |
| VWA1 | 2.2 | 0.0035 | NAP1L1 | −5.4 | 0.0032 | YAP1 | −2.9 | 0.0057 |
| DNER | 2.2 | 0.0042 | HELLS | −5.4 | 0.0054 | BTBD7 | −2.8 | 0.0048 |
| PAX7 | 2.2 | 0.0051 | HS2ST1 | −5.3 | 0.0031 | MYO6 | −2.8 | 0.0012 |
| FBP1 | 2.1 | 0.0016 | DMXL1 | −5.2 | 0.0025 | KRBOX1 | −2.8 | 0.0065 |
| NAPRT | 2.1 | 0.0008 | RASA2 | −5.2 | 0.0023 | ATXN1 | −2.8 | 0.0059 |
| NR4A1 | 2.1 | 0.0066 | VPS13A | −5.2 | 0.0011 | ATP6V1C2 | −2.7 | 0.0070 |
| PARS2 | 2.1 | 0.0077 | GABRE | −4.9 | 0.0028 | NBPF10 | −2.7 | 0.0040 |
| TEX45 | 2.1 | 0.0079 | FNDC3B | −4.8 | 0.0072 | NUFIP2 | −2.7 | 0.0050 |
| ARHGAP40 | 2.1 | 0.0061 | TANC2 | −4.8 | 0.0033 | CEMIP2 | −2.7 | 0.0084 |
| MROH6 | 2.1 | 0.0073 | NPIPB3 | −4.8 | 0.0019 | POGZ | −2.7 | 0.0036 |
| SMPD2 | 2.0 | 0.0040 | VWDE | −4.7 | 0.0065 | CCDC93 | −2.6 | 0.0042 |
| TPSAB1 | 2.0 | 0.0013 | ANKRD36 | −4.7 | 0.0071 | LRRC37A | −2.6 | 0.0004 |
| CLSTN3 | 2.0 | 0.0097 | NPIPB2 | −4.5 | 0.0001 | ASAP1 | −2.6 | 0.0093 |
| RTN4RL1 | 2.0 | 0.0097 | FOXO1 | −4.5 | 0.0085 | APPBP2 | −2.6 | 0.0030 |
| FLYWCH1 | 2.0 | 0.0007 | ZBTB38 | −4.5 | 0.0022 | PHLPP2 | −2.6 | 0.0019 |
| TMEM129 | 2.0 | 0.0022 | USP3 | −4.4 | 0.0051 | ACAP2 | −2.5 | 0.0090 |
| GGTLC1 | 2.0 | 0.0083 | RFX7 | −4.4 | 0.0005 | CEP290 | −2.5 | 0.0077 |
| BPTF | −4.4 | 0.0043 | OR52N1 | −2.5 | 0.0064 | |||
| HERC4 | −4.4 | 0.0041 | RABGAP1L | −2.4 | 0.0041 | |||
| SYDE2 | −4.4 | 0.0080 | PPM1B | −2.4 | 0.0094 | |||
| RGPD8 | −4.3 | 0.0017 | TMEM128 | −2.4 | 0.0044 | |||
| QSER1 | −4.3 | 0.0084 | PMEPA1 | −2.4 | 0.0063 | |||
| ARHGAP11A | −4.2 | 0.0075 | ANKRD10 | −2.3 | 0.0052 | |||
| GPRC5A | −4.1 | 0.0009 | WNK1 | −2.3 | 0.0016 | |||
| MAN2A1 | −4.1 | 0.0077 | CLK4 | −2.3 | 0.0014 | |||
| CCL2 | −4.1 | 0.0075 | NAV2 | −2.2 | 0.0018 | |||
| RC3H1 | −4.1 | 0.0081 | LRRC58 | −2.2 | 0.0034 | |||
| NAIP | −4.0 | 0.0073 | WNT5A | −2.2 | 0.0073 | |||
| NPIPB8 | −4.0 | 0.0035 | TAS2R30 | −2.1 | 0.0092 | |||
| CARMIL1 | −2.0 | 0.0096 |
| DE-microRNAs Up | DE-microRNAs Up | DE-microRNAs Up | DE-microRNAs Up | DE-mRNAs Down | FC | p Value | Description |
|---|---|---|---|---|---|---|---|
| hsa-mir-10b-5p | TGFB2 | −16.1 | 0.0097 | transforming growth factor beta 2 | |||
| hsa-mir-122-5p | hsa-mir-369-3p | hsa-mir-10b-5p | DST | −14.4 | 0.0037 | dystonin | |
| hsa-mir-122-5p | OLR1 | −12.2 | 0.0052 | oxidized low density lipoprotein receptor 1 | |||
| hsa-mir-122-5p | TPR | −12.0 | 0.0083 | translocated promoter region, nuclear basket protein | |||
| hsa-mir-122-5p | hsa-mir-369-3p | hsa-mir-142-5p | USP34 | −10.8 | 0.0019 | ubiquitin specific peptidase 34 | |
| hsa-mir-369-3p | PHIP | −10.6 | 0.0050 | pleckstrin homology domain interacting protein | |||
| hsa-mir-122-5p | GEN1 | −10.0 | 0.0043 | GEN1 Holliday junction 5′ flap endonuclease | |||
| hsa-mir-122-5p | hsa-mir-369-3p | SMCHD1 | −10.0 | 0.0078 | structural maintenance of chromosomes flexible hinge domain containing 1 | ||
| hsa-mir-122-5p | hsa-mir-10b-5p | hsa-mir-142-5p | TRPS1 | −8.9 | 0.0071 | transcriptional repressor GATA binding 1 | |
| hsa-mir-122-5p | hsa-mir-369-3p | LPP | −8.8 | 0.0051 | LIM domain containing preferred translocation partner in lipoma | ||
| hsa-mir-122-5p | RIF1 | −8.4 | 0.0028 | replication timing regulatory factor 1 | |||
| hsa-mir-122-5p | hsa-mir-369-3p | hsa-mir-10b-5p | hsa-mir-1246 | BRWD1 | −8.3 | 0.0041 | bromodomain and WD repeat domain containing 1 |
| hsa-mir-451a | TOP2B | −8.2 | 0.0002 | DNA topoisomerase II beta | |||
| hsa-mir-122-5p | NIPBL | −8.1 | 0.0070 | NIPBL cohesin loading factor | |||
| hsa-mir-122-5p | hsa-mir-127-3p | MYCBP2 | −7.8 | 0.0047 | MYC binding protein 2 | ||
| hsa-mir-122-5p | hsa-mir-369-3p | JMJD1C | −7.7 | 0.0074 | jumonji domain containing 1C | ||
| hsa-mir-122-5p | hsa-mir-142-5p | hsa-mir-381-3p | CHD9 | −7.3 | 0.0074 | chromodomain helicase DNA binding protein 9 | |
| hsa-mir-122-5p | ANKRD36C | −6.1 | 0.0002 | ankyrin repeat domain 36C | |||
| hsa-mir-369-3p | hsa-mir-4458 | FAR1 | −6.1 | 0.0023 | fatty acyl-CoA reductase 1 | ||
| hsa-mir-369-3p | hsa-mir-142-5p | hsa-mir-1246 | TAOK1 | −6.0 | 0.0002 | TAO kinase 1 | |
| hsa-mir-1246 | MED13 | −5.9 | 0.0059 | mediator complex subunit 13 | |||
| hsa-mir-122-5p | hsa-mir-369-3p | KMT2C | −5.7 | 0.0053 | lysine methyltransferase 2C | ||
| hsa-mir-122-5p | ANKRD28 | −5.5 | 0.0039 | ankyrin repeat domain 28 | |||
| hsa-mir-369-3p | NAP1L1 | −5.4 | 0.0032 | nucleosome assembly protein 1 like 1 | |||
| hsa-mir-122-5p | DMXL1 | −5.2 | 0.0025 | Dmx like 1 | |||
| hsa-mir-369-3p | hsa-mir-10b-5p | RASA2 | −5.2 | 0.0023 | RAS p21 protein activator 2 | ||
| hsa-mir-1246 | VPS13A | −5.2 | 0.0011 | vacuolar protein sorting 13 homolog A | |||
| hsa-mir-122-5p | GABRE | −4.9 | 0.0028 | gamma-aminobutyric acid type A receptor subunit epsilon | |||
| hsa-mir-122-5p | hsa-mir-10b-5p | hsa-mir-142-5p | FNDC3B | −4.8 | 0.0072 | fibronectin type III domain containing 3B | |
| hsa-mir-122-5p | TANC2 | −4.8 | 0.0033 | tetratricopeptide repeat, ankyrin repeat and coiled-coil containing 2 | |||
| hsa-mir-122-5p | VWDE | −4.7 | 0.0065 | von Willebrand factor D and EGF domains | |||
| hsa-mir-10b-5p | ANKRD36 | −4.7 | 0.0071 | ankyrin repeat domain 36 | |||
| hsa-mir-369-3p | hsa-mir-10b-5p | hsa-mir-223-3p | FOXO1 | −4.5 | 0.0085 | forkhead box O1 | |
| hsa-mir-381-3p | ZBTB38 | −4.5 | 0.0022 | zinc finger and BTB domain containing 38 | |||
| hsa-mir-142-5p | RFX7 | −4.4 | 0.0005 | regulatory factor X7 | |||
| hsa-mir-122-5p | hsa-mir-369-3p | HERC4 | −4.4 | 0.0041 | HECT and RLD domain containing E3 ubiquitin protein ligase 4 | ||
| hsa-mir-122-5p | QSER1 | −4.3 | 0.0084 | glutamine and serine rich 1 | |||
| hsa-mir-10b-5p | hsa-mir-381-3p | ARHGAP11A | −4.2 | 0.0075 | Rho GTPase activating protein 11A | ||
| hsa-mir-10b-5p | CCL2 | −4.1 | 0.0075 | C-C motif chemokine ligand 2 | |||
| hsa-mir-369-3p | hsa-mir-142-5p | RC3H1 | −4.1 | 0.0081 | ring finger and CCCH-type domains 1 | ||
| hsa-mir-369-3p | ZDHHC20 | −4.0 | 0.0081 | zinc finger DHHC-type palmitoyltransferase 20 | |||
| hsa-mir-381-3p | NRP1 | −4.0 | 0.0030 | neuropilin 1 | |||
| hsa-mir-142-5p | EDEM3 | −4.0 | 0.0048 | ER degradation enhancing alpha-mannosidase like protein 3 | |||
| hsa-mir-122-5p | hsa-mir-10b-5p | SLC7A11 | −3.9 | 0.0065 | solute carrier family 7 member 11 | ||
| hsa-mir-10b-5p | hsa-mir-1246 | HIVEP2 | −3.9 | 0.0076 | HIVEP zinc finger 2 | ||
| hsa-mir-5680 | IPMK | −3.8 | 0.0078 | inositol polyphosphate multikinase | |||
| hsa-mir-127-3p | HECTD1 | −3.7 | 0.0044 | HECT domain E3 ubiquitin protein ligase 1 | |||
| hsa-mir-122-5p | MID1 | −3.5 | 0.0026 | midline 1 | |||
| hsa-mir-122-5p | KTN1 | −3.3 | 0.0041 | kinectin 1 | |||
| hsa-mir-10b-5p | ATG14 | −3.3 | 0.0052 | autophagy related 14 | |||
| hsa-mir-10b-5p | hsa-mir-142-5p | LCOR | −3.2 | 0.0067 | ligand dependent nuclear receptor corepressor | ||
| hsa-mir-369-3p | hsa-mir-223-3p | SP3 | −3.2 | 0.0082 | Sp3 transcription factor | ||
| hsa-mir-10b-5p | MKI67 | −3.2 | 0.0039 | marker of proliferation Ki-67 | |||
| hsa-mir-122-5p | hsa-mir-369-3p | VPS13C | −3.2 | 0.0093 | vacuolar protein sorting 13 homolog C | ||
| hsa-mir-122-5p | hsa-mir-10b-5p | CDC42EP3 | −3.1 | 0.0045 | CDC42 effector protein 3 | ||
| hsa-mir-1246 | BTBD7 | −2.8 | 0.0048 | BTB domain containing 7 | |||
| hsa-mir-10b-5p | MYO6 | −2.8 | 0.0012 | myosin VI | |||
| hsa-mir-122-5p | ATXN1 | −2.8 | 0.0059 | ataxin 1 | |||
| hsa-mir-122-5p | NBPF10 | −2.7 | 0.0040 | NBPF member 10 | |||
| hsa-mir-10b-5p | NUFIP2 | −2.7 | 0.0050 | nuclear FMR1 interacting protein 2 | |||
| hsa-mir-1246 | POGZ | −2.7 | 0.0036 | pogo transposable element derived with ZNF domain | |||
| hsa-mir-142-5p | PHLPP2 | −2.6 | 0.0019 | PH domain and leucine rich repeat protein phosphatase 2 | |||
| hsa-mir-369-3p | CEP290 | −2.5 | 0.0077 | centrosomal protein 290 | |||
| hsa-mir-369-3p | RABGAP1L | −2.4 | 0.0041 | RAB GTPase activating protein 1 like | |||
| hsa-mir-369-3p | hsa-mir-451a | PPM1B | −2.4 | 0.0094 | protein phosphatase, Mg2+/Mn2+ dependent 1B | ||
| hsa-mir-122-5p | ANKRD10 | −2.3 | 0.0052 | ankyrin repeat domain 10 | |||
| hsa-mir-122-5p | hsa-mir-1246 | WNK1 | −2.3 | 0.0016 | WNK lysine deficient protein kinase 1 | ||
| hsa-mir-122-5p | CLK4 | −2.3 | 0.0014 | CDC like kinase 4 | |||
| hsa-mir-369-3p | hsa-mir-10b-5p | LRRC58 | −2.2 | 0.0034 | leucine rich repeat containing 58 | ||
| hsa-mir-381-3p | WNT5A | −2.2 | 0.0073 | Wnt family member 5A |
| Term | Description | DE-mRNAs Down |
|---|---|---|
| GO:0006325 | Chromatin organization | NAP1L1, SMCHD1, RIF1, KMT2C, CHD9, JMJD1C |
| GO:0051276 | Chromosome organization | TOP2B, POGZ, SMCHD1, NIPBL, RIF1 |
| GO:0006281 | DNA repair | POGZ, SMCHD1, NIPBL, RIF1, TAOK1, GEN1 |
| GO:0048762 | Mesenchymal cell differentiation | TGFB2, WNT5A, NRP1 |
| GO:0002009 | Morphogenesis of an epithelium | TGFB2, WNT5A, NRP1, HECTD1, BTBD7, CEP290 |
| GO:0022604 | Regulation of cell morphogenesis | CCL2, WNT5A, CDC42EP3, BRWD1, PHIP |
| GO:0008360 | Regulation of cell shape | CCL2, CDC42EP3, BRWD1, PHIP |
| GO:0050921 | Regulation of chemotaxis | WNT5A, NRP1, WNK1 |
| GO:0051493 | Regulation of cytoskeleton organization | MID1, TPR, NRP1, CDC42EP3, MYCBP2, TAOK1 |
| GO:0002688 | Regulation of leukocyte chemotaxis | CCL2, WNT5A, WNK1 |
| GO:2000401 | Regulation of lymphocyte migration | CCL2, WNT5A, WNK1 |
| GO:0043408 | Regulation of MAPK cascade | FOXO1, MID1, CCL2, TGFB2, WNT5A, NRP1, TAOK1 |
| GO:0046578 | Regulation of Ras protein signal transduction | RASA2, TGFB2, NRP1 |
| GO:0030111 | Regulation of Wnt signaling pathway | FOXO1, PPM1B, WNT5A, USP34, WNK1 |
| GO:0070848 | Response to growth factor | CCL2, TGFB2, TPR, WNT5A, NRP1 |
| GO:0019827 | Stem cell population maintenance | FOXO1, NIPBL, RIF1 |
| KEGG:hsa04933 | AGE-RAGE signaling pathway in diabetic complications | FOXO1, CCL2, TGFB2 |
| KEGG:hsa04010 | MAPK signaling pathway | PPM1B, RASA2, TGFB2, TAOK1 |
| DE-microRNAs Down | DE-microRNAs Down | DE-microRNAs Down | DE-mRNA Up | FC | p Value | Description |
|---|---|---|---|---|---|---|
| hsa-mir-34c-5p | hsa-mir-449a | OAS1 | 2.9 | 0.0023 | 2′-5′-oligoadenylate synthetase 1 | |
| hsa-mir-449a | hsa-mir-449b-5p | STARD5 | 2.6 | 0.0038 | StAR related lipid transfer domain containing 5 | |
| hsa-mir-34c-5p | hsa-mir-449a | hsa-mir-449b-5p | XBP1 | 2.3 | 0.0050 | X-box binding protein 1 |
| hsa-mir-3661 | NAPRT | 2.1 | 0.0008 | nicotinate phosphoribosyltransferase | ||
| hsa-mir-449a | NR4A1 | 2.1 | 0.0066 | nuclear receptor subfamily 4 group A member 1 |
Disclaimer/Publisher’s Note: The statements, opinions and data contained in all publications are solely those of the individual author(s) and contributor(s) and not of MDPI and/or the editor(s). MDPI and/or the editor(s) disclaim responsibility for any injury to people or property resulting from any ideas, methods, instructions or products referred to in the content. |
© 2023 by the authors. Licensee MDPI, Basel, Switzerland. This article is an open access article distributed under the terms and conditions of the Creative Commons Attribution (CC BY) license (https://creativecommons.org/licenses/by/4.0/).
Share and Cite
Gastélum-López, M.d.l.Á.; Aguilar-Medina, M.; García Mata, C.; López-Gutiérrez, J.; Romero-Quintana, G.; Bermúdez, M.; Avendaño-Felix, M.; López-Camarillo, C.; Pérez-Plascencia, C.; Beltrán, A.S.; et al. Organotypic 3D Cell-Architecture Impacts the Expression Pattern of miRNAs–mRNAs Network in Breast Cancer SKBR3 Cells. Non-Coding RNA 2023, 9, 66. https://doi.org/10.3390/ncrna9060066
Gastélum-López MdlÁ, Aguilar-Medina M, García Mata C, López-Gutiérrez J, Romero-Quintana G, Bermúdez M, Avendaño-Felix M, López-Camarillo C, Pérez-Plascencia C, Beltrán AS, et al. Organotypic 3D Cell-Architecture Impacts the Expression Pattern of miRNAs–mRNAs Network in Breast Cancer SKBR3 Cells. Non-Coding RNA. 2023; 9(6):66. https://doi.org/10.3390/ncrna9060066
Chicago/Turabian StyleGastélum-López, María de los Ángeles, Maribel Aguilar-Medina, Cristina García Mata, Jorge López-Gutiérrez, Geovanni Romero-Quintana, Mercedes Bermúdez, Mariana Avendaño-Felix, César López-Camarillo, Carlos Pérez-Plascencia, Adriana S Beltrán, and et al. 2023. "Organotypic 3D Cell-Architecture Impacts the Expression Pattern of miRNAs–mRNAs Network in Breast Cancer SKBR3 Cells" Non-Coding RNA 9, no. 6: 66. https://doi.org/10.3390/ncrna9060066