
Extracellular microRNAs in Relation to Weight Loss—A Systematic Review and Meta-Analysis


Abstract
:1. Introduction
2. Results
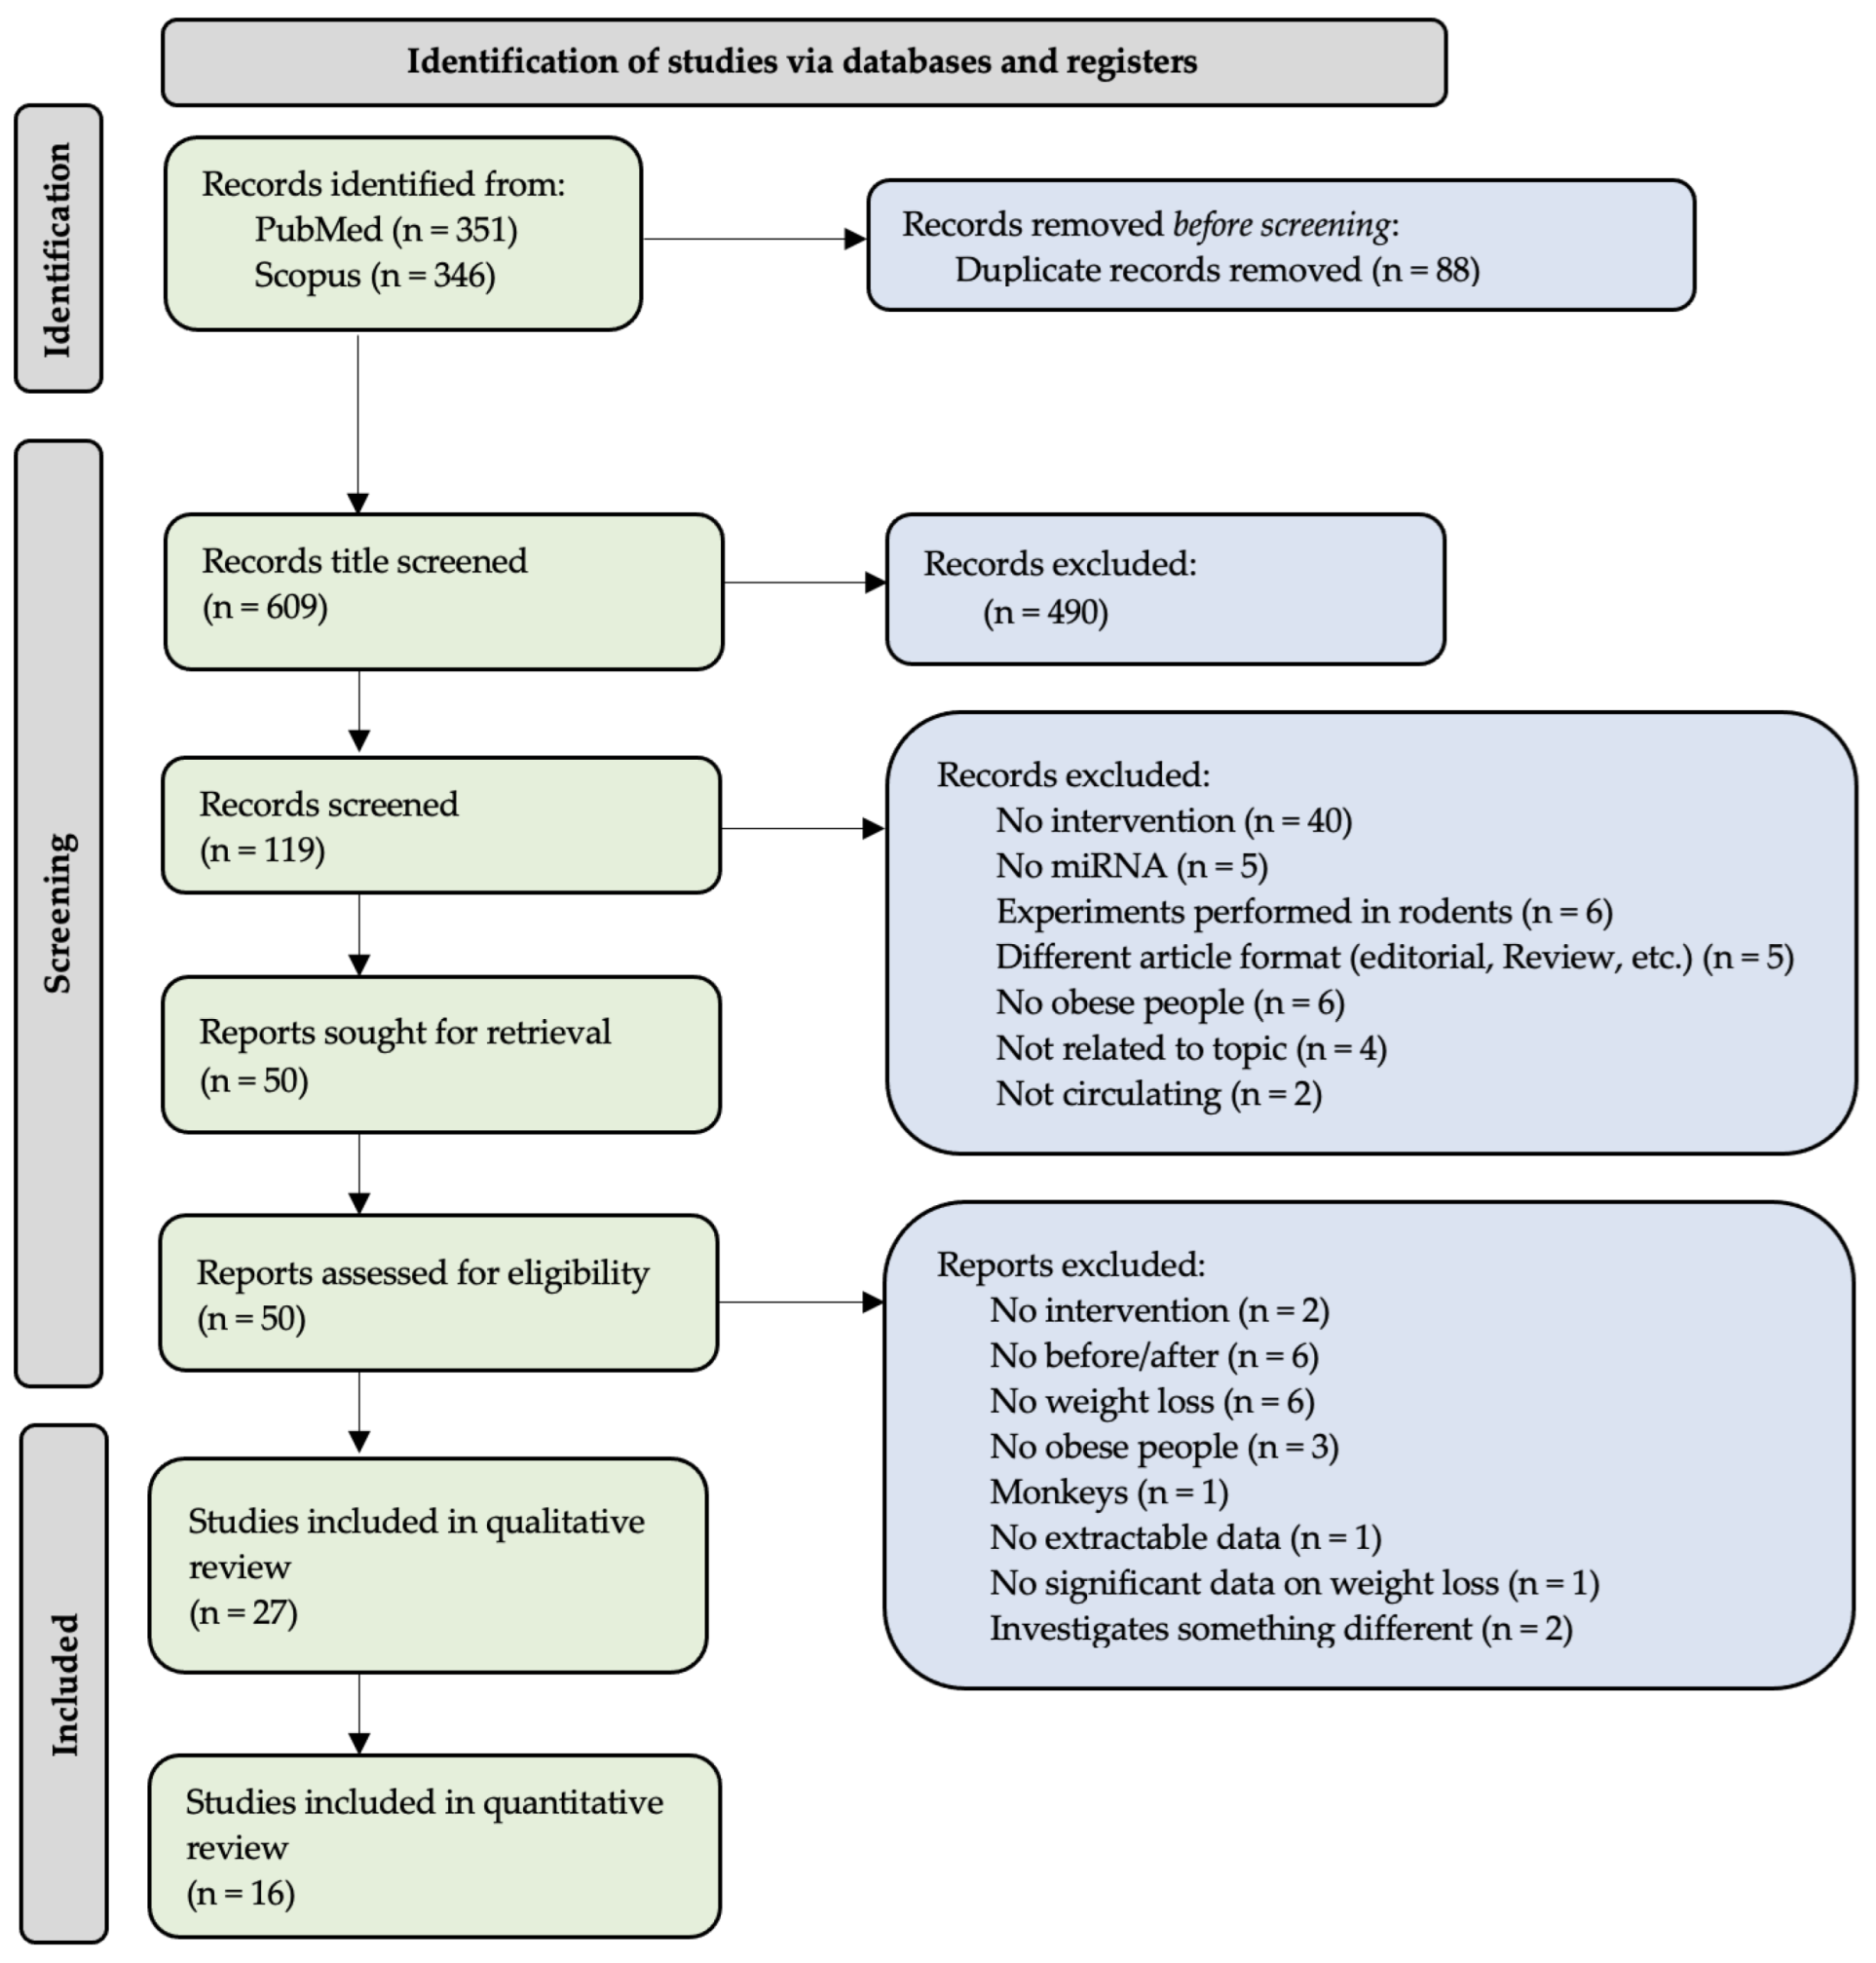
2.1. Data Inclusion
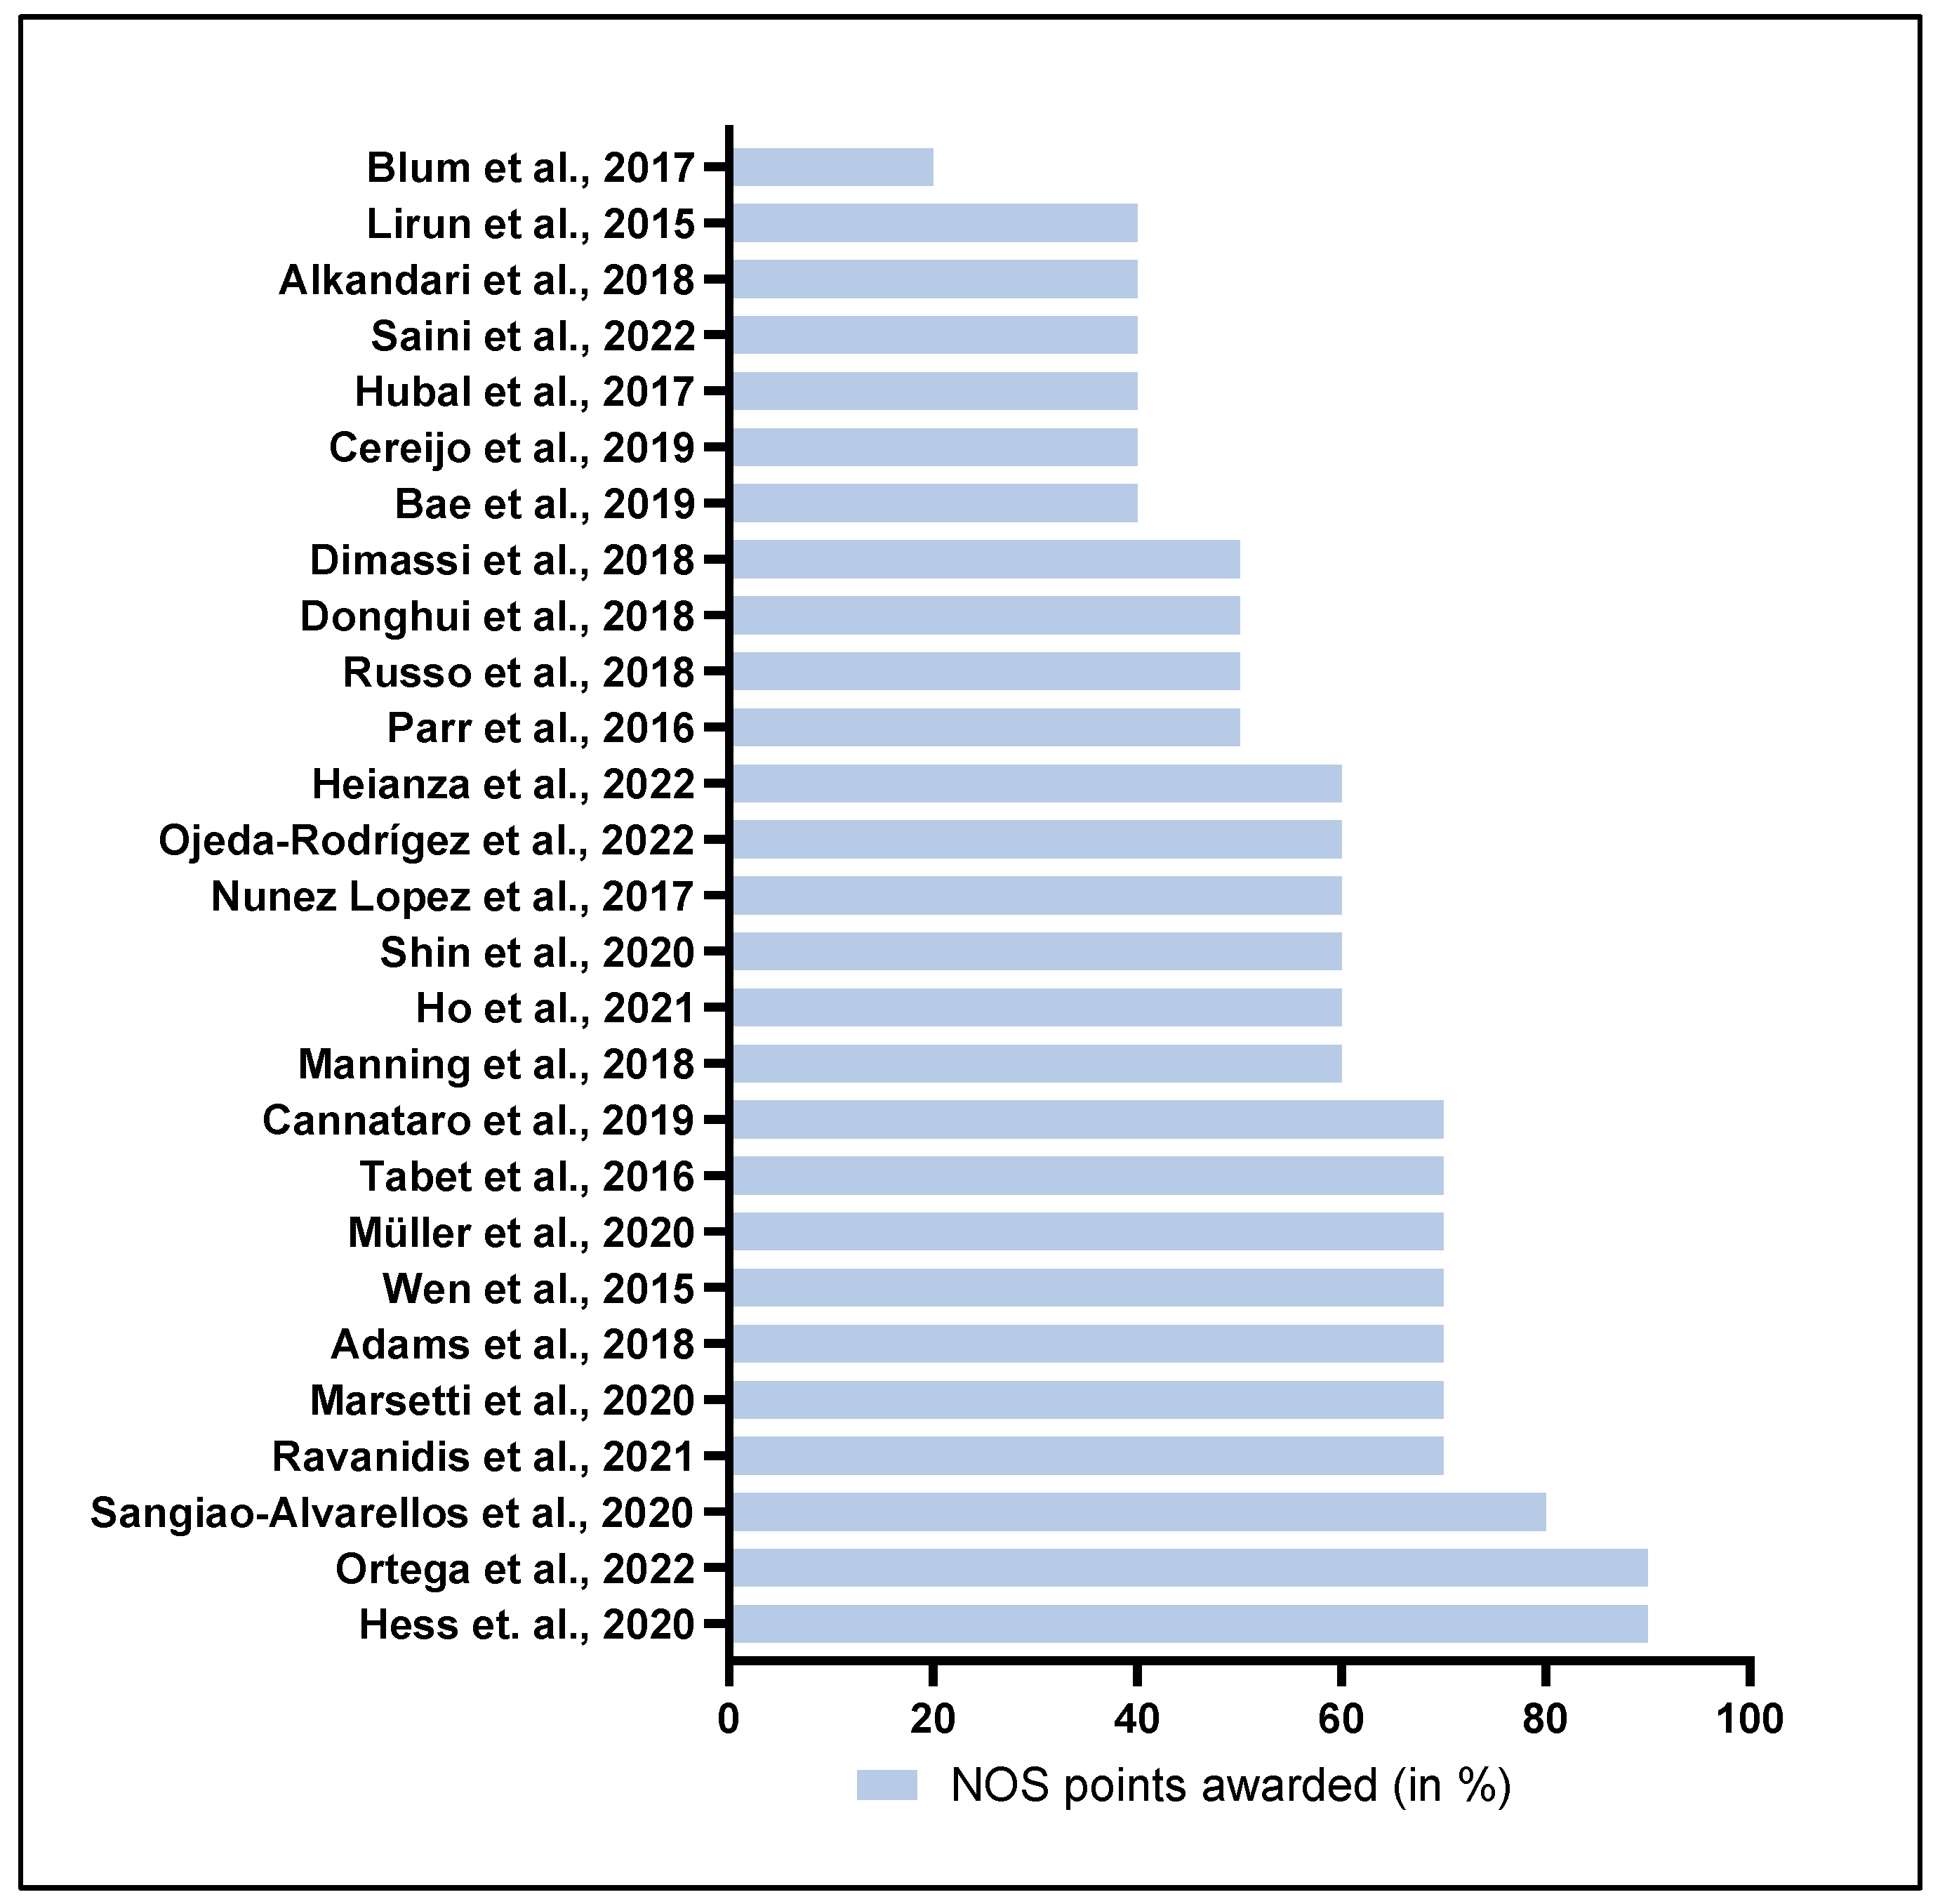
2.2. Estimation of Study Quality
2.3. Patient Populations in the Included Studies
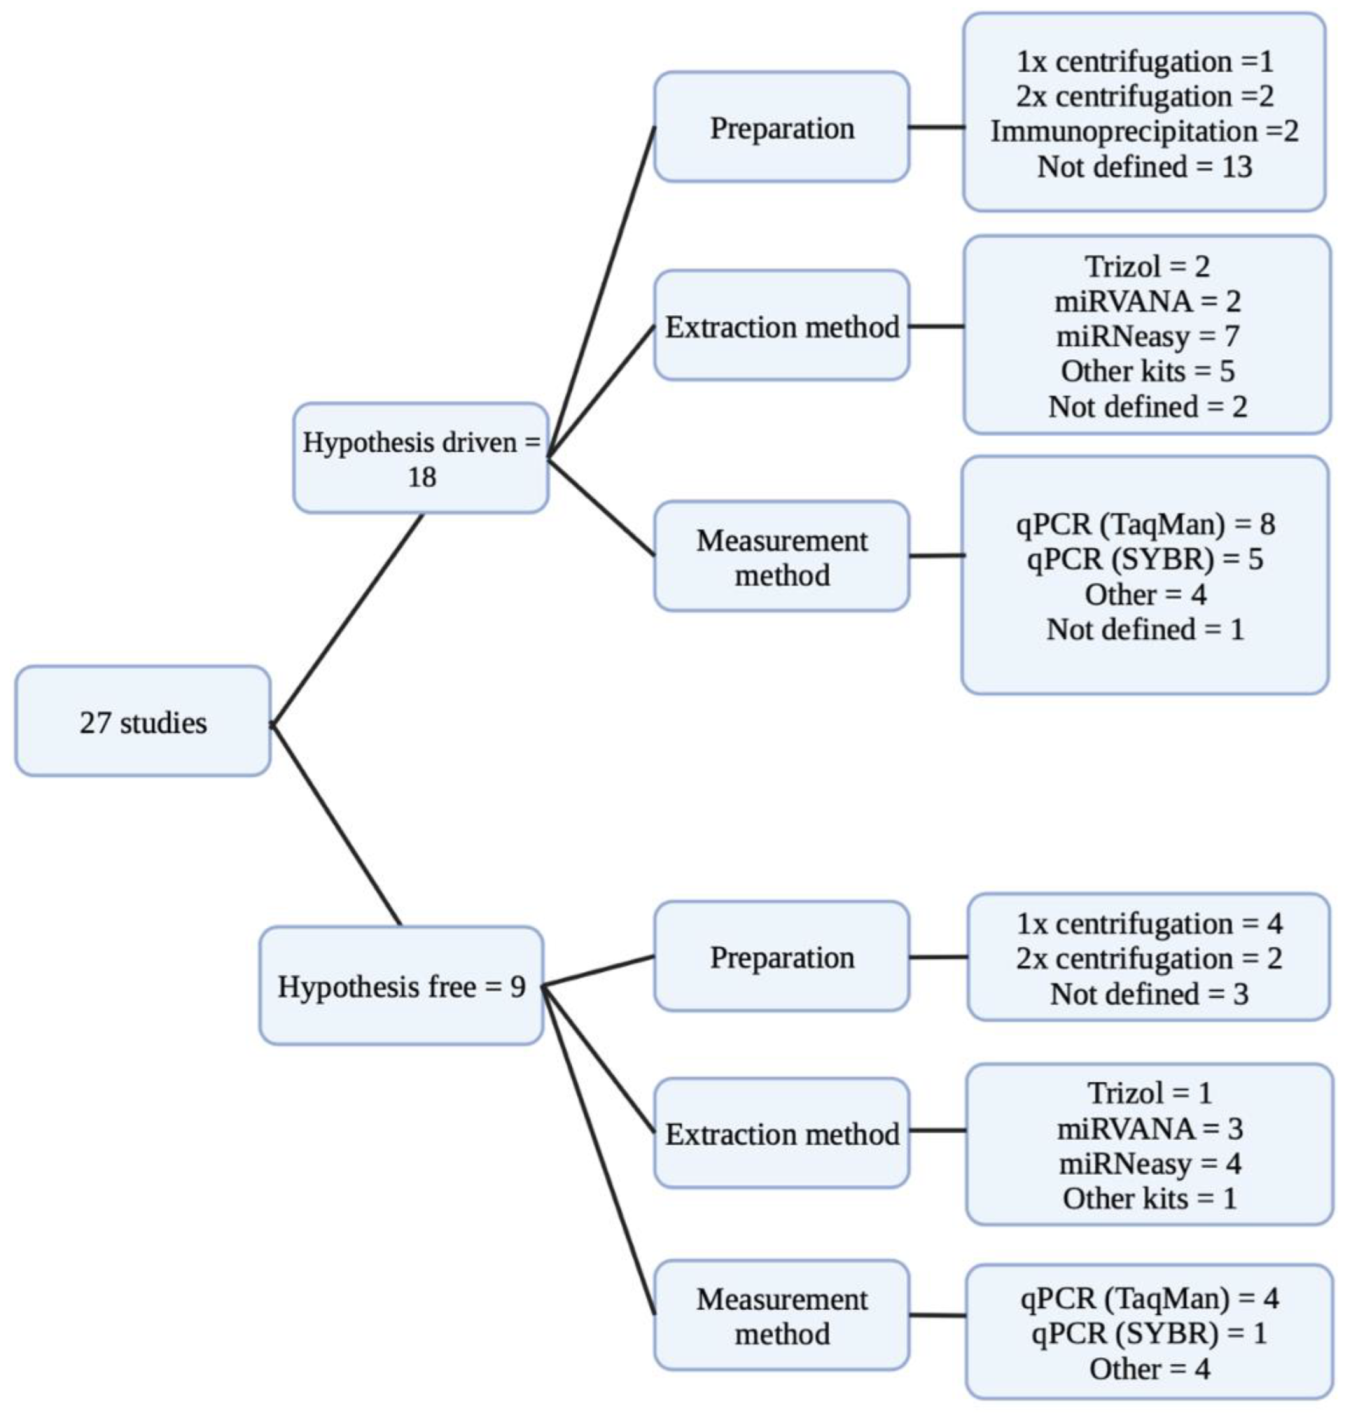
2.4. Evaluation of Pre-Analytical Factors
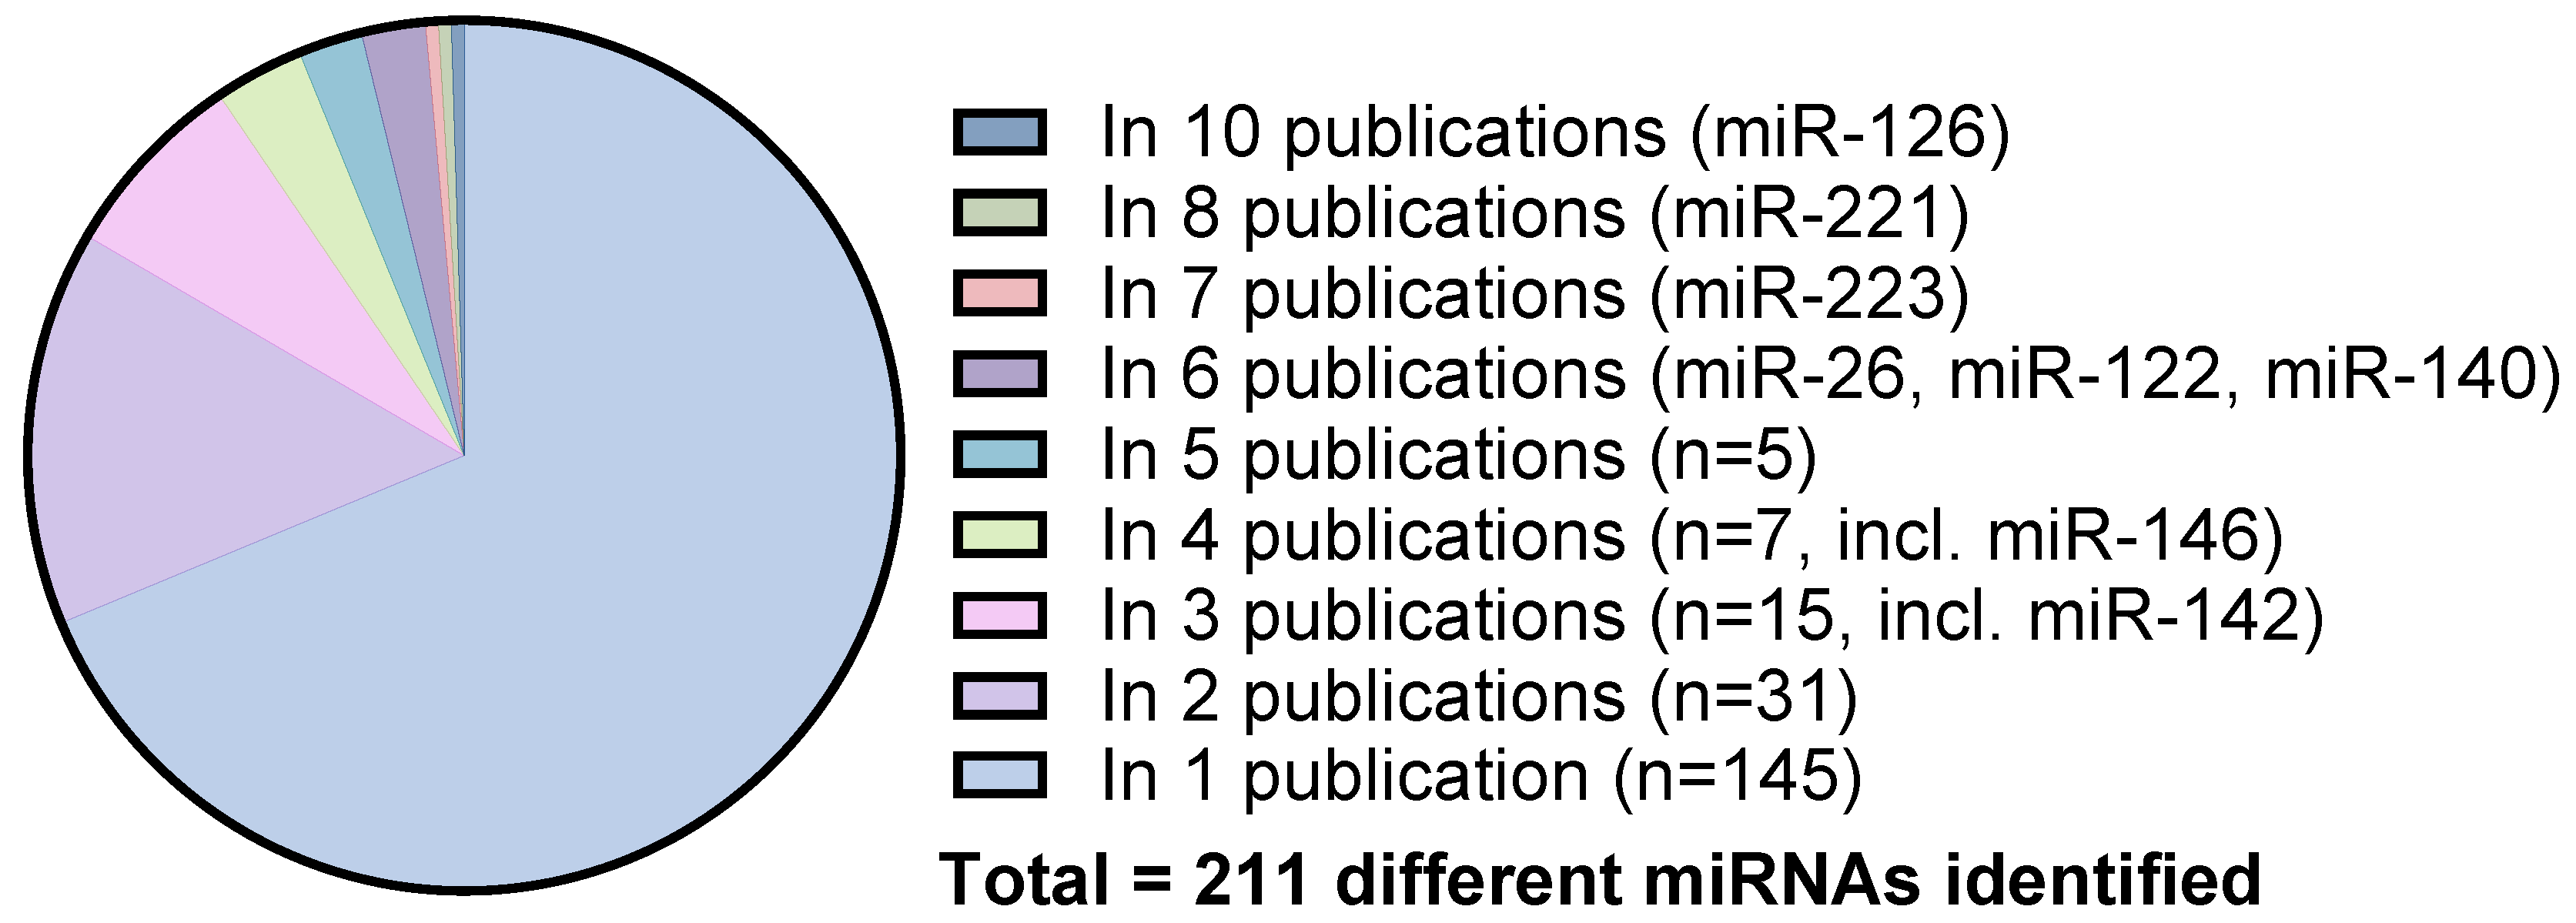
2.5. miRNA Diversity across the Included Studies
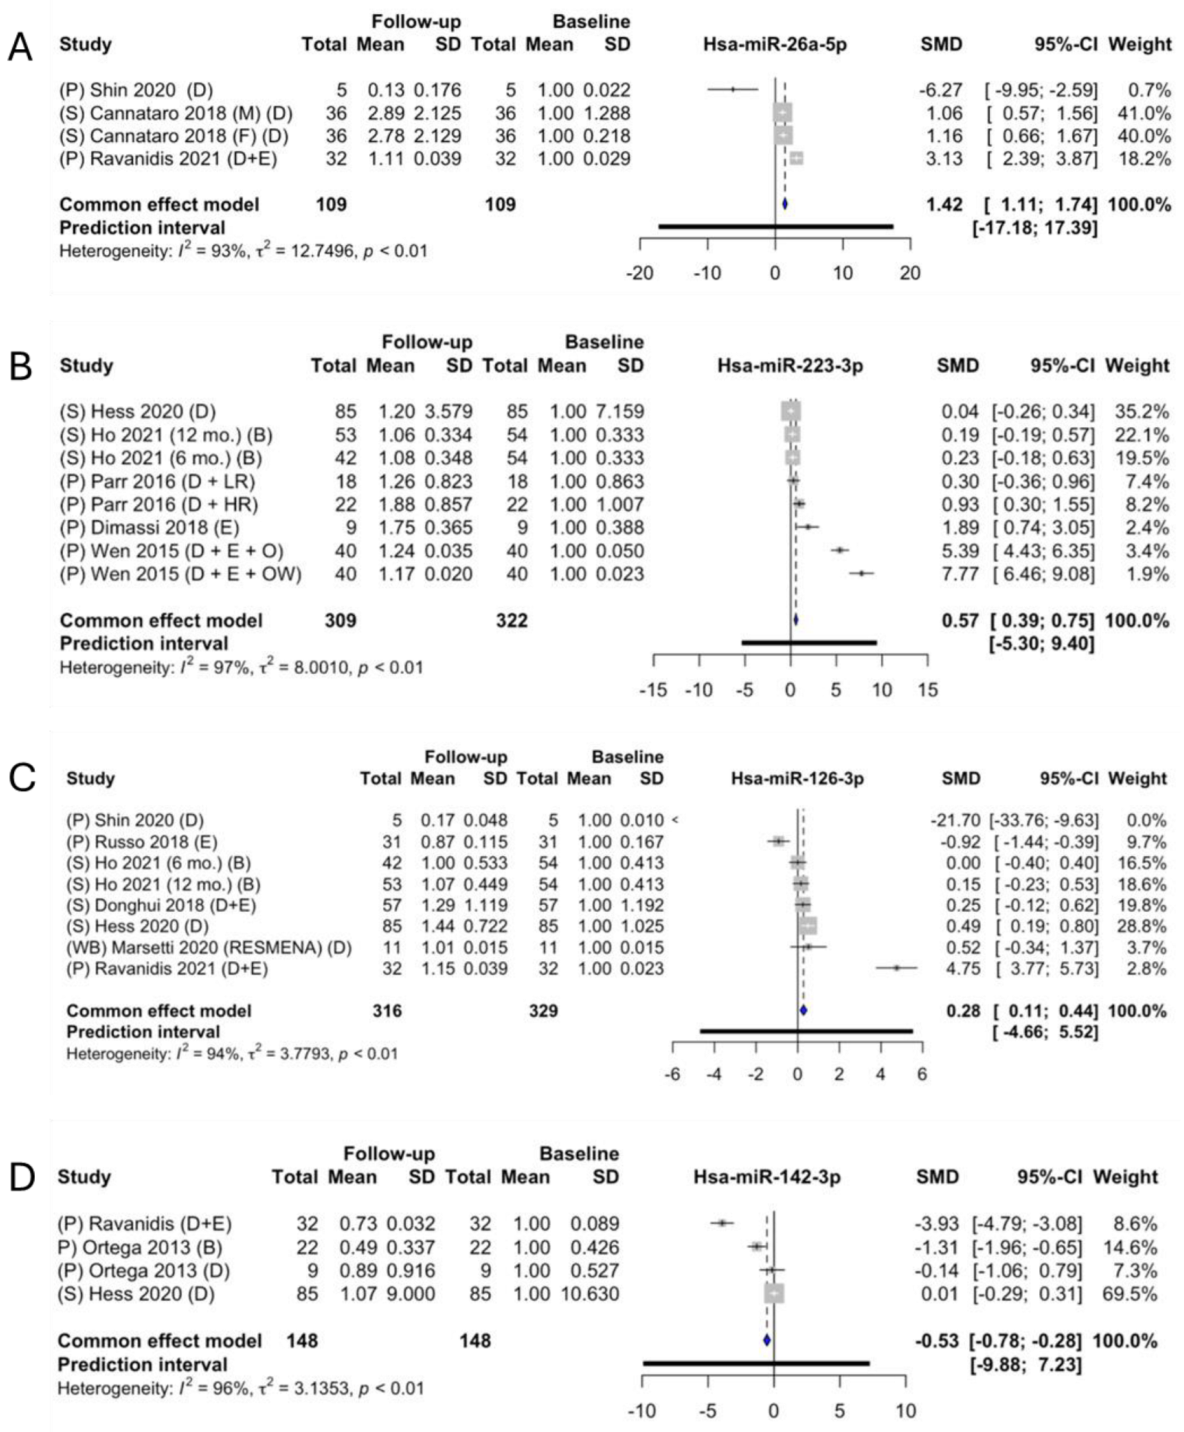
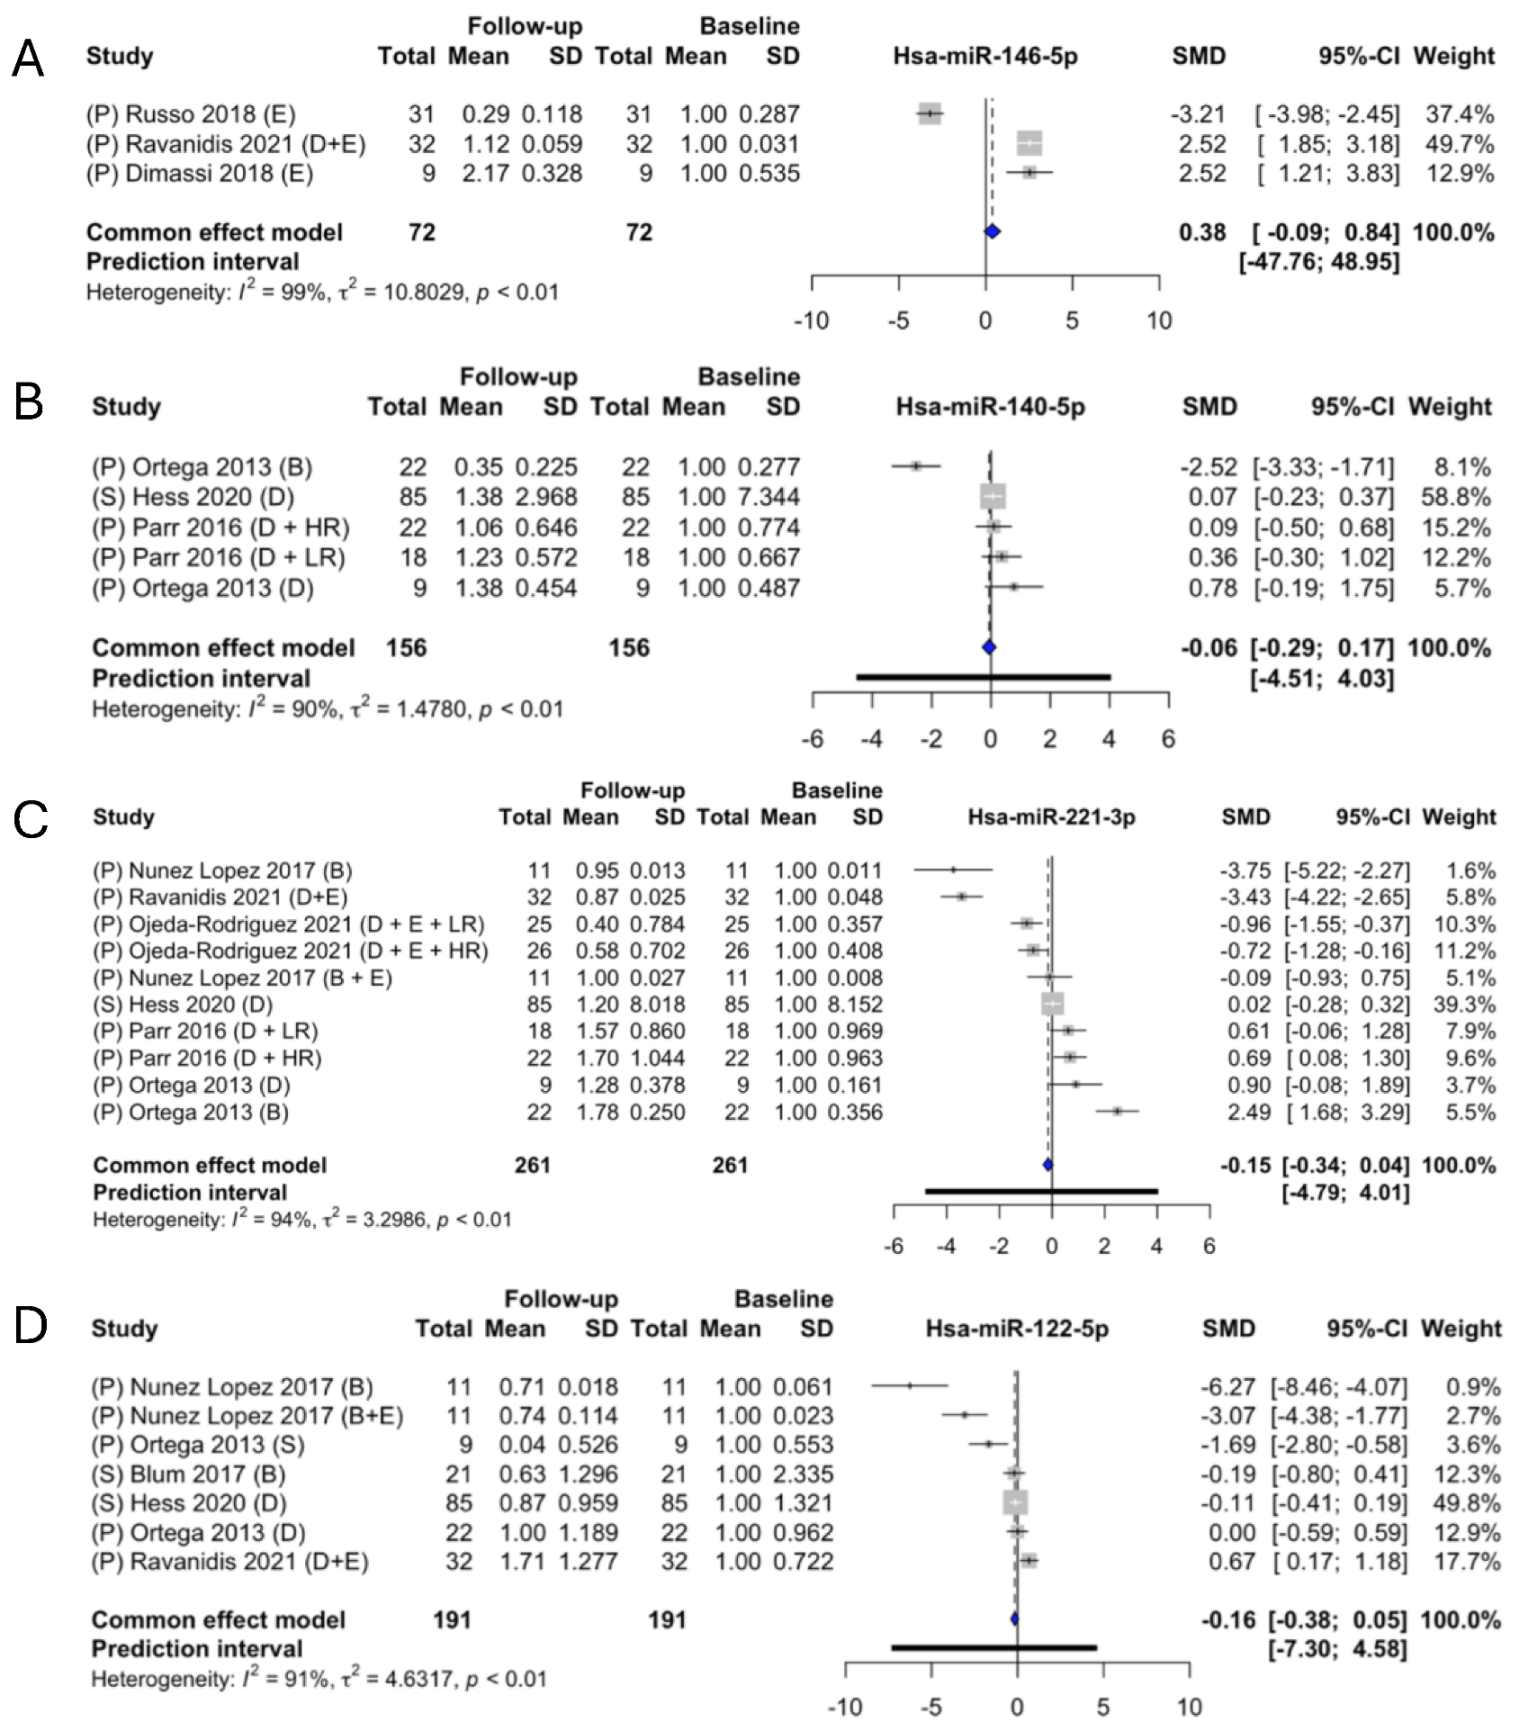
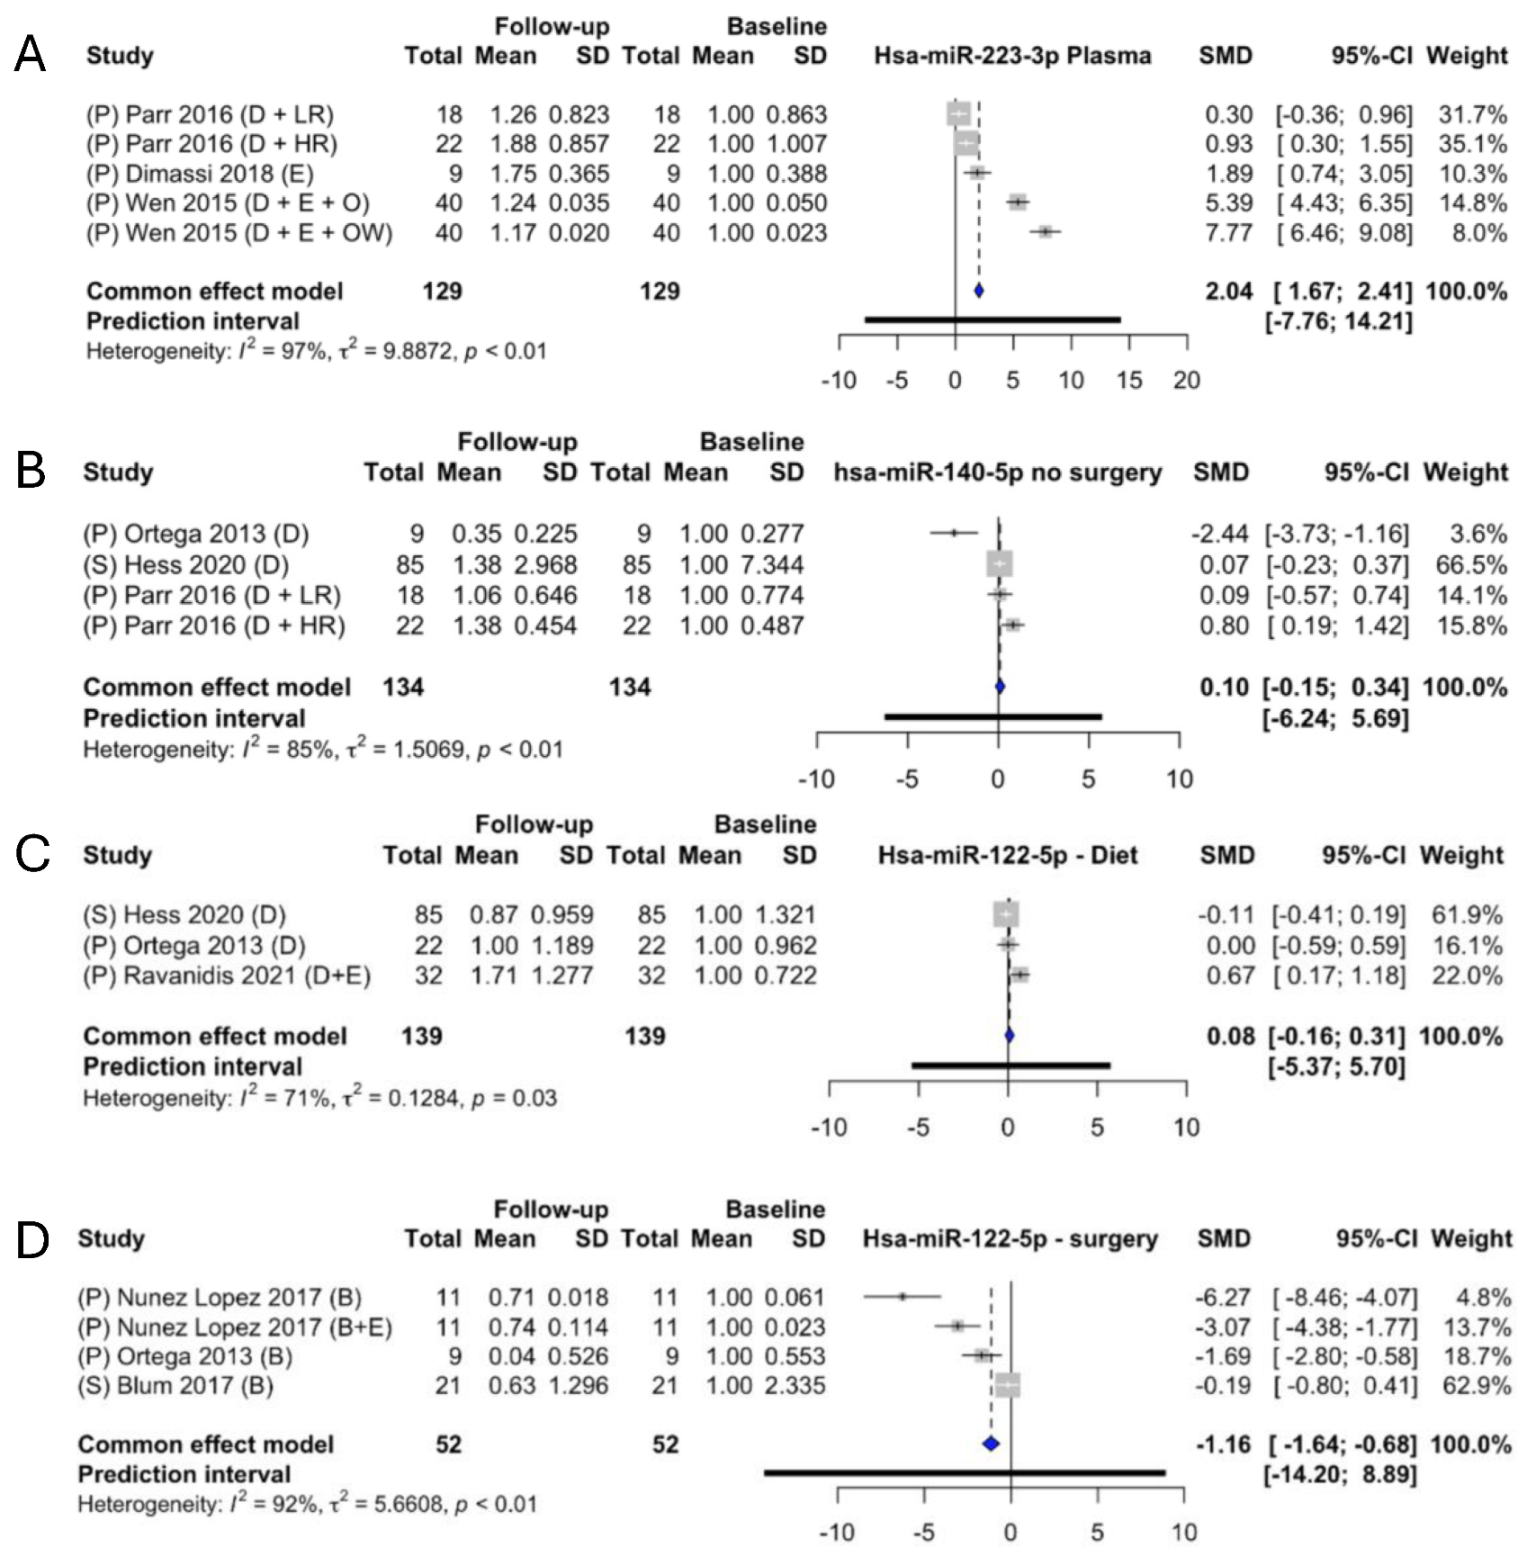
2.6. Meta-Analysis of the Identified miRNAs
3. Discussion
4. Materials and Methods
4.1. Data Extraction
4.2. Study Quality Estimations
4.3. Statistics and Futher Data Analysis
5. Conclusions
Supplementary Materials
Author Contributions
Funding
Institutional Review Board Statement
Informed Consent Statement
Data Availability Statement
Conflicts of Interest
References
- World Health Organization. Obesity and Overweight: Fact Sheets. 2021. Available online: https://www.who.int/news-room/fact-sheets/detail/obesity-and-overweight (accessed on 9 September 2023).
- Afshin, A.; Forouzanfar, M.H.; Reitsma, M.B.; Sur, P.; Estep, K.; Lee, A.; Marczak, L.; Mokdad, A.H.; Moradi-Lakeh, M.; Naghavi, M.; et al. Health Effects of Overweight and Obesity in 195 Countries over 25 Years. N. Engl. J. Med. 2017, 377, 13–27. [Google Scholar] [CrossRef]
- World Health Organization. Obesity: Preventing and managing the global epidemic. Report of a WHO consultation. World Health Organ. Tech. Rep. Ser. 2000, 894, 1–253. Available online: https://apps.who.int/iris/handle/10665/42330 (accessed on 9 September 2023).
- Price, N.L.; Ramirez, C.M.; Fernandez-Hernando, C. Relevance of microRNA in metabolic diseases. Crit. Rev. Clin. Lab. Sci. 2014, 51, 305–320. [Google Scholar] [CrossRef] [PubMed]
- Vienberg, S.; Geiger, J.; Madsen, S.; Dalgaard, L.T. MicroRNAs in metabolism. Acta Physiol. 2017, 219, 346–361. [Google Scholar] [CrossRef]
- Chen, X.; Ba, Y.; Ma, L.; Cai, X.; Yin, Y.; Wang, K.; Guo, J.; Zhang, Y.; Chen, J.; Guo, X.; et al. Characterization of microRNAs in serum: A novel class of biomarkers for diagnosis of cancer and other diseases. Cell Res. 2008, 18, 997–1006. [Google Scholar] [CrossRef] [PubMed]
- Ortega, F.J.; Mercader, J.M.; Catalán, V.; Moreno-Navarrete, J.M.; Pueyo, N.; Sabater, M.; Gómez-Ambrosi, J.; Anglada, R.; Fernández-Formoso, J.A.; Ricart, W.; et al. Targeting the circulating microRNA signature of obesity. Clin. Chem. 2013, 59, 781–792. [Google Scholar] [CrossRef]
- Atic, A.I.; Thiele, M.; Munk, A.; Dalgaard, L.T. Circulating microRNAs associated with non-alcoholic fatty liver disease. Am. J. Physiol. Cell Physiol. 2023, 32, C588–C602. [Google Scholar] [CrossRef]
- Brandao, B.B.; Lino, M.; Kahn, C.R. Extracellular miRNAs as mediators of obesity-associated disease. J. Physiol. 2022, 600, 1155–1169. [Google Scholar] [CrossRef]
- Santos, D.; Carvalho, E. Adipose-related microRNAs as modulators of the cardiovascular system: The role of epicardial adipose tissue. J. Physiol. 2022, 600, 1171–1187. [Google Scholar] [CrossRef]
- Dinesen, S.; El-Faitarouni, A.; Dalgaard, L.T. Circulating microRNAs associated with gestational diabetes mellitus: Useful biomarkers? J. Endocrinol. 2023, 256, e220170. [Google Scholar] [CrossRef]
- Hess, A.L.; Larsen, L.H.; Udesen, P.B.; Sanz, Y.; Larsen, T.M.; Dalgaard, L.T. Levels of Circulating miR-122 are Associated with Weight Loss and Metabolic Syndrome. Obesity 2020, 28, 493–501. [Google Scholar] [CrossRef] [PubMed]
- Page, M.J.; McKenzie, J.E.; Bossuyt, P.M.; Boutron, I.; Hoffmann, T.C.; Mulrow, C.D.; Shamseer, L.; Tetzlaff, J.M.; Akl, E.A.; Brennan, S.E.; et al. The PRISMA 2020 statement: An updated guideline for reporting systematic reviews. BMJ 2021, 372, n71. [Google Scholar] [CrossRef] [PubMed]
- Page, M.J.; Moher, D.; Bossuyt, P.M.; Boutron, I.; Hoffmann, T.C.; Mulrow, C.D.; Shamseer, L.; Tetzlaff, J.M.; Akl, E.A.; Brennan, S.E.; et al. PRISMA 2020 explanation and elaboration: Updated guidance and exemplars for reporting systematic reviews. BMJ 2021, 372, n160. [Google Scholar] [CrossRef] [PubMed]
- Blum, A.; Yehuda, H.; Geron, N.; Meerson, A. Elevated Levels of miR-122 in Serum May Contribute to Improved Endothelial Function and Lower Oncologic Risk Following Bariatric Surgery. Isr. Med. Assoc. J. 2017, 19, 620–624. [Google Scholar]
- Cannataro, R.; Perri, M.; Gallelli, L.; Caroleo, M.C.; De Sarro, G.; Cione, E. Ketogenic Diet Acts on Body Remodeling and MicroRNAs Expression Profile. Microrna 2019, 8, 116–126. [Google Scholar] [CrossRef]
- Dimassi, S.; Karkeni, E.; Laurant, P.; Tabka, Z.; Landrier, J.F.; Riva, C. Microparticle miRNAs as Biomarkers of Vascular Function and Inflammation Response to Aerobic Exercise in Obesity? Obesity 2018, 26, 1584–1593. [Google Scholar] [CrossRef]
- Donghui, T.; Shuang, B.; Xulong, L.; Meng, Y.; Yujing, G.; Yujie, H.; Juan, L.; Dongsheng, Y. Improvement of microvascular endothelial dysfunction induced by exercise and diet is associated with microRNA-126 in obese adolescents. Microvasc. Res. 2019, 123, 86–91. [Google Scholar] [CrossRef]
- Ho, J.H.; Ong, K.L.; Cuesta Torres, L.F.; Liu, Y.; Adam, S.; Iqbal, Z.; Dhage, S.; Ammori, B.J.; Syed, A.A.; Rye, K.A.; et al. High density lipoprotein-associated miRNA is increased following Roux-en-Y gastric bypass surgery for severe obesity. J. Lipid Res. 2021, 62, 100043. [Google Scholar] [CrossRef]
- Nunez Lopez, Y.O.; Coen, P.M.; Goodpaster, B.H.; Seyhan, A.A. Gastric bypass surgery with exercise alters plasma microRNAs that predict improvements in cardiometabolic risk. Int. J. Obes. 2017, 41, 1121–1130. [Google Scholar] [CrossRef]
- Manning, P.; Munasinghe, P.E.; Bellae Papannarao, J.; Gray, A.R.; Sutherland, W.; Katare, R. Acute Weight Loss Restores Dysregulated Circulating MicroRNAs in Individuals Who Are Obese. J. Clin. Endocrinol. Metab. 2019, 104, 1239–1248. [Google Scholar] [CrossRef]
- Marsetti, P.S.; Milagro, F.I.; Zulet, M.A.; Martinez, J.A.; Lorente-Cebrian, S. Changes in miRNA expression with two weight-loss dietary strategies in a population with metabolic syndrome. Nutrition 2021, 83, 111085. [Google Scholar] [CrossRef]
- Ojeda-Rodriguez, A.; Assmann, T.S.; Alonso-Pedrero, L.; Azcona-Sanjulian, M.C.; Milagro, F.I.; Marti, A. Circulating miRNAs in girls with abdominal obesity: miR-221-3p as a biomarker of response to weight loss interventions. Pediatr. Obes. 2022, 17, e12910. [Google Scholar] [CrossRef] [PubMed]
- Parr, E.B.; Camera, D.M.; Burke, L.M.; Phillips, S.M.; Coffey, V.G.; Hawley, J.A. Circulating MicroRNA Responses between ‘High’ and ‘Low’ Responders to a 16-Wk Diet and Exercise Weight Loss Intervention. PLoS ONE 2016, 11, e0152545. [Google Scholar] [CrossRef] [PubMed]
- Ravanidis, S.; Grundler, F.; de Toledo, F.W.; Dimitriou, E.; Tekos, F.; Skaperda, Z.; Kouretas, D.; Doxakis, E. Fasting-mediated metabolic and toxicity reprogramming impacts circulating microRNA levels in humans. Food Chem. Toxicol. 2021, 152, 112187. [Google Scholar] [CrossRef]
- Russo, A.; Bartolini, D.; Mensa, E.; Torquato, P.; Albertini, M.C.; Olivieri, F.; Testa, R.; Rossi, S.; Piroddi, M.; Cruciani, G.; et al. Physical Activity Modulates the Overexpression of the Inflammatory miR-146a-5p in Obese Patients. IUBMB Life 2018, 70, 1012–1022. [Google Scholar] [CrossRef] [PubMed]
- Shin, P.K.; Kim, M.S.; Park, S.J.; Kwon, D.Y.; Kim, M.J.; Yang, H.J.; Kim, S.H.; Kim, K.; Chun, S.; Lee, H.J.; et al. A Traditional Korean Diet Alters the Expression of Circulating MicroRNAs Linked to Diabetes Mellitus in a Pilot Trial. Nutrients 2020, 12, 2558. [Google Scholar] [CrossRef]
- Wen, D.; Qiao, P.; Wang, L. Circulating microRNA-223 as a potential biomarker for obesity. Obes. Res. Clin. Pract. 2015, 9, 398–404. [Google Scholar] [CrossRef]
- Adams, B.D.; Arem, H.; Hubal, M.J.; Cartmel, B.; Li, F.; Harrigan, M.; Sanft, T.; Cheng, C.J.; Pusztai, L.; Irwin, M.L. Exercise and weight loss interventions and miRNA expression in women with breast cancer. Breast Cancer Res. Treat. 2018, 170, 55–67. [Google Scholar] [CrossRef]
- Alkandari, A.; Ashrafian, H.; Sathyapalan, T.; Sedman, P.; Darzi, A.; Holmes, E.; Athanasiou, T.; Atkin, S.L.; Gooderham, N.J. Improved physiology and metabolic flux after Roux-en-Y gastric bypass is associated with temporal changes in the circulating microRNAome: A longitudinal study in humans. BMC Obes. 2018, 5, 20. [Google Scholar] [CrossRef]
- Bae, Y.U.; Kim, Y.; Lee, H.; Kim, H.; Jeon, J.S.; Noh, H.; Han, D.C.; Ryu, S.; Kwon, S.H. Bariatric Surgery Alters microRNA Content of Circulating Exosomes in Patients with Obesity. Obesity 2019, 27, 264–271. [Google Scholar] [CrossRef]
- Cereijo, R.; Taxeras, S.D.; Piquer-Garcia, I.; Pellitero, S.; Martinez, E.; Tarasco, J.; Moreno, P.; Balibrea, J.; Puig-Domingo, M.; Jimenez-Pavon, D.; et al. Elevated Levels of Circulating miR-92a Are Associated with Impaired Glucose Homeostasis in Patients with Obesity and Correlate with Metabolic Status After Bariatric Surgery. Obes. Surg. 2020, 30, 174–179. [Google Scholar] [CrossRef]
- Heianza, Y.; Krohn, K.; Yaskolka Meir, A.; Wang, X.; Ziesche, S.; Ceglarek, U.; Bluher, M.; Keller, M.; Kovacs, P.; Shai, I.; et al. Changes in Circulating miR-375-3p and Improvements in Visceral and Hepatic Fat Contents in Response to Lifestyle Interventions: The CENTRAL Trial. Diabetes Care 2022, 45, 1911–1913. [Google Scholar] [CrossRef] [PubMed]
- Hubal, M.J.; Nadler, E.P.; Ferrante, S.C.; Barberio, M.D.; Suh, J.H.; Wang, J.; Dohm, G.L.; Pories, W.J.; Mietus-Snyder, M.; Freishtat, R.J. Circulating adipocyte-derived exosomal MicroRNAs associated with decreased insulin resistance after gastric bypass. Obesity 2017, 25, 102–110. [Google Scholar] [CrossRef]
- Lirun, K.; Sewe, M.; Yong, W. A Pilot Study: The Effect of Roux-en-Y Gastric Bypass on the Serum MicroRNAs of the Type 2 Diabetes Patient. Obes. Surg. 2015, 25, 2386–2392. [Google Scholar] [CrossRef] [PubMed]
- Muller, S.; Wallner, S.; Schmitz, G.; Loew, T.; Stempfl, T.; Mohle, C.; Strack, C.; Sag, S.; Baessler, A.; Fischer, M. SNP dependent modulation of circulating miRNAs from the miR25/93/106 cluster in patients undergoing weight loss. Gene 2020, 753, 144787. [Google Scholar] [CrossRef]
- Saini, S.K.; Singh, A.; Saini, M.; Gonzalez-Freire, M.; Leeuwenburgh, C.; Anton, S.D. Time-Restricted Eating Regimen Differentially Affects Circulatory miRNA Expression in Older Overweight Adults. Nutrients 2022, 14, 1843. [Google Scholar] [CrossRef]
- Sangiao-Alvarellos, S.; Theofilatos, K.; Barwari, T.; Gutmann, C.; Takov, K.; Singh, B.; Juiz-Valina, P.; Varela-Rodriguez, B.M.; Outeirino-Blanco, E.; Duregotti, E.; et al. Metabolic recovery after weight loss surgery is reflected in serum microRNAs. BMJ Open Diabetes Res. Care 2020, 8, e001441. [Google Scholar] [CrossRef]
- Tabet, F.; Cuesta Torres, L.F.; Ong, K.L.; Shrestha, S.; Choteau, S.A.; Barter, P.J.; Clifton, P.; Rye, K.A. High-Density Lipoprotein-Associated miR-223 Is Altered after Diet-Induced Weight Loss in Overweight and Obese Males. PLoS ONE 2016, 11, e0151061. [Google Scholar] [CrossRef]
- Xu, J.; An, P.; Winkler, C.A.; Yu, Y. Dysregulated microRNAs in Hepatitis B Virus-Related Hepatocellular Carcinoma: Potential as Biomarkers and Therapeutic Targets. Front. Oncol. 2020, 10, 1271. [Google Scholar] [CrossRef]
- Wroblewski, A.; Strycharz, J.; Oszajca, K.; Czarny, P.; Swiderska, E.; Matyjas, T.; Zieleniak, A.; Rucinska, M.; Pomorski, L.; Drzewoski, J.; et al. Dysregulation of Inflammation, Oxidative Stress, and Glucose Metabolism-Related Genes and miRNAs in Visceral Adipose Tissue of Women with Type 2 Diabetes Mellitus. Med. Sci. Monit. 2023, 29, e939299. [Google Scholar] [CrossRef]
- Xu, S.; Wang, Y.; Li, Z.; Hua, Q.; Jiang, M.; Fan, X. LncRNA GAS5 Knockdown Mitigates Hepatic Lipid Accumulation via Regulating MiR-26a-5p/PDE4B to Activate cAMP/CREB Pathway. Front. Endocrinol. 2022, 13, 889858. [Google Scholar] [CrossRef]
- Sanchez-Ceinos, J.; Rangel-Zuniga, O.A.; Clemente-Postigo, M.; Podadera-Herreros, A.; Camargo, A.; Alcala-Diaz, J.F.; Guzman-Ruiz, R.; Lopez-Miranda, J.; Malagon, M.M. miR-223-3p as a potential biomarker and player for adipose tissue dysfunction preceding type 2 diabetes onset. Mol. Ther. Nucleic Acids 2021, 23, 1035–1052. [Google Scholar] [CrossRef]
- Udesen, P.B.; Glintborg, D.; Sorensen, A.E.; Svendsen, R.; Nielsen, N.L.S.; Wissing, M.L.M.; Andersen, M.S.; Englund, A.L.M.; Dalgaard, L.T. Metformin decreases miR-122, miR-223 and miR-29a in women with polycystic ovary syndrome. Endocr. Connect. 2020, 9, 1075–1084. [Google Scholar] [CrossRef]
- Vickers, K.C.; Landstreet, S.R.; Levin, M.G.; Shoucri, B.M.; Toth, C.L.; Taylor, R.C.; Palmisano, B.T.; Tabet, F.; Cui, H.L.; Rye, K.A.; et al. MicroRNA-223 coordinates cholesterol homeostasis. Proc. Natl. Acad. Sci. USA 2014, 111, 14518–14523. [Google Scholar] [CrossRef]
- Yoffe, L.; Polsky, A.; Gilam, A.; Raff, C.; Mecacci, F.; Ognibene, A.; Crispi, F.; Gratacos, E.; Kanety, H.; Mazaki-Tovi, S.; et al. Early diagnosis of gestational diabetes mellitus using circulating microRNAs. Eur. J. Endocrinol. 2019, 181, 565–577. [Google Scholar] [CrossRef]
- Zampetaki, A.; Kiechl, S.; Drozdov, I.; Willeit, P.; Mayr, U.; Prokopi, M.; Mayr, A.; Weger, S.; Oberhollenzer, F.; Bonora, E.; et al. Plasma microRNA profiling reveals loss of endothelial miR-126 and other microRNAs in type 2 diabetes. Circ. Res. 2010, 107, 810–817. [Google Scholar]
- Zhu, H.; Leung, S.W. Identification of microRNA biomarkers in type 2 diabetes: A meta-analysis of controlled profiling studies. Diabetologia 2015, 58, 900–911. [Google Scholar] [CrossRef]
- Leierseder, S.; Petzold, T.; Zhang, L.; Loyer, X.; Massberg, S.; Engelhardt, S. MiR-223 is dispensable for platelet production and function in mice. Thromb. Haemost. 2013, 110, 1207–1214. [Google Scholar] [CrossRef]
- Castoldi, A.; Naffah de Souza, C.; Camara, N.O.; Moraes-Vieira, P.M. The Macrophage Switch in Obesity Development. Front. Immunol. 2015, 6, 637. [Google Scholar] [CrossRef]
- Krammer, T.L.; Mayr, M.; Hackl, M. microRNAs as promising biomarkers of platelet activity in antiplatelet therapy monitoring. Int. J. Mol. Sci. 2020, 21, 3477. [Google Scholar] [CrossRef]
- Parker, W.A.E.; Schulte, C.; Barwari, T.; Phoenix, F.; Pearson, S.M.; Mayr, M.; Grant, P.J.; Storey, R.F.; Ajjan, R.A. Aspirin, clopidogrel and prasugrel monotherapy in patients with type 2 diabetes mellitus: A double-blind randomised controlled trial of the effects on thrombotic markers and microRNA levels. Cardiovasc. Diabetol. 2020, 19, 3. [Google Scholar] [CrossRef]
- Willeit, P.; Zampetaki, A.; Dudek, K.; Kaudewitz, D.; King, A.; Kirkby, N.S.; Crosby-Nwaobi, R.; Prokopi, M.; Drozdov, I.; Langley, S.R.; et al. Circulating microRNAs as novel biomarkers for platelet activation. Circ. Res. 2013, 112, 595–600. [Google Scholar] [CrossRef]
- Zhang, T.; Li, L.; Shang, Q.; Lv, C.; Wang, C.; Su, B. Circulating miR-126 is a potential biomarker to predict the onset of type 2 diabetes mellitus in susceptible individuals. Biochem. Biophys. Res. Commun. 2015, 463, 60–63. [Google Scholar] [CrossRef]
- Liu, Y.; Wu, W.; Zhou, L.; Cheng, L.; Miao, C. MicroRNA-142a-3p promotes the differentiation of 3T3-L1 preadipocytes by targeting high-mobility group AT-hook 1. Int. J. Clin. Exp. Pathol. 2018, 11, 5249–5256. [Google Scholar] [PubMed]
- Wen, J.; Friedman, J.R. miR-122 regulates hepatic lipid metabolism and tumor suppression. J. Clin. Investig. 2012, 122, 2773–2776. [Google Scholar] [CrossRef] [PubMed]
- Wang, R.; Hong, J.; Cao, Y.; Shi, J.; Gu, W.; Ning, G.; Zhang, Y.; Wang, W. Elevated circulating microRNA-122 is associated with obesity and insulin resistance in young adults. Eur. J. Endocrinol. 2015, 172, 291–300. [Google Scholar] [CrossRef] [PubMed]
- Willeit, P.; Skroblin, P.; Moschen, A.R.; Yin, X.; Kaudewitz, D.; Zampetaki, A.; Barwari, T.; Whitehead, M.; Ramirez, C.M.; Goedeke, L.; et al. Circulating MicroRNA-122 Is Associated With the Risk of New-Onset Metabolic Syndrome and Type 2 Diabetes. Diabetes 2017, 66, 347–357. [Google Scholar] [CrossRef] [PubMed]
- Page, M.J.; Shamseer, L.; Tricco, A.C. Registration of systematic reviews in PROSPERO: 30,000 records and counting. Syst. Rev. 2018, 7, 32. [Google Scholar] [CrossRef] [PubMed]
- Wells, G.A.; Shea, B.; O’Connel, D.; Peterson, J.; Welch, V.; Losos, M.; Tugwell, P. The Newcastle-Ottawa Scale (NOS) for Assessing the Quality of Nonrandomised Studies in Meta-Analyses. 2022. Available online: https://www.ohri.ca/programs/clinical_epidemiology/oxford.asp (accessed on 9 September 2023).


| Study | Title | Reference | Meta-Analysis |
|---|---|---|---|
| Blum et al. (2017) | Elevated Levels of miR-122 in Serum May Contribute to Improved Endothelial Function and Lower Oncologic Risk Following Bariatric Surgery | [15] | √ |
| Cannataro et al. (2019) | Ketogenic Diet Acts on Body Remodeling and MicroRNAs Expression Profile | [16] | √ |
| Dimassi et al. (2018) | Microparticle miRNAs as Biomarkers of Vascular Function and Inflammation Response to Aerobic Exercise in Obesity? | [17] | √ |
| Donghui et al. (2019) | Improvement of microvascular endothelial dysfunction induced by exercise T and diet is associated with microRNA-126 in obese adolescents | [18] | √ |
| Hess et al. (2020) | Levels of Circulating miR-122 are Associated with Weight Loss and Metabolic Syndrome | [12] | √ |
| Ho et al. (2021) | High density lipoprotein-associated miRNA is increased following Roux-en-Y gastric bypass surgery for severe obesity | [19] | √ |
| Nunez Lopez et al. (2017) | Gastric bypass surgery with exercise alters plasma microRNAs that predict improvements in cardiometabolic risk | [20] | √ |
| Manning et al. (2019) | Acute Weight Loss Restores Dysregulated Circulating MicroRNAs in Individuals Who Are Obese | [21] | √ |
| Marsetti et al. (2021) | Changes in miRNA expression with two weight-loss dietary strategies in a population with metabolic syndrome | [22] | √ |
| Ojeda-Rodríguez et al. (2022) | Circulating miRNAs in girls with abdominal obesity: miR-221-3p as a biomarker of response to weight loss interventions | [23] | √ |
| Ortega et al. (2013) | Targeting the Circulating MicroRNA Signature of Obesity | [7] | √ |
| Parr et al. (2016) | Circulating MicroRNA Responses between ‘High’ and ‘Low’ Responders to a 16-Wk Diet and Exercise Weight Loss Intervention | [24] | √ |
| Ravanidis et al. (2021) | Fasting-mediated metabolic and toxicity reprogramming impacts circulating microRNA levels in humans | [25] | √ |
| Russo et al. (2018) | Physical Activity Modulates the Overexpression of the Inflammatory miR-146a-5p in Obese Patients | [26] | √ |
| Shin et al. (2020) | A Traditional Korean Diet Alters the Expression of Circulating MicroRNAs Linked to Diabetes Mellitus in a Pilot Trial | [27] | √ |
| Wen et al. (2015) | Circulating microRNA-223 as a potential biomarker for obesity | [28] | √ |
| Study | Title | Reference |
|---|---|---|
| Adams et al. (2018) | Exercise and weight loss interventions and miRNA expression in women with breast cancer | [29] |
| Alkandari et al. (2018) | Improved physiology and metabolic flux after Roux-en-Y gastric bypass is associated with temporal changes in the circulating microRNAome: a longitudinal study in humans | [30] |
| Bae et al. (2019) | Bariatric Surgery Alters microRNA Content of Circulating Exosomes in Patients with Obesity | [31] |
| Cereijo et al. (2020) | Elevated Levels of Circulating miR-92a Are Associated with Impaired Glucose Homeostasis in Patients with Obesity and Correlate with Metabolic Status After Bariatric Surgery | [32] |
| Heianza et al. (2022) | Changes in Circulating miR-375-3p and Improvements in Visceral and Hepatic Fat Contents in Response to Lifestyle Interventions: The CENTRAL Trial | [33] |
| Hubal et al. (2017) | Circulating adipocyte-derived exosomal microRNAs associated with decreased insulin resistance after gastric bypass | [34] |
| Lirun et al. (2015) | A Pilot Study: The Effect of Roux-en-Y Gastric Bypass on the Serum MicroRNAs of the Type 2 Diabetes Patient | [35] |
| Müller et al. (2020) | SNP dependent modulation of circulating miRNAs from the miR25/93/106 T cluster in patients undergoing weight loss | [36] |
| Saini et al. (2022) | Time-Restricted Eating Regimen Differentially Affects Circulatory miRNA Expression in Older Overweight Adults | [37] |
| Sangiao-Alvarellos et al. (2020) | Metabolic recovery after weight loss surgery is reflected in serum microRNAs | [38] |
| Tabet et al. (2016) | High-Density Lipoprotein-Associated miR-223 Is Altered after Diet-Induced Weight Loss in Overweight and Obese Males | [39] |
Disclaimer/Publisher’s Note: The statements, opinions and data contained in all publications are solely those of the individual author(s) and contributor(s) and not of MDPI and/or the editor(s). MDPI and/or the editor(s) disclaim responsibility for any injury to people or property resulting from any ideas, methods, instructions or products referred to in the content. |
© 2023 by the authors. Licensee MDPI, Basel, Switzerland. This article is an open access article distributed under the terms and conditions of the Creative Commons Attribution (CC BY) license (https://creativecommons.org/licenses/by/4.0/).
Share and Cite
Veie, C.H.B.; Nielsen, I.M.T.; Frisk, N.L.S.; Dalgaard, L.T. Extracellular microRNAs in Relation to Weight Loss—A Systematic Review and Meta-Analysis. Non-Coding RNA 2023, 9, 53. https://doi.org/10.3390/ncrna9050053
Veie CHB, Nielsen IMT, Frisk NLS, Dalgaard LT. Extracellular microRNAs in Relation to Weight Loss—A Systematic Review and Meta-Analysis. Non-Coding RNA. 2023; 9(5):53. https://doi.org/10.3390/ncrna9050053
Chicago/Turabian StyleVeie, Camilla H. B., Isabella M. T. Nielsen, Nanna L. S. Frisk, and Louise T. Dalgaard. 2023. "Extracellular microRNAs in Relation to Weight Loss—A Systematic Review and Meta-Analysis" Non-Coding RNA 9, no. 5: 53. https://doi.org/10.3390/ncrna9050053