Article

T2DB: A Web Database for Long Non-Coding RNA Genes in Type II Diabetes

1
Section for Computational and RNA Biology, Department of Biology, University of Copenhagen, DK-2200 Copenhagen, Denmark
2
Center for RNA Medicine, Department of Clinical Medicine, Aalborg University, DK-2450 Copenhagen, Denmark
3
Center of Medical Innovation and Translational Research, Department of Medical Data Science, Graduate School of Medicine, Osaka University, Suita 565-0871, Japan
4
Center for Interdisciplinary Cardiovascular Sciences, Cardiovascular Division, Brigham and Women’s Hospital, Harvard Medical School, Boston, MA 02115, USA
5
Channing Division of Network Medicine, Brigham and Women’s Hospital, Harvard Medical School, Boston, MA 02115, USA
6
Center for Excellence in Vascular Biology, Brigham and Women’s Hospital, Harvard Medical School, Boston, MA 02115, USA
*
Authors to whom correspondence should be addressed.
Non-Coding RNA 2023, 9(3), 30; https://doi.org/10.3390/ncrna9030030
Submission received: 27 March 2023 / Revised: 1 May 2023 / Accepted: 4 May 2023 / Published: 8 May 2023
(This article belongs to the Special Issue Non-coding RNA and Diabetes 2.0)

Abstract

:
Type II diabetes (T2D) is a growing health problem worldwide due to increased levels of obesity and can lead to other life-threatening diseases, such as cardiovascular and kidney diseases. As the number of individuals diagnosed with T2D rises, there is an urgent need to understand the pathogenesis of the disease in order to prevent further harm to the body caused by elevated blood glucose levels. Recent advances in long non-coding RNA (lncRNA) research may provide insights into the pathogenesis of T2D. Although lncRNAs can be readily detected in RNA sequencing (RNA-seq) data, most published datasets of T2D patients compared to healthy donors focus only on protein-coding genes, leaving lncRNAs to be undiscovered and understudied. To address this knowledge gap, we performed a secondary analysis of published RNA-seq data of T2D patients and of patients with related health complications to systematically analyze the expression changes of lncRNA genes in relation to the protein-coding genes. Since immune cells play important roles in T2D, we conducted loss-of-function experiments to provide functional data on the T2D-related lncRNA USP30-AS1, using an in vitro model of pro-inflammatory macrophage activation. To facilitate lncRNA research in T2D, we developed a web application, T2DB, to provide a one-stop-shop for expression profiling of protein-coding and lncRNA genes in T2D patients compared to healthy donors or subjects without T2D.

1. Introduction

RNA sequencing has revealed that most of the mammalian genome is transcribed as RNA [1,2], although only a few percent of annotated transcribed regions correspond to the exons of protein-coding genes, with the rest being collectively termed non-coding RNAs (ncRNAs). These ncRNAs include ribosomal RNAs (rRNAs), transfer RNAs (tRNAs), small RNAs (e.g., microRNAs (microRNAs), small nuclear RNAs (snRNAs), and small nucleolar RNAs (snoRNAs)), and long ncRNAs (lncRNAs) [3,4]. LncRNAs have widely attracted the attention of researchers during the last two decades. They loosely refer to any ncRNA exceeding 200 nucleotides (nt) in length [5,6] and are typically named and characterized based on their nearest protein-coding gene [7,8]. Due to their broad definition and cell-type-specific expression patterns, many thousands of lncRNAs have been discovered in recent years [9,10], which have been implicated in a diverse range of functions including imprinting, epigenetic, transcriptional, post-transcriptional and translation regulation, via binding to other macromolecules (i.e., DNA, RNA, and proteins) [11,12,13,14,15]. As many lncRNAs are expressed in disease, it has been speculated that lncRNAs have functional roles in the pathogenesis of various diseases, with some of these roles being validated experimentally [16,17,18,19].
Type II diabetes (T2D) affects approximately 462 million individuals worldwide, corresponding to 6.28% of the world’s population [20]. The causes of T2D include obesity, physical inactivity and genetic factors [21,22,23], and if left untreated, T2D can result in further health complications, including cardiovascular disease [24], high blood pressure (hypertension) [25], vision loss (diabetic retinopathy) [26], and kidney disease [27]. T2D results in chronically high blood glucose levels due to the inability of the pancreas to produce enough insulin to adequately regulate glucose levels [28,29]. Insulin is a peptide hormone produced by beta cells located in the pancreatic islets, where its primary function is to reduce the concentration of glucose in the bloodstream in order to maintain normal metabolic processes [30]. Since T2D development is associated with dysfunction in beta cells and insulin resistance [31], many studies have focused on the insulin signal transduction pathway [32,33,34], some of which have identified dysregulated lncRNAs, indicating their potential regulatory role in insulin signal transduction [35,36,37,38]. Although lncRNAs have been implicated in the pathogenesis of T2D [35,39,40,41], less than two dozen lncRNAs have been, to our knowledge, functionally studied (Table 1).
One complication of T2D is gastroparesis, a chronic condition in which the movement of food from the stomach to the small intestine is slowed or disrupted, leading to symptoms such as nausea, vomiting, and abdominal pain [62]. Diabetic gastroparesis is a type of gastroparesis that can occur in both type I and II diabetes, and accounts for approximately one third of all gastroparesis cases [63]. Grover et al. investigated cellular changes occurring in both diabetic and idiopathic gastroparesis by comparing full-thickness gastric body biopsies from patients with one of these two conditions to control subjects. They identified dysregulation in the innate immune system as a key feature of both diabetic and idiopathic gastroparesis [64]. However, little is known about the dysregulation of lncRNAs in gastroparesis, and thus further research is needed to understand their potential roles in the pathology of this condition.
Here, we systematically re-examined RNA-seq data from three published studies relating to diabetes (GSE164416, GSE115601, and GSE175988) with the aim to identify and annotate T2D-related lncRNA genes. Since very few lncRNAs have been functionally studied, we performed loss-of-function experiments of the lncRNA USP30-AS1, which we identified as dysregulated in T2D, using an in vitro model of pro-inflammatory macrophage activation. Finally, to facilitate further research of T2D-related lncRNAs, we built a web application, T2DB (https://rebeccadistefano.shinyapps.io/T2DB/; accessed on 26 April 2023), to access expression profiles of protein-coding and lncRNA genes identified in the three studies above, as well as to provide annotations of the identified lncRNA genes, which we expect to be a valuable resource in future studies elucidating the roles of non-coding RNAs in diabetes.

2. Results

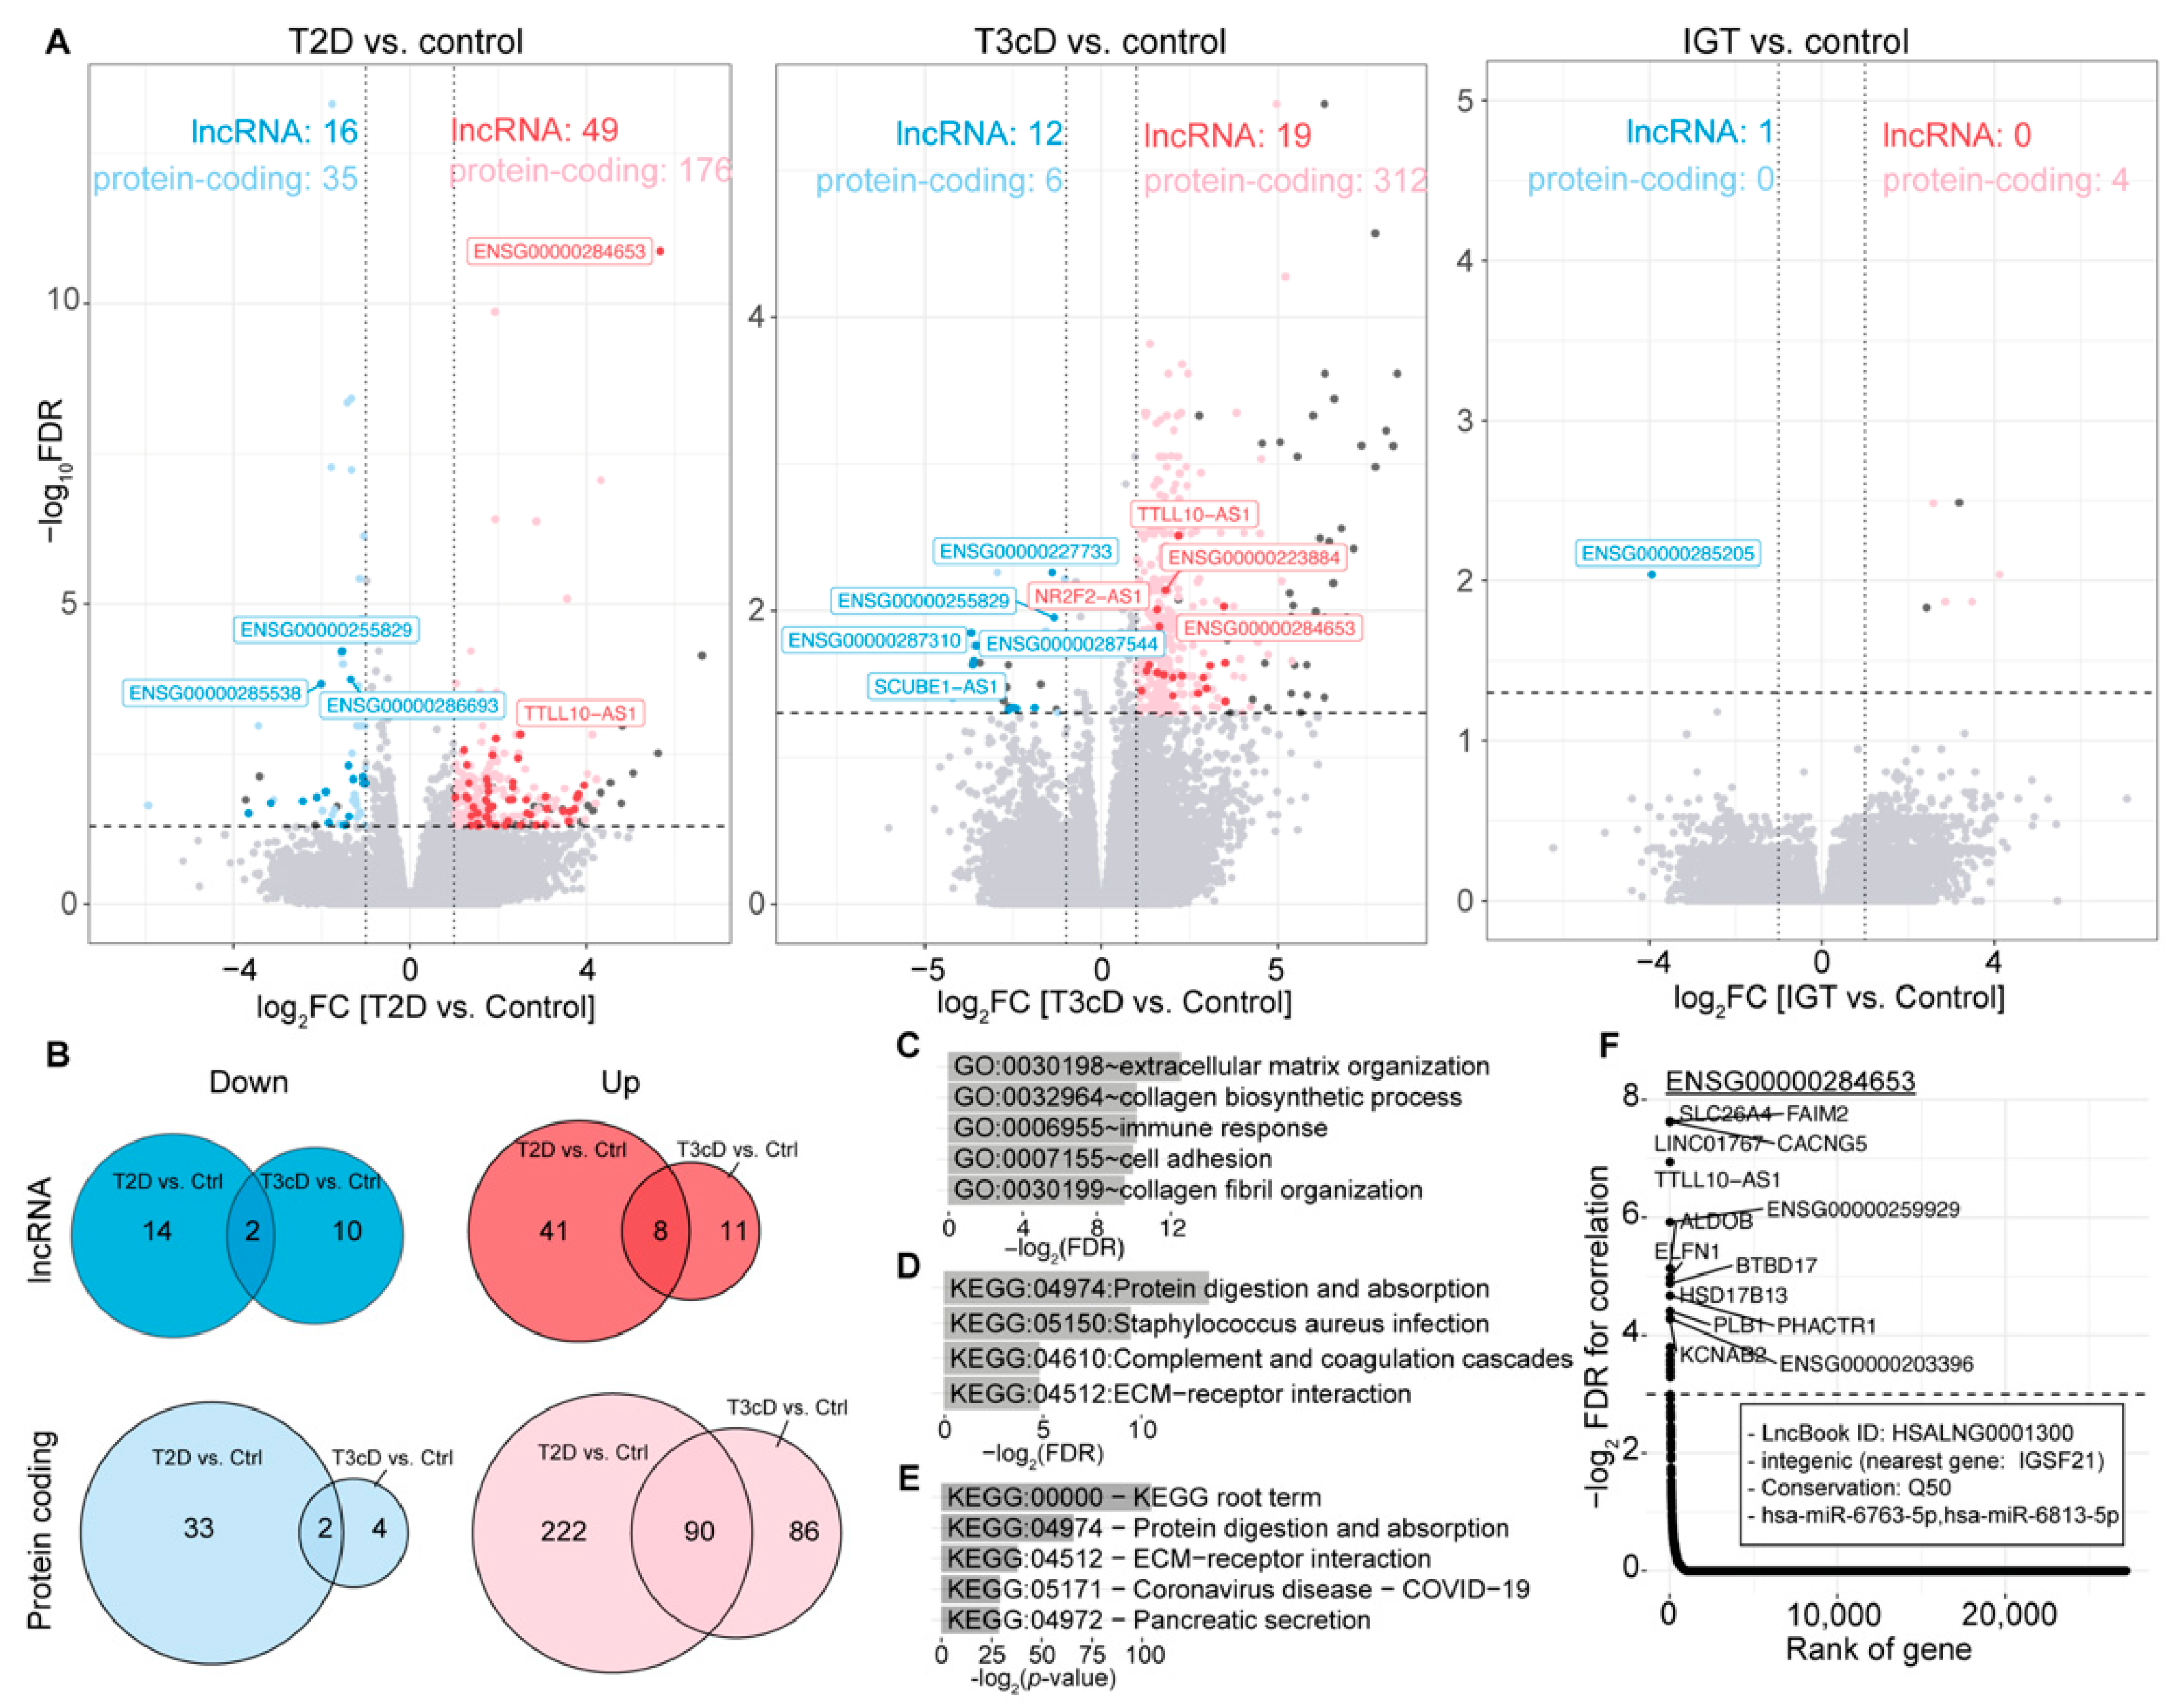
2.1. Many lncRNAs Are Differentially Expressed in T2D Patients

To better understand the expression changes of lncRNAs related to insulin regulation, we re-examined RNA-seq data obtained from surgically removed pancreatic tissue samples of 133 metabolically phenotyped pancreatectomized patients [65] [Gene Expression Omnibus (GEO) accession number, GSE164416]. These samples were collected from 41 patients with impaired glucose tolerance (IGT), 35 patients with type 3c diabetes (T3cD, also known as pancreatogenic diabetes [66]), 39 T2D patients, and 18 subjects without T2D (control).
The primary objective of the original study [65] was to perform a multi-omics analysis at both the RNA and protein levels to profile living donors undergoing pancreatectomy. This approach was contrasted with previous research on human pancreatic islets, which had primarily focused on samples from individuals with normal levels of blood glucose (normoglycemic) or diseased brain-dead donors. The main findings of this study included progressive but disharmonic remodeling of mature beta cells, as well as the identification of gene co-expression modules and lipids that are associated with hemoglobin A1c (HbA1c) levels. However, the study did not analyze lncRNAs.
We conducted a differential expression analysis between the control group and each of the T2D, T3cD, and IGT patient groups, correcting for patient age, sex and BMI in accordance with the original study. This analysis revealed hundreds of up-regulated genes in T2D and T3cD patients compared to the control subjects, and fewer down-regulated genes (Figure 1A, Supplementary Table S1). In contrast, IGT patients exhibited minimal changes in gene expression relative to the control subjects, with four up-regulated protein-coding genes (myosin heavy chain 11 (MYH11), marker of proliferation Ki-67 (MKI67), apelin receptor (APLNR), and peptidase inhibitor 16 (PI16)) and one down-regulated lncRNA (the novel transcript ENSG00000285205). This observation is consistent with the understanding that IGT patients have not yet developed T2D, as their blood glucose levels are not high enough to warrant a T2D diagnosis [67].
Focusing on the up-regulated gene set, we found that 90 protein-coding and 8 lncRNA genes were shared between the T2D and T3cD comparisons (Supplementary Table S2). In contrast, there are 41 lncRNA and 222 protein-coding genes exclusively up-regulated in T2D (Figure 1B). The up-regulated protein-coding genes in the T2D group showed enrichment in Gene Ontology (GO) terms related to extracellular matrix organization, collagen biosynthetic process, and immune response (Figure 1C). The Kyoto Encyclopedia of Genes and Genomes (KEGG) terms reflecting protein digestion and absorption were also enriched, as well as Staphylococcus aureus infection (Figure 1D). To explore lncRNA genes dysregulated in T2D, we focused on the genes most correlated in their expressions to the up-regulated set of lncRNA genes and conducted a KEGG enrichment analysis. This analysis also showed protein digest and absorption, suggesting that the top correlating genes may be functionally related to the lncRNA genes themselves (Figure 1E). Interestingly, the most significantly up-regulated lncRNA in T2D patients, ENSG00000284653, was also up-regulated in T3cD patients (Supplementary Table S2). According to information from the recently updated LncBook 2.0 [68] (https://ngdc.cncb.ac.cn/lncbook/gene?geneid=HSALNG0001300; accessed on 26 April 2023), this intergenic lncRNA gene is conserved with mouse (the 50th quantile) and contains binding sites to the miRNAs hsa-miR-6743-5p and hsa-miR-6813-5p (Figure 1F). The most correlating genes to this lncRNA gene include Fas apoptotic inhibitory molecule 2 (FAIM2) (Figure 1F), whose polymorphism (dbSNP ID, rs7138803; https://www.ncbi.nlm.nih.gov/snp/rs7138803, accessed on 26 April 2023) is associated with obesity and heart rate in T2D subjects [69]. Taken together, these results warrant further functional and mechanistic studies of lncRNA genes in pancreas.

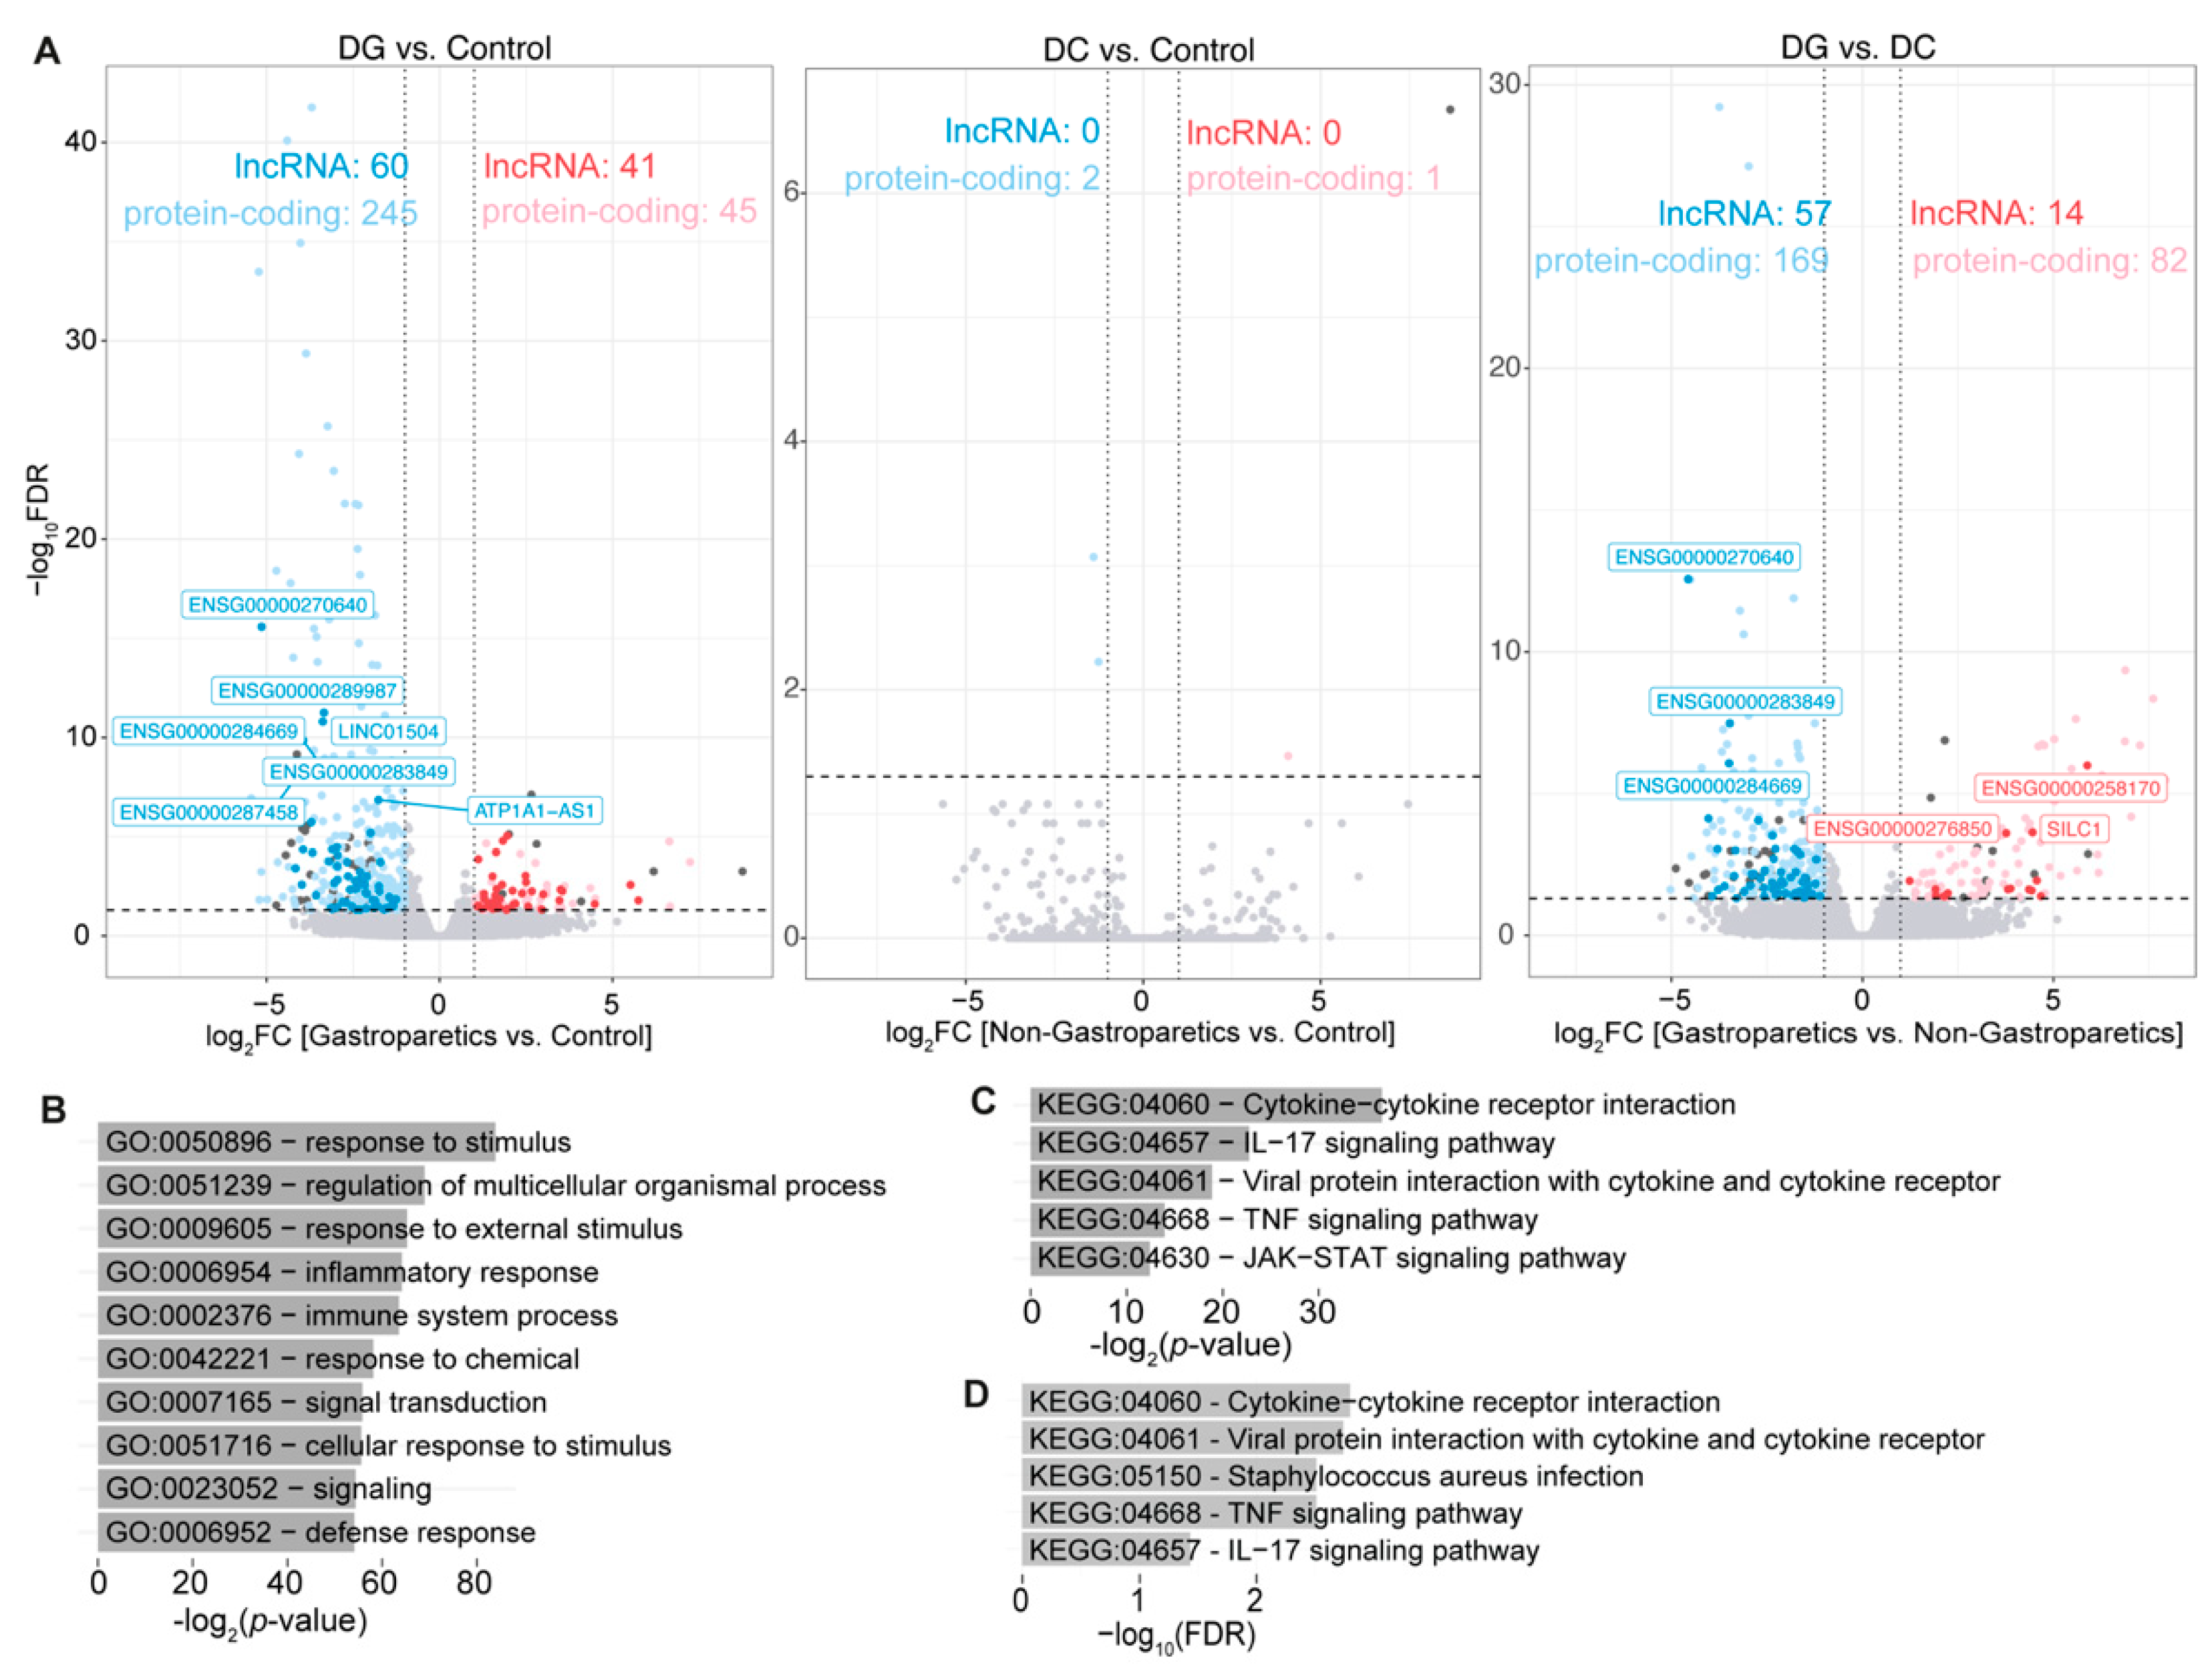
2.2. Diabetic Gastroparesis Results in Significant Down-Regulation in Gene Expressions

Next, we performed a similar analysis on a related dataset from Glover et al. [64] based on RNA-seq data using full thickness gastric body biopsies from seven diabetic gastroparetic (DG), seven diabetic non-gastroparetic control (DC), five idiopathic gastroparetic and seven non-diabetic non-gastroparetic control subjects (control) (GEO accession number, GSE115601). In total, 97 up- and 347 down-regulated genes in DG compared to the control subjects were identified (Figure 2A, Supplementary Table S3). On the other hand, only one up- (myosin heavy chain 2 (MYH2)) and two down-regulated protein-coding genes (Cbp/p300 interacting transactivator with Glu/Asp rich carboxy-terminal domain 2 (CITED2) and periplakin (PPL)) were identified in DC compared to the control subjects (Supplementary Table S3). Interestingly, MYH2 [70] and CITED2 [71,72,73] are known to be dysregulated in T2D, indicating that, unless the patients suffer from gastroparesis, the underlying diabetic condition does not show differences in gene expression patterns in gastric body biopsies. Among differentially expressed genes in DG compared to the control subjects, 41 up- and 60 down-regulated lncRNA genes were included (Supplementary Table S4), suggesting that the expression of lncRNA genes is altered in diabetic gastroparetic patients.
We next compared RNA-seq data between diabetic patients with or without gastroparesis, detecting in total 82 up- and 169 down-regulated genes, including 14 up- and 57 down-regulated lncRNA genes (Figure 2A, Supplementary Table S5), suggesting that gastroparesis results in more down-regulated genes in diabetic patients. Focusing on the down-regulated gene set only, we conducted a GO analysis, which revealed enriched terms related to immune and inflammatory responses as well as gene regulation (Figure 2B). Moreover, a KEGG pathway analysis indicated the enrichment of TNF, IL-17, JAK-STAT, and FoxO signaling pathways (Figure 2C). We repeated a similar KEGG pathway analysis, but involving genes most significantly correlated in their expression to the down-regulated lncRNA gene set (Figure 2D), revealing similar terms to when we directly analyzed the protein-coding genes. These results suggest that differentially expressed lncRNA genes might be involved in immune responses through the same signaling pathways as the genes they regulate. However, further functional studies are necessary to understand the biological roles of these differentially expressed lncRNA genes.

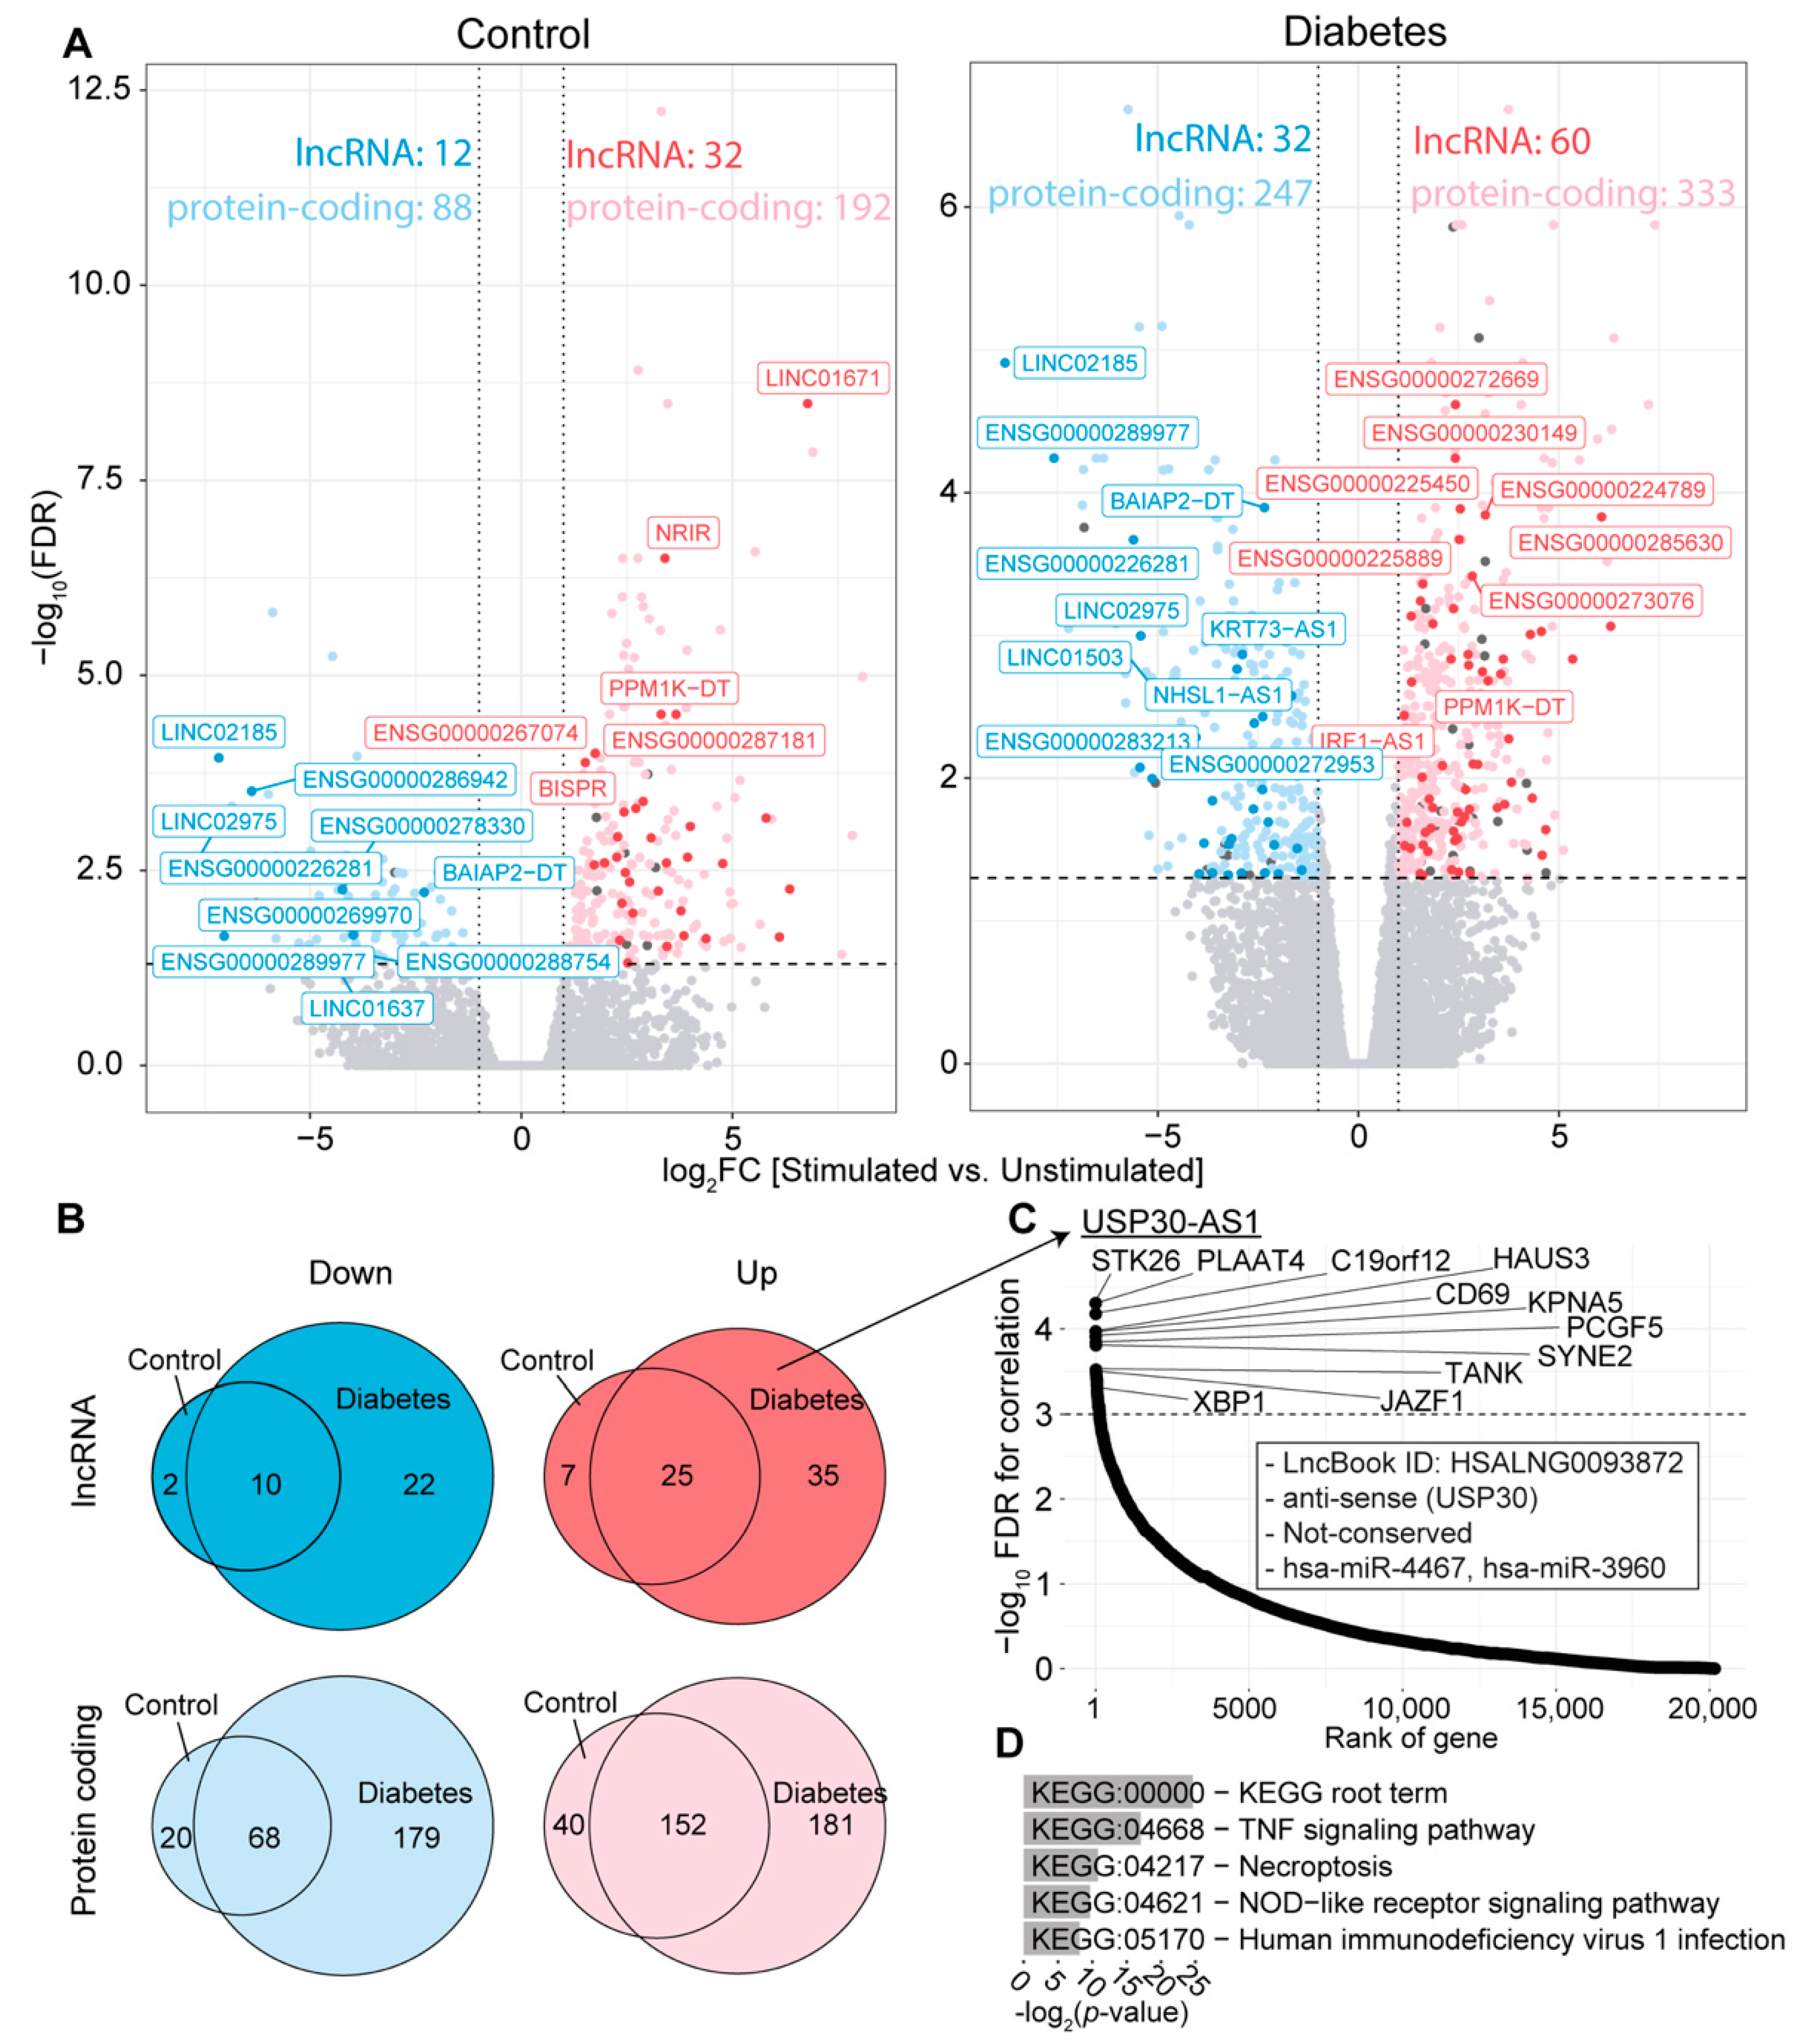
2.3. Many lncRNAs Are Differentially Expressed in Cultured Macrophages from T2D Patients

As demonstrated in the above studies [64,65] and in our re-examination of these datasets, it is clear that inflammatory cells significantly contribute to the pathogenesis and progression of T2D and its associated complications. To investigate this point further, Edgar et al. isolated human peripheral blood mononuclear cells (PBMC) from both T2D patients and control subjects without diabetes, who were matched for age and body mass index [74]. These cells were treated with the Toll-like receptor ligand lipopolysaccharide (LPS) and interferon-γ (IFN-γ) to induce inflammatory macrophages. Then, RNA-seq was performed to compare their gene expression profiles to the cells under the basal condition (10 unstimulated and 10 stimulated cells). The authors identified an enrichment in inflammatory response, IL-6 JAK STAT3 signaling, IL-α/IL-β signaling, Toll-like receptor 1/2 cascade, reactive oxygen species, and reactive nitrogen species production in stimulated diabetic cells. Here, we re-examined this dataset (GEO accession number, GSE175988) specifically focusing on lncRNA genes.
When comparing stimulated and unstimulated cells, a greater number of differentially expressed genes in PBMC isolated from T2D patients compared to control subjects were identified (Figure 3A), in accordance with the original publication [74]. Although some differentially expressed genes were shared between T2D and control samples (Figure 3B), 181 up- and 179 down-regulated genes were differentially regulated specifically in T2D compared to the control samples, including 35 up- and 22 down-regulated lncRNA genes (Supplementary Table S6). Among these up-regulated lncRNA genes, only the following nine have been previously studied: (1) ENSG00000232855 (novel transcript) [75]; (2) ENSG00000272512 (novel transcript) [76]; (3) KCNJ2 antisense RNA 1 (KCNJ2-AS1) [77,78,79]; (4) KLHDC7B divergent transcript (KLHDC7B-DT) [80,81,82]; (5) long intergenic non-protein-coding RNA 2015 (LINC02015) [83,84]; (6) long intergenic non-protein-coding RNA 2381 (LINC02381) [85,86,87,88,89,90,91,92,93]; (7) long intergenic non-protein-coding RNA 2541 (LINC02541) [94]; (8) serpin family B member 9 pseudogene 1 (SERPINB9P1) [95,96,97]; and (9) USP30 antisense RNA 1 (USP30-AS1) [98,99,100]. However, only the functions of the lncRNA genes LINC02381 and USP30_AS1 are known, with the former known to bind transcription factors [85], RNA-binding proteins [86], and miRNAs [87,88,89,90,91,92,93]; while USP30-AS1 acts as a miRNA sponge [98,99] and is involved in the cis-regulation of the nearby protein-coding genes USP30 and ANKRD13A [100]. Neither LINC02381 nor USP30-AS1 are known to be involved in T2D, which calls for further investigation.
USP30-AS1 is a lncRNA gene with one transcript, ENST00000478808.4, with two exons, located on Chromosome 12: 109,052,344-109,053,986 (reverse strand). To understand more about this lncRNA gene, we performed additional in-silico analysis, finding it to be most expressed in Epstein–Barr virus (EBV)-transformed lymphocytes (Supplementary Figure S1), in support of its presence in PBMC. Upon correlating the CPM expression of USP30-AS1 with other genes, phospholipase A and acyltransferase 4 (PLAAT4) and serine/threonine kinase 26 (STK26) emerged as the most significant (Figure 3C). Moreover, the protein-coding genes JAZF zinc finger 1 (JAZF1) and X-box binding protein 1 (XBP1) were identified among the top correlated (FDR < 0.00001) and have been associated with the development and progression of T2D [101,102]. Lastly, the set of protein-coding genes demonstrating significant correlation with this specific lncRNA gene were enriched in the tumor necrosis factor (TNF) signaling pathway and necroptosis (Figure 3D).

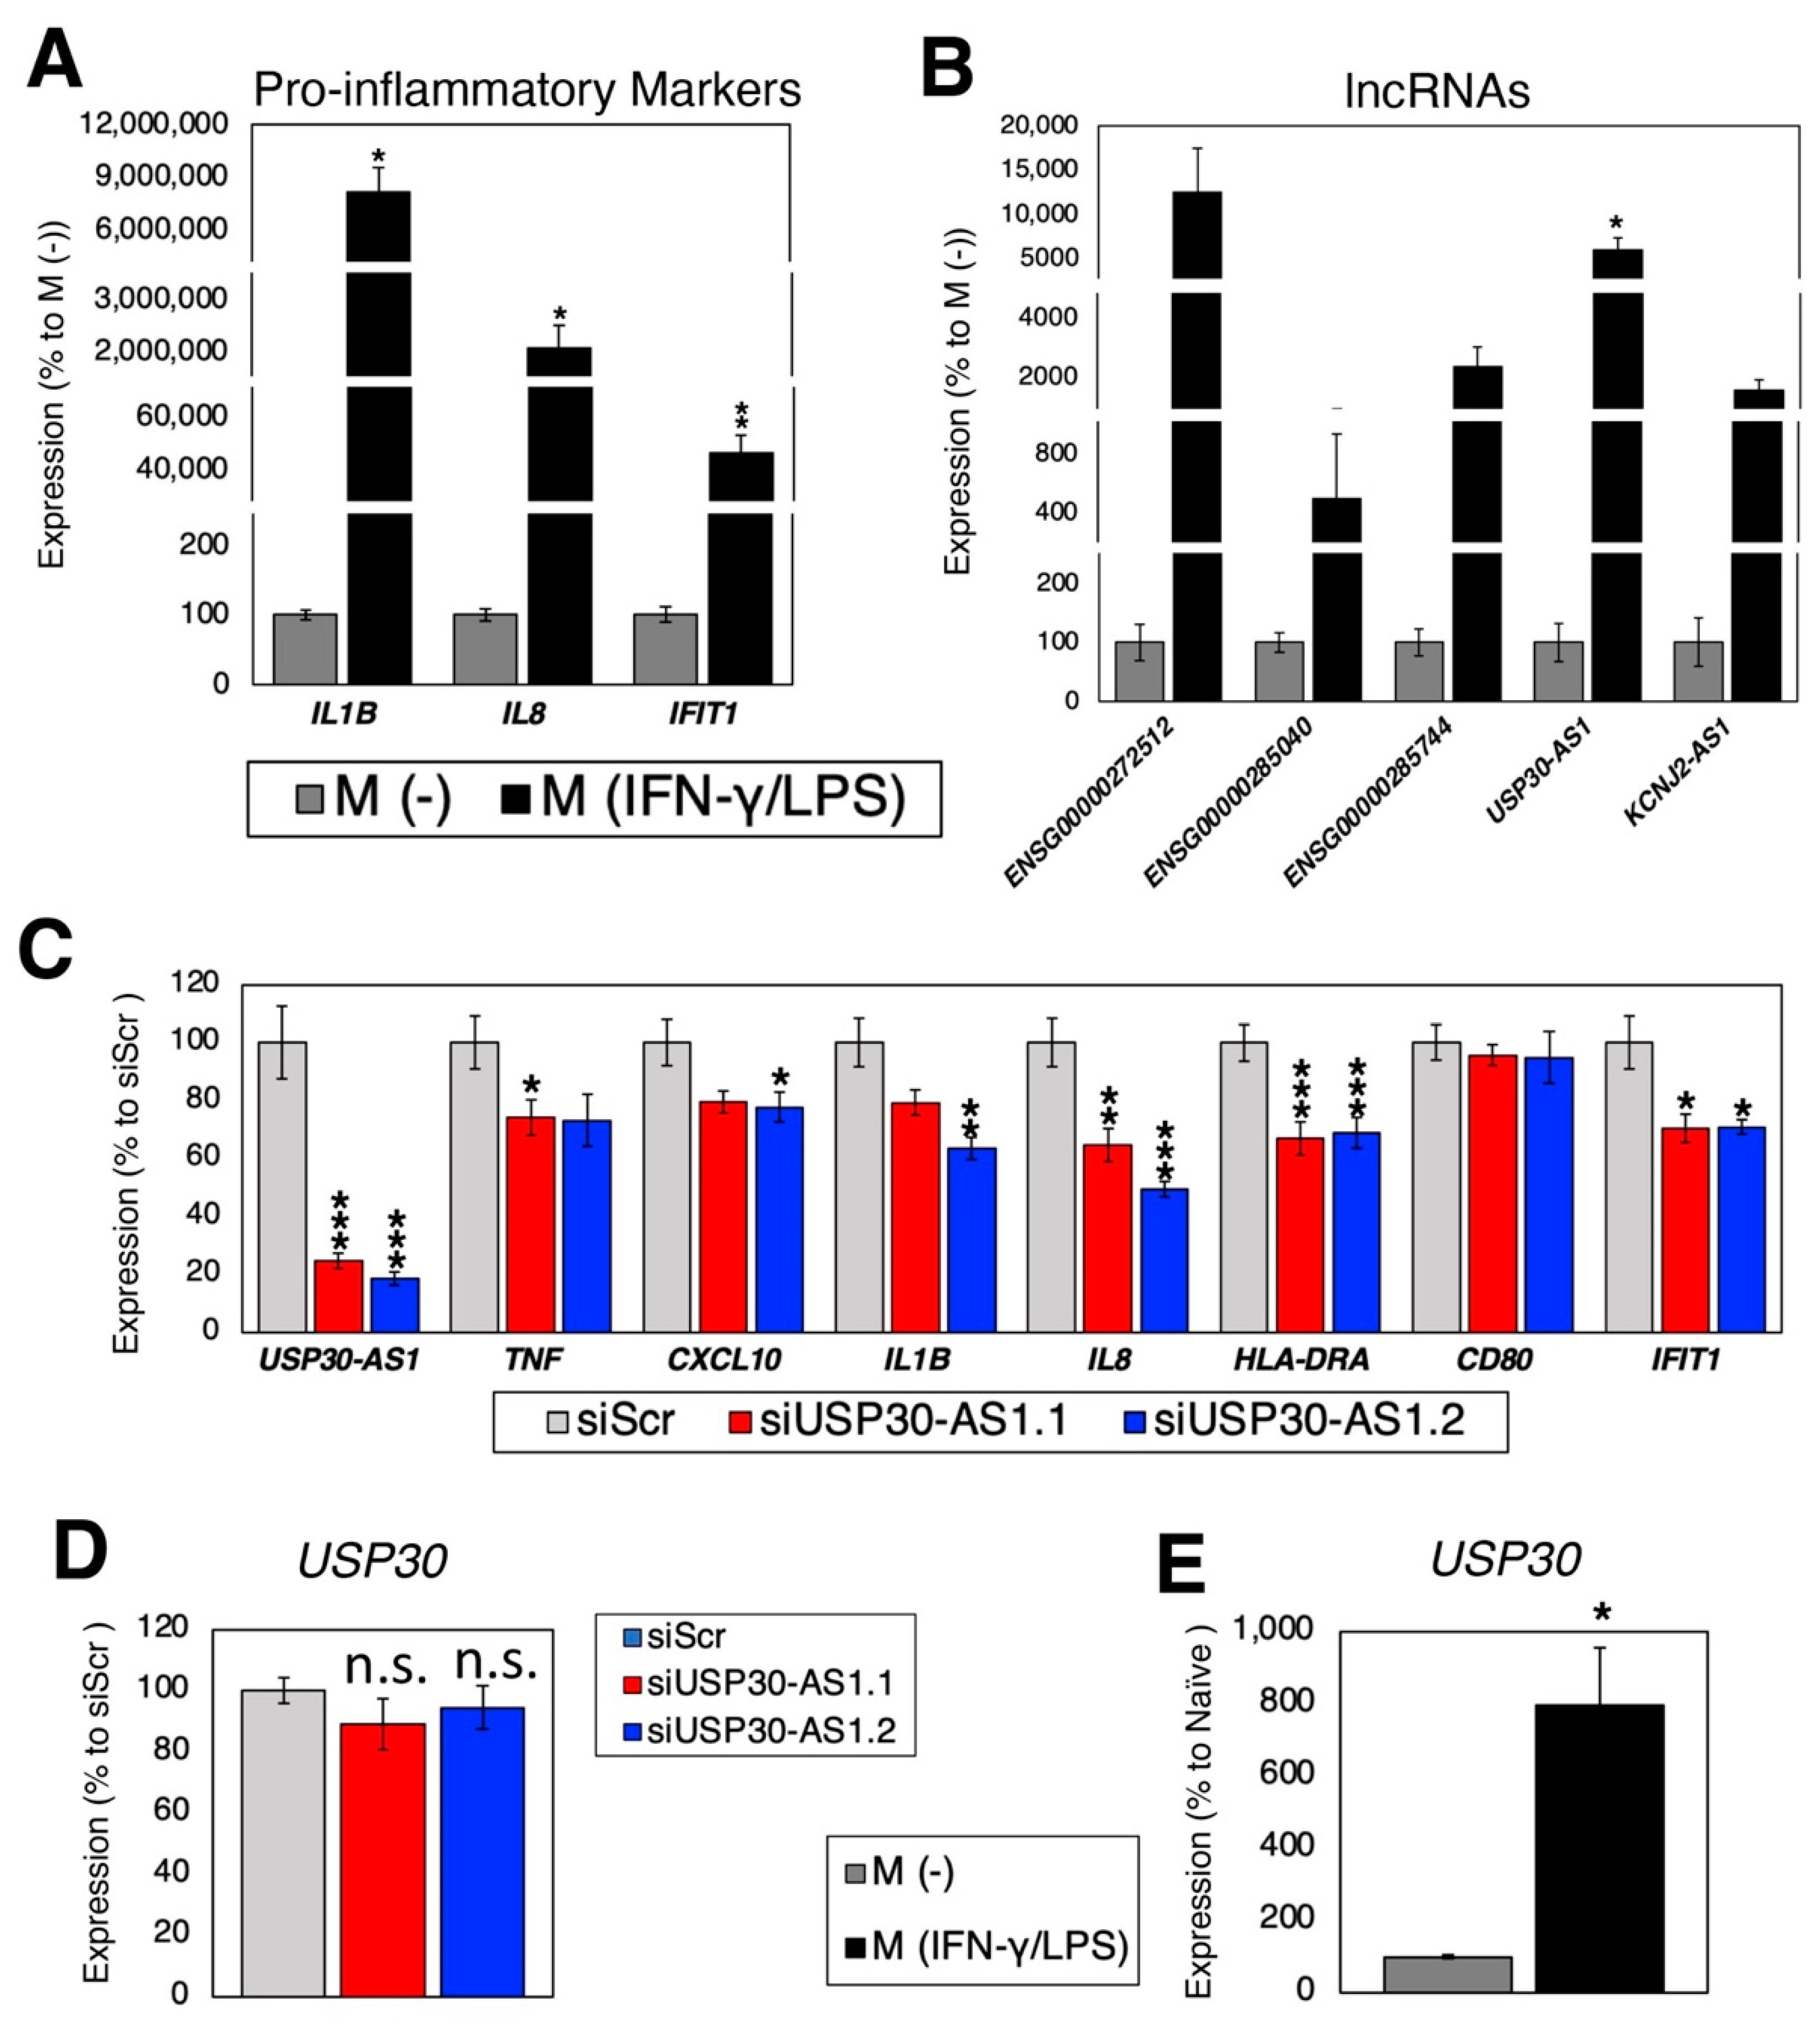
2.4. Loss-of-Function Experiments in Polarized Macrophages

As discussed in the previous section, none of the identified lncRNAs in PBMC from T2D patients have been functionally investigated in the context of T2D. To bridge this knowledge gap, we first evaluated the expression changes of selected T2D-related lncRNAs in an in vitro model of pro-inflammatory macrophage activation, by stimulating the human leukemia monocytic cell line, THP-1, to macrophage-like cells (M (-)) and then to pro-inflammatory macrophage-like cells (M (IFN-γ/LPS)), as described in the Materials and Methods Section (Figure 4A). Upon assessing the expression levels of the selected five T2D-related lncRNAs (ENSG00000272512, ENSG00000285040, ENSG00000289327, USP30-AS1, and KCNJ2-AS1) (Figure 4B), all of them were found to be highly up-regulated in pro-inflammatory cells compared to M (-) cells, although only USP30-AS1 exhibited statistically significant differences.
To understand its functional importance in macrophages, USP30-AS1 was silenced using siRNA (Figure 4C). Compared to the siRNA against scrambled sequence (siScr; control siRNA), silencing of USP30-AS1 resulted in down-regulation of pro-inflammatory marker genes, suggesting that USP30-AS1 is functionally important for the activation of pro-inflammatory macrophage-like cells.
As the name of the lncRNA gene suggests, USP30-AS1 overlaps with the nearby protein-coding gene, ubiquitin specific peptidase 30 (USP30), in an antisense direction. USP30 encodes for a deubiquitinating enzyme that is localized in the mitochondrial outer membrane and peroxisomes [103]. The functions of USP30 include PINK1/Parkin-mediated mitophagy, pexophagy, and BAX/BAK-dependent apoptosis, although nothing is known about its role in macrophages. Given that cis-regulation of the expression of a nearby protein-coding gene by a lncRNA is a common mechanism [104] and a previous study [100] reports that USP30-AS1 binds ASH2-like, histone lysine methyltransferase complex subunit (ASH2L) to regulate the promoter activity of USP30, we examined the expression change of USP30 upon silencing of USP30-AS1. Unlike the previous study [100], no significant change in the expression of USP30 was observed upon silencing of USP30-AS1 (Figure 4D), although its expression was up-regulated 796-fold upon activation of pro-inflammatory macrophage-like cells (Figure 4E). Taken together, the phenotypes observed here upon silencing of USP30-AS1 are independent of its cis-regulation of USP30. Thus, further mechanistic studies are required to elucidate the mechanism of action of UPS30-AS1 to the activation of macrophages.

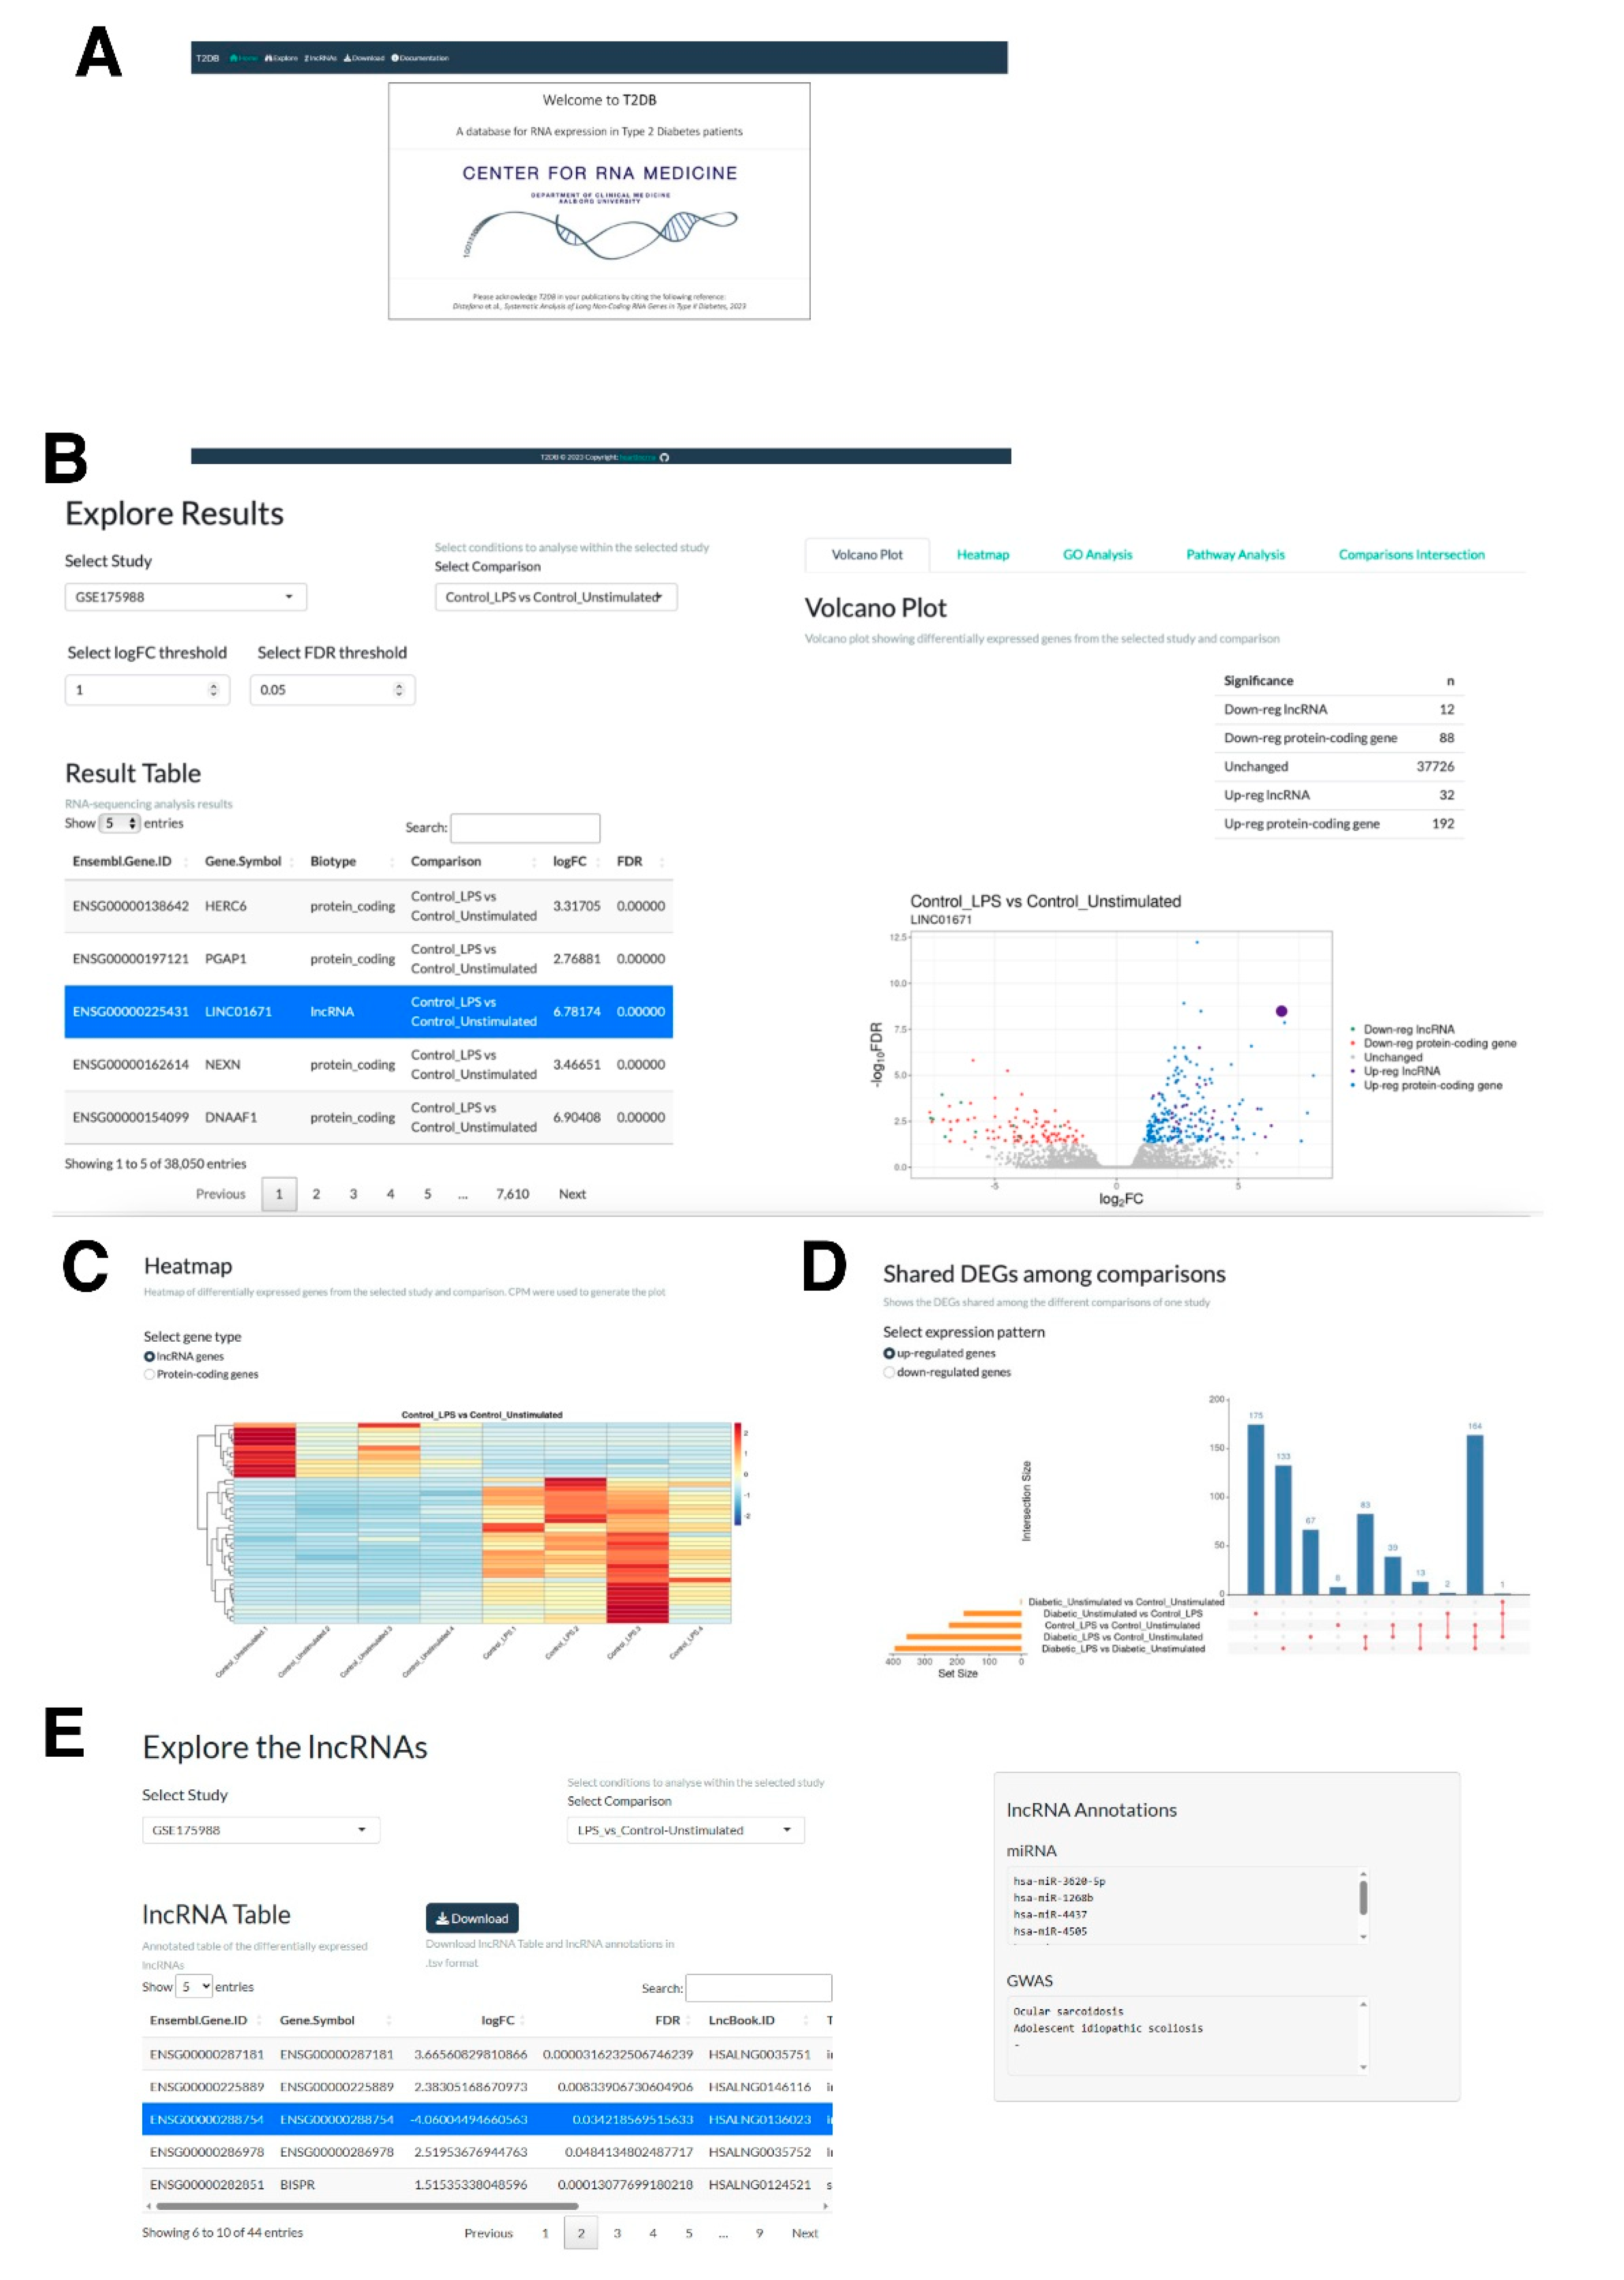
2.5. The Web Application, T2DB, for Expression Analysis of Protein-Coding and lncRNA Genes

To facilitate further research on lncRNAs dysregulated in T2D, we built a web application called T2DB (https://rebeccadistefano.shinyapps.io/T2DB/; accessed on 26 April 2023) (Figure 5A). T2DB has four primary pages: (1) Explore; (2) LncRNA; (3) Download; and (4) Documentation. The Explore page shows an interactive Result Table (Figure 5B) displaying the results of the differential expression analysis for the study and comparison selected by the user. The right-hand side of the Explore page is divided into the following five tabs: (1) Volcano Plot; (2) Heatmap; (3) GO Analysis; (4) Pathway Analysis; and (5) Comparisons Intersection, which are related to the results shown in the Results Table. The table and the plot are linked so that selecting a row in the table will be reflected on the plot, in which the selected gene will be highlighted. A summary table displaying the number of up- and down-regulated genes (both protein-coding and lncRNA genes) is also displayed on this tab, which reactively changes as the user alters the threshold values of fold change in logarithm of base two scale (logFC) and FDR. These thresholds also affect the results displayed on the Volcano plot, Heatmap, GO Analysis, Pathway Analysis, and Comparisons Intersection tabs. The heatmap tab displays a heatmap, allowing the user to visualize the expression of the selected genes (Figure 5C). Gene Ontology enrichment analysis can be performed with FDR threshold values selected for multiple testing correction method and using the selected list of up- or down-regulated genes. The results are then visualized as a Manhattan plot and as a table. Only the results related to the Gene Ontology categories (Molecular Functions, Biological Process, and Cellular Components) are included. The Pathway Analysis tab displays the results of the KEGG pathway over-representation analysis performed using the selected list of up- or down-regulated genes. The results are visualized as a dot plot. Finally, the up- and down-regulated genes are compared across the different comparisons of one study and visualized in the Comparisons Intersection tab (Figure 5D).
The “lncRNAs” page allows the users to further examine the identified differentially expressed lncRNA genes (|log2FC| > 1 and FDR < 0.05) in each study and comparison through the lncRNA Table. This includes information about the conservation state of the lncRNA, along with its nearest protein-coding gene, and its most correlated gene in its expression using Pearson correlation. Finally, by selecting a row, the users can obtain further information about the miRNA associated with the selected lncRNA gene, along with the related Genome-wide association studies (GWAS) terms, based on the database LncBook 2.0 [68]. These are displayed on the right-hand side of the page. All the available data can be downloaded from the Download page so that further processing of the analyzed data is possible. Finally, the Documentation page provides information on the datasets used in the study and instructions on how to use the web application.

3. Discussion

In this study, we have re-examined RNA-seq data from three studies involving diabetes patients [64,65,74]. Our primary aim was to identify and analyze lncRNA genes dysregulated in T2D compared to control patients, a task not carried out in the original studies. We also built a highly informative wed database, T2DB, which provides a one-stop-shop for expression profiling of both protein-coding and lncRNA genes in T2D patients compared to control patients, as well as annotations for the identified dysregulated lncRNA genes. With respect to our re-analysis of protein-coding genes, we note that, while the original studies conducted differential analysis on these datasets, there are three good reasons for also including them in our study. First, lncRNA genes should not be analyzed in isolation to protein-coding genes, given their highly intertwined regulatory roles. Second, the choice of bioinformatic tools, such as mapping and differential expression programs, can make a large difference to results. Thus, for consistency purposes, it is important to apply the same tools for both lncRNA and protein-coding genes simultaneously in analyses. Third, the original authors did not gather their data into an easily accessible and interactive database, as we have done. As an extra comment, it is important to re-examine these kinds of data to provide confidence in the results from the original studies.
In our study, we have found that many genes, including lncRNA genes, are dysregulated in T2D patients compared to the healthy donors or subjects without T2D, and that the gene expression changes in T2D patients are augmented when the T2D progresses to other health complications (e.g., gastroparesis). Importantly, our results based on protein-coding gene analysis generally concur with those obtained in the original studies, although we have noted that many of our identified differentially expressed lncRNA genes have to date not been studied functionally or mechanistically. Interestingly, however, two of the lncRNA genes identified as dysregulated in diabetic gastroparetic were validated by the studies listed in Table 1; specifically, NEAT1 was found to be down-regulated in DG patients compared to the control subjects, and DNM3OS was found to be up-regulated in DG patients compared to DC patients. Thus, our study provides a currently unappreciated connection between lncRNA dysregulation and the T2D complication known as diabetic gastroparesis.
Furthermore, our analyses based on correlating the expression of lncRNA genes to protein-coding genes resulted in the enrichment of pathways that are highly similar to those pathways identified based on the dysregulated protein-coding gene. Thus, it is likely that there is a close network-like dependency between lncRNA and protein-coding genes, which has become dysregulated in T2D, and these connections can be observed in the subsequent expression patterns. This is further supported by the fact that many of the closely correlating protein-coding genes have themselves been previously implicated in diabetes, such as FAIM2, JAZF1, and XBP1, as well as others whose connections likely remain uncharacterized.
One lncRNA gene, USP30-AS1, which we have found to be up-regulated in the stimulated cells of PBMC of T2D patients, has been analyzed previously, although not in the context of T2D. In this study, we have found that USP30-AS1 influences the activation of macrophage-like cells. Interestingly, USP30-AS1 has been implicated to be a potential prognostic risk factor for cancer and to play a role in cell death (e.g., apoptosis, autophagy, ferroptosis, and necroptosis) [105,106,107,108,109,110,111,112,113,114,115,116,117,118,119,120,121,122,123,124]. Furthermore, USP30-AS1 promotes cell viability and inhibits apoptosis in acute myeloid leukemia cell lines, including THP-1 [100]. Yet, its functional role in macrophages is unknown. Here, we provide, for the first time, the potential function of USP30-AS1 influencing the activation of pro-inflammatory macrophages. Finally, to disseminate the findings of this study to the broader audience, we built a web database, T2DB. We expect this database to be of broad interest to researchers looking into the molecular basis of T2D, and particularly in the context of non-coding RNAs. To facilitate this, we have offered flexibility to the user in terms of the parameters for selecting and analyzing differentially expressed genes. In addition, the annotations we have provided on the lncRNA genes identified in this study will be useful in helping researchers to prioritize candidates for potential functional studies.
With respect to limitations, we note that the RNA-seq data analyzed in this study come from different laboratories and are based on different protocols. In addition, all RNA-seq data are based on poly-A sequencing, so RNAs without poly A tails are not included in this analysis. Although we mitigated potential issues related to variations in RNA-seq data generation by analyzing each study separately and by comparing only the differentially expressed genes using a similar analysis pipeline, it is evident that we underestimated the number of T2D-related lncRNA genes, since more than half of lncRNA genes do not have poly A tails [125]. Furthermore, the functional data provided are of in vitro assay, which do not reflect the in vivo situation. The difficulty in performing experiments in immune cells (e.g., macrophages) is that even freshly isolated immune cells from an individual must be cultured to perform experiments. One way to perform in vivo experiments is to use model organisms (e.g., mice, zebrafish). However, most lncRNA genes are species-specific [126] and therefore it is not feasible to perform in vivo experiments for most human lncRNA genes as in our case here.

4. Materials and Methods

4.1. RNA-Seq Data Analysis and Visualization

As previously carried out [127,128], the raw RNA-seq data were downloaded from the Sequence Read Archive (SRA) database using SRA Toolkit [69]. After conversion of the .sra files to FASTQ files, the data were preprocessed with fastp [129] (version 0.21.0) using default settings to perform quality control, trimming of adapters, filtering by quality, and read pruning. To map the trimmed sequencing reads to the reference genome (GRCh38.107), STAR [130] (version 2.5.0a) was used. Using the R package, edgeR [131] (version 3.30.3), CPM values and differentially expressed genes were calculated and derived, respectively. With respect to GSE164416, we included co-variates for BMI, sex and age in accordence with the original study. FDR-adjusted p-values calculated by the Benjamini–Hochberg method were used for further analysis. For all comparisons, the threshold values of |log2FC| > 1 and FDR < 0.05 were used as criteria for calling differentially expressed genes.
To draw volcano plots, the R-package ggplot2 [132] was used. To derive overlapping genes, http://bioinformatics.psb.ugent.be/webtools/Venn/ (accessed on 7 October 2022) was used. To identify enriched GO terms and KEGG pathways, Database for Annotation, Visualization, and Integrated Discovery (DAVID) (version v2022q3) [133,134] was used for GOTERM_BP_DIRECT and KEGG_PATHWAY categories, respectively, based on p-values computed by DAVID by applying Fisher’s Exact test. The top enriched GO terms and KEGG pathways were selected based on -logarithm of base 2 of p-values. Correlation analysis between lncRNA and other genes was based on Pearson’s correlation test and CPM values. Top correlating protein-coding genes to either a single lncRNA gene or a set of genes were selected based on FDR < 0.00001. LncRNA genes identified as dysregulated were annotated using LncBook 2.0 as follows. First, lncRNA coordinates from the gene transfer format (GTF) file based on GRCh38.107 were overlapped with coordinates from LncBook 2.0 (LncBookv2.0_GENCODEv34_GRCh38.gtf) to obtain the relevant LncBook ID. These ids were compared with LncBook 2.0 annotations on conservation (conservation_LncBook2.0.csv), miRNA-binding sites (lncrna_mirna_miRandaAndTargetScanAndRNAhybrid_LncBook2.0.csv), and GWAS traits (variation_LncBook2.0.csv). We also included annotations on the nearest gene using the R package GenomicRanges [135] and the top correlation gene according to Pearson’s correlation test.

4.2. Cell Culture and Treatments

The human leukemia monocytic cell line, THP-1 (LGC Standards GmbH (Wesel, Germany), #ATCC-TIB-202; Lot #70043382), was cultured in the growth medium containing RPMI 1640 Medium (Thermo Fisher Scientific (Roskilde, Denmark), #21875091) supplemented with 10% fetal bovine serum (Sigma-Aldrich (Søborg, Denmark), #F4135), 1% L-Glutamine solution (Sigma-Aldrich, #G7513), and 1% Penicillin-Streptomycin (Sigma-Aldrich, #P4333) at 37 °C with 5% CO2. To differentiate THP-1 cells into macrophage-like cells (M (-)), the cells were incubated in the growth medium containing 100 nM of phorbol 12-myristate 13-acetate (PMA; Sigma-Aldrich, #P8139-1MG) for 3 days. To induce pro-inflammatory macrophage activation, M (-) were incubated with the growth medium supplemented with 20 ng/mL of recombinant human interferon-γ (IFN-γ; Cell Signaling, #80385) and 250 ng/mL of eBioscience Lipopolysaccharide (LPS) Solution (500X; 2.5 mg/mL) (Thermo Fisher Scientific, #00-4976-93) for 48 h to derive activated macrophage-like cells (M (IFN-γ/LPS)).
To silence the USP30-AS1, the MISSION siRNAs (Sigma-Aldrich) were used: siUSP30-AS1.1 sense, CUUAGGCUCCAUUCAUAAAdTdT, antisense, UUUAUGAAUGGAGCCUAAGdTdT; and siUSP30-AS1.2 sense, GCUUAGGCUCCAUUCAUAAdTdT, antisense, UUAUGAAUGGAGCCUAAGCdTdT. Mission Negative control SIC-002, confidential sequence (Sigma-Aldrich), was used as control. Thirty minutes after inducing the activation of pro-inflammatory macrophage-like cells, transient siRNA transfection (10 nM final concentration) was carried out using RNAiMax (Thermo Fisher Scientific (Roskilde, Denmark) according to the manufacturer’s protocol. The samples were collected 48 h after the transfection of siRNAs for the isolation of total RNA.

4.3. Isolation of Total RNA and RT-PCR

To isolate and purify the total RNA, the TRIzol Reagent (Thermo Fisher Scientific, Roskilde, Denmark, #15596018) was used following the manufacturer’s protocol [128]. To synthesize the first-strand complementary DNA (cDNA) from 1 μg of total RNA for each sample, SuperScript IV VILO Master Mix with the ezDNase Enzyme (Thermo Fisher Scientific, #11766500) was used to digest the genomic DNA and reverse transcribe the total RNA. Then, the first-strand cDNA was diluted with DNase/RNase-free water to the concentration of 1 ng/μL. A quantitative reverse transcription polymerase chain reaction (qRT-PCR) reaction was performed using 1 ng of cDNA template per reaction with PowerUp SYBR Green Master Mix (Thermo Fisher Scientific, #A25777) via the QuantStudio 6 Flex Real-Time PCR System (Thermo Fisher Scientific). The annealing temperature was set to 60 °C. To normalize the data, relative fold expression was calculated by 2-DDCt using ribosomal protein lateral stalk subunit P0 (PRLP0) as an internal control. The primer pairs for markers of activated macrophages were previously published by others [136]. The primer pairs for lncRNAs were designed using Primer3 (http://bioinfo.ut.ee/primer3-0.4.0/; accessed on 6 September 2022) [78] and in silico validated with the UCSC In-Silico PCR tool (https://genome.ucsc.edu/cgi-bin/hgPcr; accessed on 6 September 2022) before extensive testing by the conventional RT-PCR reaction followed by running the PCR product on an agarose gel to examine for a single band of the expected size for each primer pair. The primer sequences are provided in Supplementary Table S7.

4.4. T2DB Web Application

The T2DB web application is based on the R package Shiny [137]. The app has four primary pages: (1) Explore; (2) LncRNA; (3) Download; and (4) Documentation. The Explore page displays an interactive Result Table, which is created with the R package DT (https://github.com/rstudio/DT; accessed on 21 March 2023). The right-hand side of the Explore page is divided into the following five tabs: (1) Volcano Plot created with the R package ggplot2 [132]; (2) Heatmap using the function pheatmap from the R package, ComplexHeatmaps [138]; (3) GO Analysis using the R package, gprofiler2 [139], and displayed as a Manhattan plot using the gostplot function from gprofiler2 and as a table rendered using the R package DT; (4) Pathway Analysis using the enrichKEGG function from the R package, clusterProfiler [140,141], and visualized as a dot plot created with the R package, enrichplot [142]; and (5) Comparisons Intersection using the upset function of the R package, UpSetR [143].
The lncRNAs page displays an interactive lncRNA Table rendered using the R package DT showing the differentially expressed lncRNA genes (|log2FC| > 1 and FDR < 0.05) for the selected study and comparison. This can be downloaded in the format of tab-separated values (.tsv), along with the information displayed on the right-hand side of the page.
The Download page displays an interactive table showing the data for the selected study and rendered using the R package DT. The selected study can then be downloaded in either the format of comma-separated values (.csv) or .tsv. The Documentation page provides information on the datasets used in the study and instructions on how to use the web application.
All code used to generate T2DB is available in the GitHub repository: https://github.com/Reb08/T2DB (accessed on 26 April 2023). T2DB is freely available without password from https://rebeccadistefano.shinyapps.io/T2DB/ (accessed on 26 April 2023).

4.5. Statistics

Data are presented as the mean ± S.E.M. Two-sample, two-tail, heteroscedastic Student’s t-test was performed to calculate a p-value via Microsoft Excel.

Supplementary Materials

The following supporting information can be downloaded at: https://www.mdpi.com/article/10.3390/ncrna9030030/s1, Supplementary Figure S1: Violin plots showing bulk tissue expression for the lncRNA gene USP30-AS1. The plot generated from the GTeX Portal (https://www.gtexportal.org/home/gene/USP30-AS1, accessed on 1 May 2023), Data Source: GTEx Analysis Release V8 (dbGaP Accession phs000424.v8.p2).; Supplementary Table S1: List of differentially expressed genes in T2D, T3cD and IGT compared to control subjects; Supplementary Table S2: List of differentially expressed genes shared between T2D and T3cD patients compared to the control subjects.; Supplementary Table S3: List of differentially expressed genes in diabetic gastroparetics (DG) compared and non-diabetic gastroparetic (DC) compared to control subjects; Supplementary Table S4: List of differentially expressed lncRNAs genes in diabetic gastroparetics (DG) compared to non-diabetic non-gastroparetic controls (Control).; Supplementary Table S5: List of differentially expressed lncRNAs genes in diabetic gastroparetics (DG) compared to diabetic non-gastroparetic controls (DC); Supplementary Table S6: List of differentially expressed genes in Stimulated vs Unstimulated T2D samples but not in Control samples.; Supplementary Table S7: List of primers used in this study.

Author Contributions

Conceptualization, S.U.; methodology, S.U., M.I., R.D. and S.R.; database, R.D. and S.R.; validation, M.I. and J.H.M., resources, H.I., M.A. and S.U.; writing—original draft preparation, S.U.; writing—revised version, S.R., R.D. and S.U. All authors have read and agreed to the published version of the manuscript.

Funding

This work was supported by grants from the Department of Clinical Medicine, Aalborg University (to S.U. for cells and reagents) and research grants from the National Institutes of Health (R01HL126901 and R01HL149302 to M.A.).

Institutional Review Board Statement

The study was conducted according to the guidelines of the Declaration of Helsinki and approved by the Institutional Review Board of Aalborg University (230 337 on 17 March 2017).

Informed Consent Statement

Not applicable as established human cell line was used.

Data Availability Statement

The supplementary materials can be found on the GitHub repository: https://github.com/heartlncrna/Analysis_of_T2D_Studies (accessed on 1 May 2023). All codes used to generate T2DB are available on the GitHub repository: https://github.com/Reb08/T2DB (accessed on 26 April 2023).

Conflicts of Interest

The authors declare no conflict of interest.

References

  1. Derrien, T.; Johnson, R.; Bussotti, G.; Tanzer, A.; Djebali, S.; Tilgner, H.; Guernec, G.; Martin, D.; Merkel, A.; Knowles, D.G.; et al. The GENCODE v7 catalog of human long noncoding RNAs: Analysis of their gene structure, evolution, and expression. Genome Res. 2012, 22, 1775–1789. [Google Scholar] [CrossRef]
  2. Wang, Z.; Gerstein, M.; Snyder, M. RNA-Seq: A revolutionary tool for transcriptomics. Nat. Rev. Genet. 2009, 10, 57–63. [Google Scholar] [CrossRef]
  3. Seal, R.L.; Chen, L.L.; Griffiths-Jones, S.; Lowe, T.M.; Mathews, M.B.; O’Reilly, D.; Pierce, A.J.; Stadler, P.F.; Ulitsky, I.; Wolin, S.L.; et al. A guide to naming human non-coding RNA genes. EMBO J. 2020, 39, e103777. [Google Scholar] [CrossRef]
  4. Uchida, S.; Adams, J.C. Physiological roles of non-coding RNAs. Am. J. Physiol. Cell. Physiol. 2019, 317, C1–C2. [Google Scholar] [CrossRef]
  5. Nojima, T.; Proudfoot, N.J. Mechanisms of lncRNA biogenesis as revealed by nascent transcriptomics. Nat. Rev. Mol. Cell. Biol. 2022, 23, 389–406. [Google Scholar] [CrossRef] [PubMed]
  6. Klapproth, C.; Sen, R.; Stadler, P.F.; Findeiss, S.; Fallmann, J. Common Features in lncRNA Annotation and Classification: A Survey. Noncoding RNA 2021, 7, 77. [Google Scholar] [CrossRef]
  7. Seal, R.L.; Tweedie, S.; Bruford, E.A. A standardised nomenclature for long non-coding RNAs. IUBMB Life 2022, 75, 380–389. [Google Scholar] [CrossRef] [PubMed]
  8. Wright, M.W. A short guide to long non-coding RNA gene nomenclature. Human Genomics 2014, 8, 7. [Google Scholar] [CrossRef] [PubMed]
  9. Zhao, L.; Wang, J.; Li, Y.; Song, T.; Wu, Y.; Fang, S.; Bu, D.; Li, H.; Sun, L.; Pei, D.; et al. NONCODEV6: An updated database dedicated to long non-coding RNA annotation in both animals and plants. Nucleic Acids Res. 2021, 49, D165–D171. [Google Scholar] [CrossRef]
  10. Uszczynska-Ratajczak, B.; Lagarde, J.; Frankish, A.; Guigo, R.; Johnson, R. Towards a complete map of the human long non-coding RNA transcriptome. Nat. Rev. Genet. 2018, 19, 535–548. [Google Scholar] [CrossRef]
  11. Sommerauer, C.; Kutter, C. Noncoding RNAs and RNA-binding proteins: Emerging governors of liver physiology and metabolic diseases. Am. J. Physiol. Cell. Physiol. 2022, 323, C1003–C1017. [Google Scholar] [CrossRef] [PubMed]
  12. Philip, M.; Chen, T.; Tyagi, S. A Survey of Current Resources to Study lncRNA-Protein Interactions. Noncoding RNA 2021, 7, 33. [Google Scholar] [CrossRef] [PubMed]
  13. Pisignano, G.; Ladomery, M. Epigenetic Regulation of Alternative Splicing: How LncRNAs Tailor the Message. Noncoding RNA 2021, 7, 21. [Google Scholar] [CrossRef]
  14. Karakas, D.; Ozpolat, B. The Role of LncRNAs in Translation. Noncoding RNA 2021, 7, 16. [Google Scholar] [CrossRef] [PubMed]
  15. Statello, L.; Guo, C.J.; Chen, L.L.; Huarte, M. Gene regulation by long non-coding RNAs and its biological functions. Nat. Rev. Mol. Cell. Biol. 2021, 22, 96–118. [Google Scholar] [CrossRef] [PubMed]
  16. Bhatti, G.K.; Khullar, N.; Sidhu, I.S.; Navik, U.S.; Reddy, A.P.; Reddy, P.H.; Bhatti, J.S. Emerging role of non-coding RNA in health and disease. Metab. Brain Dis. 2021, 36, 1119–1134. [Google Scholar] [CrossRef]
  17. Lopez-Jimenez, E.; Andres-Leon, E. The Implications of ncRNAs in the Development of Human Diseases. Noncoding RNA 2021, 7, 17. [Google Scholar] [CrossRef]
  18. Sparber, P.; Filatova, A.; Khantemirova, M.; Skoblov, M. The role of long non-coding RNAs in the pathogenesis of hereditary diseases. BMC Med. Genomics 2019, 12, 42. [Google Scholar] [CrossRef]
  19. Esteller, M. Non-coding RNAs in human disease. Nat. Rev. Genet. 2011, 12, 861–874. [Google Scholar] [CrossRef]
  20. Khan, M.A.B.; Hashim, M.J.; King, J.K.; Govender, R.D.; Mustafa, H.; Al Kaabi, J. Epidemiology of Type 2 Diabetes—Global Burden of Disease and Forecasted Trends. J. Epidemiol. Glob. Health 2020, 10, 107–111. [Google Scholar] [CrossRef]
  21. Schnurr, T.M.; Jakupovic, H.; Carrasquilla, G.D.; Angquist, L.; Grarup, N.; Sorensen, T.I.A.; Tjonneland, A.; Overvad, K.; Pedersen, O.; Hansen, T.; et al. Obesity, unfavourable lifestyle and genetic risk of type 2 diabetes: A case-cohort study. Diabetologia 2020, 63, 1324–1332. [Google Scholar] [CrossRef] [PubMed]
  22. Kyrou, I.; Tsigos, C.; Mavrogianni, C.; Cardon, G.; Van Stappen, V.; Latomme, J.; Kivela, J.; Wikstrom, K.; Tsochev, K.; Nanasi, A.; et al. Sociodemographic and lifestyle-related risk factors for identifying vulnerable groups for type 2 diabetes: A narrative review with emphasis on data from Europe. BMC Endocr. Disord. 2020, 20, 134. [Google Scholar] [CrossRef] [PubMed]
  23. Leong, A.; Porneala, B.; Dupuis, J.; Florez, J.C.; Meigs, J.B. Type 2 Diabetes Genetic Predisposition, Obesity, and All-Cause Mortality Risk in the U.S.: A Multiethnic Analysis. Diabetes Care 2016, 39, 539–546. [Google Scholar] [CrossRef] [PubMed]
  24. Martin-Timon, I.; Sevillano-Collantes, C.; Segura-Galindo, A.; Del Canizo-Gomez, F.J. Type 2 diabetes and cardiovascular disease: Have all risk factors the same strength? World J. Diabetes 2014, 5, 444–470. [Google Scholar] [CrossRef] [PubMed]
  25. Sun, D.; Zhou, T.; Heianza, Y.; Li, X.; Fan, M.; Fonseca, V.A.; Qi, L. Type 2 Diabetes and Hypertension. Circ. Res. 2019, 124, 930–937. [Google Scholar] [CrossRef] [PubMed]
  26. Duh, E.J.; Sun, J.K.; Stitt, A.W. Diabetic retinopathy: Current understanding, mechanisms, and treatment strategies. JCI Insight 2017, 2, e93751. [Google Scholar] [CrossRef]
  27. McGill, J.B.; Haller, H.; Roy-Chaudhury, P.; Cherrington, A.; Wada, T.; Wanner, C.; Ji, L.; Rossing, P. Making an impact on kidney disease in people with type 2 diabetes: The importance of screening for albuminuria. BMJ Open Diabetes Res. Care 2022, 10, e002806. [Google Scholar] [CrossRef] [PubMed]
  28. DeFronzo, R.A.; Ferrannini, E.; Groop, L.; Henry, R.R.; Herman, W.H.; Holst, J.J.; Hu, F.B.; Kahn, C.R.; Raz, I.; Shulman, G.I.; et al. Type 2 diabetes mellitus. Nat. Rev. Dis. Primers 2015, 1, 15019. [Google Scholar] [CrossRef]
  29. Olokoba, A.B.; Obateru, O.A.; Olokoba, L.B. Type 2 diabetes mellitus: A review of current trends. Oman Med. J. 2012, 27, 269–273. [Google Scholar] [CrossRef]
  30. Rorsman, P.; Ashcroft, F.M. Pancreatic beta-Cell Electrical Activity and Insulin Secretion: Of Mice and Men. Physiol. Rev. 2018, 98, 117–214. [Google Scholar] [CrossRef]
  31. Cerf, M.E. Beta cell dysfunction and insulin resistance. Front. Endocrinol. 2013, 4, 37. [Google Scholar] [CrossRef] [PubMed]
  32. Romero, A.; Eckel, J. Organ Crosstalk and the Modulation of Insulin Signaling. Cells 2021, 10, 2082. [Google Scholar] [CrossRef] [PubMed]
  33. Saltiel, A.R. Insulin signaling in health and disease. J. Clin. Investig. 2021, 131, e142241. [Google Scholar] [CrossRef] [PubMed]
  34. Boucher, J.; Kleinridders, A.; Kahn, C.R. Insulin receptor signaling in normal and insulin-resistant states. Cold Spring Harb. Perspect. Biol. 2014, 6, 9191. [Google Scholar] [CrossRef]
  35. Formichi, C.; Nigi, L.; Grieco, G.E.; Maccora, C.; Fignani, D.; Brusco, N.; Licata, G.; Sebastiani, G.; Dotta, F. Non-Coding RNAs: Novel Players in Insulin Resistance and Related Diseases. Int. J. Mol. Sci. 2021, 22, 7716. [Google Scholar] [CrossRef]
  36. Tello-Flores, V.A.; Beltran-Anaya, F.O.; Ramirez-Vargas, M.A.; Esteban-Casales, B.E.; Navarro-Tito, N.; Alarcon-Romero, L.D.C.; Luciano-Villa, C.A.; Ramirez, M.; Del Moral-Hernandez, O.; Flores-Alfaro, E. Role of Long Non-Coding RNAs and the Molecular Mechanisms Involved in Insulin Resistance. Int. J. Mol. Sci. 2021, 22, 7256. [Google Scholar] [CrossRef]
  37. Zhang, T.N.; Wang, W.; Yang, N.; Huang, X.M.; Liu, C.F. Regulation of Glucose and Lipid Metabolism by Long Non-coding RNAs: Facts and Research Progress. Front. Endocrinol. 2020, 11, 457. [Google Scholar] [CrossRef]
  38. Degirmenci, U.; Li, J.; Lim, Y.C.; Siang, D.T.C.; Lin, S.; Liang, H.; Sun, L. Silencing an insulin-induced lncRNA, LncASIR, impairs the transcriptional response to insulin signalling in adipocytes. Sci. Rep. 2019, 9, 5608. [Google Scholar] [CrossRef]
  39. Chi, T.; Lin, J.; Wang, M.; Zhao, Y.; Liao, Z.; Wei, P. Non-Coding RNA as Biomarkers for Type 2 Diabetes Development and Clinical Management. Front. Endocrinol. 2021, 12, 630032. [Google Scholar] [CrossRef]
  40. Dieter, C.; Lemos, N.E.; Correa, N.R.F.; Assmann, T.S.; Crispim, D. The Impact of lncRNAs in Diabetes Mellitus: A Systematic Review and In Silico Analyses. Front. Endocrinol. 2021, 12, 602597. [Google Scholar] [CrossRef]
  41. Chen, Y.; He, Y.; Zhou, H. The potential role of lncRNAs in diabetes and diabetic microvascular complications. Endocr. J. 2020, 67, 659–668. [Google Scholar] [CrossRef] [PubMed]
  42. Li, X.; Ma, T.K.; Wen, S.; Li, L.L.; Xu, L.; Zhu, X.W.; Zhang, C.X.; Liu, N.; Wang, X.; Fan, Q.L. LncRNA ARAP1-AS2 promotes high glucose-induced human proximal tubular cell injury via persistent transactivation of the EGFR by interacting with ARAP1. J. Cell. Mol. Med. 2020, 24, 12994–13009. [Google Scholar] [CrossRef] [PubMed]
  43. Zhang, F.; Yang, Y.; Chen, X.; Liu, Y.; Hu, Q.; Huang, B.; Liu, Y.; Pan, Y.; Zhang, Y.; Liu, D.; et al. The long non-coding RNA betaFaar regulates islet beta-cell function and survival during obesity in mice. Nat. Commun. 2021, 12, 3997. [Google Scholar] [CrossRef]
  44. Wang, M.; Wang, S.; Yao, D.; Yan, Q.; Lu, W. A novel long non-coding RNA CYP4B1-PS1-001 regulates proliferation and fibrosis in diabetic nephropathy. Mol. Cell. Endocrinol. 2016, 426, 136–145. [Google Scholar] [CrossRef] [PubMed]
  45. Das, S.; Reddy, M.A.; Senapati, P.; Stapleton, K.; Lanting, L.; Wang, M.; Amaram, V.; Ganguly, R.; Zhang, L.; Devaraj, S.; et al. Diabetes Mellitus-Induced Long Noncoding RNA Dnm3os Regulates Macrophage Functions and Inflammation via Nuclear Mechanisms. Arterioscler. Thromb. Vasc. Biol. 2018, 38, 1806–1820. [Google Scholar] [CrossRef]
  46. Reddy, M.A.; Amaram, V.; Das, S.; Tanwar, V.S.; Ganguly, R.; Wang, M.; Lanting, L.; Zhang, L.; Abdollahi, M.; Chen, Z.; et al. lncRNA DRAIR is downregulated in diabetic monocytes and modulates the inflammatory phenotype via epigenetic mechanisms. JCI Insight 2021, 6, e143289. [Google Scholar] [CrossRef]
  47. Ge, X.; Xu, B.; Xu, W.; Xia, L.; Xu, Z.; Shen, L.; Peng, W.; Huang, S. Long noncoding RNA GAS5 inhibits cell proliferation and fibrosis in diabetic nephropathy by sponging miR-221 and modulating SIRT1 expression. Aging 2019, 11, 8745–8759. [Google Scholar] [CrossRef]
  48. Cui, X.; Tan, J.; Shi, Y.; Sun, C.; Li, Y.; Ji, C.; Wu, J.; Zhang, Z.; Chen, S.; Guo, X.; et al. The long non-coding RNA Gm10768 activates hepatic gluconeogenesis by sequestering microRNA-214 in mice. J. Biol. Chem. 2018, 293, 4097–4109. [Google Scholar] [CrossRef]
  49. Luo, R.; Xiao, F.; Wang, P.; Hu, Y.X. lncRNA H19 sponging miR-93 to regulate inflammation in retinal epithelial cells under hyperglycemia via XBP1s. Inflamm. Res. 2020, 69, 255–265. [Google Scholar] [CrossRef]
  50. Li, Y.; Chen, Y.; Liu, Z.; Lin, B.; Deng, X.; Xiao, Q.; Chen, Z.; Ye, H.; Chen, D.; Su, Y.; et al. Downregulation of Kcnq1ot1 attenuates beta-cell proliferation and insulin secretion via the miR-15b-5p/Ccnd1 and Ccnd2 axis. Acta Diabetol. 2022, 59, 885–899. [Google Scholar] [CrossRef]
  51. Niu, B.; Yao, L.; Zhang, Y.; Xia, X.; Su, H. LncRNA KCNQ1OT1 promoted hepatitis C virus-induced pyroptosis of beta-cell through mediating the miR-223-3p/NLRP3 axis. Ann. Transl. Med. 2021, 9, 1387. [Google Scholar] [CrossRef]
  52. Cao, Z.; Yao, F.; Lang, Y.; Feng, X. Elevated Circulating LINC-P21 Serves as a Diagnostic Biomarker of Type 2 Diabetes Mellitus and Regulates Pancreatic beta-cell Function by Sponging miR-766-3p to Upregulate NR3C2. Exp. Clin. Endocrinol. Diabetes 2022, 130, 156–164. [Google Scholar] [CrossRef] [PubMed]
  53. Bai, X.; Geng, J.; Li, X.; Wan, J.; Liu, J.; Zhou, Z.; Liu, X. Long Noncoding RNA LINC01619 Regulates MicroRNA-27a/Forkhead Box Protein O1 and Endoplasmic Reticulum Stress-Mediated Podocyte Injury in Diabetic Nephropathy. Antioxid. Redox Signal. 2018, 29, 355–376. [Google Scholar] [CrossRef]
  54. Wang, J.; Yang, W.; Chen, Z.; Chen, J.; Meng, Y.; Feng, B.; Sun, L.; Dou, L.; Li, J.; Cui, Q.; et al. Long Noncoding RNA lncSHGL Recruits hnRNPA1 to Suppress Hepatic Gluconeogenesis and Lipogenesis. Diabetes 2018, 67, 581–593. [Google Scholar] [CrossRef] [PubMed]
  55. Zhu, X.; Liu, Y.; Cui, J.; Lv, J.; Li, C.; Lu, J.; Huo, X.; Dou, J.; Bai, Z.; Chen, Z.; et al. LncRNA LYPLAL1-DT screening from type 2 diabetes with macrovascular complication contributes protective effects on human umbilical vein endothelial cells via regulating the miR-204-5p/SIRT1 axis. Cell. Death Discov. 2022, 8, 245. [Google Scholar] [CrossRef] [PubMed]
  56. Yan, B.; Yao, J.; Liu, J.Y.; Li, X.M.; Wang, X.Q.; Li, Y.J.; Tao, Z.F.; Song, Y.C.; Chen, Q.; Jiang, Q. lncRNA-MIAT regulates microvascular dysfunction by functioning as a competing endogenous RNA. Circ. Res. 2015, 116, 1143–1156. [Google Scholar] [CrossRef]
  57. Li, Y.; Jiang, S.H.; Liu, S.; Wang, Q. Role of lncRNA NEAT1 mediated by YY1 in the development of diabetic cataract via targeting the microRNA-205-3p/MMP16 axis. Eur. Rev. Med. Pharmacol. Sci. 2020, 24, 5863–5870. [Google Scholar] [CrossRef]
  58. Chen, Q.; He, Y.; Wang, X.; Zhu, Y.; Huang, Y.; Cao, J.; Yan, R. LncRNA PTGS2 regulates islet beta-cell function through the miR-146a-5p/RBP4 axis and its diagnostic value in type 2 diabetes mellitus. Am. J. Transl. Res. 2021, 13, 11316–11328. [Google Scholar]
  59. Cai, Q.; Wang, C.; Huang, L.; Wu, C.; Yan, B.; Chen, T.; Li, Q.; Wang, L. Long Non-Coding RNA Small Nucleolar RNA Host Gene 5 (SNHG5) Regulates Renal Tubular Damage in Diabetic Nephropathy via Targeting MiR-26a-5p. Horm. Metab. Res. 2021, 53, 818–824. [Google Scholar] [CrossRef]
  60. Zhang, P.; Li, Y.N.; Tu, S.; Cheng, X.B. SP1-induced lncRNA TUG1 regulates proliferation and apoptosis in islet cells of type 2 diabetes mellitus via the miR-188-3p/FGF5 axis. Eur. Rev. Med. Pharmacol. Sci. 2021, 25, 1959–1966. [Google Scholar] [CrossRef]
  61. Zhou, A.X.; Mondal, T.; Tabish, A.M.; Abadpour, S.; Ericson, E.; Smith, D.M.; Knoll, R.; Scholz, H.; Kanduri, C.; Tyrberg, B.; et al. The long noncoding RNA TUNAR modulates Wnt signaling and regulates human beta-cell proliferation. Am. J. Physiol. Endocrinol. Metab. 2021, 320, E846–E857. [Google Scholar] [CrossRef] [PubMed]
  62. Vanormelingen, C.; Tack, J.; Andrews, C.N. Diabetic gastroparesis. Br. Med. Bull. 2013, 105, 213–230. [Google Scholar] [CrossRef] [PubMed]
  63. Young, C.F.; Moussa, M.; Shubrook, J.H. Diabetic Gastroparesis: A Review. Diabetes Spectr. 2020, 33, 290–297. [Google Scholar] [CrossRef] [PubMed]
  64. Grover, M.; Gibbons, S.J.; Nair, A.A.; Bernard, C.E.; Zubair, A.S.; Eisenman, S.T.; Wilson, L.A.; Miriel, L.; Pasricha, P.J.; Parkman, H.P.; et al. Transcriptomic signatures reveal immune dysregulation in human diabetic and idiopathic gastroparesis. BMC Med. Genomics 2018, 11, 62. [Google Scholar] [CrossRef]
  65. Wigger, L.; Barovic, M.; Brunner, A.D.; Marzetta, F.; Schoniger, E.; Mehl, F.; Kipke, N.; Friedland, D.; Burdet, F.; Kessler, C.; et al. Multi-omics profiling of living human pancreatic islet donors reveals heterogeneous beta cell trajectories towards type 2 diabetes. Nat. Metab. 2021, 3, 1017–1031. [Google Scholar] [CrossRef] [PubMed]
  66. Hart, P.A.; Bellin, M.D.; Andersen, D.K.; Bradley, D.; Cruz-Monserrate, Z.; Forsmark, C.E.; Goodarzi, M.O.; Habtezion, A.; Korc, M.; Kudva, Y.C.; et al. Type 3c (pancreatogenic) diabetes mellitus secondary to chronic pancreatitis and pancreatic cancer. Lancet Gastroenterol. Hepatol. 2016, 1, 226–237. [Google Scholar] [CrossRef]
  67. Rao, S.S.; Disraeli, P.; McGregor, T. Impaired glucose tolerance and impaired fasting glucose. Am. Fam. Physician 2004, 69, 1961–1968. [Google Scholar]
  68. Li, Z.; Liu, L.; Feng, C.; Qin, Y.; Xiao, J.; Zhang, Z.; Ma, L. LncBook 2.0: Integrating human long non-coding RNAs with multi-omics annotations. Nucleic Acids Res. 2023, 51, D186–D191. [Google Scholar] [CrossRef]
  69. Corella, D.; Sorli, J.V.; Gonzalez, J.I.; Ortega, C.; Fito, M.; Bullo, M.; Martinez-Gonzalez, M.A.; Ros, E.; Aros, F.; Lapetra, J.; et al. Novel association of the obesity risk-allele near Fas Apoptotic Inhibitory Molecule 2 (FAIM2) gene with heart rate and study of its effects on myocardial infarction in diabetic participants of the PREDIMED trial. Cardiovasc. Diabetol. 2014, 13, 5. [Google Scholar] [CrossRef]
  70. Moriggi, M.; Belloli, S.; Barbacini, P.; Murtaj, V.; Torretta, E.; Chaabane, L.; Canu, T.; Penati, S.; Malosio, M.L.; Esposito, A.; et al. Skeletal Muscle Proteomic Profile Revealed Gender-Related Metabolic Responses in a Diet-Induced Obesity Animal Model. Int. J. Mol. Sci. 2021, 22, 4680. [Google Scholar] [CrossRef]
  71. Jia, G.; Sowers, J.R. Targeting CITED2 for Angiogenesis in Obesity and Insulin Resistance. Diabetes 2016, 65, 3535–3536. [Google Scholar] [CrossRef] [PubMed]
  72. Wang, X.; Lockhart, S.M.; Rathjen, T.; Albadawi, H.; Sorensen, D.; O’Neill, B.T.; Dwivedi, N.; Preil, S.R.; Beck, H.C.; Dunwoodie, S.L.; et al. Insulin Downregulates the Transcriptional Coregulator CITED2, an Inhibitor of Proangiogenic Function in Endothelial Cells. Diabetes 2016, 65, 3680–3690. [Google Scholar] [CrossRef] [PubMed]
  73. Sakai, M.; Matsumoto, M.; Tujimura, T.; Yongheng, C.; Noguchi, T.; Inagaki, K.; Inoue, H.; Hosooka, T.; Takazawa, K.; Kido, Y.; et al. CITED2 links hormonal signaling to PGC-1alpha acetylation in the regulation of gluconeogenesis. Nat. Med. 2012, 18, 612–617. [Google Scholar] [CrossRef] [PubMed]
  74. Edgar, L.; Akbar, N.; Braithwaite, A.T.; Krausgruber, T.; Gallart-Ayala, H.; Bailey, J.; Corbin, A.L.; Khoyratty, T.E.; Chai, J.T.; Alkhalil, M.; et al. Hyperglycemia Induces Trained Immunity in Macrophages and Their Precursors and Promotes Atherosclerosis. Circulation 2021, 144, 961–982. [Google Scholar] [CrossRef] [PubMed]
  75. Shi, B.; Zhang, X.; Chao, L.; Zheng, Y.; Tan, Y.; Wang, L.; Zhang, W. Comprehensive analysis of key genes, microRNAs and long non-coding RNAs in hepatocellular carcinoma. FEBS Open Bio. 2018, 8, 1424–1436. [Google Scholar] [CrossRef]
  76. Gupta, M.; Martens, K.; Metz, L.M.; de Koning, A.J.; Pfeffer, G. Long noncoding RNAs associated with phenotypic severity in multiple sclerosis. Mult. Scler. Relat. Disord. 2019, 36, 101407. [Google Scholar] [CrossRef]
  77. Yan, Q.; Forno, E.; Herrera-Luis, E.; Pino-Yanes, M.; Qi, C.; Rios, R.; Han, Y.Y.; Kim, S.; Oh, S.; Acosta-Perez, E.; et al. A genome-wide association study of severe asthma exacerbations in Latino children and adolescents. Eur. Respir. J. 2021, 57, 2002693. [Google Scholar] [CrossRef] [PubMed]
  78. Yang, H.; Lin, H.C.; Liu, H.; Gan, D.; Jin, W.; Cui, C.; Yan, Y.; Qian, Y.; Han, C.; Wang, Z. A 6 lncRNA-Based Risk Score System for Predicting the Recurrence of Colon Adenocarcinoma Patients. Front. Oncol. 2020, 10, 81. [Google Scholar] [CrossRef]
  79. Cheng, C.; Wang, Q.; Zhu, M.; Liu, K.; Zhang, Z. Integrated analysis reveals potential long non-coding RNA biomarkers and their potential biological functions for disease free survival in gastric cancer patients. Cancer Cell. Int. 2019, 19, 123. [Google Scholar] [CrossRef]
  80. Yin, X.; Yang, Z.; Zhu, M.; Chen, C.; Huang, S.; Li, X.; Zhong, H.; Wen, H.; Sun, Q.; Yu, X.; et al. ILF2 Contributes to Hyperproliferation of Keratinocytes and Skin Inflammation in a KLHDC7B-DT-Dependent Manner in Psoriasis. Front. Genet. 2022, 13, 890624. [Google Scholar] [CrossRef]
  81. Werba, G.; Gonda, T.A. Missing links—Epigenetic regulators of the pancreatic cancer-associated inflammation. Clin. Sci. 2021, 135, 1289–1293. [Google Scholar] [CrossRef]
  82. Li, M.X.; Wang, H.Y.; Yuan, C.H.; Ma, Z.L.; Jiang, B.; Li, L.; Zhang, L.; Xiu, D.R. KLHDC7B-DT aggravates pancreatic ductal adenocarcinoma development via inducing cross-talk between cancer cells and macrophages. Clin. Sci. 2021, 135, 629–649. [Google Scholar] [CrossRef] [PubMed]
  83. Hu, W.; Ding, Y.; Wang, S.; Xu, L.; Yu, H. The Construction and Analysis of the Aberrant lncRNA-miRNA-mRNA Network in Adipose Tissue from Type 2 Diabetes Individuals with Obesity. J. Diabetes Res. 2020, 2020, 3980742. [Google Scholar] [CrossRef]
  84. Gao, W.Z.; Guo, L.M.; Xu, T.Q.; Yin, Y.H.; Jia, F. Identification of a multidimensional transcriptome signature for survival prediction of postoperative glioblastoma multiforme patients. J. Transl. Med. 2018, 16, 368. [Google Scholar] [CrossRef] [PubMed]
  85. Sun, Y.; Wang, X.; Bu, X. LINC02381 contributes to cell proliferation and hinders cell apoptosis in glioma by transcriptionally enhancing CBX5. Brain Res. Bull. 2021, 176, 121–129. [Google Scholar] [CrossRef] [PubMed]
  86. Priyanka, P.; Sharma, M.; Das, S.; Saxena, S. The lncRNA HMS recruits RNA-binding protein HuR to stabilize the 3′-UTR of HOXC10 mRNA. J. Biol. Chem. 2021, 297, 100997. [Google Scholar] [CrossRef] [PubMed]
  87. Nemati, H.; Fakhre-Taha, M.; Javanmard, A.R.; Jahanbakhshi, A.; Mowla, S.J.; Soltani, B.M. LINC02381-ceRNA exerts its oncogenic effect through regulation of IGF1R signaling pathway in glioma. J. Neurooncol. 2022, 158, 1–13. [Google Scholar] [CrossRef] [PubMed]
  88. Huang, S.; Huang, P.; Wu, H.; Wang, S.; Liu, G. LINC02381 aggravates breast cancer through the miR-1271-5p/FN1 axis to activate PI3K/AKT pathway. Mol. Carcinog. 2022, 61, 346–358. [Google Scholar] [CrossRef]
  89. Zhao, G.; Luo, W.D.; Yuan, Y.; Lin, F.; Guo, L.M.; Ma, J.J.; Chen, H.B.; Tang, H.; Shu, J. LINC02381, a sponge of miR-21, weakens osteogenic differentiation of hUC-MSCs through KLF12-mediated Wnt4 transcriptional repression. J. Bone Miner. Metab. 2022, 40, 66–80. [Google Scholar] [CrossRef]
  90. Bian, X.; Sun, Y.M.; Wang, L.M.; Shang, Y.L. ELK1-induced upregulation lncRNA LINC02381 accelerates the osteosarcoma tumorigenesis through targeting CDCA4 via sponging miR-503-5p. Biochem. Biophys. Res. Commun. 2021, 548, 112–119. [Google Scholar] [CrossRef]
  91. Jafarzadeh, M.; Soltani, B.M. Long Noncoding RNA LOC400043 (LINC02381) Inhibits Gastric Cancer Progression through Regulating Wnt Signaling Pathway. Front. Oncol. 2020, 10, 562253. [Google Scholar] [CrossRef] [PubMed]
  92. Wang, J.; Zhao, Q. Linc02381 Exacerbates Rheumatoid Arthritis through Adsorbing miR-590-5p and Activating the Mitogen-Activated Protein Kinase Signaling Pathway in Rheumatoid arthritis-fibroblast-like synoviocytes. Cell Transplant. 2020, 29, 963689720938023. [Google Scholar] [CrossRef] [PubMed]
  93. Chen, X.; Zhang, Z.; Ma, Y.; Su, H.; Xie, P.; Ran, J. LINC02381 Promoted Cell Viability and Migration via Targeting miR-133b in Cervical Cancer Cells. Cancer Manag. Res. 2020, 12, 3971–3979. [Google Scholar] [CrossRef] [PubMed]
  94. Xu, Y.; Zou, X.; Mei, J. The Risk Correlation between N7-Methylguanosine Modification-Related lncRNAs and Survival Prognosis of Oral Squamous Cell Carcinoma Based on Comprehensive Bioinformatics Analysis. Appl. Bionics Biomech. 2022, 2022, 1666792. [Google Scholar] [CrossRef] [PubMed]
  95. Huang, J.; Zhu, L.; Zhao, X.; Wu, X.; Yang, J.; Xu, B.; Zhao, Z.; Gu, L.; Su, L. LncRNA SERPINB9P1 expression and polymorphisms are associated with ischemic stroke in a Chinese Han population. Neurol. Sci. 2022, 43, 1143–1154. [Google Scholar] [CrossRef]
  96. Wang, S. Investigation of long non-coding RNA expression profiles in patients with post-menopausal osteoporosis by RNA sequencing. Exp. Ther. Med. 2020, 20, 1487–1497. [Google Scholar] [CrossRef]
  97. Liu, L.; Wang, H.; Zhang, X.; Chen, R. Identification of Potential Biomarkers in Neonatal Sepsis by Establishing a Competitive Endogenous RNA Network. Comb. Chem. High Throughput Screen. 2020, 23, 369–380. [Google Scholar] [CrossRef]
  98. Li, C.; Liang, X.; Liu, Y. lncRNA USP30-AS1 sponges miR-765 and modulates the progression of colon cancer. World J. Surg. Oncol. 2022, 20, 73. [Google Scholar] [CrossRef]
  99. Chen, M.; Chi, Y.; Chen, H.; Zhao, L. Long non-coding RNA USP30-AS1 aggravates the malignant progression of cervical cancer by sequestering microRNA-299-3p and thereby overexpressing PTP4A1. Oncol. Lett. 2021, 22, 505. [Google Scholar] [CrossRef]
  100. Zhou, W.; Xu, S.; Deng, T.; Zhou, R.; Wang, C. LncRNA USP30-AS1 promotes the survival of acute myeloid leukemia cells by cis-regulating USP30 and ANKRD13A. Hum. Cell 2022, 35, 360–378. [Google Scholar] [CrossRef]
  101. Lee, A.H.; Heidtman, K.; Hotamisligil, G.S.; Glimcher, L.H. Dual and opposing roles of the unfolded protein response regulated by IRE1alpha and XBP1 in proinsulin processing and insulin secretion. Proc. Natl. Acad. Sci. USA 2011, 108, 8885–8890. [Google Scholar] [CrossRef] [PubMed]
  102. Zeggini, E.; Weedon, M.N.; Lindgren, C.M.; Frayling, T.M.; Elliott, K.S.; Lango, H.; Timpson, N.J.; Perry, J.R.; Rayner, N.W.; Freathy, R.M.; et al. Replication of genome-wide association signals in UK samples reveals risk loci for type 2 diabetes. Science 2007, 316, 1336–1341. [Google Scholar] [CrossRef] [PubMed]
  103. Wang, F.; Gao, Y.; Zhou, L.; Chen, J.; Xie, Z.; Ye, Z.; Wang, Y. USP30: Structure, Emerging Physiological Role, and Target Inhibition. Front. Pharmacol. 2022, 13, 851654. [Google Scholar] [CrossRef]
  104. Gil, N.; Ulitsky, I. Regulation of gene expression by cis-acting long non-coding RNAs. Nat. Rev. Genet. 2020, 21, 102–117. [Google Scholar] [CrossRef] [PubMed]
  105. Liu, Y.; Zhang, H.; Hu, D.; Liu, S. New algorithms based on autophagy-related lncRNAs pairs to predict the prognosis of skin cutaneous melanoma patients. Arch. Dermatol. Res. 2023, ahead of print. [Google Scholar] [CrossRef]
  106. Xiang, X.; Guo, Y.; Chen, Z.; Zhang, F.; Huang, J.; Qin, Y. A prognostic risk prediction model based on ferroptosis-related long non-coding RNAs in bladder cancer: A bulk RNA-seq research and scRNA-seq validation. Medicine 2022, 101, e32558. [Google Scholar] [CrossRef]
  107. Kang, Z.; Dou, Q.; Huang, T.; Tu, M.; Zhong, Y.; Wang, M.; Li, T. An angiogenesis-related lncRNA signature for the prognostic prediction of patients with bladder cancer and LINC02321 promotes bladder cancer progression via the VEGFA signaling pathway. Mol. Med. Rep. 2023, 27, 38. [Google Scholar] [CrossRef]
  108. Dai, Y.W.; Wen, Z.K.; Wu, Z.X.; Wu, H.D.; Lv, L.X.; Yan, C.Z.; Liu, C.H.; Wang, Z.Q.; Zheng, C. Amino Acid Metabolism-Related lncRNA Signature Predicts the Prognosis of Breast Cancer. Front. Genet. 2022, 13, 880387. [Google Scholar] [CrossRef]
  109. Qiu, Y.; Wang, H.T.; Zheng, X.F.; Huang, X.; Meng, J.Z.; Huang, J.P.; Wen, Z.P.; Yao, J. Autophagy-related long non-coding RNA prognostic model predicts prognosis and survival of melanoma patients. World J. Clin. Cases 2022, 10, 3334–3351. [Google Scholar] [CrossRef]
  110. Tao, S.; Tao, K.; Cai, X. Necroptosis-Associated lncRNA Prognostic Model and Clustering Analysis: Prognosis Prediction and Tumor-Infiltrating Lymphocytes in Breast Cancer. J. Oncol. 2022, 2022, 7099930. [Google Scholar] [CrossRef]
  111. Shi, G.J.; Zhou, Q.; Zhu, Q.; Wang, L.; Jiang, G.Q. A novel prognostic model associated with the overall survival in patients with breast cancer based on lipid metabolism-related long noncoding RNAs. J. Clin. Lab. Anal. 2022, 36, e24384. [Google Scholar] [CrossRef] [PubMed]
  112. Lv, X.; Liu, L.; Li, P.; Yuan, Y.; Peng, M.; Jin, H.; Qin, D. Constructing a Novel Signature Based on Immune-Related lncRNA to Improve Prognosis Prediction of Cervical Squamous Cell Carcinoma Patients. Reprod. Sci. 2022, 29, 800–815. [Google Scholar] [CrossRef]
  113. Peng, Y.; Wang, H.; Huang, Q.; Wu, J.; Zhang, M. A prognostic model based on immune-related long noncoding RNAs for patients with epithelial ovarian cancer. J. Ovarian Res. 2022, 15, 8. [Google Scholar] [CrossRef]
  114. Li, Z.; Wei, J.; Zheng, H.; Zhang, Y.; Song, M.; Cao, H.; Jin, Y. The new horizon of biomarker in melanoma patients: A study based on autophagy-related long non-coding RNA. Medicine 2022, 101, e28553. [Google Scholar] [CrossRef] [PubMed]
  115. Xue, L.; Wu, P.; Zhao, X.; Jin, X.; Wang, J.; Shi, Y.; Yang, X.; She, Y.; Li, Y.; Li, C. Using Immune-Related lncRNA Signature for Prognosis and Response to Immunotherapy in Cutaneous Melanoma. Int. J. Gen. Med. 2021, 14, 6463–6475. [Google Scholar] [CrossRef] [PubMed]
  116. Cui, Y.; Zhou, Z.; Chai, Y.; Che, X.; Zhang, Y. Identification of a Nomogram from Ferroptosis-Related Long Noncoding RNAs Signature to Analyze Overall Survival in Patients with Bladder Cancer. J. Oncol. 2021, 2021, 8533464. [Google Scholar] [CrossRef]
  117. Ding, Y.; Li, T.; Li, M.; Tayier, T.; Zhang, M.; Chen, L.; Feng, S. A Novel Autophagy-Related lncRNA Gene Signature to Improve the Prognosis of Patients with Melanoma. Biomed. Res. Int. 2021, 2021, 8848227. [Google Scholar] [CrossRef]
  118. Mao, Y.; Lv, J.; Jiang, L.; Wang, Y. Integrative analysis of ceRNA network reveals functional lncRNAs associated with independent recurrent prognosis in colon adenocarcinoma. Cancer Cell. Int. 2021, 21, 352. [Google Scholar] [CrossRef]
  119. Wan, J.; Guo, C.; Fang, H.; Xu, Z.; Hu, Y.; Luo, Y. Autophagy-Related Long Non-coding RNA Is a Prognostic Indicator for Bladder Cancer. Front. Oncol. 2021, 11, 647236. [Google Scholar] [CrossRef]
  120. Gao, M.; Wang, X.; Han, D.; Lu, E.; Zhang, J.; Zhang, C.; Wang, L.; Yang, Q.; Jiang, Q.; Wu, J.; et al. A Six-lncRNA Signature for Immunophenotype Prediction of Glioblastoma Multiforme. Front. Genet. 2020, 11, 604655. [Google Scholar] [CrossRef]
  121. Chen, P.; Gao, Y.; Ouyang, S.; Wei, L.; Zhou, M.; You, H.; Wang, Y. A Prognostic Model Based on Immune-Related Long Non-Coding RNAs for Patients with Cervical Cancer. Front. Pharmacol. 2020, 11, 585255. [Google Scholar] [CrossRef] [PubMed]
  122. Tong, H.; Li, T.; Gao, S.; Yin, H.; Cao, H.; He, W. An epithelial-mesenchymal transition-related long noncoding RNA signature correlates with the prognosis and progression in patients with bladder cancer. Biosci. Rep. 2021, 41, BSR20203944. [Google Scholar] [CrossRef]
  123. Meng, C.; Zhou, J.Q.; Liao, Y.S. Autophagy-related long non-coding RNA signature for ovarian cancer. J. Int. Med. Res. 2020, 48, 300060520970761. [Google Scholar] [CrossRef] [PubMed]
  124. Sun, Z.; Jing, C.; Xiao, C.; Li, T. An autophagy-related long non-coding RNA prognostic signature accurately predicts survival outcomes in bladder urothelial carcinoma patients. Aging 2020, 12, 15624–15637. [Google Scholar] [CrossRef] [PubMed]
  125. Zhang, Y.; Yang, L.; Chen, L.L. Life without A tail: New formats of long noncoding RNAs. Int. J. Biochem. Cell. Biol. 2014, 54, 338–349. [Google Scholar] [CrossRef]
  126. Johnsson, P.; Lipovich, L.; Grander, D.; Morris, K.V. Evolutionary conservation of long non-coding RNAs; sequence, structure, function. Biochim. Biophys. Acta 2014, 1840, 1063–1071. [Google Scholar] [CrossRef] [PubMed]
  127. Ilieva, M.; Dao, J.; Miller, H.E.; Madsen, J.H.; Bishop, A.J.R.; Kauppinen, S.; Uchida, S. Systematic Analysis of Long Non-Coding RNA Genes in Nonalcoholic Fatty Liver Disease. Noncoding RNA 2022, 8, 56. [Google Scholar] [CrossRef]
  128. Ilieva, M.; Miller, H.E.; Agarwal, A.; Paulus, G.K.; Madsen, J.H.; Bishop, A.J.R.; Kauppinen, S.; Uchida, S. FibroDB: Expression Analysis of Protein-Coding and Long Non-Coding RNA Genes in Fibrosis. Noncoding RNA 2022, 8, 13. [Google Scholar] [CrossRef]
  129. Chen, S.; Zhou, Y.; Chen, Y.; Gu, J. fastp: An ultra-fast all-in-one FASTQ preprocessor. Bioinformatics 2018, 34, i884–i890. [Google Scholar] [CrossRef]
  130. Dobin, A.; Davis, C.A.; Schlesinger, F.; Drenkow, J.; Zaleski, C.; Jha, S.; Batut, P.; Chaisson, M.; Gingeras, T.R. STAR: Ultrafast universal RNA-seq aligner. Bioinformatics 2013, 29, 15–21. [Google Scholar] [CrossRef]
  131. Robinson, M.D.; McCarthy, D.J.; Smyth, G.K. edgeR: A Bioconductor package for differential expression analysis of digital gene expression data. Bioinformatics 2010, 26, 139–140. [Google Scholar] [CrossRef] [PubMed]
  132. Wickham, H. ggplot2: Elegant Graphics for Data Analysis. In Use R! 2nd ed.; Springer International Publishing: Cham, Switzerland, 2016. [Google Scholar]
  133. Huang, D.W.; Sherman, B.T.; Lempicki, R.A. Systematic and integrative analysis of large gene lists using DAVID bioinformatics resources. Nat. Protoc. 2009, 4, 44–57. [Google Scholar] [CrossRef] [PubMed]
  134. Huang, D.W.; Sherman, B.T.; Lempicki, R.A. Bioinformatics enrichment tools: Paths toward the comprehensive functional analysis of large gene lists. Nucleic Acids Res. 2009, 37, 1–13. [Google Scholar] [CrossRef] [PubMed]
  135. Lawrence, M.; Huber, W.; Pages, H.; Aboyoun, P.; Carlson, M.; Gentleman, R.; Morgan, M.T.; Carey, V.J. Software for computing and annotating genomic ranges. PLoS Comput. Biol. 2013, 9, e1003118. [Google Scholar] [CrossRef]
  136. Delprat, V.; Tellier, C.; Demazy, C.; Raes, M.; Feron, O.; Michiels, C. Cycling hypoxia promotes a pro-inflammatory phenotype in macrophages via JNK/p65 signaling pathway. Sci. Rep. 2020, 10, 882. [Google Scholar] [CrossRef]
  137. Chang, W.; Cheng, J.; Allaire, J.J.; Sievert, C.; Schloerke, B.; Xie, Y.; Allen, J.; McPherson, J.; Dipert, A.; Borges, B.; et al. Shiny: Web Application Framework for R. Available online: https://shiny.rstudio.com/ (accessed on 21 March 2023).
  138. Gu, Z.; Eils, R.; Schlesner, M. Complex heatmaps reveal patterns and correlations in multidimensional genomic data. Bioinformatics 2016, 32, 2847–2849. [Google Scholar] [CrossRef]
  139. Raudvere, U.; Kolberg, L.; Kuzmin, I.; Arak, T.; Adler, P.; Peterson, H.; Vilo, J. g:Profiler: A web server for functional enrichment analysis and conversions of gene lists (2019 update). Nucleic Acids Res. 2019, 47, W191–W198. [Google Scholar] [CrossRef]
  140. Wu, T.; Hu, E.; Xu, S.; Chen, M.; Guo, P.; Dai, Z.; Feng, T.; Zhou, L.; Tang, W.; Zhan, L.; et al. clusterProfiler 4.0: A universal enrichment tool for interpreting omics data. Innovation 2021, 2, 100141. [Google Scholar] [CrossRef]
  141. Yu, G.; Wang, L.G.; Han, Y.; He, Q.Y. clusterProfiler: An R package for comparing biological themes among gene clusters. Omics 2012, 16, 284–287. [Google Scholar] [CrossRef]
  142. Yu, G. Enrichplot: Visualization of Functional Enrichment Result. Available online: https://yulab-smu.top/biomedical-knowledge-mining-book/ (accessed on 21 March 2023).
  143. Conway, J.R.; Lex, A.; Gehlenborg, N. UpSetR: An R package for the visualization of intersecting sets and their properties. Bioinformatics 2017, 33, 2938–2940. [Google Scholar] [CrossRef]
Figure 1. RNA-seq data analysis of surgical pancreatic tissue samples from 41 patients with impaired glucose tolerance (IGT), 35 patients with type 3c diabetes (T3cD), 39 T2D patients, and 18 subjects without T2D (control). (A) Volcano plots. The threshold values of absolute value of logarithm of base 2-in fold change (|log2FC|) of 1 and false discovery rate-adjusted p-value (FDR) < 0.05 were applied. Red and pink dots represent up-regulated lncRNA and protein-coding genes, respectively, and blue and light-blue dots represent down-regulated lncRNA and protein-coding genes, respectively, compared to the control samples in all cases. (B) Venn diagrams depicting up- and down-regulated lncRNA and protein-coding genes comparing T2D and T3cD patients against the control subjects. (CE) Enriched (C) GO terms for up-regulated T2D-related genes (top 5 only); (D) KEGG pathways; and (E) KEGG pathways for the most significantly correlating protein-coding genes to the set of up-regulated lncRNA genes (top 5 only). (F) Correlation of the counts per million (CPM) values between the lncRNA ENSG00000284653 and all expressed protein-coding genes, with the top correlating genes depicted. The box indicates LncBook 2.0-collected annotations about this lncRNA gene, including its type, conservation percentile, and predicted miRNA binding sites.
Ncrna 09 00030 g001
Figure 2. RNA-seq data analysis of full thickness gastric body biopsies from seven DG, seven DC, and seven control subjects. (A) Volcano plots displaying threshold values of |log2FC| > 1. Red and pink dots represent up-regulated lncRNA and protein-coding genes, respectively, while blue and light blue dots represent down-regulated lncRNA and protein-coding genes, respectively, compared to the control samples. (B,C) Top (B) 10 enriched GO terms; and (C) Top 5 KEGG pathways for down-regulated protein-coding genes. (D) Top five KEGG pathways of protein-coding genes correlating to the set of down-regulated lncRNA genes (FDR < 0.00001).
Ncrna 09 00030 g002
Figure 3. RNA-seq data analysis of PBMC isolated from four control subjects and six T2D patients. All cells were stimulated with LPS and IFN-γ, which are marked as “stimulated”, and compared to the unstimulated samples. (A) Volcano plots including thresholds of |log2FC| > 1 and FDR < 0.05. Red and pink dots represent up-regulated lncRNA and protein-coding genes, respectively, while blue and light blue dots represent down-regulated lncRNA and protein-coding genes, respectively, compared to the unstimulated samples in all cases. (B) Venn diagrams of up- and down-regulated protein-coding and lncRNA genes shared between the two comparisons. (C) In silico analysis of the lncRNA gene USP30-AS1. The ranked correlations between the expression of USP30-AS1 and all other genes are shown along with the information from LncBook 2.0. (D) Top 5 KEGG pathway analysis of the top correlating genes to USP30-AS1 (FDR < 0.00001).
Ncrna 09 00030 g003
Figure 4. Expression and functional analysis in macrophages. (A,B) Expressions of (A) pro-inflammatory marker genes; and (B) the selected lncRNAs. n = 6 and 4 biological replicates per M (-) and M (IFN-γ/LPS) cells, respectively. * (p < 0.05), ** (p < 0.01) and *** (p < 0.005). (C) Silencing of USP30-AS1. Compared to the control (siRNA against scrambled sequence (siScr)), two siRNAs against USP30-AS1 (siUSP30-AS1.1 and siUSP30-AS1.2) resulted in down-regulation of pro-inflammatory marker genes. n = 6 biological replicates. (D,E) Expressions of the overlapping protein-coding gene, USP30. (D) Upon silencing of USP30-AS1. n = 6 biological replicates. n.s. stands for not significant. (E) Comparing M (-) and M (IFN-γ/LPS) cells. n = 6 and 4 biological replicates per M (-) and M (IFN-γ/LPS) cells, respectively.
Ncrna 09 00030 g004
Figure 5. T2DB web database. (A) The top page of T2DB. (B) “Explore Results” tab and window. The users can dynamically explore each differentially expressed genes from the Result Table. (C) The differentially expressed genes can be visualized via a heat map. (D) As there are several conditions within each study, differentially expressed genes among different conditions to be compared can be visualized via the “Comparisons Intersection” Table. (E) “Explore the lncRNAs” tab and window. The users can dynamically explore each differentially expressed lncRNA gene in each study and comparison from the lncRNA Table.
Ncrna 09 00030 g005
Table 1. List of functionally studied lncRNAs in relation to T2D.
Official Gene NameOfficial Gene Symbol and AliasReference
ARAP1 antisense RNA 2ARAP1-AS2[42]
TRAF3IP2 antisense RNA 1TRAF3IP2-AS1, also known as βFaar[43]
cytochrome P450, family 4, subfamily b, polypeptide 1, pseudogene 1Cyp4b1-ps1, also known as CYP4B1-PS1-001[44]
DNM3 opposite strand/antisense RNADnm3os[45]
diabetes regulated anti-inflammatory lncRNADRAIR, also known as CPEB2-AS[46]
growth arrest specific 5GAS5[47]
predicted gene 10768Gm10768[48]
H19 imprinted maternally expressed transcriptH19[49]
KCNQ1 opposite strand/antisense transcript 1KCNQ1OT1[50,51]
tumor protein p53 pathway corepressor 1TP53COR1, also known as LINC-P21[52]
long intergenic non-protein-coding RNA 1619LINC01619[53]
predicted gene, 19689Gm19689, also known as lncSHGL[54]
LYPLAL1 divergent transcriptLYPLAL1-DT[55]
myocardial infarction associated transcriptMIAT[56]
nuclear paraspeckle assembly transcript 1NEAT1[57]
prostaglandin-endoperoxide synthase 2PTGS2[58]
small nucleolar RNA host gene 5SNHG5[59]
taurine up-regulated 1TUG1[60]
TCL1 upstream neural differentiation-associated RNATUNAR[61]
ARAP1 antisense RNA 2ARAP1-AS2[42]
TRAF3IP2 antisense RNA 1TRAF3IP2-AS1, also known as βFaar[43]
Disclaimer/Publisher’s Note: The statements, opinions and data contained in all publications are solely those of the individual author(s) and contributor(s) and not of MDPI and/or the editor(s). MDPI and/or the editor(s) disclaim responsibility for any injury to people or property resulting from any ideas, methods, instructions or products referred to in the content.

