
DisiMiR: Predicting Pathogenic miRNAs Using Network Influence and miRNA Conservation


Abstract
:1. Introduction
2. Method
2.1. DisiMiR
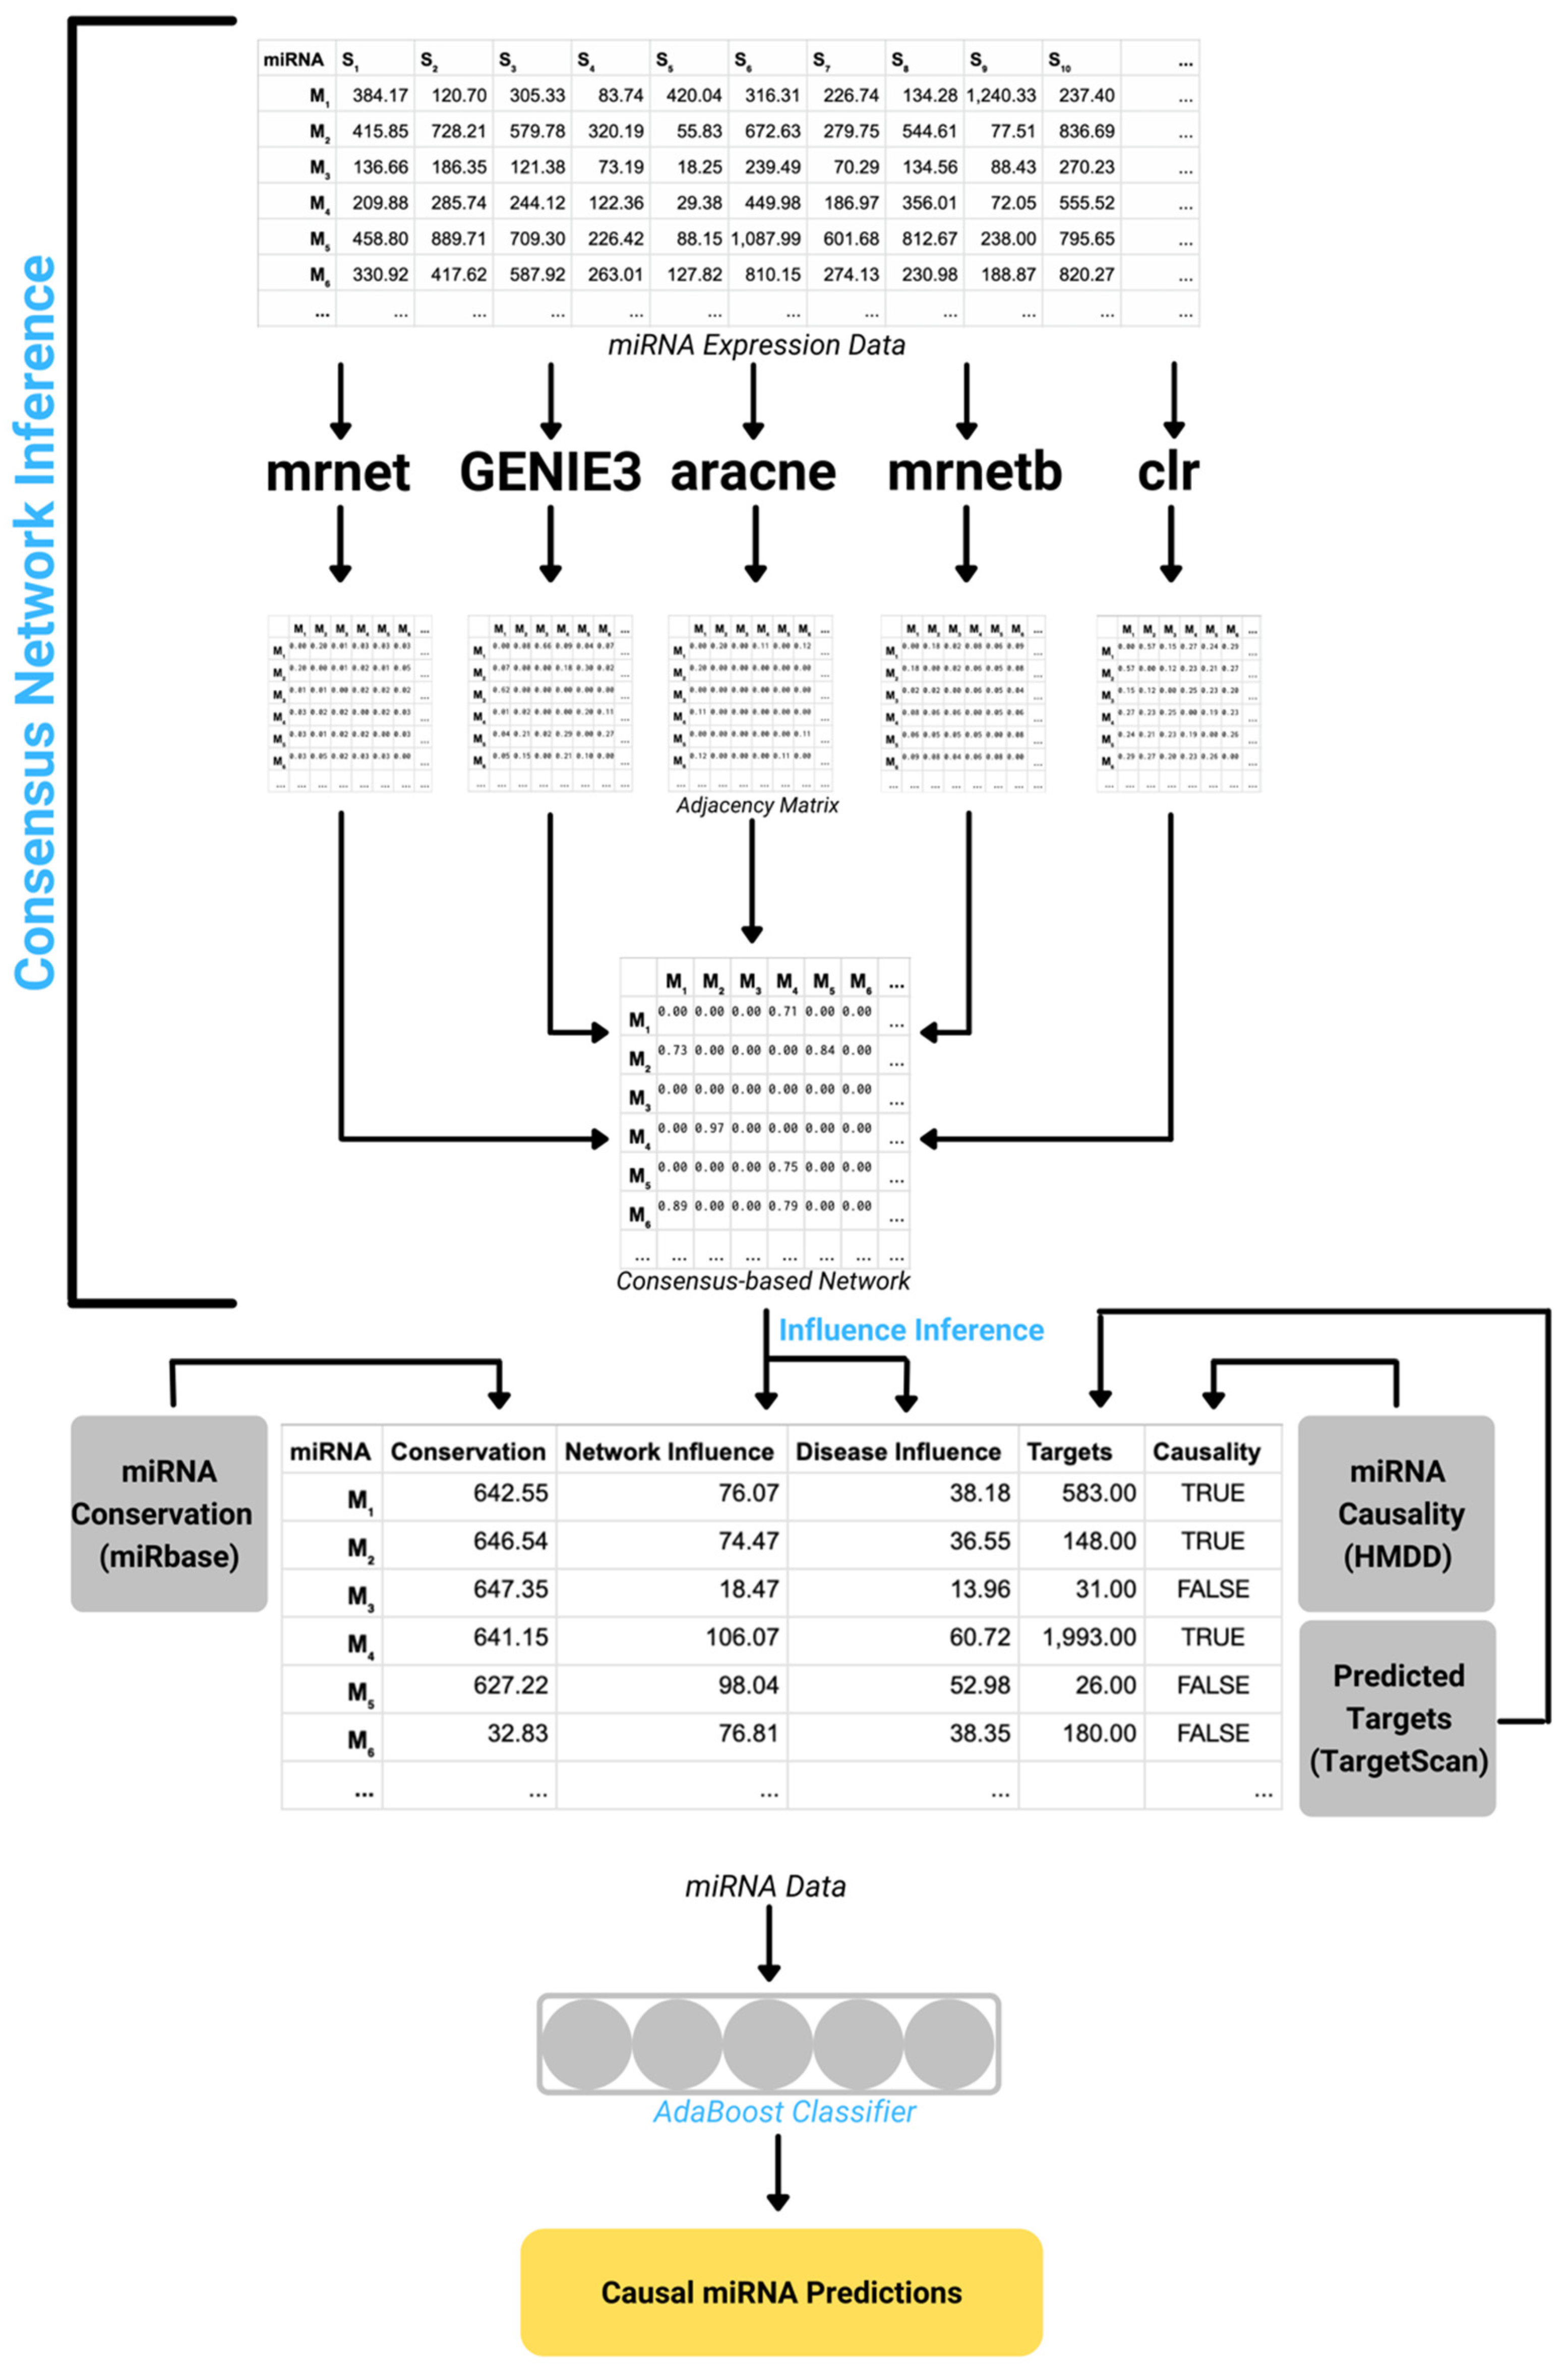
2.2. DisiMiR Algorithm Outline
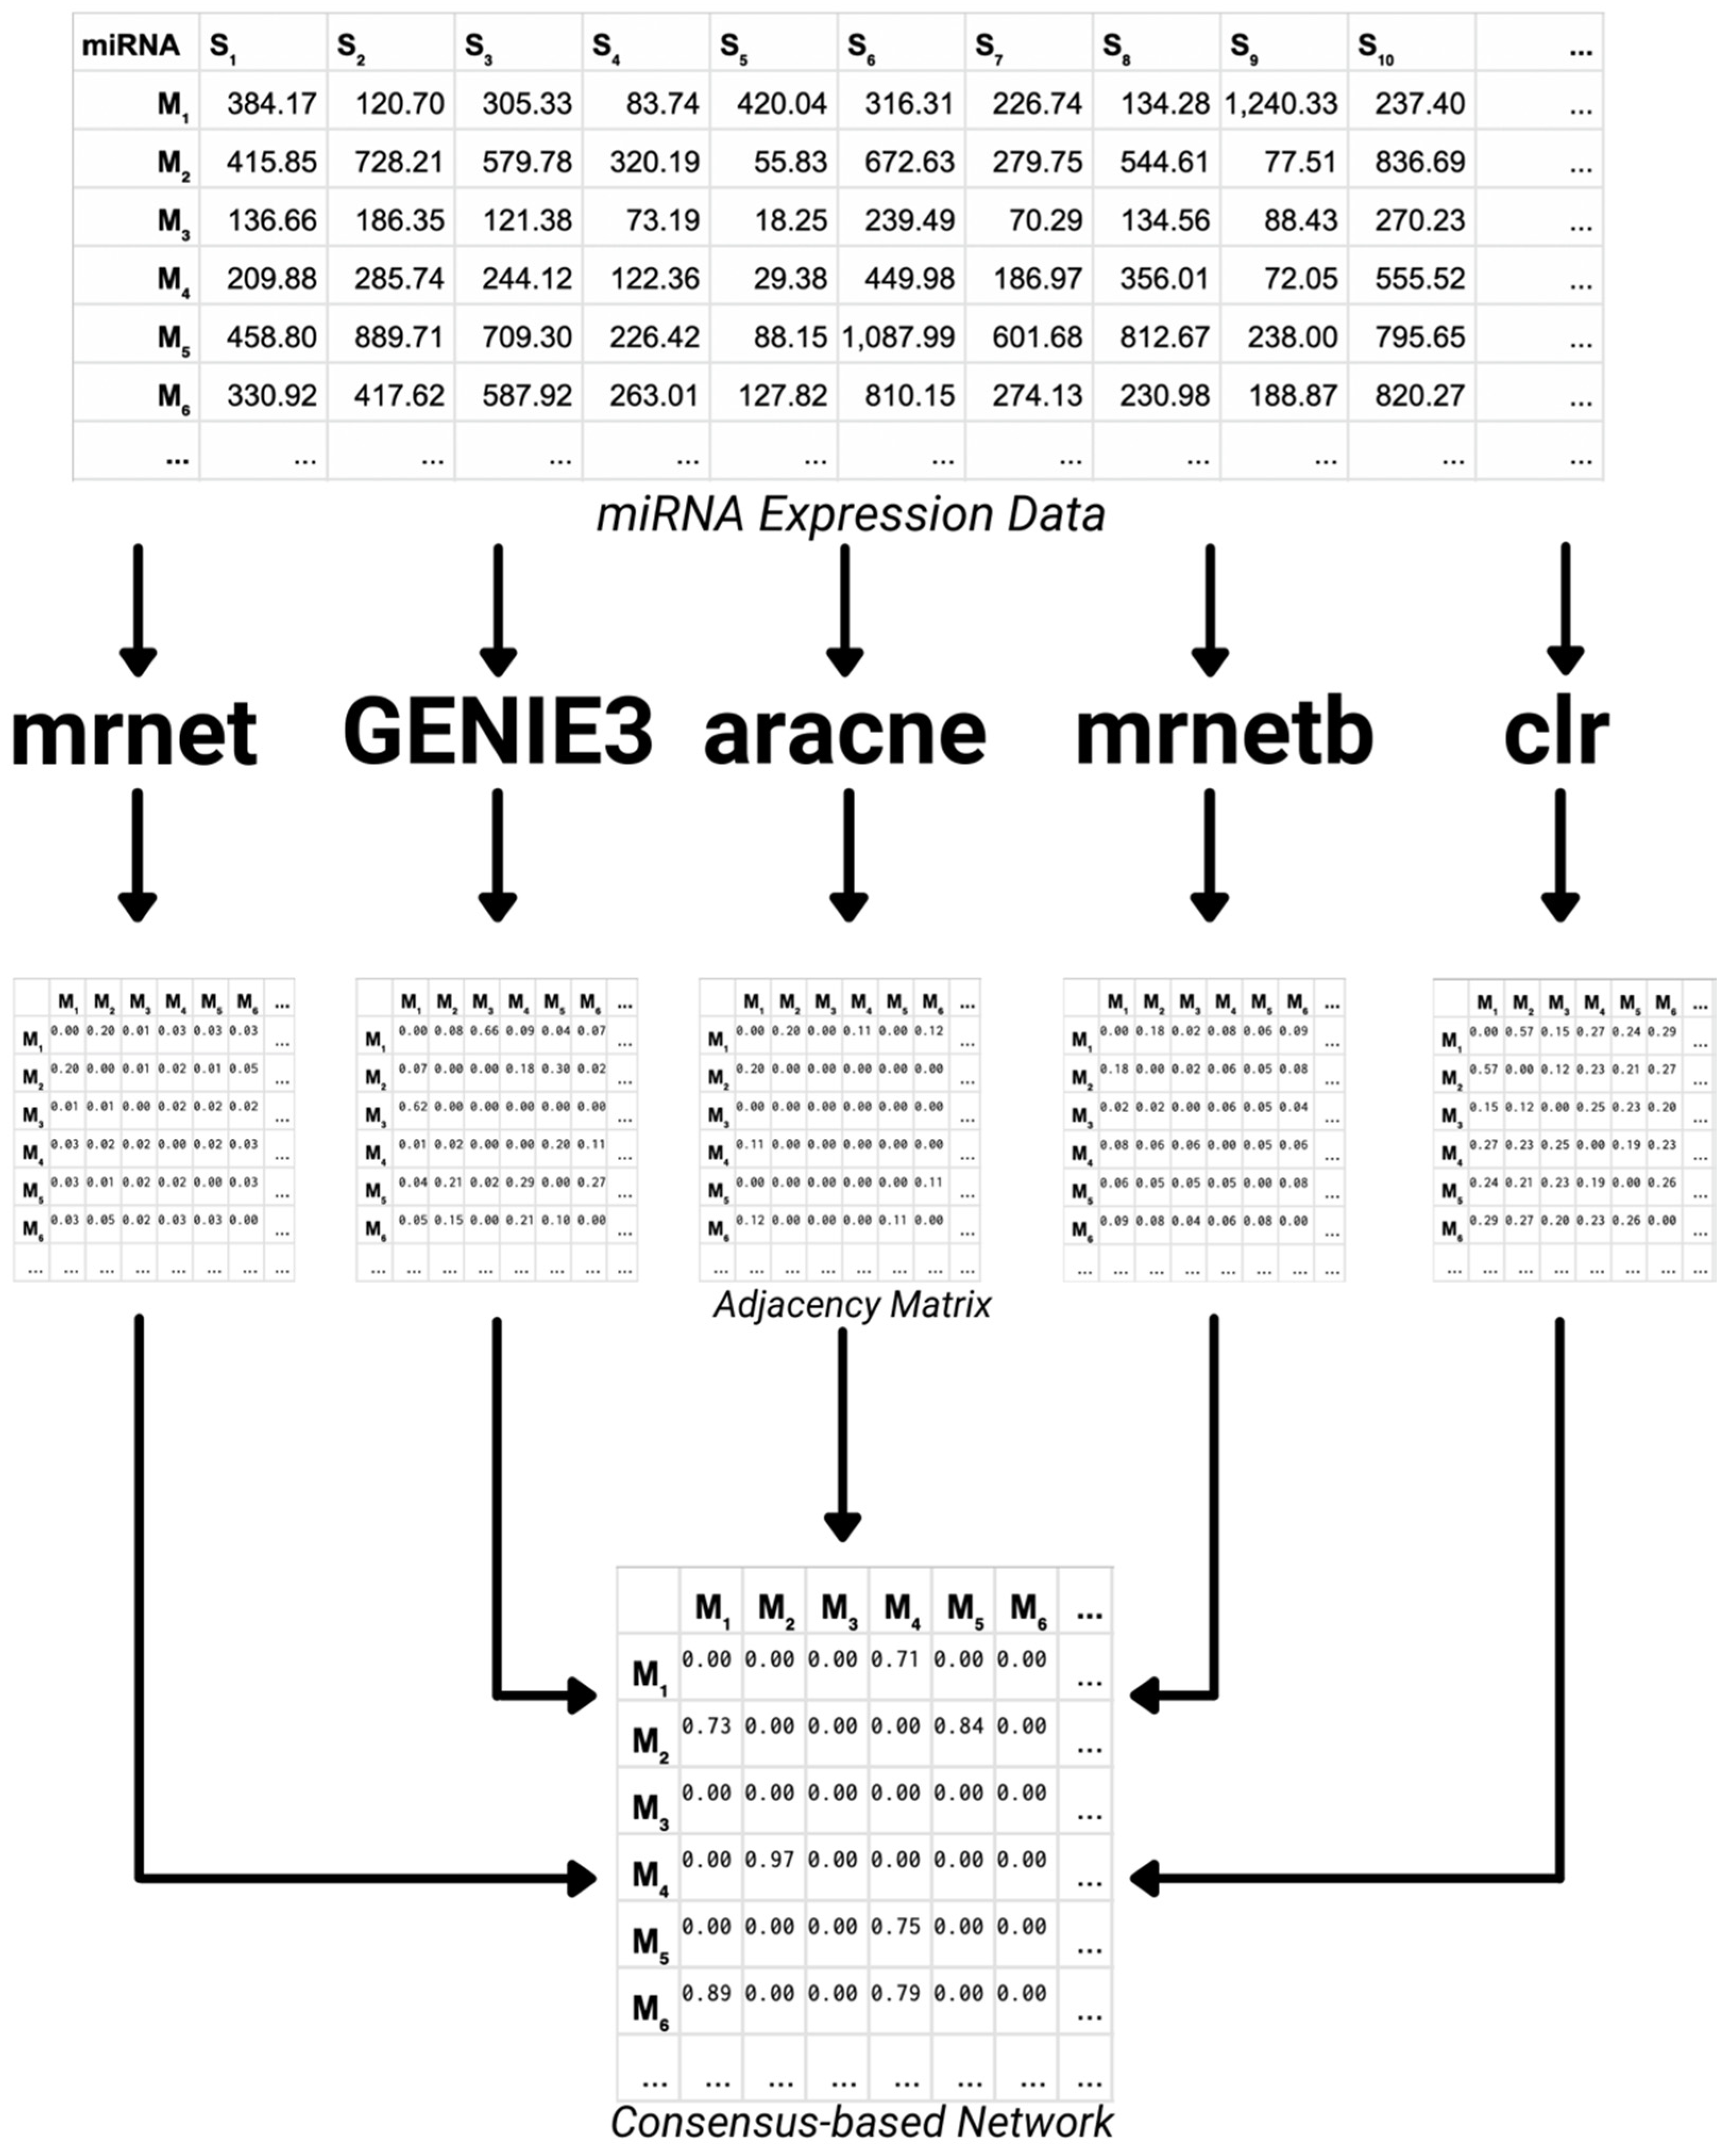
- Consensus-based Network Inference
- Influence Inference
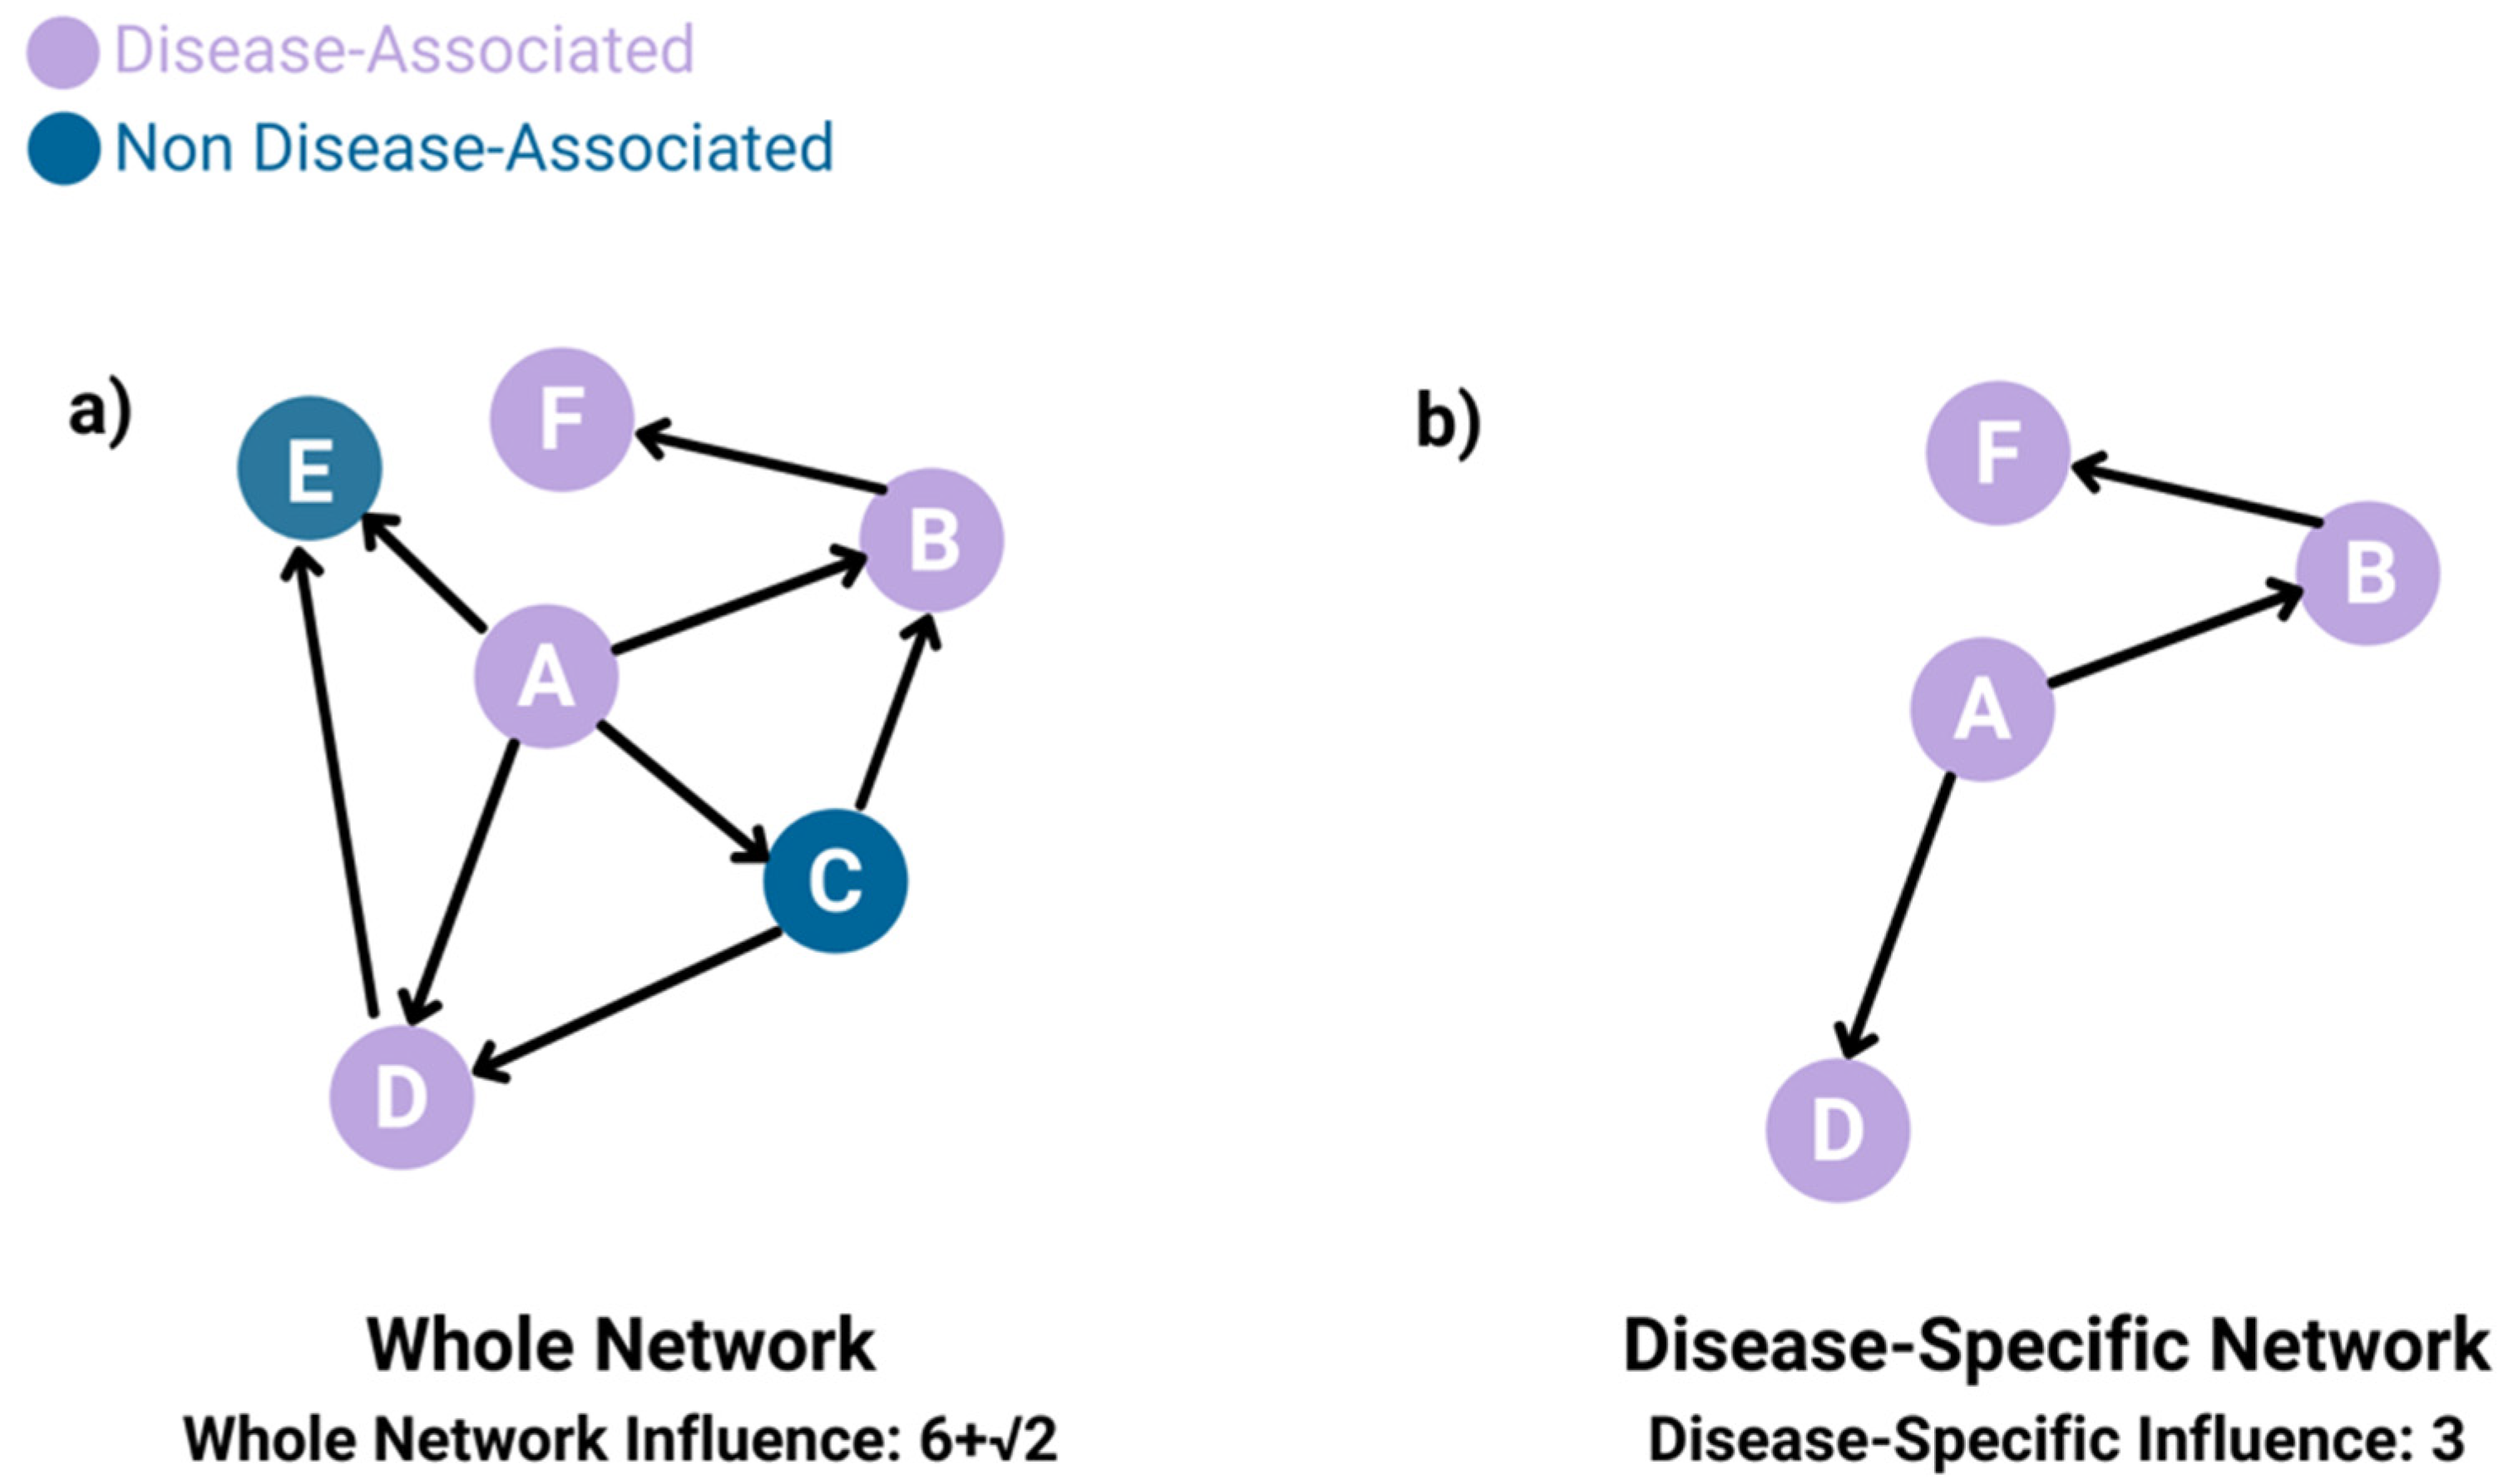
- Whole-network influence
- Disease-specific influence
- miRNA Conservation
- mRNA Target Information
- Causal miRNA Prediction
- AdaBoost Model
- Performance Evaluation
- Validation of False Positive miRNAs using Recent Literature
2.2.1. Consensus-Based Network Inference
2.2.2. Influence Inference
| Algorithm 1: Influence Inference I(). |
| #For every miRNA for m in V: Cm = 0 #Add the immediate influence of all the miRNAs in a miRNA’s reachable network for m’ in V’: Cm + = nm’^(1/d) end for end for V = all miRNAs m = a given miRNA V’ = all the miRNAs in the reachable network of m m’ = a given miRNA in the reachable network of m Cm = the influence of m nm’ = the number of children m’ has d = (the length of the shortest path from m’ to m) + 1 |
2.2.3. miRNA Conservation
| Algorithm 2: Sequence Similarity S(). |
| #For every miRNA for m in V: Sm = 0 #Add the immediate influence of all the miRNAs in a miRNA’s reachable network for m’ in F: Sm + = (length(m) − lev(m, m’))/length (m) end for end for V = all miRNA sequences m = a given miRNA sequence F = the miRNA family of m m’ = a given miRNA sequence in F Sm = the similarity between m and all other sequences m’ in F lev(a, b) = returns the Levenshtein distance between String a and String b length (a) = returns the length of String a |
2.2.4. mRNA Target Information
2.2.5. Causal miRNA Prediction
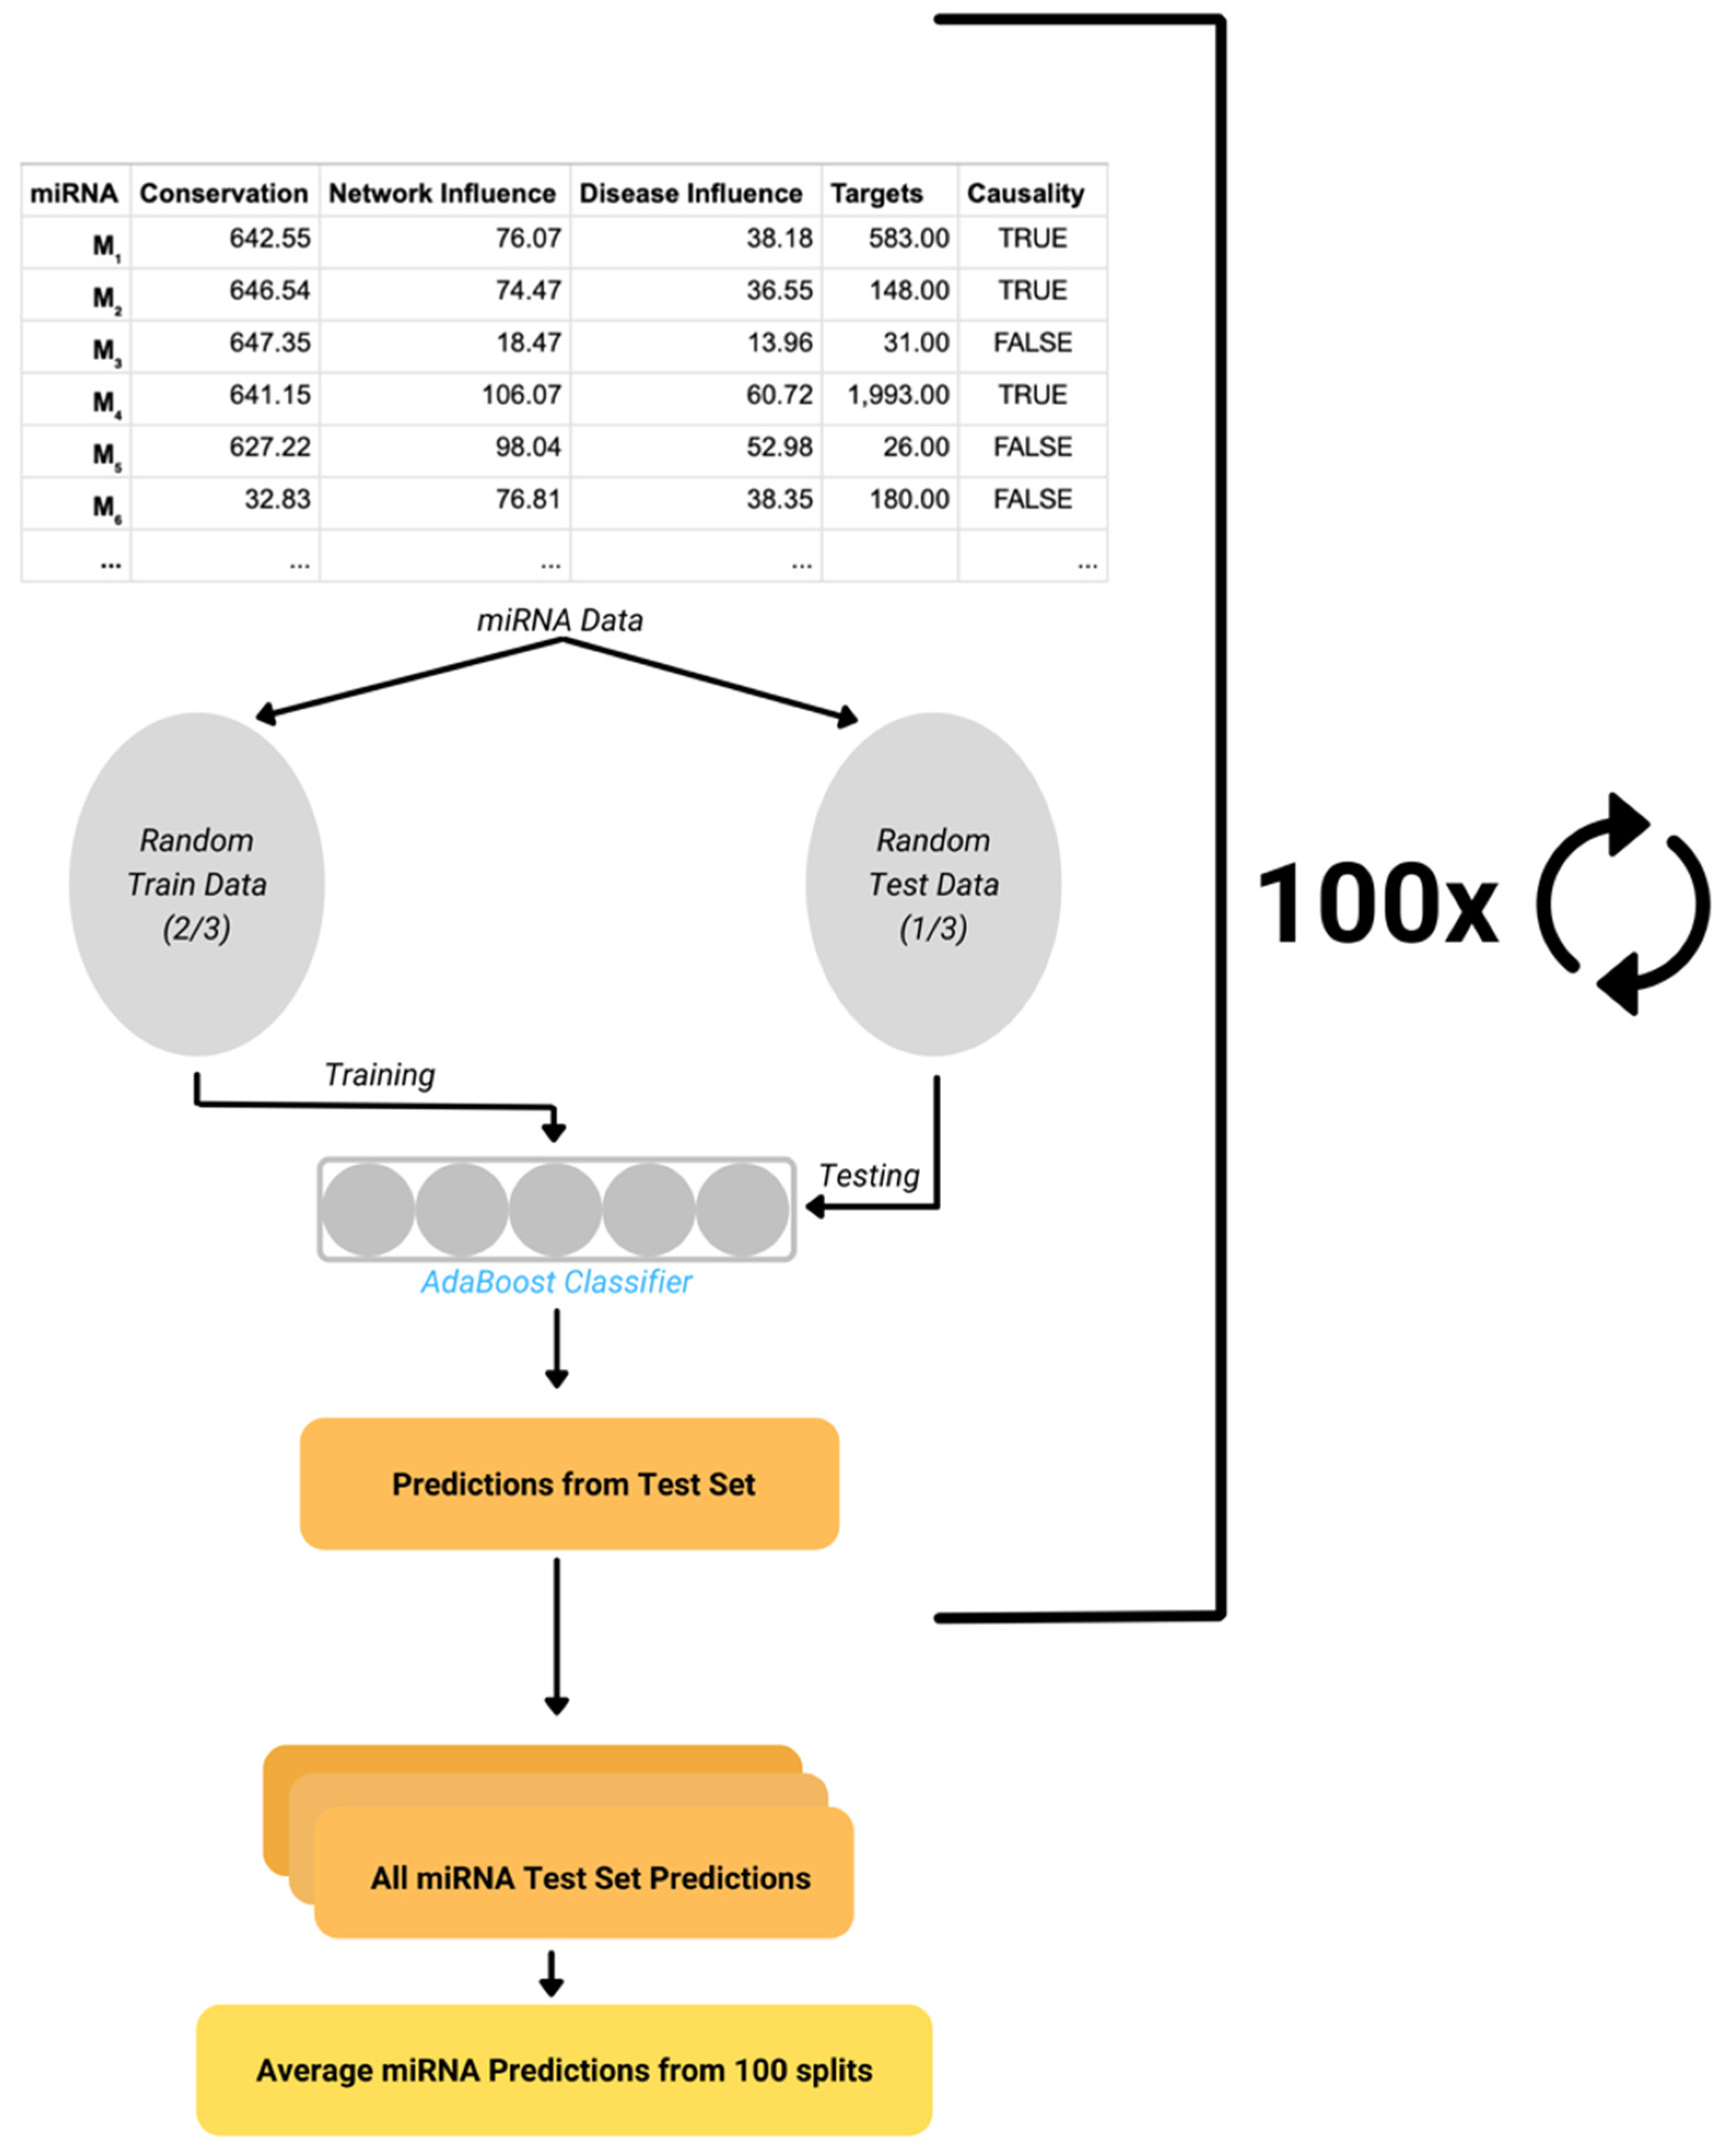
AdaBoost Model
Performance Evaluation
Validation of False Positive miRNAs Using Recent Literature
3. Data
3.1. MiRNA Expression Datasets
3.2. HMDD
4. Results
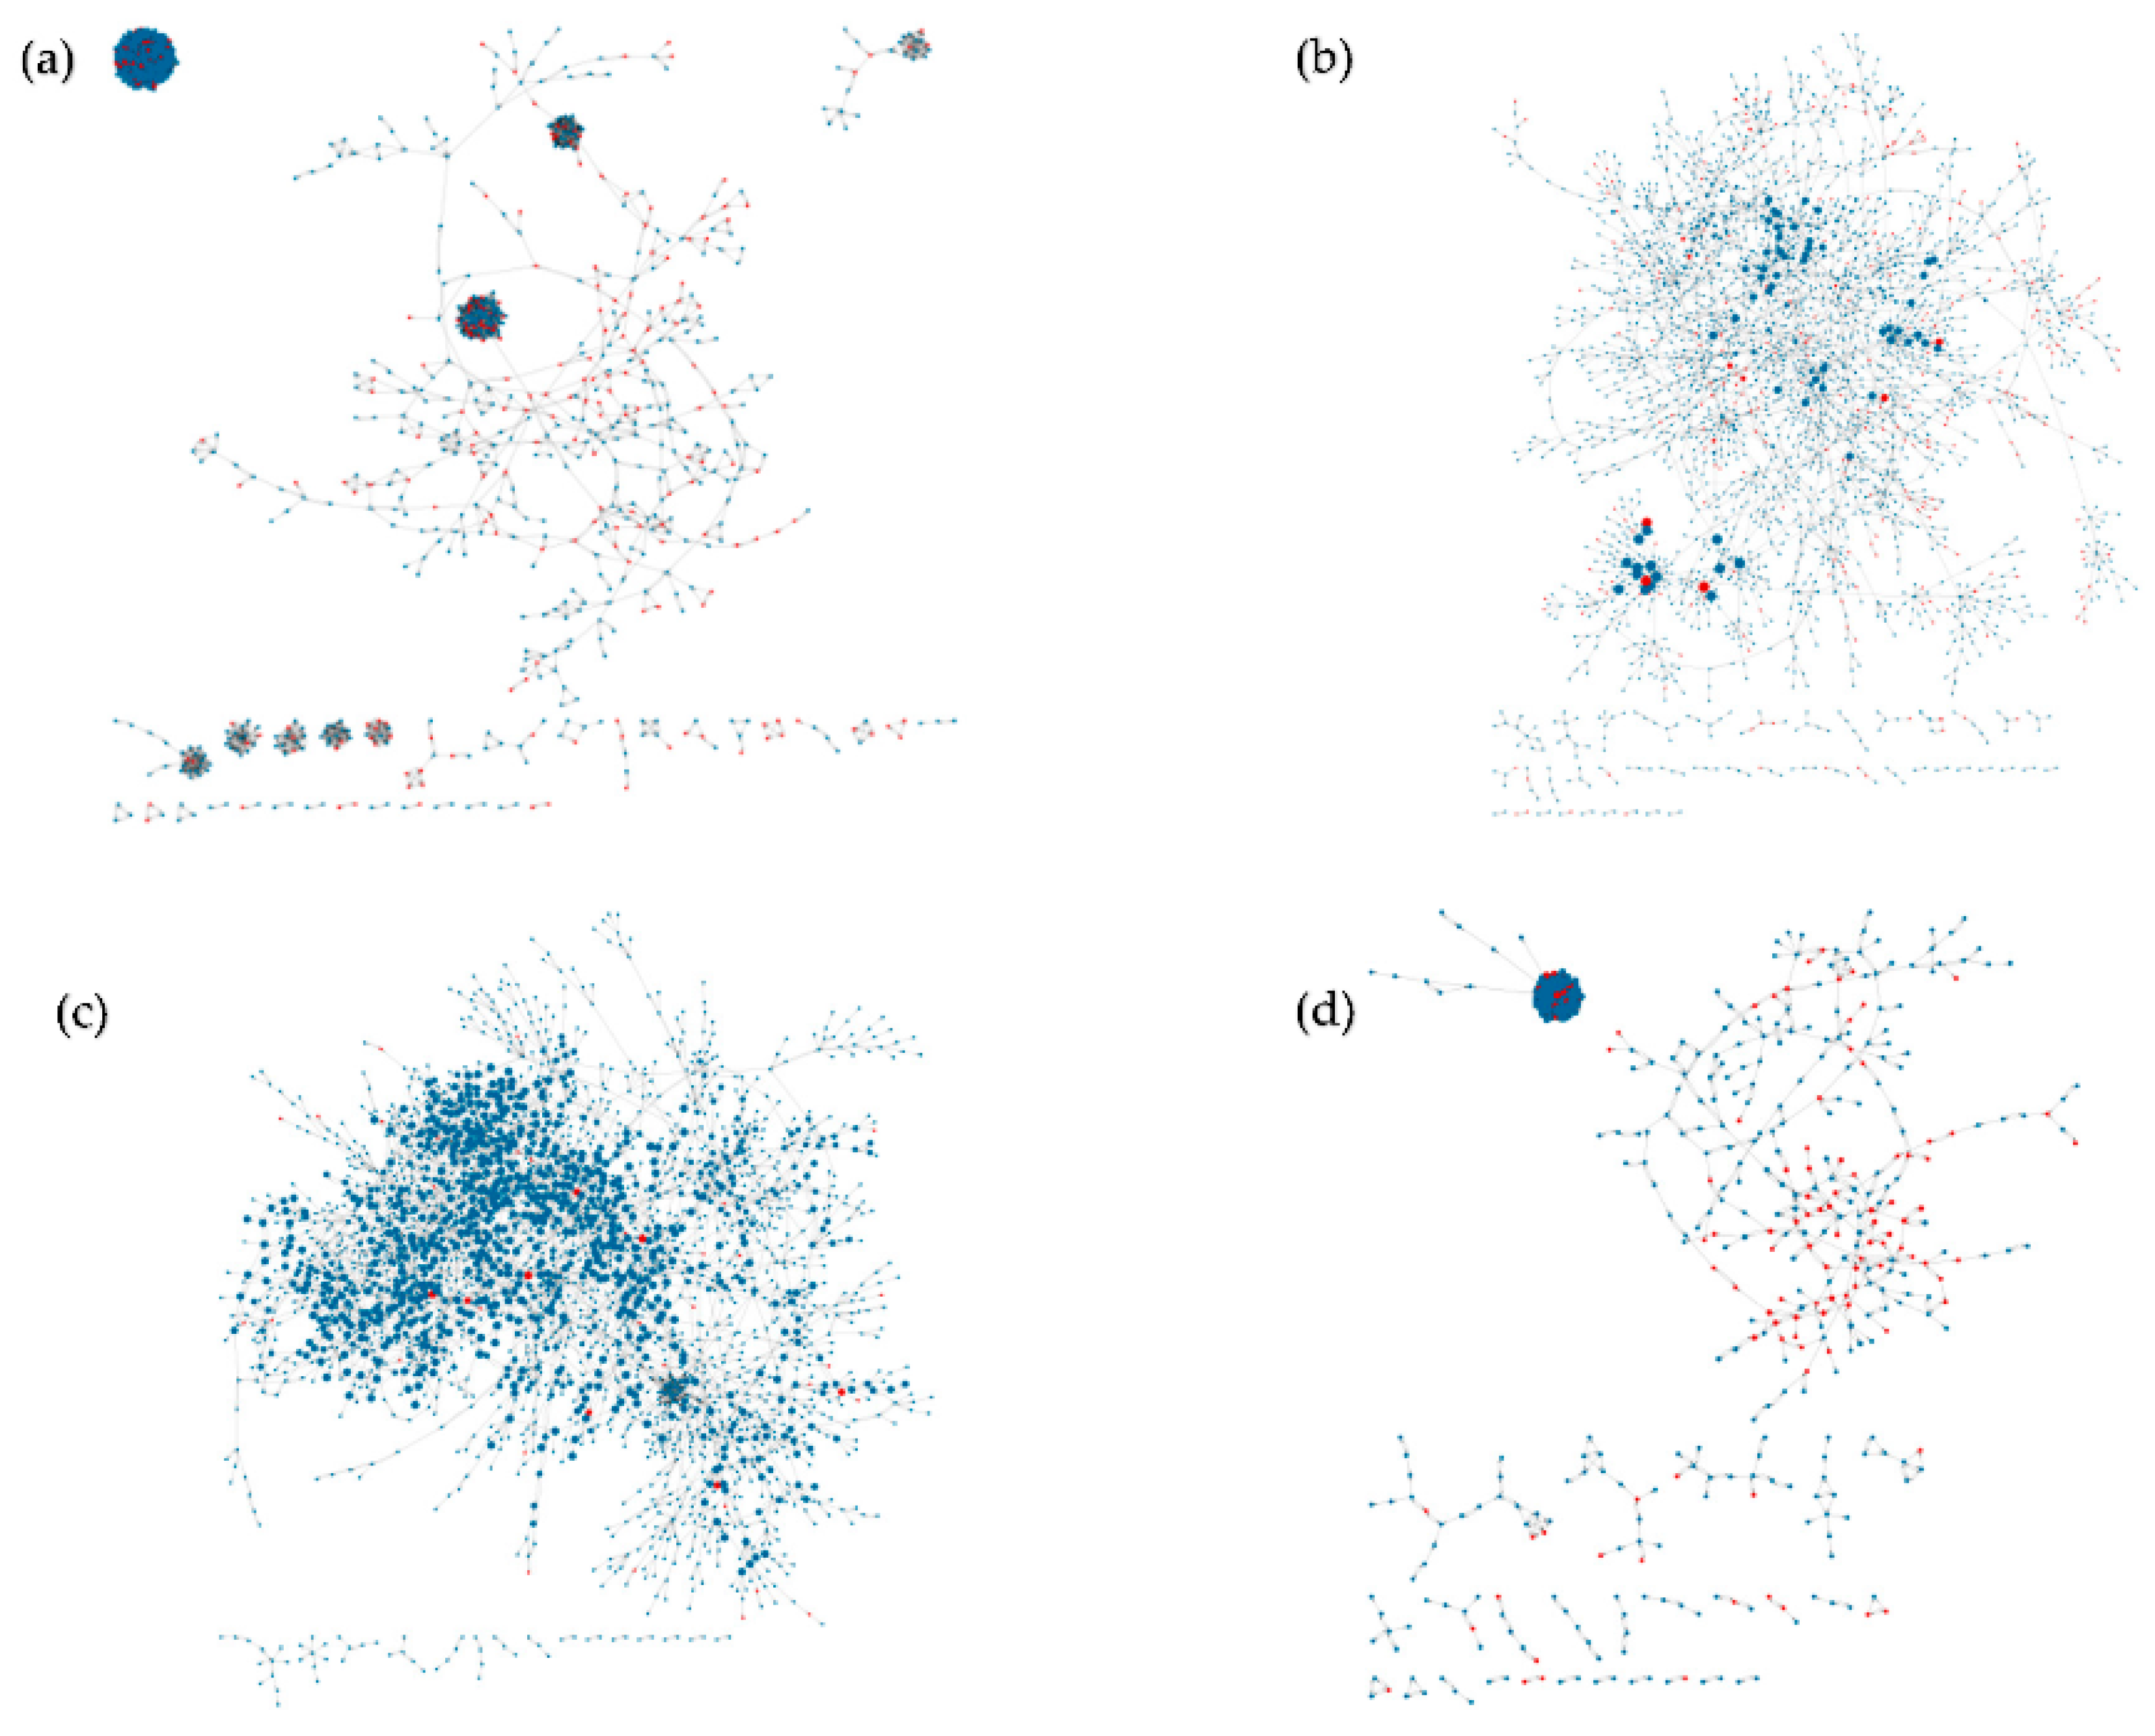
4.1. Inferred Networks
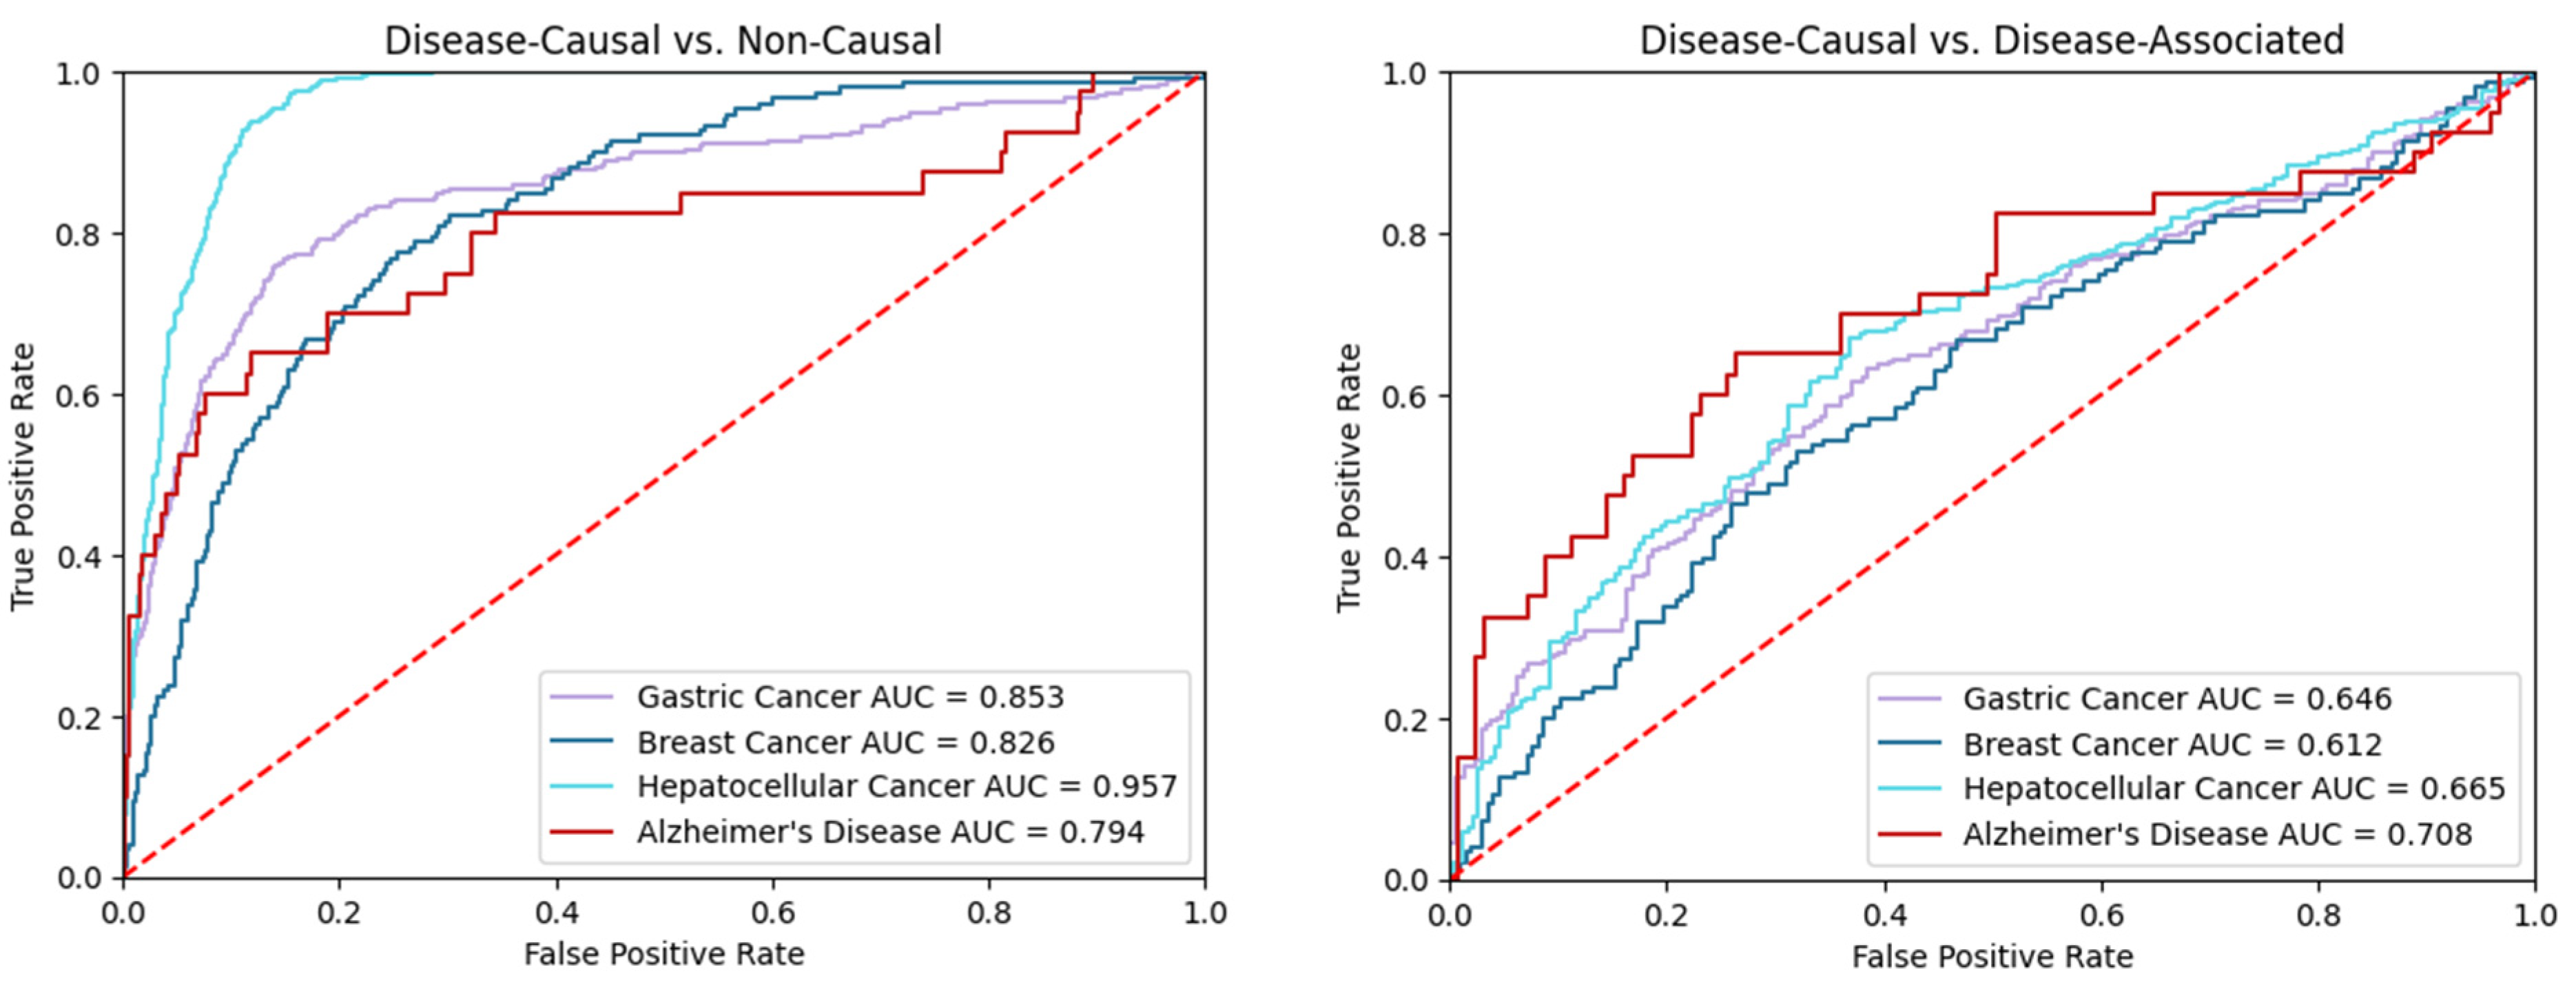
4.2. Validation
4.3. Hypothesis Generation with DisiMiR
5. Discussion
Supplementary Materials
Author Contributions
Funding
Institutional Review Board Statement
Informed Consent Statement
Data Availability Statement
Code Availability
Acknowledgments
Conflicts of Interest
References
- Ardekani, A.M.; Naeini, M.M. The Role of MicroRNAs in Human Diseases. Avicenna J. Med. Biotechnol. 2010, 2, 161–179. [Google Scholar] [PubMed]
- Schmidt, M.F. Drug target miRNAs: Chances and challenges. Trends Biotechnol. 2014, 32, 578–585. [Google Scholar] [CrossRef] [PubMed]
- Berindan-Neagoe, I.; Monroig, P.D.C.; Pasculli, B.; Calin, G.A. MicroRNAome genome: A treasure for cancer diagnosis and therapy. CA A Cancer J. Clin. 2014, 64, 311–336. [Google Scholar] [CrossRef] [PubMed]
- Abdellatif, M. Differential Expression of MicroRNAs in Different Disease States. Circ. Res. 2012, 110, 638–650. [Google Scholar] [CrossRef] [Green Version]
- Doyle, A.; McGarry, M.P.; Lee, N.A.; Lee, J.J. The construction of transgenic and gene knockout/knockin mouse models of human disease. Transgenic Res. 2011, 21, 327–349. [Google Scholar] [CrossRef] [Green Version]
- Li, Y.; Kowdley, K.V. MicroRNAs in common human diseases. Genom. Proteom. Bioinform. 2021, 10, 246–253. [Google Scholar] [CrossRef] [Green Version]
- Nalluri, J.J.; Rana, P.; Barh, D.; Azevedo, V.; Dinh, T.N.; Vladimirov, V.; Ghosh, P. Determining causal miRNAs and their signaling cascade in diseases using an influence diffusion model. Sci. Rep. 2017, 7, 8133. [Google Scholar] [CrossRef] [Green Version]
- Lee, C.-T.; Risom, T.; Strauss, W.M. Evolutionary conservation of microRNA regulatory circuits: An examination of mi-croRNA gene complexity and conserved microRNA-target interactions through metazoan phylogeny. DNA Cell Biol. 2007, 26, 209–218. [Google Scholar] [CrossRef]
- Huang, Z.; Shi, J.; Gao, Y.; Cui, C.; Zhang, S.; Li, J.; Zhou, Y.; Cui, Q. HMDD v3.0: A database for experimentally supported human microRNA-disease associations. Nucleic Acids Res. 2019, 47, D1013–D1017. [Google Scholar] [CrossRef] [Green Version]
- Nalluri, J.J.; Barh, D.; Azevedo, V.; Ghosh, P. miRsig: A consensus-based network inference methodology to identify pan-cancer miRNA-miRNA interaction signatures. Sci. Rep. 2017, 7, 39684. [Google Scholar] [CrossRef] [Green Version]
- Li, J.; Han, X.; Wan, Y.; Zhang, S.; Zhao, Y.; Fan, R.; Cui, Q.; Zhou, Y. TAM 2.0: Tool for MicroRNA set analysis. Nucleic Acids Res. 2018, 46, W180–W185. [Google Scholar] [CrossRef] [PubMed] [Green Version]
- Gao, Y.; Jia, K.; Shi, J.; Zhou, Y.; Cui, Q. A Computational Model to Predict the Causal miRNAs for Diseases. Front. Genet. 2019, 10, 935. [Google Scholar] [CrossRef] [PubMed] [Green Version]
- Chen, X.; Xie, D.; Zhao, Q.; You, Z. MicroRNAs and complex diseases: From experimental results to computational models. Brief. Bioinform. 2017, 20, 515–539. [Google Scholar] [CrossRef] [PubMed]
- Huang, Z.; Liu, L.; Gao, Y.; Shi, J.; Cui, Q.; Li, J.; Zhou, Y. Benchmark of computational methods for predicting microRNA-disease associations. Genome Biol. 2019, 20, 202. [Google Scholar] [CrossRef]
- Huang, Z.; Han, Y.; Liu, L.; Cui, Q.; Zhou, Y. LE-MDCAP: A Computational Model to Prioritize Causal miRNA-Disease Associations. Int. J. Mol. Sci. 2021, 22, 13607. [Google Scholar] [CrossRef]
- Faith, J.J.; Hayete, B.; Thaden, J.T.; Mogno, I.; Wierzbowski, J.; Cottarel, G.; Kasif, S.; Collins, J.J.; Gardner, T.S. Large-Scale Mapping and Validation of Escherichia coli Transcriptional Regulation from a Compendium of Expression Profiles. PLoS Biol. 2007, 5, e8. [Google Scholar] [CrossRef]
- Roth, P.C.; Arnold, D.C.; Miller, B.P. MRNet: A Software-Based Multicast/Reduction Network for Scalable Tools. In Proceedings of the SC ‘03: Proceedings of the 2003 ACM/IEEE Conference on Supercomputing, Phoenix, AZ, USA, 15–21 November 2003; pp. 1–20. [Google Scholar] [CrossRef]
- Meyer, P.E.; Marbach, D.; Roy, S.; Kellis, M. Information-Theoretic Inference of Gene Networks Using Backward Elimination; BioComp: Fredericton, NB, Canada, 2010. [Google Scholar]
- Margolin, A.A.; Nemenman, I.; Basso, K.; Wiggins, C.; Stolovitzky, G.; Favera, R.D.; Califano, A. ARACNE: An algorithm for the reconstruction of gene regulatory networks in a mammalian cellular context. BMC Bioinform. 2006, 7, S7. [Google Scholar] [CrossRef] [Green Version]
- Huynh-Thu, V.A.; Irrthum, A.; Wehenkel, L.; Geurts, P. Inferring Regulatory Networks from Expression Data Using Tree-Based Methods. PLoS ONE 2010, 5, e12776. [Google Scholar] [CrossRef]
- Meyer, P.E.; Lafitte, F.; Bontempi, G. minet: AR/Bioconductor Package for Inferring Large Transcriptional Networks Using Mutual Information. BMC Bioinform. 2008, 9, 461. [Google Scholar] [CrossRef]
- Aibar, S.; González-Blas, C.B.; Moerman, T.; Huynh-Thu, V.A.; Imrichova, H.; Hulselmans, G.; Rambow, F.; Marine, J.-C.; Geurts, P.; Aerts, J.; et al. SCENIC: Single-cell regulatory network inference and clustering. Nat. Methods 2017, 14, 1083–1086. [Google Scholar] [CrossRef] [Green Version]
- Kozomara, A.; Birgaoanu, M.; Griffiths-Jones, S. miRBase: From microRNA sequences to function. Nucleic Acids Res. 2019, 47, D155–D162. [Google Scholar] [CrossRef] [PubMed]
- Lim, L.P.; Lau, N.; Garrett-Engele, P.; Grimson, A.; Schelter, J.M.; Castle, J.; Bartel, D.P.; Linsley, P.S.; Johnson, J.M. Microarray analysis shows that some microRNAs downregulate large numbers of target mRNAs. Nature 2005, 433, 769–773. [Google Scholar] [CrossRef] [PubMed]
- McGeary, S.E.; Lin, K.S.; Shi, C.Y.; Pham, T.M.; Bisaria, N.; Kelley, G.M.; Bartel, D.P. The biochemical basis of microRNA targeting efficacy. Science 2019, 366, eaav1741. [Google Scholar] [CrossRef] [PubMed]
- Freund, Y.; Schapire, R.E. A Decision-Theoretic Generalization of On-Line Learning and an Application to Boosting. J. Comput. Syst. Sci. 1997, 55, 119–139. [Google Scholar] [CrossRef] [Green Version]
- Clough, E.; Barrett, T. The Gene Expression Omnibus Database. In Statistical Genomics; Springer: New York, NY, USA, 2016; pp. 93–110. [Google Scholar]
- Kunc, M.; Popęda, M.; Niemira, M.; Szałkowska, A.; Bieńkowski, M.; Pęksa, R.; Łacko, A.; Radecka, B.S.; Braun, M.; Pikiel, J.; et al. microRNA Expression Profile in Single Hormone Receptor-Positive Breast Cancers is Mainly Dependent on HER2 Status—A Pilot Study. Diagnostics 2020, 10, 617. [Google Scholar] [CrossRef] [PubMed]
- Shigemizu, D.; Akiyama, S.; Higaki, S.; Sugimoto, T.; Sakurai, T.; Boroevich, K.A.; Sharma, A.; Tsunoda, T.; Ochiya, T.; Niida, S.; et al. Prognosis prediction model for conversion from mild cognitive impairment to Alzheimer’s disease created by integrative analysis of multi-omics data. Alzheimer’s Res. Ther. 2020, 12, 145. [Google Scholar] [CrossRef]
- Abe, S.; Matsuzaki, J.; Sudo, K.; Oda, I.; Katai, H.; Kato, K.; Takizawa, S.; Sakamoto, H.; Takeshita, F.; Niida, S.; et al. A novel combination of serum microRNAs for the detection of early gastric cancer. Gastric Cancer 2021, 24, 835–843. [Google Scholar] [CrossRef]
- Zhu, H.R.; Yu, X.N.; Zhang, G.C.; Shi, X.; Bilegsaikhan, E.; Guo, H.Y.; Liu, L.L.; Cai, Y.; Song, G.Q.; Liu, T.T. Comprehensive analysis of long non coding RNA messenger RNA microRNA co expression network identi-fies cell cycle related lncRNA in hepatocellular carcinoma. Int. J. Mol. Med. 2019, 44, 1844–1854. [Google Scholar]
- Peng, Y.; Croce, C.M. The role of MicroRNAs in human cancer. Signal Transduct. Target. Ther. 2016, 1, 15004. [Google Scholar] [CrossRef] [Green Version]
- Swarbrick, S.; Wragg, N.; Ghosh, S.; Stolzing, A. Systematic Review of miRNA as Biomarkers in Alzheimer’s Disease. Mol. Neurobiol. 2019, 56, 6156–6167. [Google Scholar] [CrossRef] [Green Version]


| HMDD Disease Name | Expression Profiling Method | Tissue Type | Number of Samples | Disease Causal | Disease Associated | Disease Irrelevant | Number of miRNAs | GEO Accession Number | Citation |
|---|---|---|---|---|---|---|---|---|---|
| Breast Neoplasms | NanoString nCounter Human v3 miRNA Expression Assay | Breast Cancer Tissue | 32 | 151 | 348 | 480 | 828 | GSE155362 | Kunc, M. et al. [28] |
| Alzheimer’s Disease | 3D-Gene Human miRNA V21 spotted oligonucleotide array | Serum | 197 | 40 | 165 | 2356 | 2521 | GSE150693 | Shigemizu, D. et al. [29] |
| Gastric Neoplasms | 3D-Gene Human miRNA V21 spotted oligonucleotide microarray | Serum | 1423 | 270 | 478 | 2046 | 2524 | GSE164174 | Abe, S. et al. [30] |
| Carcinoma, Hepatocellular | Agilent Human miRNA Microarray | Liver Cancer Tissue | 7 | 395 | 636 | 1933 | 2569 | GSE108724 | Zhu, H.-R. et al. [31] |
| Disease | AUC | Disease Causal Accuracy | Feature Importance | ||||||
|---|---|---|---|---|---|---|---|---|---|
| True Negative | False Positive | False Negative | True Positive | Disease Influence | Network Influence | miRNA Conservation | Number of Targets | ||
| Breast Cancer | 0.826 | 647 | 30 | 115 | 36 | 0.121 | 0.197 | 0.386 | 0.297 |
| Alzheimer’s Disease | 0.794 | 2473 | 8 | 34 | 6 | 0.007 | 0.115 | 0.506 | 0.372 |
| Hepatocellular Cancer | 0.957 | 1999 | 175 | 71 | 324 | 0.183 | 0.197 | 0.379 | 0.241 |
| Gastric Cancer | 0.853 | 2236 | 18 | 200 | 70 | 0.040 | 0.187 | 0.371 | 0.403 |
| Disease | Number of Causal miRNAs | Number of Non-Causal miRNAs Mentioned in Literature without Causal Evidence | Percent Causal miRNAs | Number of miRNAs Unmentioned in Disease Literature | Total False Positives |
|---|---|---|---|---|---|
| Breast Cancer | 24 | 5 | 82.8% | 1 | 33 |
| Gastric Cancer | 14 | 4 | 77.8% | 0 | 18 |
| Hepatocellular Cancer | 121 | 33 | 78.6% | 21 | 155 |
| Alzheimer’s Disease | 1 | 2 | 33.3% | 5 | 33 |
Publisher’s Note: MDPI stays neutral with regard to jurisdictional claims in published maps and institutional affiliations. |
© 2022 by the authors. Licensee MDPI, Basel, Switzerland. This article is an open access article distributed under the terms and conditions of the Creative Commons Attribution (CC BY) license (https://creativecommons.org/licenses/by/4.0/).
Share and Cite
Wang, K.R.; McGeachie, M.J. DisiMiR: Predicting Pathogenic miRNAs Using Network Influence and miRNA Conservation. Non-Coding RNA 2022, 8, 45. https://doi.org/10.3390/ncrna8040045
Wang KR, McGeachie MJ. DisiMiR: Predicting Pathogenic miRNAs Using Network Influence and miRNA Conservation. Non-Coding RNA. 2022; 8(4):45. https://doi.org/10.3390/ncrna8040045
Chicago/Turabian StyleWang, Kevin R., and Michael J. McGeachie. 2022. "DisiMiR: Predicting Pathogenic miRNAs Using Network Influence and miRNA Conservation" Non-Coding RNA 8, no. 4: 45. https://doi.org/10.3390/ncrna8040045