1. Introduction
The enteric nervous system (ENS) is a network of neurons and glia in the bowel wall that controls bowel motility [
1], epithelial cell function [
2], and blood flow to the bowel [
3,
4]. The ENS primarily derives from the vagal neural crest [
5], a highly migratory, multipotent cell population. At embryonic day 9.5 (E9.5) in mice, pre-enteric neural crest–derived cells invade the foregut then migrate and proliferate along the fetal bowel until, at E13.5, the bowel is fully colonized [
6]. The enteric neural crest–derived cells (ENCDCs) then separate into two layers of ganglia, the myenteric plexus and the submucosal plexus [
7]. Select ENCDCs stop migrating and differentiate into electrically active neurons by E11.5 [
8], though the ENS continues to develop and mature in utero and postnatally [
9,
10]. The resulting diverse and complex ENS network is essential for survival.
One of the most dramatic failures in ENS development is evidenced in the congenital disorder Hirschsprung disease (HSCR). In HSCR, ENCDCs fail to fully colonize the distal bowel during the first trimester of pregnancy, leading to a lack of enteric neurons at the end of the bowel. The region that lacks the ENS tonically contracts, preventing the passage of intestinal contents. HSCR is characterized by severe constipation, abdominal distention, bilious vomiting, and failure to thrive. Current HSCR treatment is surgical removal of the affected bowel, but bowel inflammation and dysmotility frequently persist after this surgery [
11]. A growing body of literature has linked HSCR to alterations in miRNA expression, suggesting a potential avenue for future research.
In the ENS, miRNAs are essential for progenitor differentiation and cell survival. This was demonstrated using
Wnt1-cre; Dicerfl/fl mice, where deletion of
Dicer (an essential miRNA processing enzyme) blocks miRNA biogenesis. Although ENCDCs in
Wnt1-cre; Dicerfl/fl mice colonize the bowel normally by E13,
Wnt1-cre; Dicerfl/fl ENCDCs almost completely disappear by E17 [
12]. In contrast, in WT mice, ENCDCs complete bowel colonization by E13.5, separate into nascent myenteric and submucosal plexuses, and begin differentiating into mature neurons between E13 and E17. While the ENCDCs in
Wnt1-cre; Dicerfl/fl mice are likely lost as a result of mass apoptosis [
13], these experiments suggest a window of time when miRNAs are essential for ENS development.
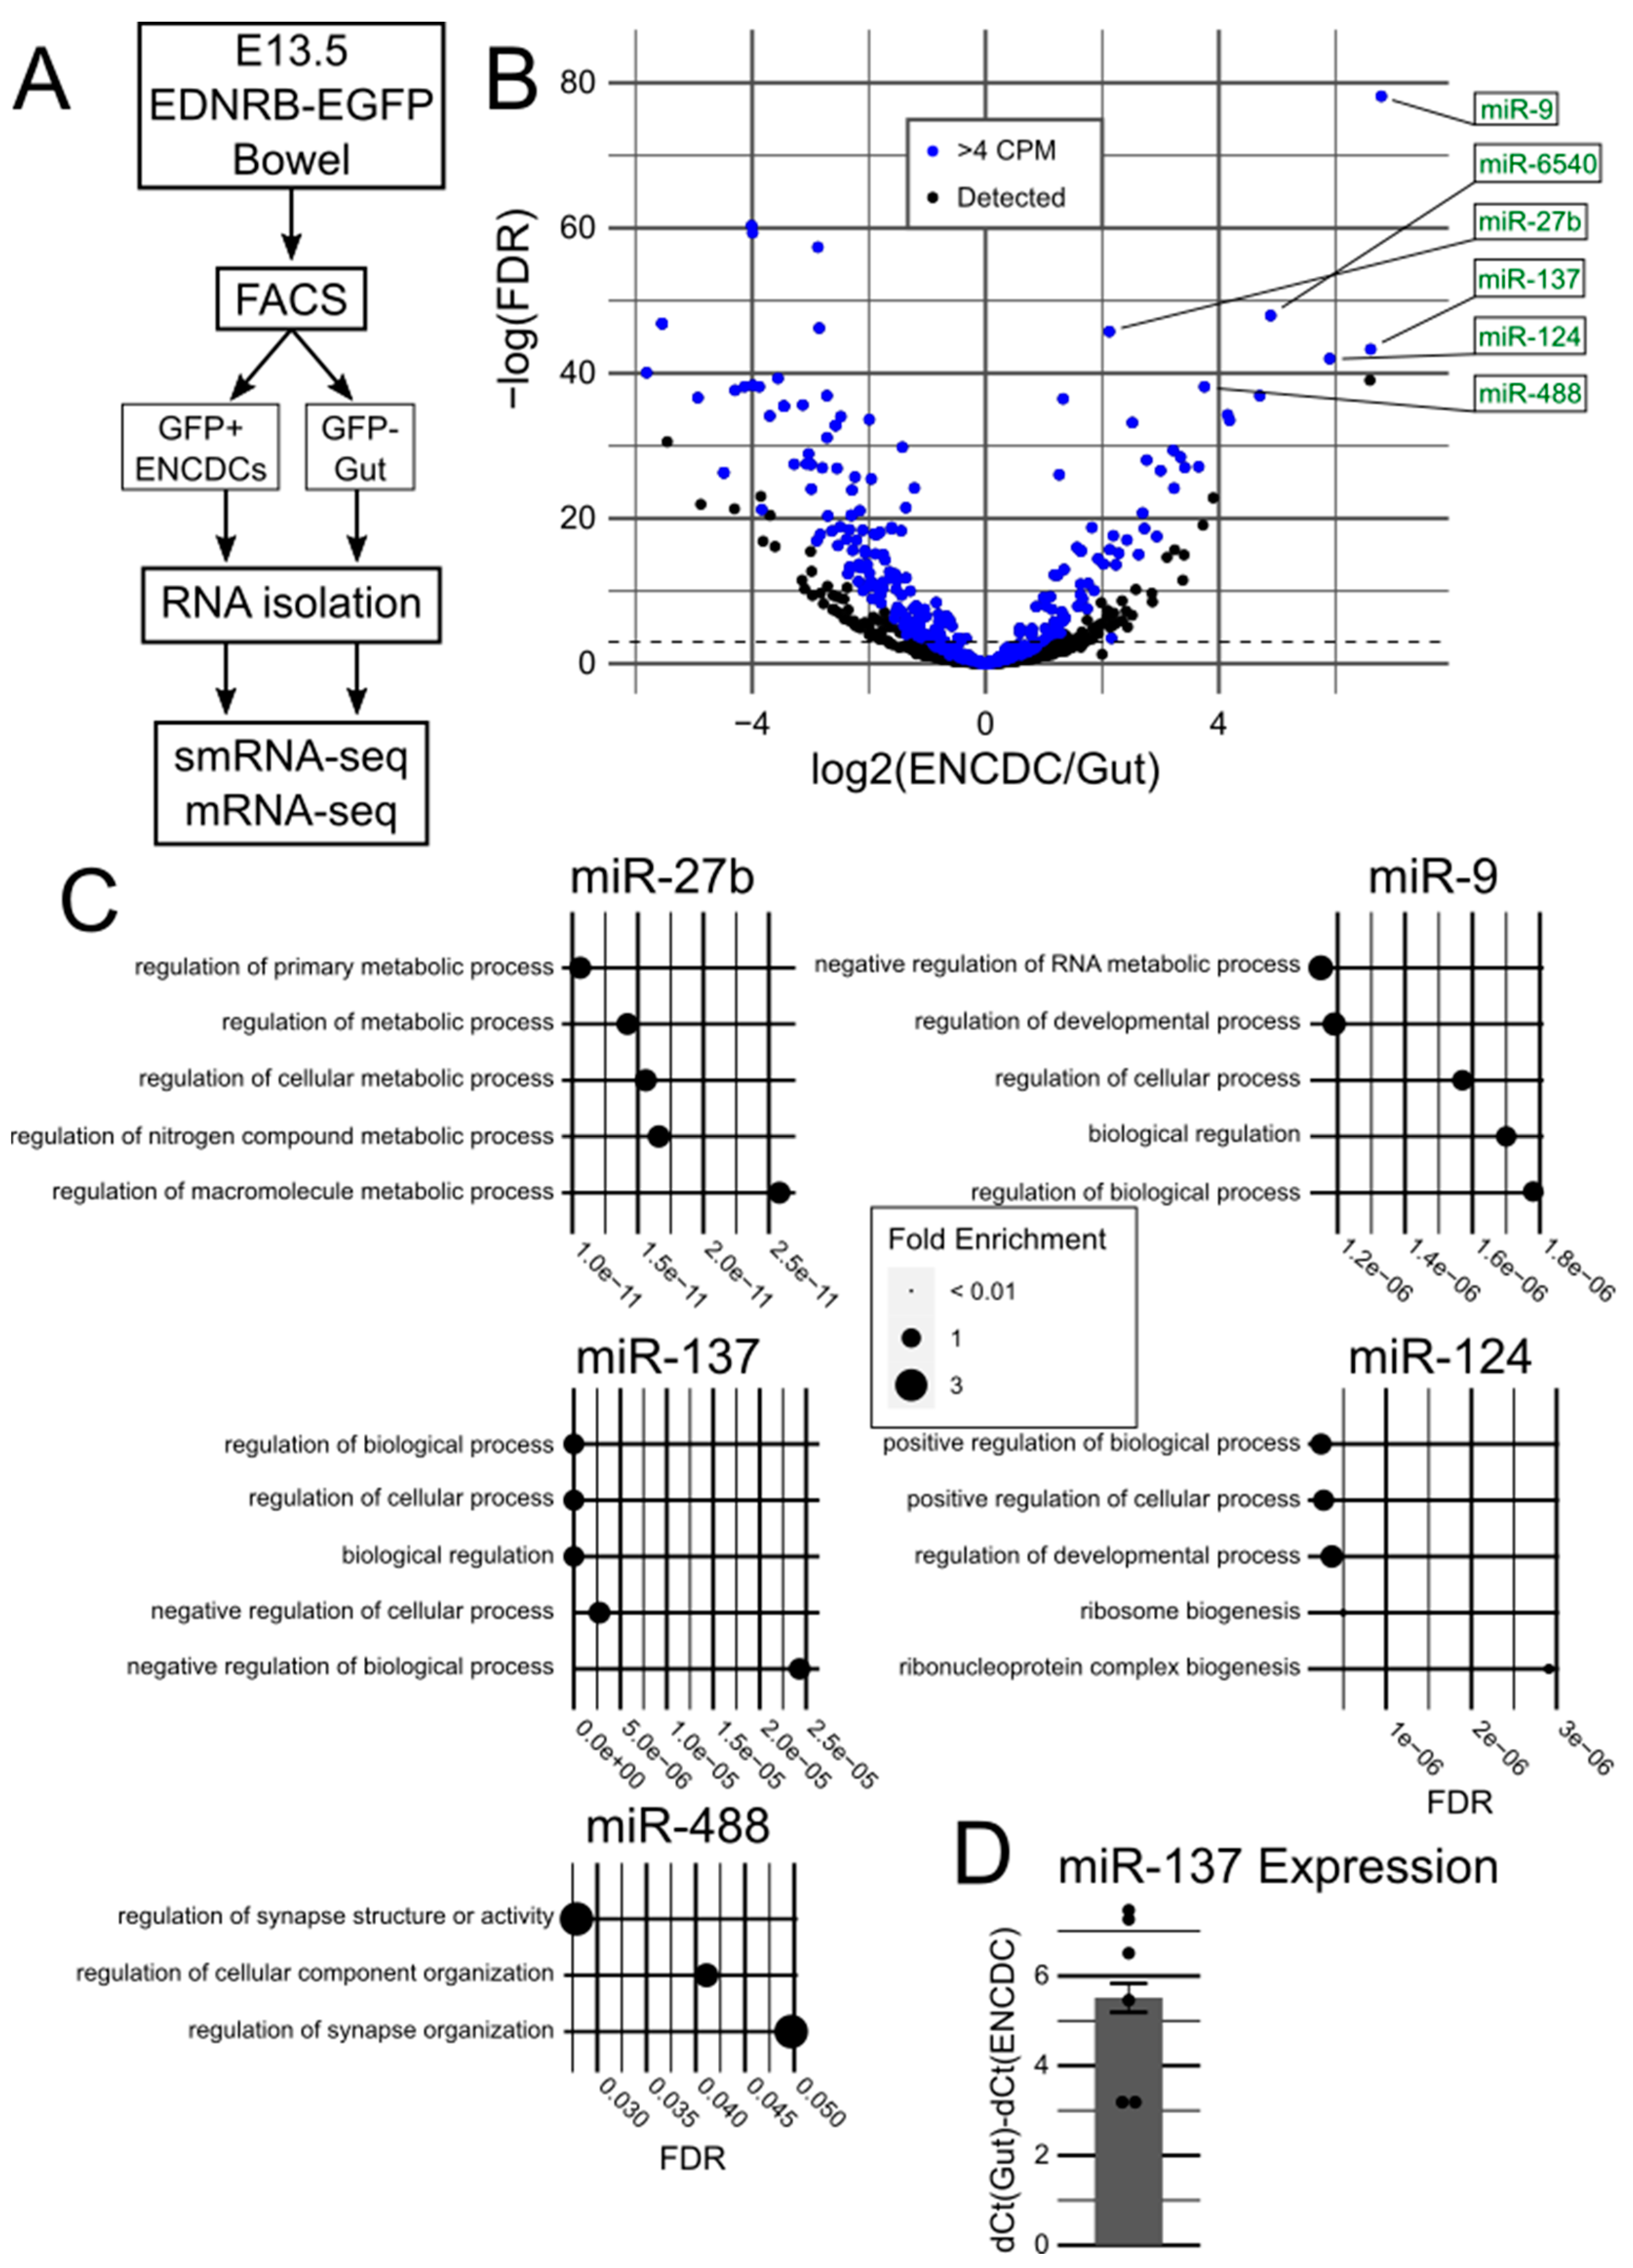
In this study, we hypothesized that one or more miRNAs expressed at E13.5 are critical for ENS development and attempted to identify them. We report the results of small RNA sequencing (smRNA-seq) of E13.5 ENCDCs. We found 73 miRNAs highly expressed and significantly enriched in ENCDCs compared to 141 miRNAs enriched in other cells in the bowel. We identified miR-137 as a potential miRNA of interest based on prior literature about its influence in neuronal differentiation in the central nervous system. We evaluated survival of Mir137 conditional knockout mice using four Cre-driver lines. Surprisingly, we found a lack of mouse mortality in any conditional knockout line, despite widespread lineage labeling and in contrast to prior studies.
3. Discussion
The ENS has been called the “second brain” in the bowel due to its complex development, diverse cell types, and wide range of functions [
37,
38]. The cells that make up the ENS arise initially from ENCDCs that proliferate and migrate along the bowel during fetal development. When ENCDCs fail to colonize the distal bowel, the child is born with HSCR. While the vast majority of people with HSCR have at least one known risk allele, direct causes of HSCR remain difficult to identify [
39]. This, combined with the importance of environmental factors during ENS development [
40,
41], suggests that further research into programmatic effectors of development is necessary. miRNAs are well-positioned to perform this role but have been under-investigated in ENS development, in part because miRNA expression in the developing ENS has not previously been characterized.
Our sequencing data capture a snapshot of miRNA expression at E13.5 in the developing murine ENS and surrounding gut cells. At this time point, ENCDCs have finished colonizing the fetal bowel and are beginning to separate and differentiate into the presumptive myenteric and submucosal plexuses, with some cells already showing electrical activity. Of the 880 miRNAs recovered in our sequencing, we identified 73 miRNAs that are significantly enriched in ENCDCs and expressed at moderately high levels. The six most significantly differentially expressed genes in that ENCDC-enriched subset were miR-9, -6540, -27b, -137, -124, and -488. miR-6540 is not conserved in humans (and thus is not discussed further) but has the same seed sequence as miR-124, which may suggest similar functions in development.
miR-9 has been thoroughly studied during central nervous system development [
20,
21]. It reaches peak expression in mouse telencephalon at E13.5, where it controls neural progenitor proliferation and differentiation through targeting
Foxg1,
Meis2,
Gsh2, and
Isl1 [
34]. In the ENS, loss of miR-9 targeting sites in farnesyl-prelamin A results in esophageal achalasia [
42], suggesting that miR-9 plays a critical role in maintaining adult ENS health. These results are narrowly relevant to progeria, however, so targeted studies examining the role of miR-9 in the ENS are necessary to investigate if there are additional roles.
miR-27b is frequently studied in the context of the heart, where it is suggested to mitigate atrial fibrillation and fibrosis but aggravate cardiac hypertrophy [
26,
27]. In the brain, miR-27b targets transcriptional repressors in the presynaptic transcriptome [
43], with conflicting evidence about whether miR-27b is up- or downregulated in response to sevoflurane treatment (a model of neuroinflammation) [
44,
45]. There are no publications examining the role of miR-27b in the ENS or HSCR.
miR-124, like miR-9, is well-characterized in neurodevelopment [
22,
23]. When overexpressed in fibroblasts in conjunction with miR-9 and anti-apoptotic proteins, miR-124 induces transdifferentiation into neuronal precursors through widespread transcriptome regulation [
24,
25,
46]. While miR-124 has been studied in HSCR, both miR-124 and its proposed target gene
SOX9 were upregulated in the stenotic bowel compared to the normal bowel from the same patient [
47], indicating further research is required.
miR-488 is usually (but not always) downregulated in cancer, acute myocardial infarction, and other conditions [
28]. In the brain, miR-488 plays an anti-apoptotic role and can limit neuronal apoptosis in epilepsy or ischemic stroke [
48,
49]. In the HSCR colon, however, miR-488 is upregulated, where it is suggested to target
DCX to limit cell migration and proliferation [
50].
Finally, miR-137 is another commonly studied miRNA in neurodevelopment [
51]. Polymorphisms of
MIR137 are associated with both schizophrenia and autism spectrum disorder [
52,
53]. In embryonic hippocampal neuronal stem cells (NSCs), miR-137 reportedly targets
Kdm1a to promote NSC migration and differentiation [
29], while in adult hippocampal NSCs, miR-137 is proposed to target
Ezh2 and
Mib1 to inhibit NSC differentiation [
30,
31]. Germline
Mir137 KO and
Nestin-cre; Mir137 cKO mice have been reported to die by P30 [
32], a phenotype common in HSCR mouse models. Prior to this study, however, there were no publications examining the role of miR-137 in the ENS or HSCR.
Only three genes are predicted to be regulated by all five of these miRNAs at once: the nuclear factor one genes
Nfia and
Nfib and the zinc finger protein
Zbtb20. Conditional knockout of
Nfia by
Wnt1-cre results in the loss of A-fiber nociceptors in the dorsal root ganglia, which sense sharp pinprick sensations [
54]. Germline knockout of
Nfib, meanwhile, results in severe lung hypoplasia, and even heterozygosity of
Nfib delays pulmonary differentiation [
55]. Neither have been studied in the context of the bowel previously.
Zbtb20, however, has been shown to mediate stress-induced visceral hypersensitivity in rats through its expression in dorsal root ganglia [
56]. Mice lacking
Zbtb20 display multiple metabolic defects, many of which are independent of liver function [
57]. All three merit further investigation during bowel development, especially given their central location in these miRNA regulatory networks.
Our attempts to synthesize our paired smRNA-seq and mRNA-seq data were unsuccessful at informing potential experiments to perform with
Mir137 cKO mice, as no biological processes were identified as significantly regulated by the identified targets. It is interesting to note, however, that both pipelines suggested that
Neurod4 may be a critical regulatory target of miR-137.
Neurod4, also known as
Math3, cooperates with
Ngn2 during development of the cerebral cortex [
58]. Germline loss of
Neurod4 in mice causes severe growth and motor defects due to loss of granule cells in the cerebellum [
59]. While
Neurod4 has not been studied in the context of the ENS, our work suggests it may merit further investigation with more targeted tools.
Interestingly, of the 37 miRNAs that we found that have been specifically studied in HSCR, only 83.8% (31/37) were sequenced in our dataset, and only 19.4% of those (6/31) were specifically enriched in ENCDC samples (
Table 8). These discrepancies may be attributable to the mid-embryonic timepoint we sampled, our specific selection of ENCDCs for sequencing, or expression differences between the murine intestine and the human colon. We hope our sequencing data will inform future investigations into the role of miRNAs in HSCR and other ENS diseases.
We followed up our sequencing data by examining miR-137 across four Cre driver lines:
Nestin-cre [
98], the driver used by Cheng et al. [
32] to study
Mir137 cKO mice;
Wnt1-cre [
99], which targets the pre-migratory neural crest and hindbrain;
Sox10-cre [
100], which targets the migratory neural crest and glia; and
Baf53b-cre [
101], which targets mature neurons and has been shown to label the myenteric plexus of the entire small intestine [
102]. Surprisingly, we found no difference in survival resulting from conditional loss of
Mir137 in any Cre driver tested (
Table 6). Preliminary analysis of ENS anatomy in a
Wnt1-cre+; Mir137fl/fl mouse also appeared to be normal.
The contrast between previously published
Nestin-cre; Mir137 cKO results showing poor growth and death around or shortly after weaning [
32] and our apparent lack of phenotypic differences between WT and cKO mice, coupled with the prominent ENCDC enrichment of miR-137 at E13.5, prompted additional investigation. While
Nestin-cre has been used to target the ENS for studies previously [
103], no study thoroughly characterized
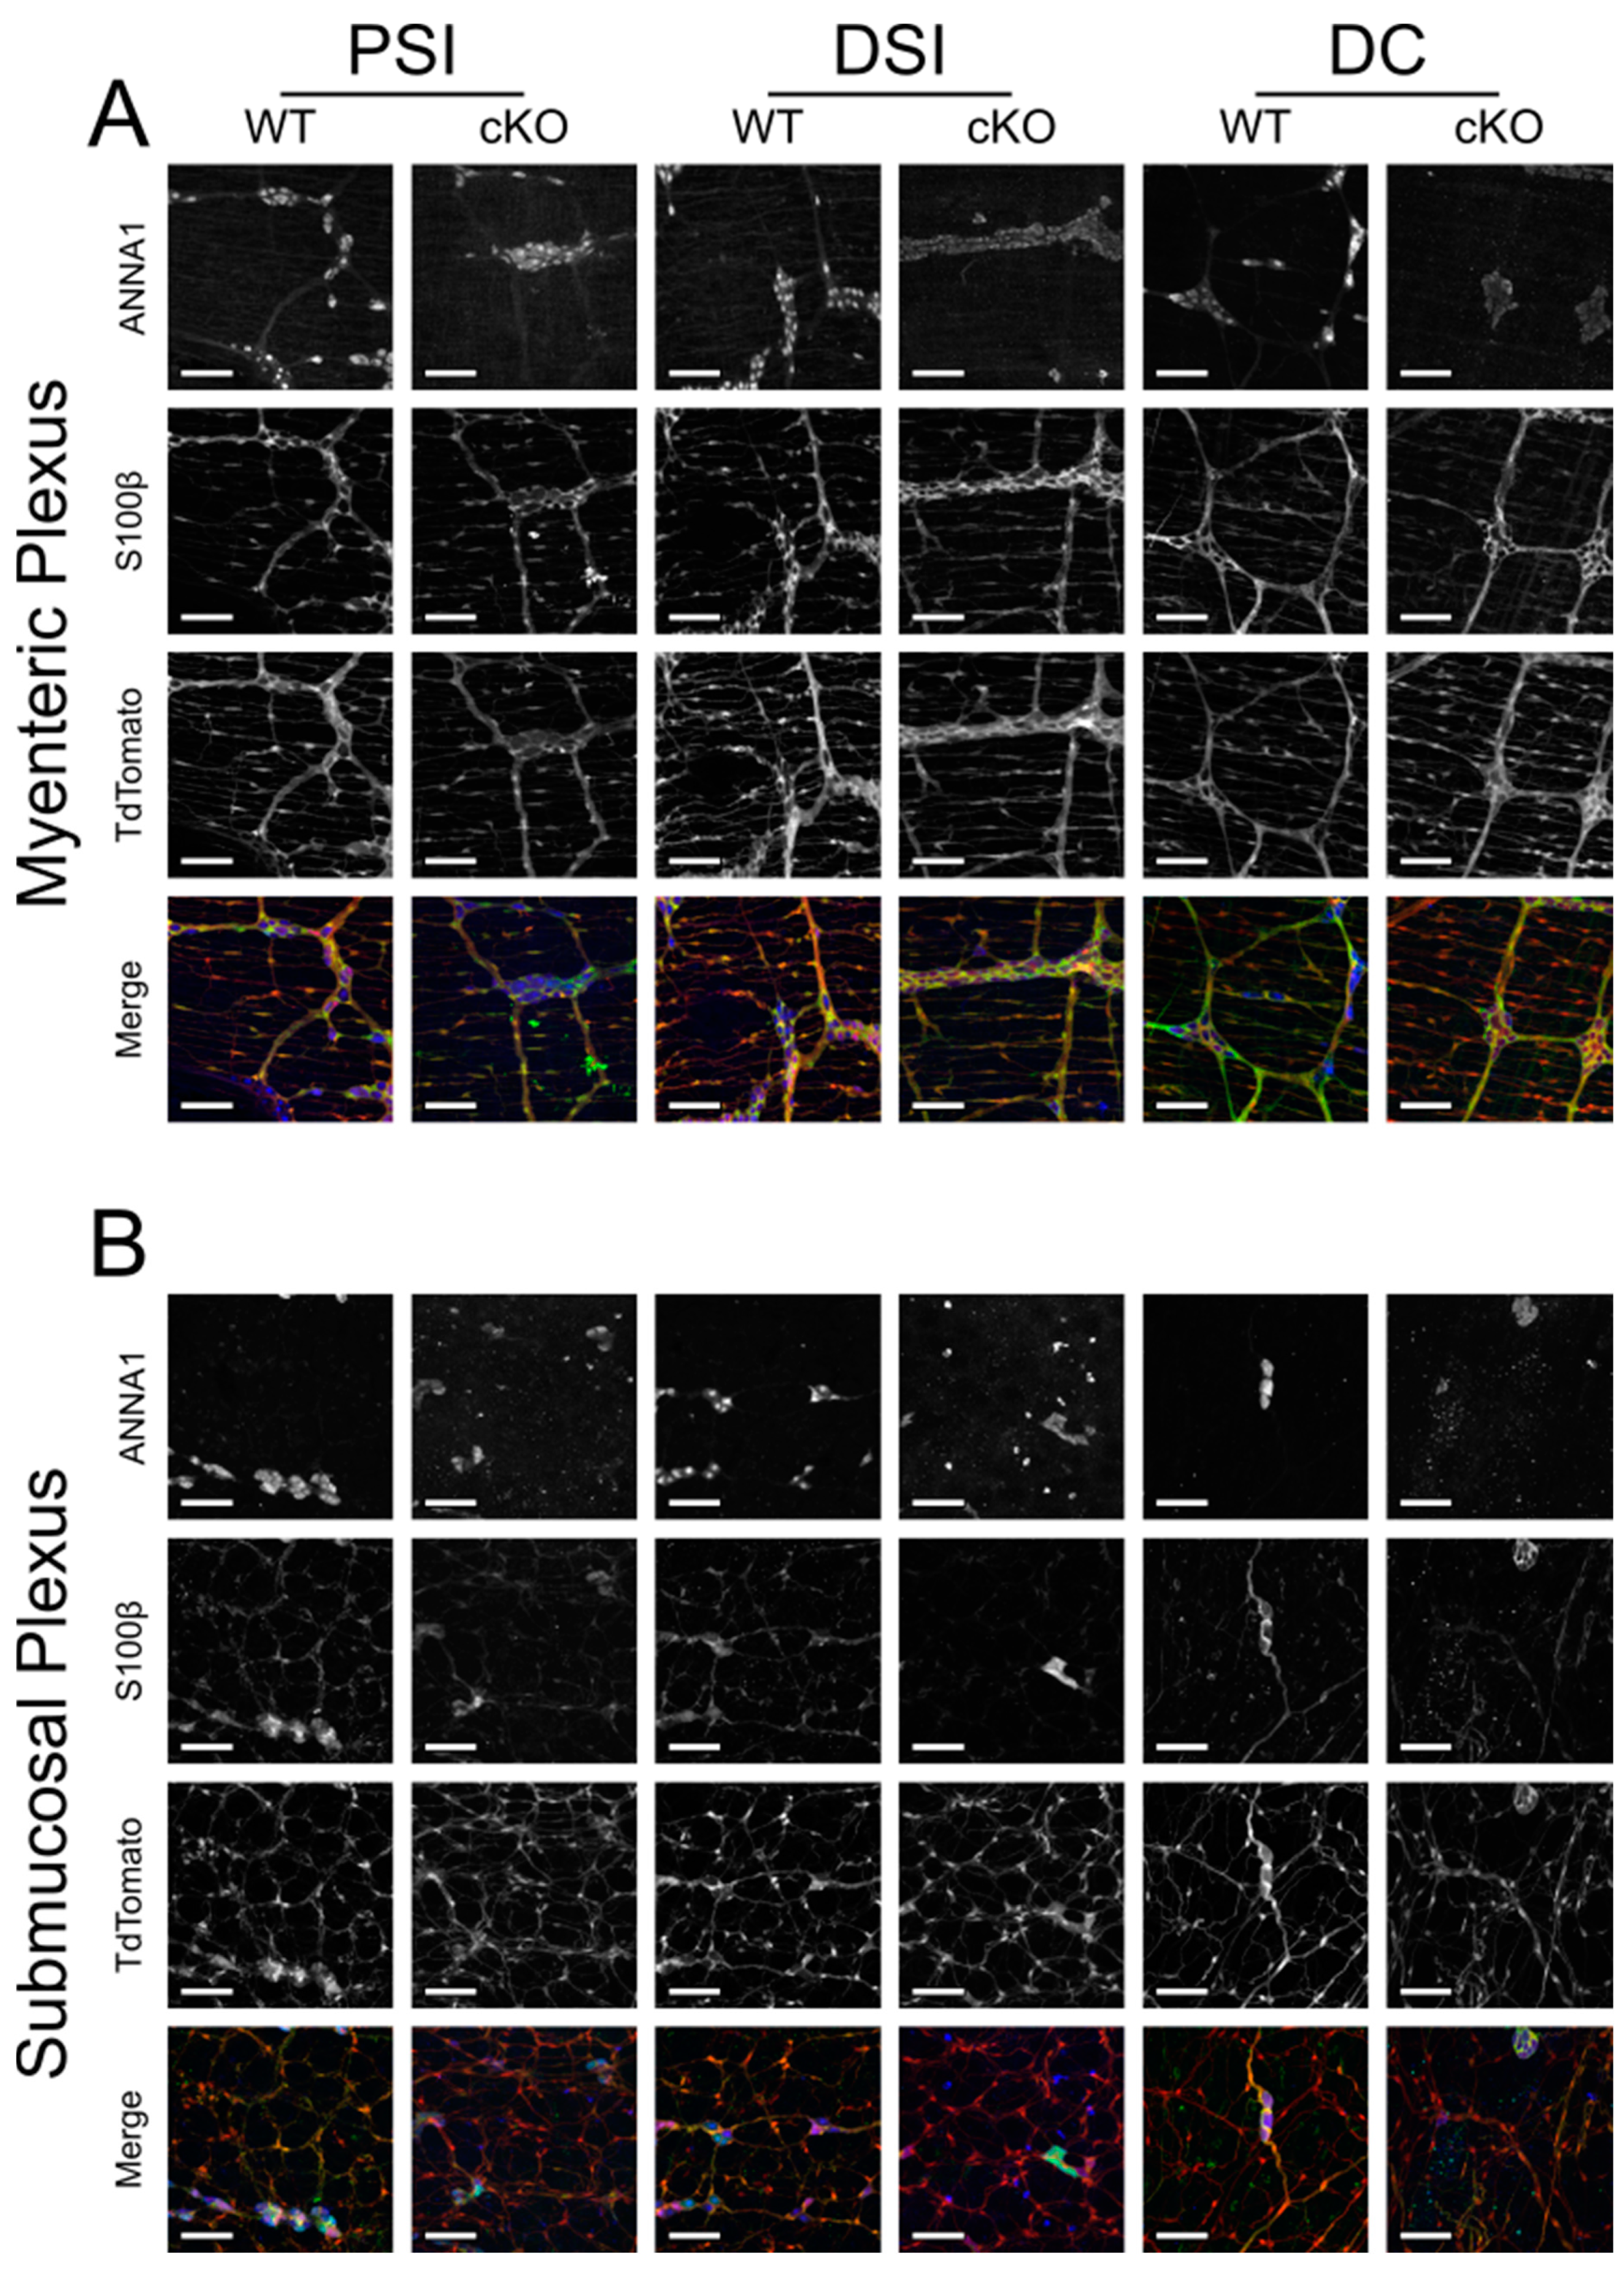
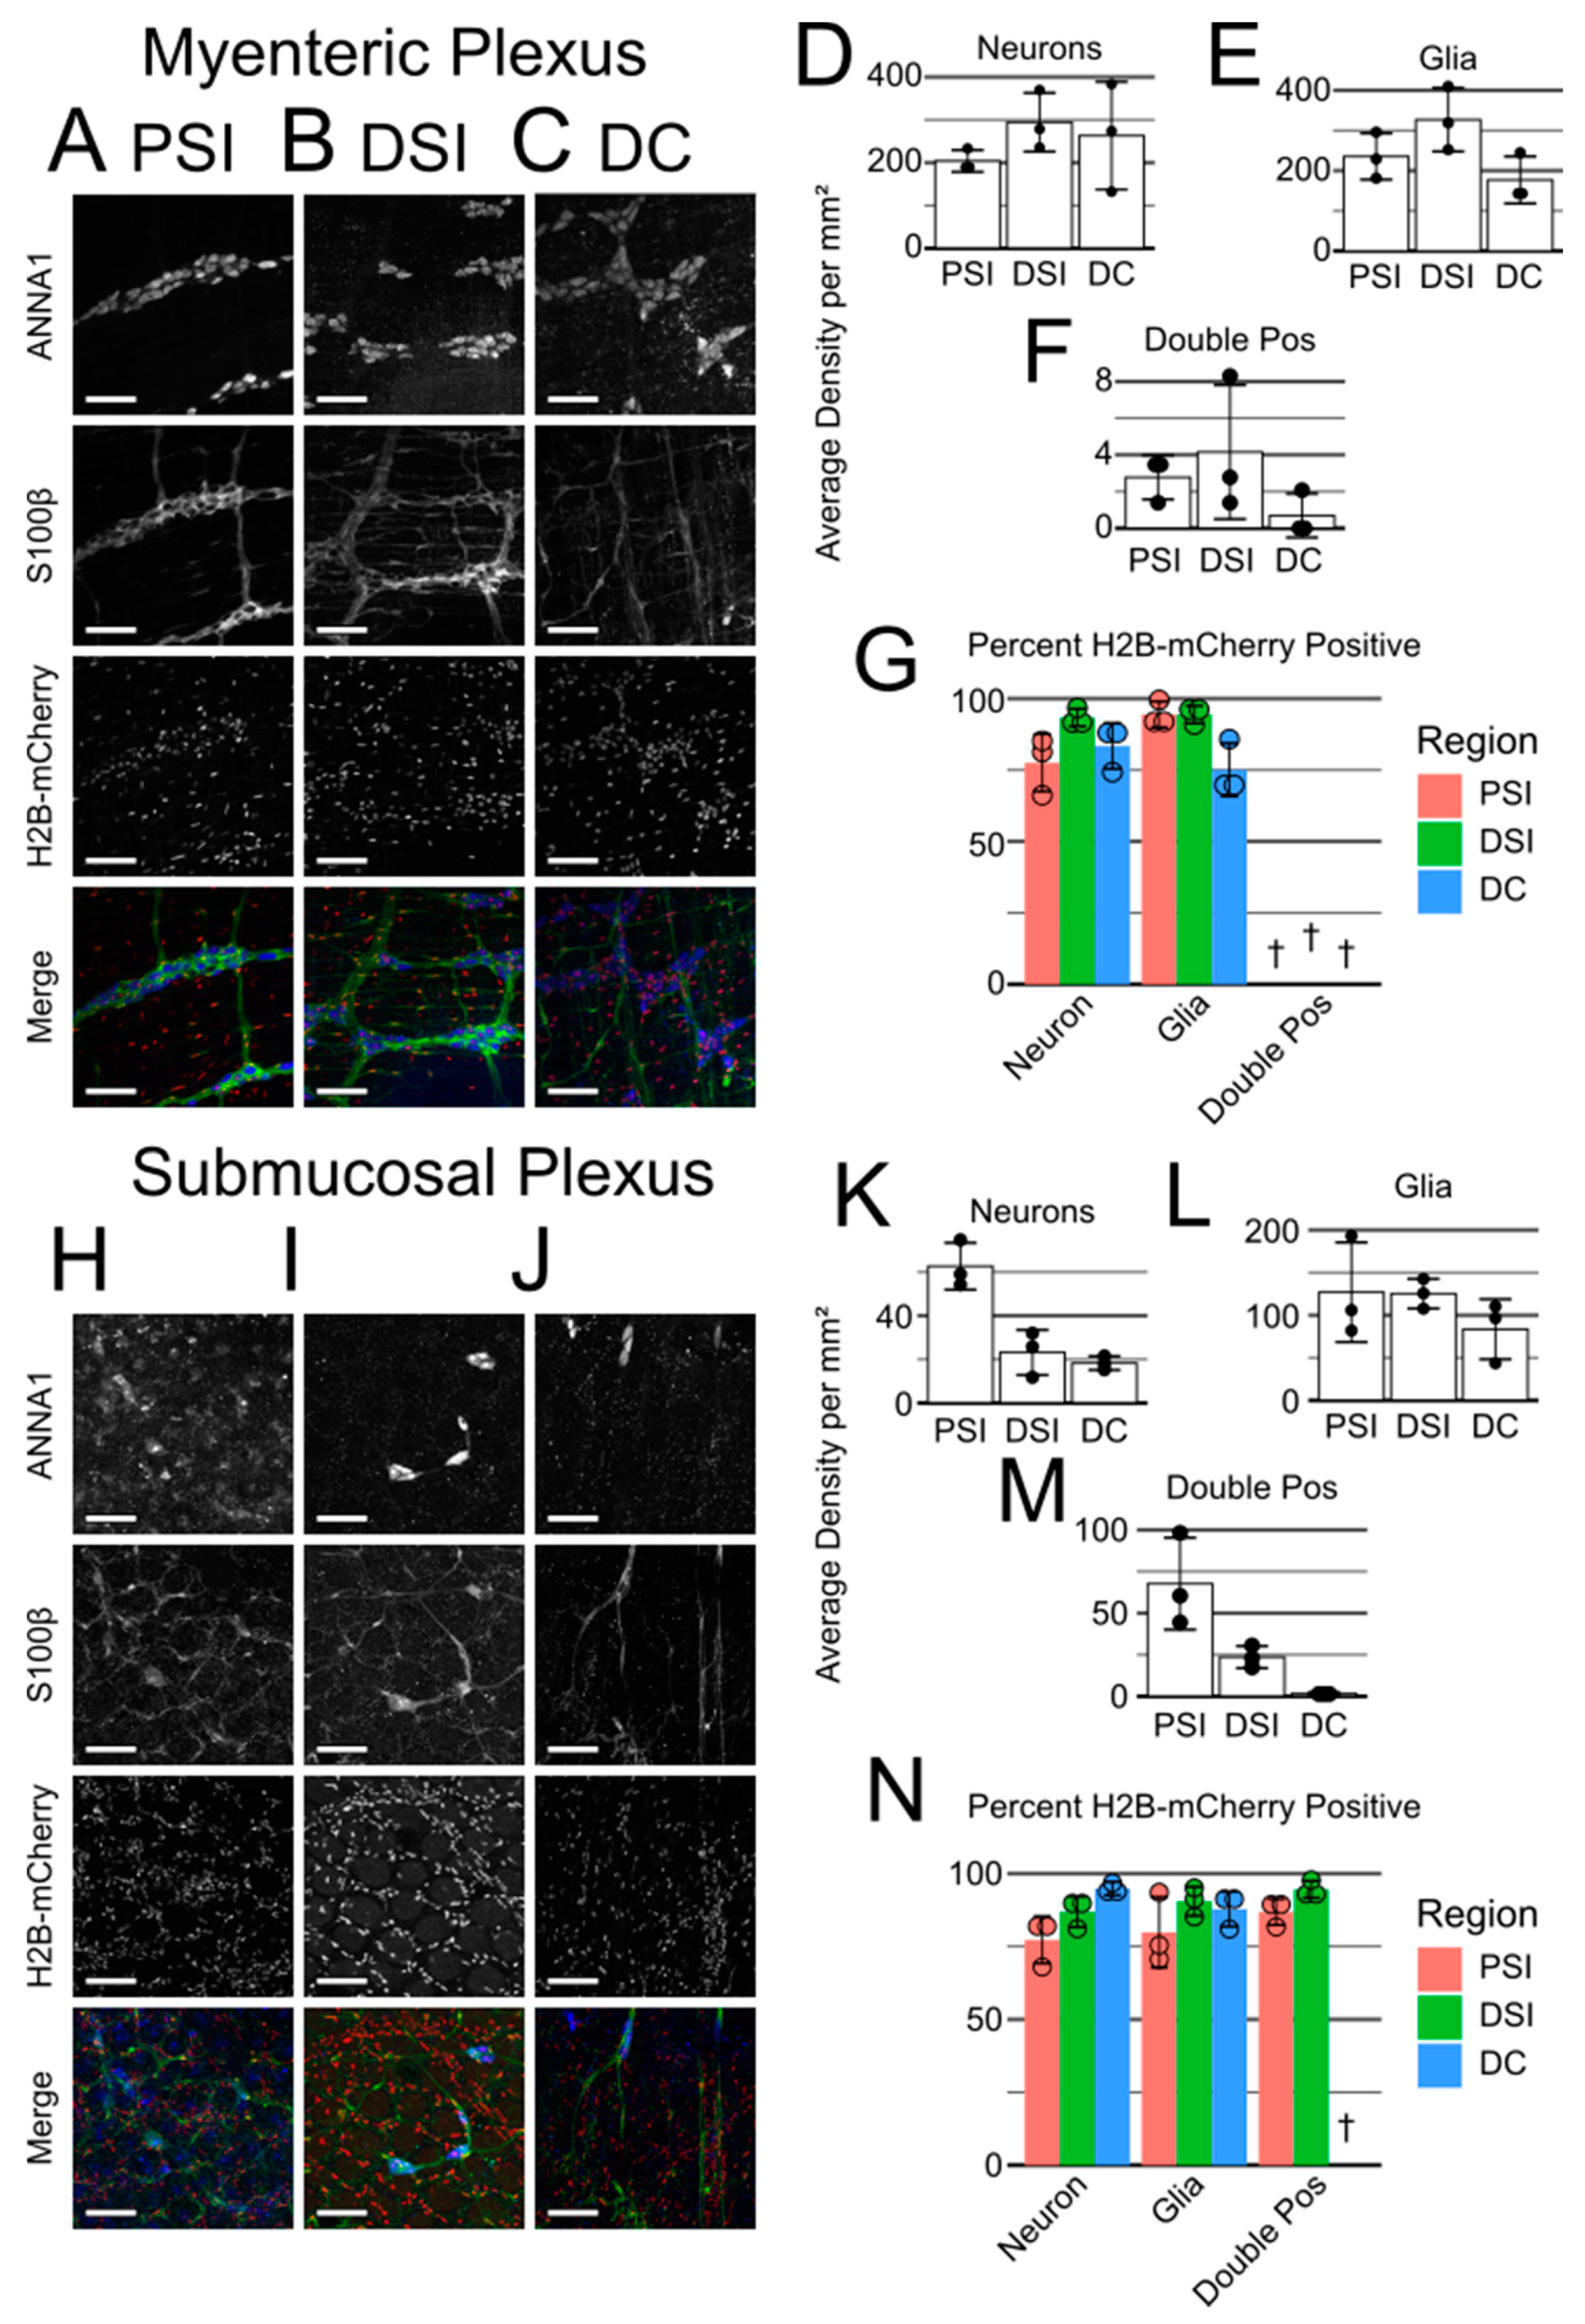
Nestin-cre lineage labeling of the adult ENS. Thus, we evaluated the number of ANNA1- and S100β-labeled cells that descended from
Nestin-cre lineage cells. We found that the adult ENS is largely (but not completely) labeled by
Nestin-cre-induced reporter expression. Additionally, while
Nestin-cre was initially developed to target neurons and selectively constructed using the neuronal enhancer of the
Nestin gene [
98], we noted that many cell types beyond neurons and glia were labeled in
Nestin-cre; Rosa26LSL-H2B-mCherry bowels.
Given the many non-neuronal cell types
Nestin-cre is expressed in, it is worth considering how loss of
Mir137 in
Nestin-cre-targeted non-ENCDCs may influence ENS development, even recognizing that miR-137 is barely detectable in non-ENCDCs at E13.5. In the developing bowel, the gut mesenchyme expresses
Edn3 in progressively more distal regions, supporting ENCDC migration down the bowel [
104]. Later, as ENCDCs organize into the myenteric and submucosal plexuses,
Shh expression in the bowel epithelia provides critical organizational information [
105]. Neither are directly targeted by miR-137, but both serve to demonstrate the importance of crosstalk between ENCDCs and non-ENCDCs during development. Unfortunately, no study to date has reported on when
Nestin-cre begins Cre-dependent recombination during bowel development, in the ENS or otherwise, rendering it difficult to assess when and how loss of
Mir137 may affect ENS development despite its broader targeting.
While our
Nestin-cre; Mir137 cKO results were unexpected, the differences we found are not without precedent. Even though we acquired the same strains as originally published and made significant efforts to minimize background mixing, differences in both the microbiome [
106] and environmental stress [
107] can have dramatic effects on mouse phenotypes. Unfortunately, critical facility-specific factors that impact phenotype can be challenging to identify, so we cannot readily assess why our results differed from prior reports.
4. Materials and Methods
4.1. Animals
Mice were maintained in accordance with a Children’s Hospital of Philadelphia (CHOP) IACUC-approved protocol (IAC 22-001041).
Mir137-flox mice were a gift from Dr. Peng Jin [
32] and maintained in the 129S6/SvEvTac background.
Ednrb-EGFP (MMRC #066515-MU, RRID:MMRRC_066515-MU),
Nestin-cre (JAX #3771, RRID:IMSR_JAX:003771),
Wnt1-cre (JAX #3829, RRID:IMSR_JAX:003829),
Sox10-cre (JAX #25807, RRID:IMSR_JAX:025807),
Baf53b-cre (JAX #27826, RRID:IMSR_JAX:027826),
Rosa26LSL-TdTomato (JAX #7909, RRID:IMSR_JAX:007909), and
Rosa26LSL-H2B-mCherry (JAX #23139, RRID:IMSR_JAX:023139) mice were maintained in a C57Bl/6J background. Background mixing was limited when possible, using progeny from initial F1 crosses to maintain experimental colonies except to rescue a collapsing line. Further animal and housing information is in
Table S1.
4.2. Mid-Gestation ENCDC Isolation
Heterozygous Ednrb-EGFP mice and wild-type C57BL/6J mice were housed together and checked every morning for plugs, with the date of plug discovery considered E0.5. When the embryos reached E13.5, dams were euthanized via CO2, and the embryos were dissected in sterile L15 media (ThermoFisher #11415064, Waltham, MA USA) to isolate the bowel from the stomach to the anus. GFP+ bowels were identified with an inverted microscope (Zeiss Axio Observer.A1, Zeiss, Oberkochen, Germany; with attached X-Cite 120Q, Excelitas Technologies, Waltham, MA, USA) and incubated in sterile phosphate buffered saline (PBS; Mediatech #MT21-031-CM, Corning, NY, USA) with 0.2 mg/mL dispase (Gibco #17105041, Waltham, MA USA) and 0.2 mg/mL collagenase II (Sigma #C6885, Burlington, MA, USA) at 37 °C for 15 min. Loose cells were removed with PBS, then the embryonic bowel was fully dissociated by trituration with a P1000 pipette. The dissociated bowel was filtered with a 40 µm cell strainer (Corning #352340, Corning, NY, USA) before centrifuging at 293× g for 7 min. Pelleted cells were resuspended in 1 mL PBS with 2% heat-inactivated fetal bovine serum (Tissue Culture Biologicals #101, Tulare, CA, USA), 1 mM EDTA (Invitrogen #15575-038, Waltham, MA, USA), and 0.1% sodium azide (Sigma #S2002, Burlington, MA, USA) for fluorescence-activated cell sorting on a BD FACSJazz. After sorting to separate GFP+ ENCDCs from GFP− gut cells (i.e., non-ENCDCs), samples were pelleted at 400× g for 10 min then resuspended in QIAzol (Qiagen #79306, Hilden, Germany) and stored at −80 °C until ready for RNA purification.
4.3. RNA Purification
RNA was purified from frozen samples in QIAzol using the Qiagen miRNeasy Mini Kit (Qiagen #217004, Hilden, Germany) in accordance with the manufacturer’s instructions. Briefly, the samples were thawed and allowed to solubilize for an additional 5 min after ice was no longer visible. The RNA fraction was then isolated via chloroform extraction. Ethanol was added to the clear hydrophilic fraction; then, the sample was loaded onto a spin column and washed with buffer RWT and RPE. The membrane was dried with an additional centrifugation step; then, the RNA was eluted into 50 µL of RNase-free water.
4.4. RNA Sequencing
Sequencing was performed by the Penn Genomics and Sequencing Core (PGSC; RRID: SCR_022382). Multiple RNA samples were pooled as necessary to obtain 4 replicates with 750 pg of RNA each. smRNA-seq libraries were prepared with the Illumina truSeq smRNA kit (Illumina #RS-200, San Diego, CA, USA), while mRNA-seq libraries were prepared with the Clontech SMARTer PCR cDNA Synthesis Kit (Clontech #634925, San Jose, CA, USA) followed by the Illumina NexteraXT kit (Illumina #FC-131, San Diego, CA, USA).
The sequencing reads produced by the PGSC were then aligned with STAR v2.4.2a [
108] and normalized with PORT v0.8.5-beta [
109]. Due to the short length of miRNAs, the additional arguments --outFilterScoreMinOverLread 0.3 and --outFilterMatchNminOverLread 0.3 were used to align the smRNA-seq data, thereby permitting short alignments. Minimum normalized read counts were used to analyze the mRNA-seq data, while the smRNA-seq data were analyzed using maximum normalized read counts due to gene duplication of many miRNA host genes (e.g.,
Mir9-1hg,
Mir9-2hg, and
Mir9-3hg). Differentially expressed genes were identified by processing read counts with the R voom package [
110] then analyzing the output with the R limma package [
111]. Finally, non-miRNA genes were filtered out of the smRNA-seq dataset, and duplicated miRNAs were consolidated by averaging their values.
4.5. RT-qPCR of miR-137
RNA samples were diluted to equivalent concentrations then prepared using the TaqMan Advanced miRNA cDNA Synthesis Kit (Applied Biosystems #A28007, Waltham, MA, USA). Briefly, RNA was polyadenylated then ligated to an adaptor before reverse transcription. The produced cDNA was then amplified to improve the detection of miRNA targets with low expression.
Quantitative polymerase chain reaction (qPCR) was performed using the TaqMan Fast Advanced Master Mix (Applied Biosystems #4444558, Waltham, MA, USA) and TaqMan Advanced miRNA Assays (Applied Biosystems #A25576, Waltham, MA, USA) for miR-137 (assay 477904_mir) and miR-106b (assay 478412_mir). miR-106b was chosen as a reference gene, as it has been shown to be more stably expressed than 5S rRNA or U6 snRNA during neuronal differentiation [
112]. miR-137 expression was thus normalized to miR-106b expression, then ENCDC expression was normalized to gut expression. dCt(Gut)–dCt(ENCDC) (i.e., −ddCt) was chosen for the y-axis of
Figure 1D so that increased miR-137 expression in ENCDCs produced a positive number.
4.6. Prediction of Critical mRNA Targets of Sequenced miRNA through Two Pipelines
The goal of both pipelines was to identify genes expressed in ENCDCs that could be repressed by miRNAs by enhancing their metrics of expression based on their predicted strength of repression. The first pipeline tested used the differential expression output for smRNA-seq and mRNA-seq. First, TargetScan 7.2 cumulative weighted context++ scores for every miRNA-mRNA pair were multiplied by the average expression value of each miRNA to incorporate the expected strength of targeting. Then, the t-statistic of each mRNA’s differential expression was multiplied by this targeting strength score. To evaluate weighted t-statistics for significance, 1000 permutations of this pipeline (using randomized TargetScan scores, miRNA expression levels, and mRNA t-statistics) were performed, and the boundaries of a two-tailed 5% analysis were identified. The signal-to-noise ratio was determined by randomizing the raw read counts of the mRNA-seq data and assessing these data via this differential expression and weighting pipeline.
The second pipeline tested only for predicted repression by miR-137. This pipeline first re-normalized the smRNA-seq and mRNA-seq data using only the ENCDC samples. Present miRNAs and mRNAs were identified by filtering for genes with an average of at least 3 transcripts across all samples and presence in at least 3 out of 4 samples, while significant expression was evaluated by a t-test for expression >0 (with a false discovery rate of <5% used as a threshold for significance). t-statistics were then divided by their TargetScan 7.2 cumulative weighted context++ score for miR-137; thus, the scores for potentially repressed genes were further lowered by their strength of targeting by miR-137. Significant t-statistics were again determined by a permutation analysis.
4.7. Survival Analysis
Mice from
cre−; Mir137fl/+ x
cre+; Mir137fl/+ matings were weaned at P28 and genotyped for wild-type, floxed, and deleted
Mir137 alleles using ear biopsies and previously published primers [
32]. Mice with evidence of germline recombination were excluded from analysis, recognizing that each Cre driver line tested causes recombination in the skin (thus
Mir137fl/- mice could not be differentiated from
Mir137fl/fl mice). Whole litters were evaluated until at least 80 weanlings were genotyped, in order to produce a minimum expected value of 5 mice of each sex–genotype combination.
4.8. Adult Bowel Harvesting
Adult (P56-84) mice were euthanized by CO2 and dissected. The bowels were isolated from stomach to anus and roughly divided into the proximal small intestine, distal small intestine, and colon before being flushed with non-sterile PBS (ThermoFisher #21600069, Waltham, MA, USA). The flushed bowels were then opened lengthwise along the mesenteric border and pinned flat with stretching. The proximal and distal small intestine segments were trimmed to only the first and last 6 cm of pinned bowel, while the colon was divided into the proximal and middle/distal colon at the epithelial folds. The bowels were fixed with 4% paraformaldehyde (EMD Millipore CAS 30525-89-4, Burlington, MA, USA) in PBS for 25 min, rinsed with PBS, and stored overnight at 4 °C before peeling apart the muscularis and mucosal layers. The third centimeter of the proximal small intestine, the most distal centimeter of the distal small intestine, and the most distal centimeter of the colon were routinely used for further analyses. As the major duodenal papilla is typically found on the second centimeter of the proximal small intestine, the third centimeter was estimated to be the distal duodenum and/or proximal jejunum. The distal small intestine and distal colon segments corresponded to the distal ileum and rectum, respectively.
4.9. Immunohistochemistry
1 cm fixed bowel segments were blocked with 5% normal donkey serum (Jackson ImmunoResearch #017-000-021, RRID: AB_2337258, Ely, Cambridgeshire, UK) in PBS with 0.5% Triton X-100 (Sigma-Aldrich #T8787, Burlington, MA, USA) for 2 h at RT. The bowels were then stained with 1:20,000 ANNA1 (gift from Vanda Lennon, Mayo Clinic, Rochester, MN, USA, RRID: AB_2314657) and 1:200 rabbit anti-S100β (Abcam #ab52642, RRID: AB_882426, Cambridge, UK) in blocking buffer for 2 h at RT before being washed 3 times in PBS for at least 5 min per wash. The bowels were then stained with 1:400 AlexaFluor 647 Goat α-Human (Invitrogen #A21445, RRID: AB_2535862, Waltham, MA, USA) and 1:400 AlexaFluor 488 Goat α-Rabbit (Invitrogen #A11034, RRID: AB_2576217, Waltham, MA, USA) for 1 h at RT in the dark. Finally, the bowels were washed in the dark 3 times in PBS for at least 5 min per wash then mounted on a glass slide in 50/50 PBS/glycerol (Invitrogen #15514-011, Waltham, MA USA) with 0.05% sodium azide. Slides were sealed with clear nail polish (Sally Beauty #SBS-215100, Denton, TX, USA) and allowed to cure at RT overnight. Images were captured on a Zeiss LSM 710 confocal microscope with Zeiss ZEN 2.3 Sp1 FP3 (black) (Version 14.0.18.201; Zeiss, Oberkochen, Germany) software, a Plan-Apochromat 20×/0.8 air M27 objective lens, and slice interval of 1 µm. Images were taken from 8 unique fields of view (425.1 µm × 425.1 µm each), prioritizing the most proximal regions (if imaging the proximal small intestine) or the most distal regions (if imaging the distal small intestine or the colon).
Primary antibodies were considered trustworthy based on staining of Wnt1-cre lineage-traced cells, morphology and localization of staining, and comparison of images to published literature (including ANNA1+/S100β+ cells).
4.10. Cell Density Quantification
The bowel images were opened in ImageJ and quantified using the Cell Counter plugin. ANNA1+/S100β− cells were considered neurons, while ANNA1−/S100β+ cells were considered glia. ANNA1+/S100β+ cells were also quantified but only referred to as “double-positive cells” for simplicity. Cell densities across all images of a given bowel and plexus region were averaged and reported as the density for that mouse (i.e., treated as an experimental N).
4.11. Statistics
A 6 × 2 contingency table of genotype × sex was constructed and evaluated using Fisher’s exact test to determine if genotype and sex were independent factors in determining survival to P28. As all experimental lines failed to disprove the null hypothesis of independence, sex was discarded as a differentiating factor, and the combined distribution of genotypes was compared to a null Mendelian distribution of genotypes (i.e., 12.5% for cre+ and cre− with Mir137+/+ and Mir137−/− and 25% for cre+ and cre− with Mir137fl/+) using the chi-square test.


