Article

An Experimental Study on the Effect of Distance and Sheltering Area of a Group of Linearly Arranged Sacrificial Piles on Reducing Local Scour around a Circular Bridge Pier under Clear-Water Conditions

Graduate School of Science and Engineering, Saitama University, 255 Shimo-Okubo, Sakura Ku, Saitama Shi 338-8570, Japan
*
Author to whom correspondence should be addressed.
Fluids 2024, 9(2), 35; https://doi.org/10.3390/fluids9020035
Submission received: 21 December 2023 / Revised: 25 January 2024 / Accepted: 28 January 2024 / Published: 31 January 2024
(This article belongs to the Topic Advances in Environmental Hydraulics)

Abstract

:
One of the major problems associated with bridge piers is ensuring their safety against local scouring caused by the erosive action of flow. Numerous countermeasures have been developed and tested to solve this problem, among which sacrificial piles are highly recognized due to their high performance, economy, durability, and ease of construction. Several factors affect the performance of sacrificial piles, such as their number, size, degree of submergence, and geometric arrangement parameters. In this study, the performance of a group of linearly arranged cylindrical sacrificial piles in reducing local scour around a circular bridge pier was investigated by varying the number of piles (or sheltering area) and distance between piles and the pier under clear-water conditions. Three values of distance between piles and the pier and three values of sheltering area (or number of piles) were tested. The efficiencies of sacrificial piles in different configurations were presented in terms of the percentage reduction in maximum scour depth at an unprotected pier under the same hydraulic conditions. The results of this experiment show that when linearly arranged sacrificial piles are placed close to the pier (at distance D; D is the pier diameter), an increase in the number of piles (or sheltered area) results in an increased scour depth, and when placed far from the pier (2D and 3D), an increase in the number of piles results in a decrease in scour depth around the pier. In addition, for 40% and 60% sheltering conditions, scour depth increased with an increase in the spacing between piles and the pier, while for 80% sheltering conditions, optimum protection was observed at a distance of 2D. Overall, two piles placed at distance D provided optimum protection with a scour depth reduction of 41.6%, while minimum protection was recorded when the same were placed at a spacing of 3D from the pier (25.5%).

1. Introduction

Bridge piers located within the waterway of a river are often subjected to the erosive action of the flowing water. Local scour, in its simplest form, can be defined as the process of the removal of bed material from the vicinity of the pier by the local flow field components. Removal of bed materials from around the bridge pier can cause buckling failure of the pier [1], thereby leading to huge damage to properties and the loss of human lives. Historical evidence shows that more than half of the bridge failures around the world are due to scours [2]. Hence, local scour is recognized as one of the major problems in hydraulic engineering. Local scour at bridge piers is a result of three-dimensional boundary-layer separation leading to the formation of a scour hole at the base of a pier. The main components of the local flow field include the downflow, horseshoe vortex, flow separation, wake vortices, and surface rollers (bow wave) [3]. Whenever a blunt body such as a pier is placed in a river, the velocity of approach flow becomes zero at the front face of the pier, known as the stagnation point, due to which the fluid pressure increases at the pier’s front face. Since the velocity of flow decreases from the surface to the bottom along the flow depth, the pressure also decreases in the same fashion, thereby developing a vertical pressure gradient, which is responsible for the downflow. The downflow, acting as a vertical jet of water, hits the bed and rolls upwards, which, upon meeting the downward flow, leads to a rolling flow that exerts shear stress on the soil grains. This shear stress, upon exceeding the shear resistance of the bed material, causes the removal of the bed soil, and consequently, a horseshoe vortex is formed at the front bed, which is the most dominant feature in the process of the formation of a scour hole. The boundary-layer separation on either side of the pier leads to the formation of wake vortices on either side behind the pier, and these wake vortices are responsible for the removal of bed sediment from the back of the pier by suction action. The periodical shedding of the wake eddies leads to the transportation of sediment particles, which are deposited at some distance behind the pier. These three vortices acting together are responsible for the development and expansion of a scour hole around the pier [3]. Past findings have shown that the local scour is a complex phenomenon affected by several parameters related to flow characteristics, bed sediment characteristics, pier geometry characteristics, and time [4].
The control of local scouring around bridge piers has been the field of interest of many researchers, and several countermeasures have been developed and tested for this purpose. These countermeasures involve strengthening the bed soil against the erosive action of the flow (bed armoring devices/passive countermeasures) and reducing the erosive force of the flow (flow altering devices/active countermeasures). One of the popular countermeasures is the use of sacrificial piles upstream of a bridge pier. These piles of small diameter placed upstream of a bridge pier are found to reduce the local scouring around the pier by deflecting the high-velocity flow and creating a low-velocity wake region behind them. The effectiveness of these sacrificial piles in reducing the local scour depends on the number of piles, the size of the piles relative to the pier, the protrusion of the piles, and the geometric arrangement of the piles [5].
Laboratory studies on mitigating local scour around bridge piers by using sacrificial piles have been reported by several researchers in the past by adopting different shapes, sizes, flow parameters, and geometric arrangements of sacrificial piles. Ref. [6] conducted a laboratory experiment to study the effect of gap width and pile diameter on the efficiency of a single sacrificial pile placed in front of a bridge pier. Their results showed that when a single sacrificial pile was placed close to the pier (at 1D; D = pier diameter), the highest protection was obtained, while the result of increasing the pile diameter at the optimum distance of 1D was a reduction in the protection provided by the sacrificial pile. Ref. [7] conducted experiments using single sacrificial piles of different diameters placed in front of piers of diameters (D) 5 cm and 10 cm at the distance of 2D and 3D. According to their results, when the distance between piles and pier was increased, the countermeasure effect of sacrificial piles decreased for both pier sizes. In addition, the scour depth reduction effect of sacrificial piles increased with the diameter of the piles (d) up to d/D = 0.40, and a slightly decreasing trend was observed for d/D between 0.4 and 0.8. Ref. [8] studied the effect of blockage ratio (or sheltering area) on the efficiency of a group of sacrificial piles linearly arranged at a gap width of two times the pier diameter (D) in front of a circular cylinder. Their results showed that at a 60% blockage ratio using three piles, the scour-reduction efficiency was 32.2%, while at a 100% blockage ratio using five piles, the efficiency was reduced to 5.5%. Other values of blockage ratio and the effect of distance between sacrificial piles and the pier were not investigated. Ref. [9], from their experimental results, found that in the case of complex piers, three collinear piles in the transverse direction of a stream can provide better protection than other numbers and arrangements of piles, and the optimum distance for placing the piles was double the outer width of the complex piers. Ref. [5] conducted an extensive study using a triangular arrangement of sacrificial piles and found that a triangular configuration pointing upstream, with a distance of the apex from the upstream face of the pier equal to two times the diameter of the pier, a wedge angle equal to 30°, spacing between piles equal to 0.67 times the pier diameter, and a pile diameter equal to one-sixth of the pier diameter, resulted in a 56% reduction in the maximum scour depth around the pier for an aligned flow under clear-water conditions. Ref. [10] performed numerical simulations to evaluate the effect of the size and spacing of sacrificial piles from the pier on reducing local scour. They reported that maximum reduction was observed at distance X = 3.5D (D is the pier diameter) and pile diameter (d) = (1/3)D. Ref. [11] conducted an experiment on reducing local scour using permeable sacrificial piles and found that the scour depth around sacrificial piles itself can be significantly minimized by using permeable sacrificial piles, while the reduction in local scour around the pier was same as that of a solid pile. The optimum protection with a permeable sacrificial pile was observed when the pile was placed at a distance of three times the pier diameter. Ref. [12] undertook numerical and experimental research to determine how well sacrificial piles can work to reduce local scour around pile groups. Their results showed that sacrificial piles performed better when applied to protect a group of service piles than when applied to a single pier. Ref. [13] studied the effect of debris accumulation at sacrificial piles on the bridge pier scour and reported an increase in the local scour depth due to debris trapping.
In past studies, the relationship between the sheltering area and the distance between linearly arranged sacrificial piles was not fully established in the case of an isolated circular pier. The efficiency of sacrificial piles, linearly arranged in front of a pier, is likely to depend on the number of piles as well as on the gap width between piles and the pier. To obtain optimum protection from sacrificial piles, a proper understanding of these parameters associated with their functioning is essential. Although some studies can be found on the linear arrangement of sacrificial piles, they lack sufficient information to relate the effect of sheltering area and gap width to the scour-reduction efficiency. The present study aims to elucidate the relationship between sheltering area and distance (gap width) on the efficiency of a linearly arranged group of sacrificial piles in protecting a circular bridge pier against local scouring by changing both the sheltered area provided by the piles to the pier (i.e., pile numbers) and the distance of the pile group from the pier under clear-water conditions. A single-pier scour experiment was used as a control experiment, and sacrificial piles in emergent conditions were used. The percentage reduction in maximum scour depth using sacrificial piles under a variety of configurations was determined, and the effects of distance and sheltered area were analyzed and are herein presented. The results of this experiment are expected to help in better understanding the performance of linearly arranged sacrificial piles.

2. Materials and Methods

2.1. Experimental Facilities, Materials Selection, and Installation

Each experiment in this research was performed on a horizontal bed flume of 5 m length having a rectangular cross-section of 0.7 m × 0.5 m (channel width (B) × channel height (H)) and located in the hydraulic engineering laboratory at Saitama University, Japan. The sides of the flume were made of glass panels to facilitate observation during the experiment, and a 5.5 kW centrifugal pump (manufactured by Tokyo Ebara Corporation, Tokyo, Japan) recirculated water between a head tank and a sump tank attached to either end of the flume. A manually operated gate valve was used to control the flow into the channel, on which graduations were made to mark the desired openings. On the upstream and downstream parts of the channel, wooden false beds were placed to create a 2.355 m long and 18.4 cm deep recess in the middle part of the flume length for placing the sediment, as shown in Figure 1. A tailgate was mounted at the end of the downstream wooden bed to maintain the desired flow depth. Honeycomb grids were placed at the outlet of the head tank to minimize inflow turbulence, thereby ensuring smooth flow into the channel. An electromagnetic velocity meter (EVM) (manufactured by KENEK Co., Ltd., Tokyo, Japan) was used to measure the inflow velocity of the water in both streamwise and cross-stream directions up to an accuracy of +/− 2%. The device had a main unit VM2000 and detector unit VMT2-200-04P with an L-type probe. A laser displacement gauge (LK-500, manufactured by KEYENCE International, Osaka, Japan) was used to digitize the sand-bed level before and after each test. Scour depths at key points were confirmed using a point gauge. A mercury thermometer was used to measure the temperature of the water during the experiment, and the average water temperature was 24 °C.
In order to obtain maximum scour depth under clear-water conditions, experiments should be performed using non-ripple-forming sediments with median grain size d50 > 0.7 mm [14]. This is because sand particles smaller than that are found to form bedforms such as ripples, which reduce the scour depth. In addition, uniform sediments with geometric standard deviation of grain size ( σ g ) < 1.3 are recommended by [15] to avoid the armoring effect caused by sediment non-uniformity. Since the maximum scour depth for uniform sediment occurs near threshold conditions, the experiments should be performed with the mean flow velocity (V) slightly less than the critical velocity (Vc) corresponding to incipient motion of bed materials (0.9 < V/Vc < 1). In order to neglect the effect of flow deflections from the side walls of the flume, B/D ≥ 10 is recommended [16]. According to [4], scour depth reduces when D/d50 < 8 because, in that case, the bed sediments are significantly coarser compared to the pier size, while [17] found a reduction in scour depth for prototype-sized piers when D/d50 > 50. Hence, a value of D/d50 = 25 to 50 is recommended to neglect the influence of sediment coarseness on scour depth. For smaller values of y/D (y = flow depth, D = pier diameter), the surface roller weakens the downflow, and a value of y/D ≥ 2.5 is needed to neglect the flow shallowness effect on the pier scour experiments [18]. All these past results were considered while selecting experimental parameters for the present experiment.
Hence, the recess was filled with silica sand no. 4 (manufactured by Mikawa Silica Co., Ltd., Aichi, Japan) having a mean grain size (d50) of 0.87 mm and a geometric standard deviation (s.d.) of grain size distribution ( σ g = ( d 84 d 16 ) 0.5 ; d84 and d16 = grain size such that 84% and 16% particles are finer than that size, respectively) equal to 1.27. A constant flow depth (y) of 12 cm was selected for all experimental cases, and a wooden cylinder of diameter (D) = 4 cm was selected for the pier model considering the criteria for side wall effect, flow shallowness, and sediment coarseness parameters mentioned above. The selection of various parameters and dimensions is summarized in Table 1.

2.2. Flow Conditions

All the experiments in this study were performed under steady, uniform, subcritical, and turbulent flow conditions with a constant flow depth of 12 cm. Since the maximum scour depth for uniform sediments occurs at near-threshold conditions, first, the critical velocity causing the threshold of sediment motion was determined. The critical shear velocity (u*c) corresponding to the incipient motion condition was first approximated theoretically using Shield’s diagram. A useful approximation to Shield’s diagram for quartz sediments in water was given by [19] as follows:
u*c = 0.0115 + 0.0125 d501.4 (0.1 mm < d50 < 1 mm)
where u*c is in m/s, and d50 is in mm. The corresponding mean velocity (VC) was determined using logarithmic velocity distribution suggested by [15]:
V c u c = 5 75 log ( 5 53 y d 50 )
The theoretical calculation showed that the incipient motion condition was likely to occur at a flow velocity of 36.1 cm/s. For validating the theoretically obtained value of critical velocity experimentally, the 18.4 cm deep recess was filled by silica sand no. 4 without placing the pier model, and the sand bed was properly leveled. At the beginning of the experiment, the sand bed was fully saturated by applying a very small discharge without disturbing the sand grains. The tailgate was fully closed, and the flow depth of 12 cm was established without disturbing the mobile bed. The discharge into the channel was then gradually increased while maintaining the flow depth of 12 cm by adjusting the tailgate opening. The incipient condition of the sand grains was confirmed by visual observation. The average flow velocity at this stage was measured using an EVM. The EVM was always placed at a fixed distance of 40 cm from the beginning of the mobile bed, and the measurements were always made in the middle of channel section at mid-flow depth to avoid any errors due to the measurement location. Since the EVM readings fluctuated over time, the readings were recorded for 1 min duration and then averaged, with the average value calculated being 30.1 cm/s. This average velocity at which incipient motion was observed was lower than the theoretical approximation. This was probably because the theoretical calculation used the mean grain size for the approximation; however, the grains smaller than the average size started moving at a lower velocity. The value obtained from practical observation was selected as the critical velocity, as it was more accurate than the theoretical approximation. After that, the valve opening was slightly reduced, maintaining the flow depth so that the incipient motion condition of the sand grains was stopped. The valve opening was then marked for the rest of the experiments. At this valve opening, the average flow velocity was measured, and the average value was equal to 27.6 cm/s such that the flow intensity value (V/Vc), when calculated, was found to be 0.92. For the rest of the experimental cases, the valve opening was made exactly at that marking such that the average flow velocity was constant in all the experimental cases. By adopting a scale of 1:25, the flow conditions are summarized in Table 2 below. On the same scale, the pier diameter of 4 cm and the sacrificial piles of 8 mm diameter represented the prototype pier diameter of 1 m and the prototype piles of 20 cm diameter, respectively.

2.3. Single Pier Scour Experiments

The local scour experiment for a single pier without placing sacrificial piles was performed at a flow intensity of V/Vc = 0.92. The results of this experiment served as the control experiment for scour experiments with sacrificial piles. For this experiment, the pier model was placed in the middle of the mobile bed, and the sand bed was properly leveled. Very thin masking tapes were attached to the four faces of the pier model before placing it, to facilitate the scour depth readings during and after the experiment. The sand bed was digitized using a laser displacement gauge before the experimental run. The same procedure of increasing the flow discharge while maintaining the flow depth (as explained in incipient motion test above) was followed until the valve opening reached the previously marked position corresponding to the desired average velocity (27.6 cm/s). The flow velocity was confirmed from the EVM readings each time. The first test was performed for a total duration of 3.5 h, and the instantaneous maximum scour depth readings were recorded at 0.5, 1, 2, 3, 4, 5, 6, 7, 8, 9, 10, 11, 12, 15, 30, 45, 60, 90, 120, 150, 180, and 210 min. An inspection camera capable of working under water was used to record and read the instantaneous scour depth values from the graduated tape attached to the pier model. The device had a small camera fitted at the tip of a long cable, which was connected to the main component where visuals could be seen on a screen. The camera also facilitated a closer look at the scour process. The temporal scour evolution data showed that after 3 h, the increase in scour depth was very small, and hence, an experimental duration of 3 h was adopted for all the remaining experiments in this study. For all experimental cases, after 3 h, the tailgate opening was gradually reduced, and the valve was closed accordingly, maintaining the flow depth such that when the valve was fully closed, the tailgate was also fully closed. At the end, the tailgate was slowly opened to drain the water without disturbing the scour and deposition geometry. A perforated drainage pipe placed at the bottom of the sand bed was used to drain the water from the sand. Finally, the scour hole and deposition zone geometry were scanned using the laser scanner at 2 cm intervals along the length, and the scour hole profile and cross-section data as well as scour depths at key points were also taken using a point gauge for cross-verification. The graduated tape readings were also recorded.
To understand the effect of flow intensity on scour depth, more tests using flow intensity values of 0.88, 0.78, and 0.68 were also conducted, each for a duration of 3 h. Hence, the experimental cases with a single pier are summarized in Table 3 below.
In the naming of the experimental cases, “S” refers to the single-pier scour experiment, and the numeric value after it refers to the flow intensity at which the experiment was conducted. For example, “S-0.92” refers to the scour experiment with a single pier at flow intensity value of 0.92.

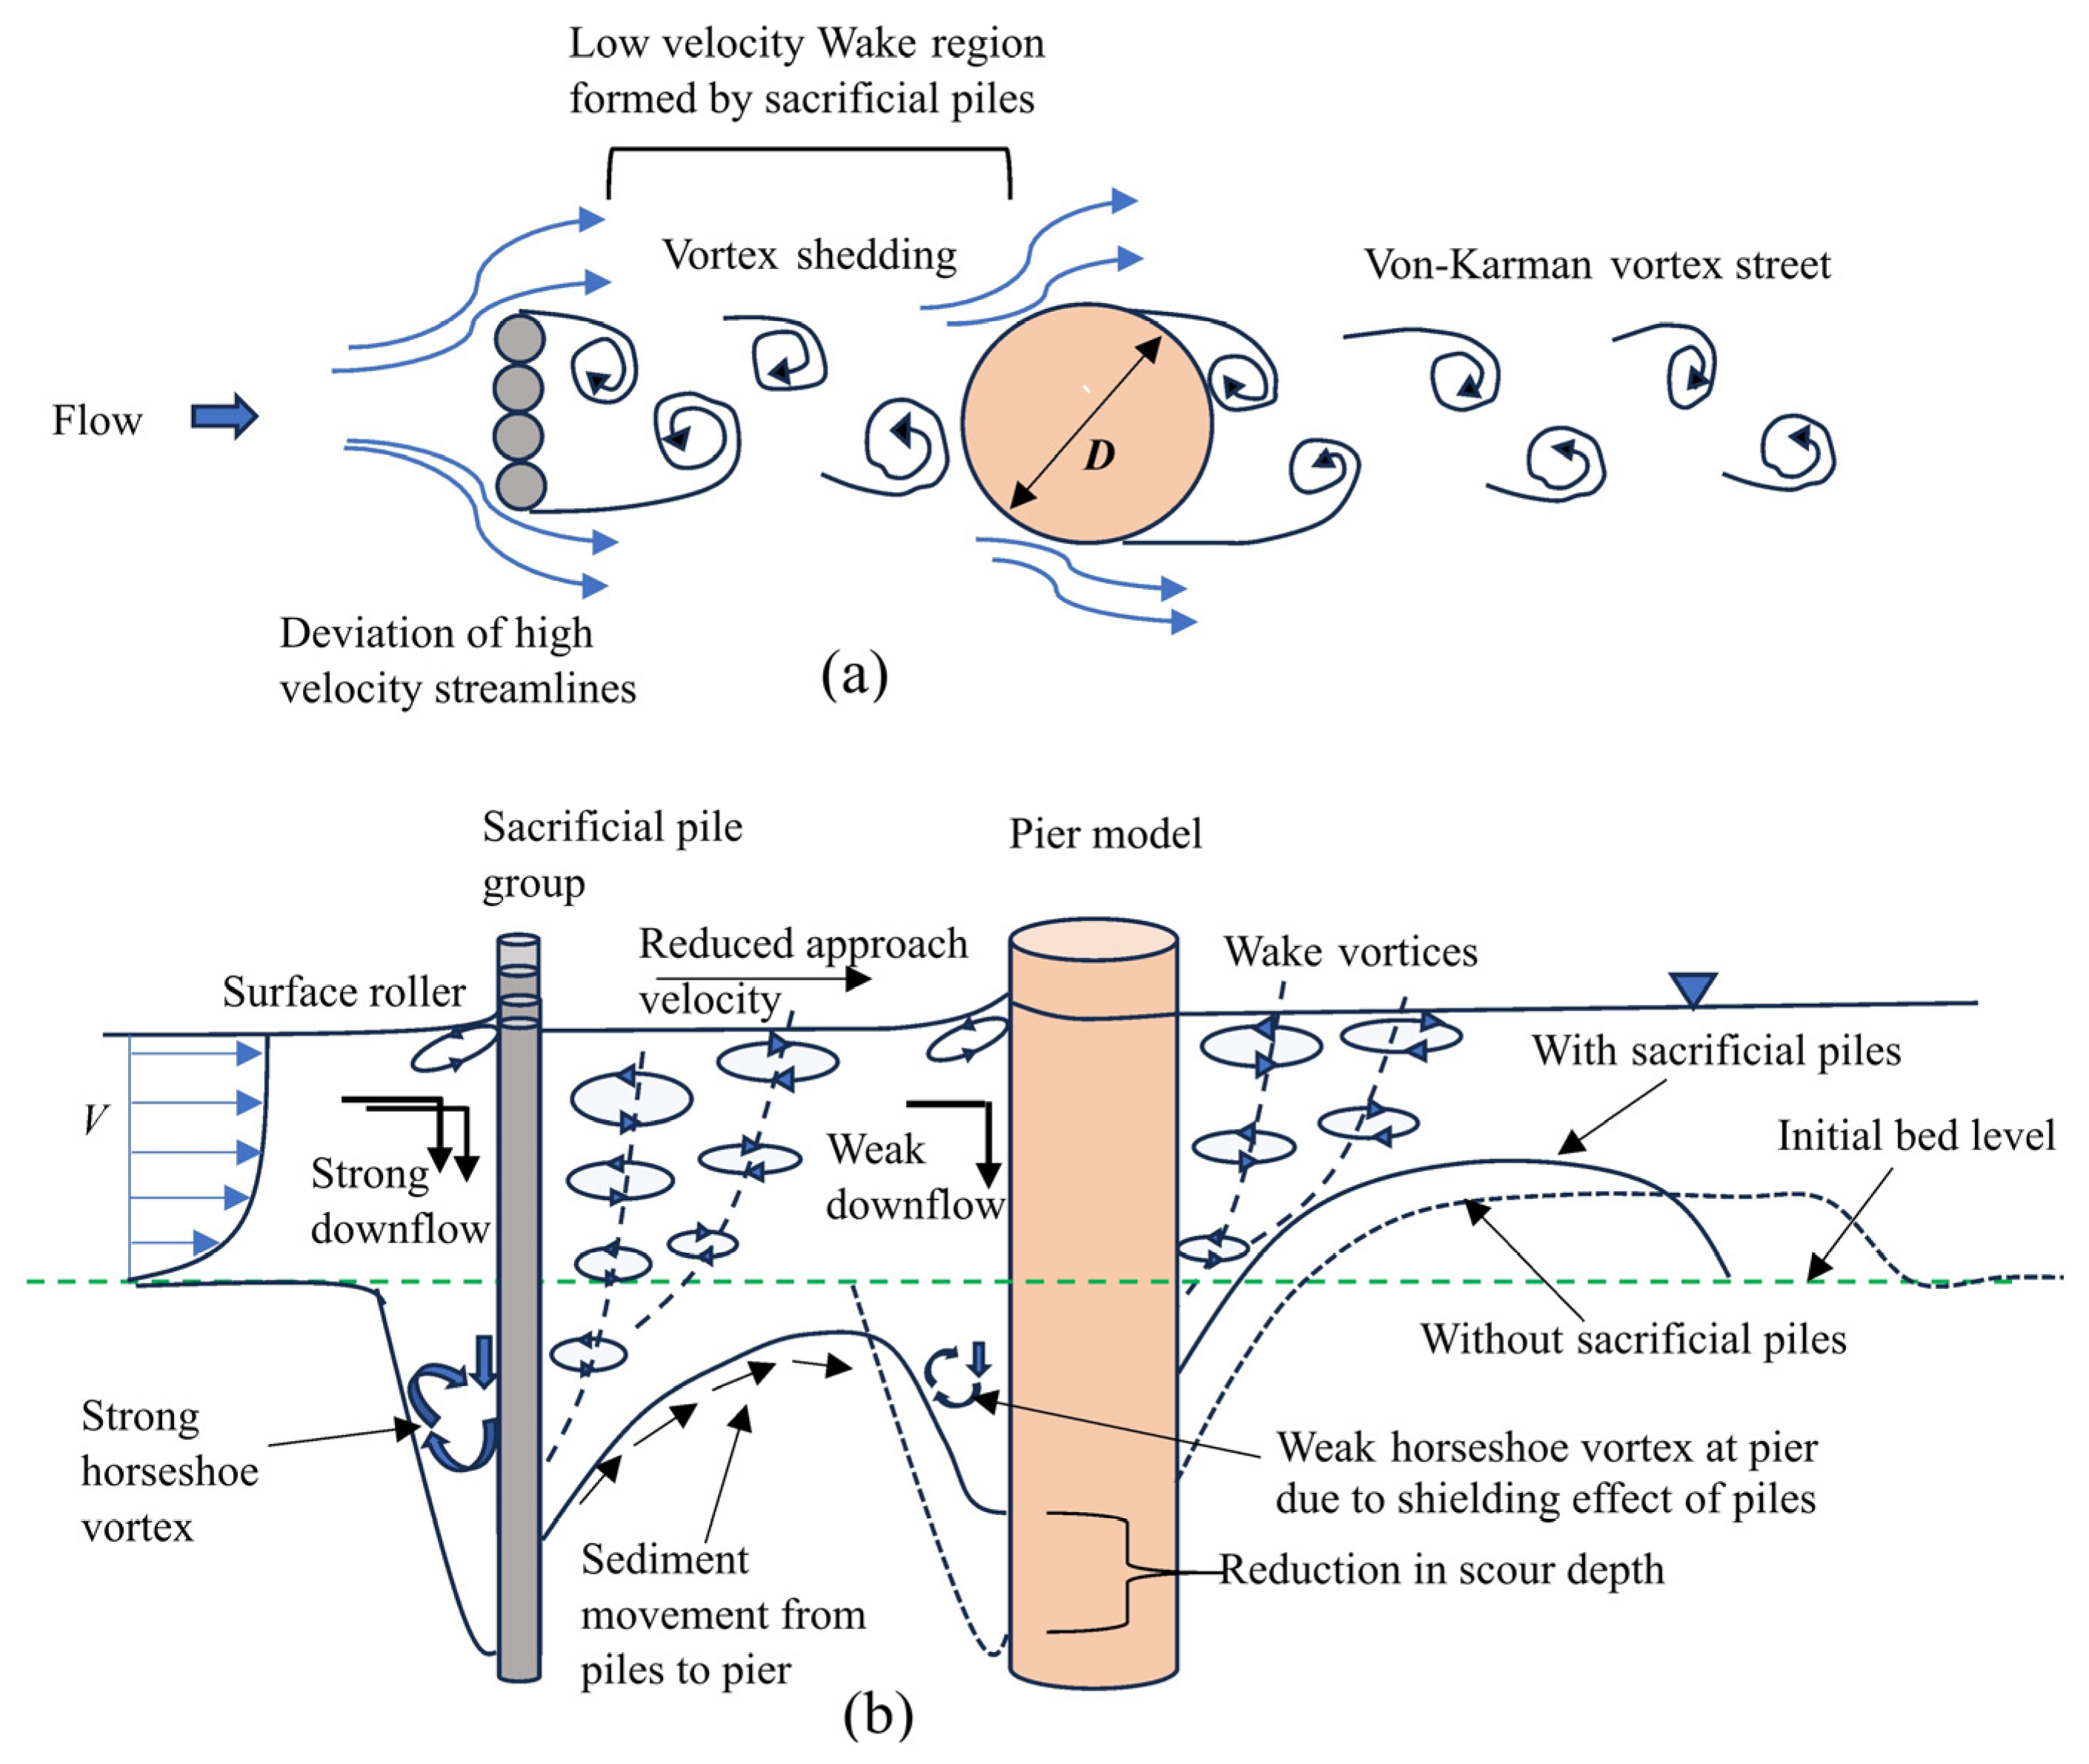
2.4. Scour Experiments with Linear Sacrificial Piles

Experiments were conducted by placing a linearly arranged group of sacrificial piles in front of the pier. Two main parameters associated with the sacrificial piles were varied: (a) the number of piles, i.e., N (or sheltered area, As), and (b) the distance of the piles from the face of the pier (X). In total, nine different cases consisting of a pier model protected by sacrificial piles were studied. All the experiments were performed at flow depth y = 12 cm and flow intensity V/Vc = 0.92, similar to the control experiment. The sacrificial piles were modeled by using 8 mm diameter wooden cylinders in emergent condition in all the experimental cases. The same experimental procedure that was followed in the case of a single-pier scour experiment was adopted. The efficiency of a sacrificial pile arrangement was determined in terms of % decrease in the value of the maximum depth of local scour near the pier with sacrificial piles in comparison with the maximum scour depth in the case of an unprotected pier in the control experiment (V/Vc = 0.92).
% efficiency (E) = 100 × (ds1ds2)/ds1
where
  • ds1 = maximum scour depth in the case of a single pier in the absence of protection;
  • ds2 = maximum scour depth at the pier with sacrificial pile configuration.
Figure 2 shows the general layout of the sacrificial pile arrangement.
The experimental cases that were performed with linear arrangements of sacrificial piles are presented in Table 4. Case 1 to case 9 were performed with sacrificial piles placed in front of the pier. Cases 10, 11, and 12 were performed with sacrificial piles only (without placing the pier) to have a better understanding of the scour and deposition characteristics of the linear arrangement of sacrificial piles.
The sheltering area (As) provided by the sacrificial piles is calculated as follows:
As = 100 × (N × d)/D
In the naming of the experimental cases, “L” refers to the linear arrangement of sacrificial piles; “P2”, “P3”, and “P4” refer to the number of piles used in the configuration; and “D”, “2D”, and “3D” refer to the distance of the piles from the upstream face of the pier. For example, the configuration name “L-P2-D” refers to a linear arrangement of sacrificial piles consisting of two piles placed at a distance D from the upstream face of the pier.

3. Results and Discussion

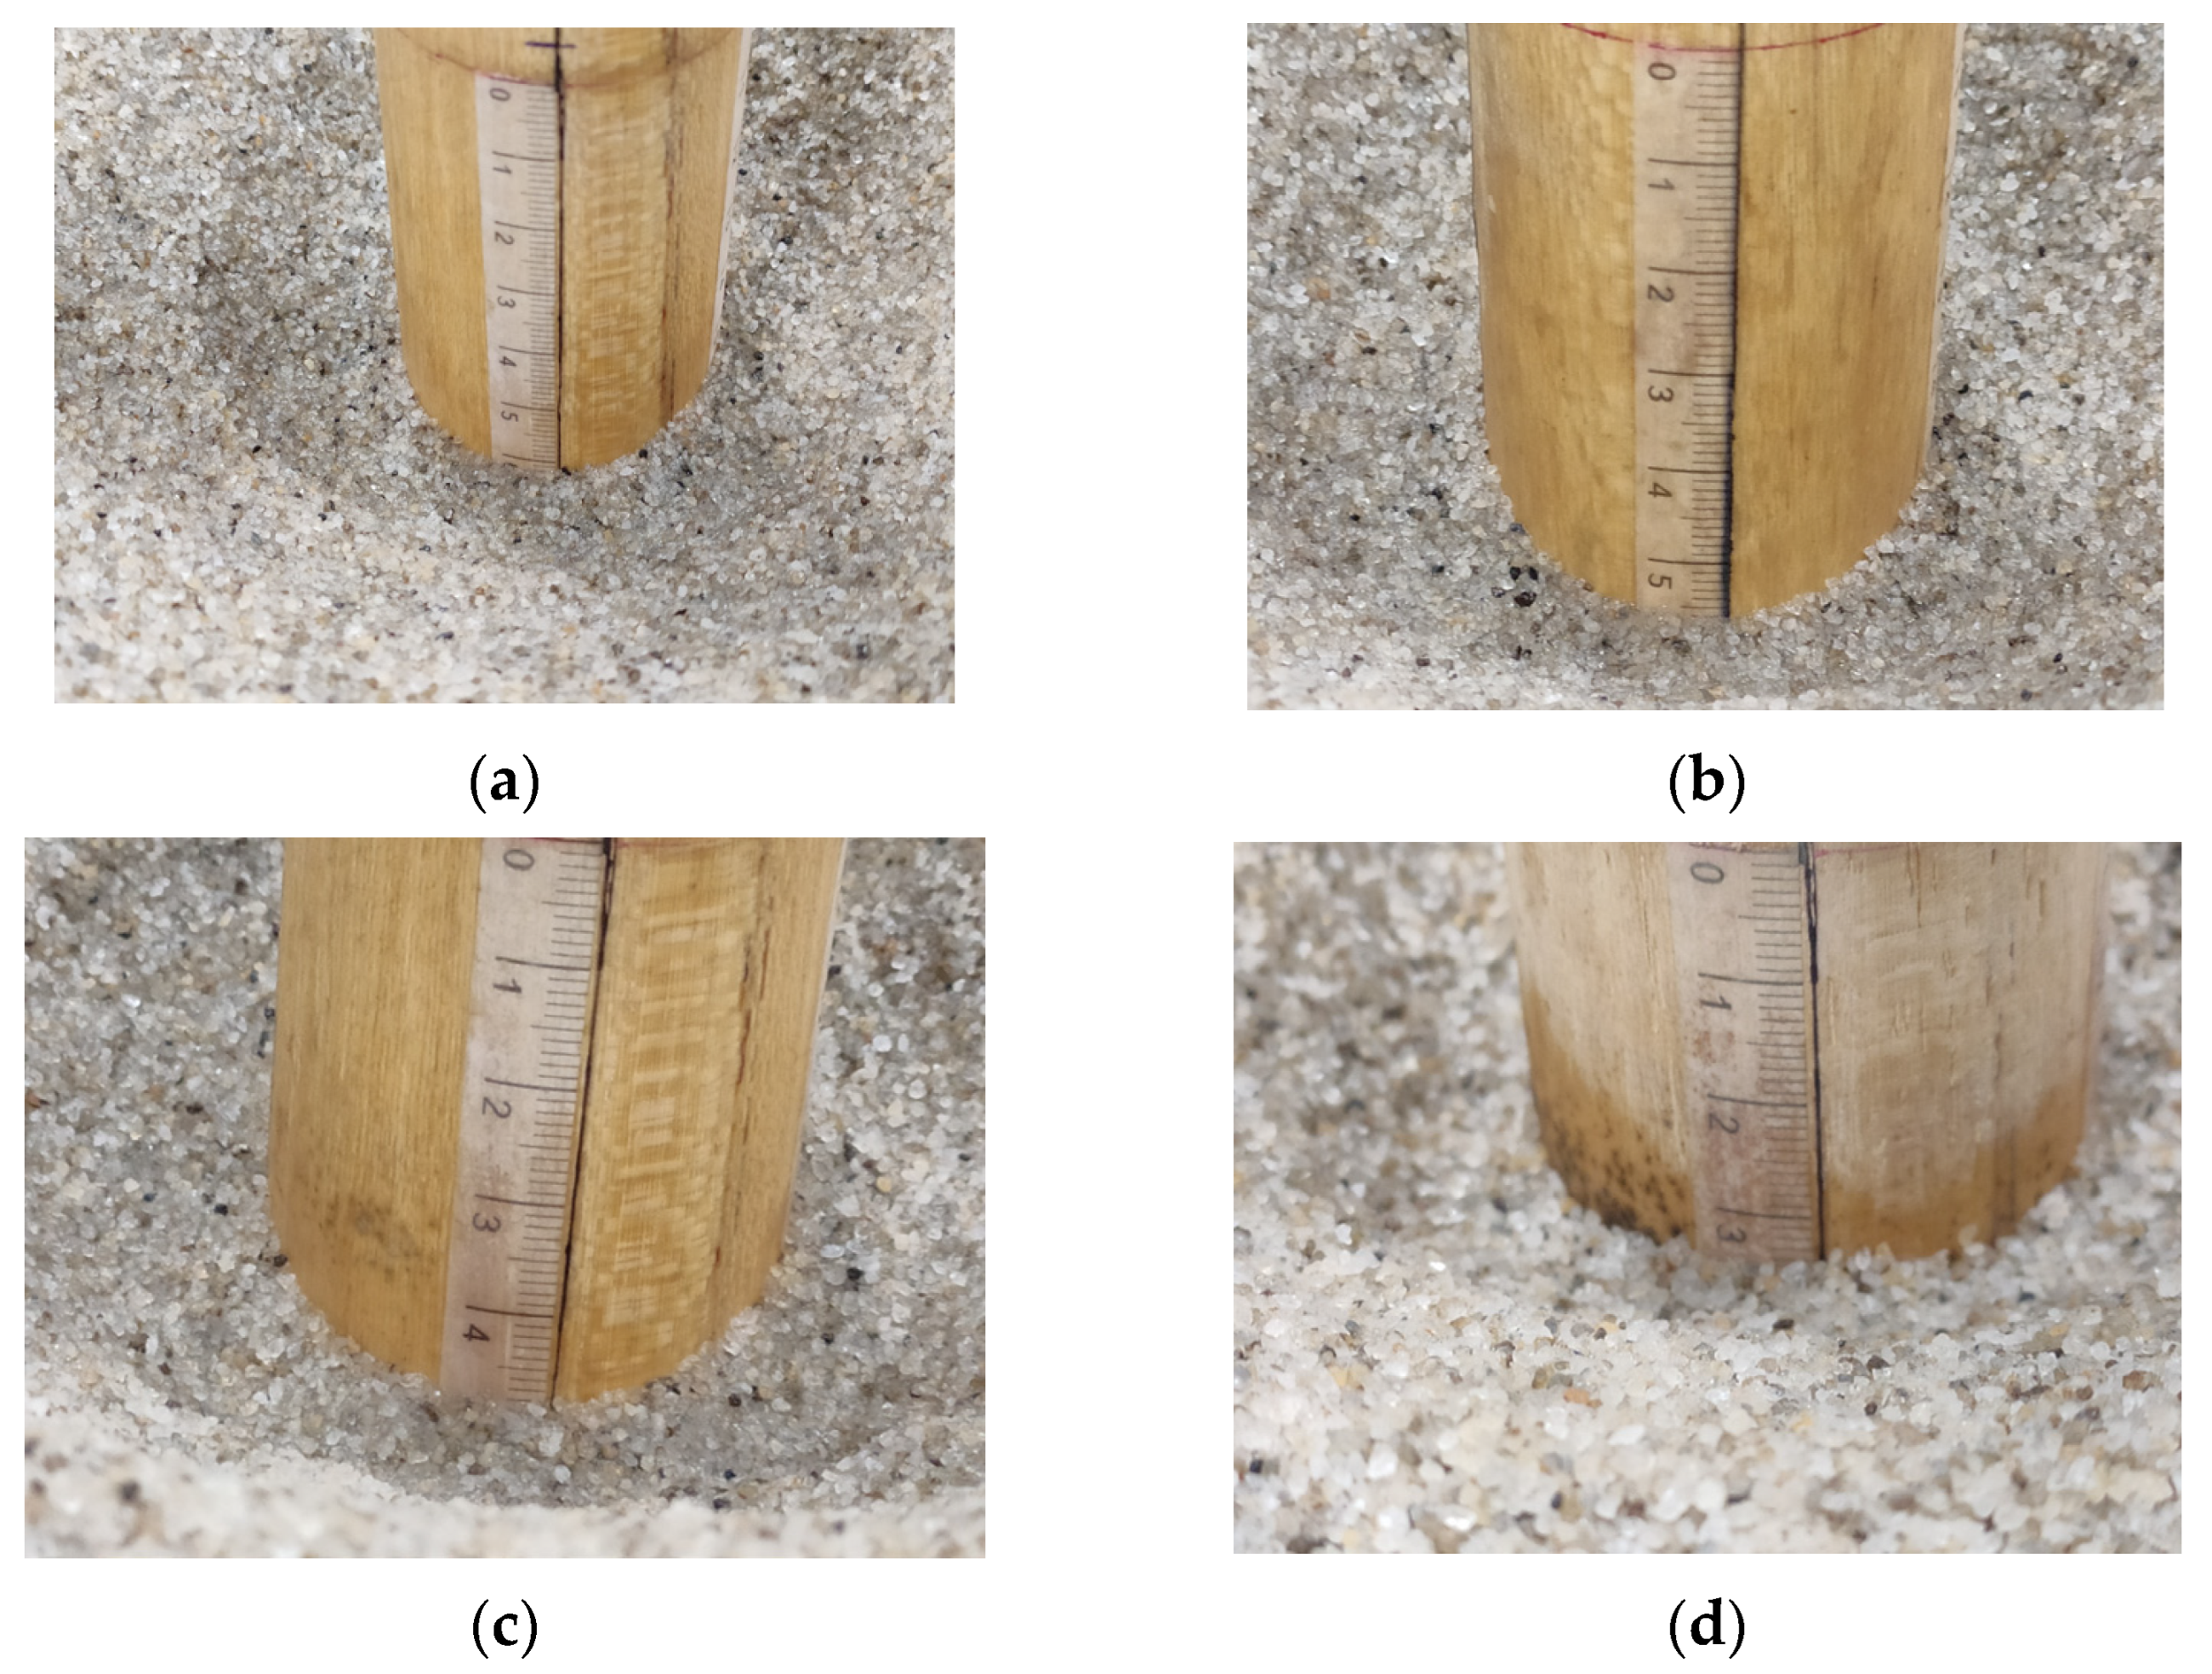
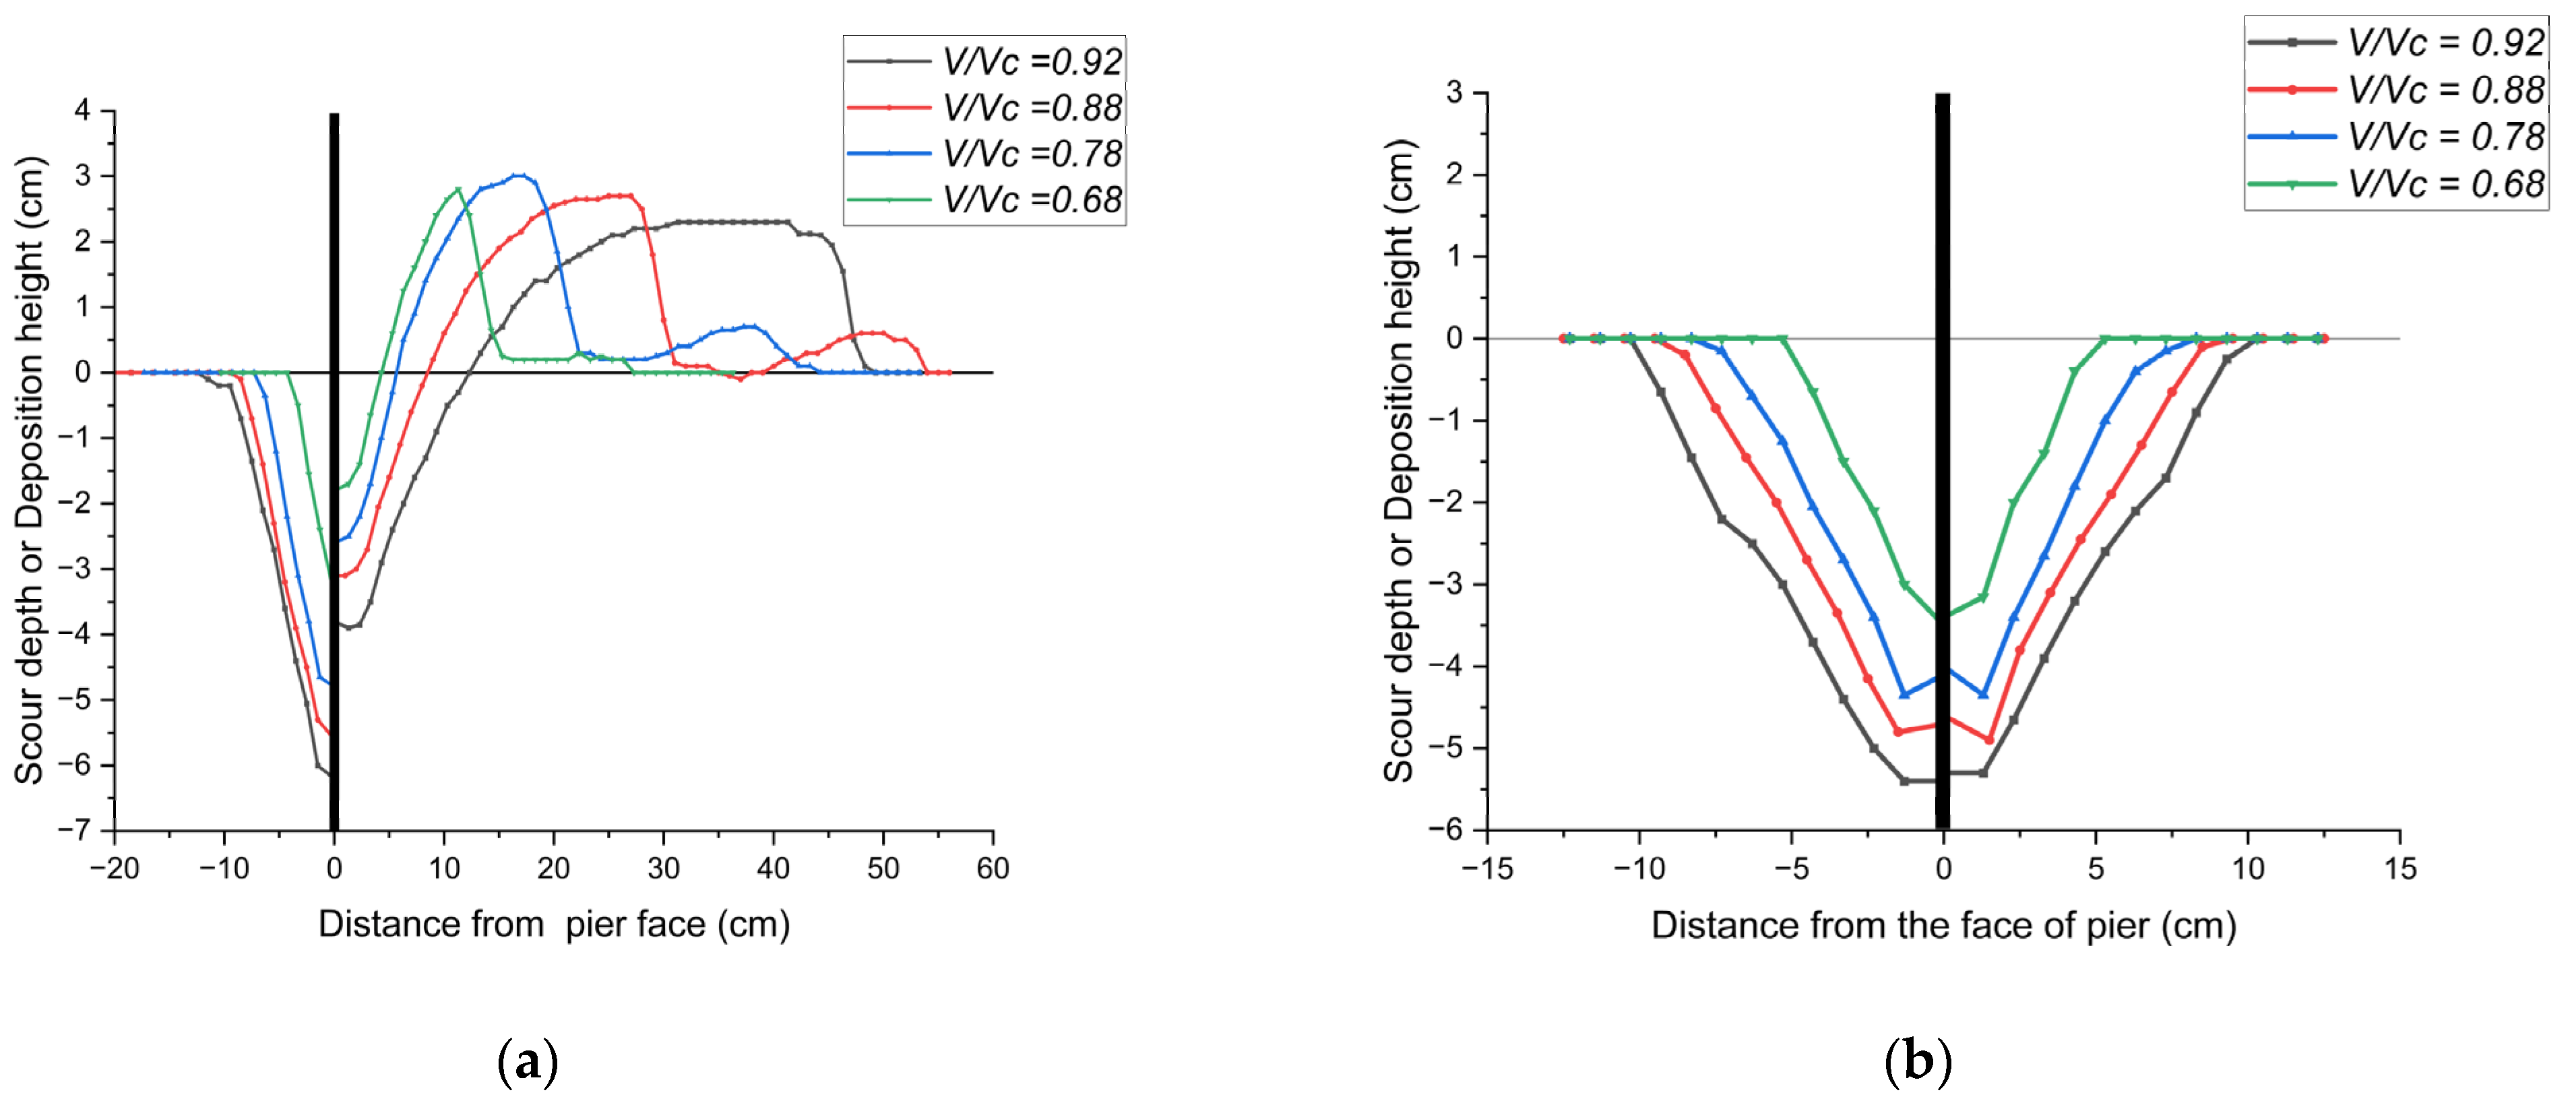
3.1. Single-Pier Scour Experiments

Figure 3 illustrates the outcome of the temporal scour evolution test for a single pier. From the plot, it can be seen that there was a rapid development of a scour hole during the initial period, and about 80% of the maximum scour depth was attained in the first 30 min. Results also show that after 3 h from the beginning of the experiment, the increase in scour depth was very small. During the experiment, the first sign of movement of bed material was seen behind the pier due to the lee-wake vortices. However, the formation of the scour hole began once the horseshoe vortex was formed. The horseshoe vortex stretched from the sides to the front of the pier, and there was a rapid growth in scour depth at the front. A rapid entrainment of the bed materials due to the formation of a horseshoe vortex was observed, and the scour hole increased in all three dimensions. With the increase in scour depth, the strength of the horseshoe vortex gradually decreased, due to which there was a fall in the rate of expansion of scour hole as time elapsed. Finally, the horseshoe vortex was no longer capable of removing a significant volume of bed materials, and equilibrium was assumed to be reached, although the scouring never stopped. The lee-wake vortices, formed behind the cylinder as a result of the horizontal separation of the boundary layer, acted like tornadoes, lifting the bed particles from behind the pier by suction action, resulting in sediment entrainment into the main flow. The entrained bed materials were then carried downstream due to the periodical vortex shedding behind the pier and deposited in the wake zone at the back of the pier, forming a dune. The size of the dune behind the pier increased with time as the total volume of scoured materials increased over time. The wake vortices were also responsible for the expansion of the scour hole behind the pier. During the scour process, the horseshoe vortex was the most dominant feature and acted at the front toe of the pier, and hence, maximum scour depth was observed near the front face of the pier. The wake vortices, due to their lower strength, acted mostly on displacing the entrained sediment, and consequently, scour depth was minimum at the back of the pier. Due to symmetry of the arrangement, the scour depths at the two sides of the pier were almost equal.
After the temporal scour experiment, a single-pier scour experiment of 3 h duration at flow intensity V/Vc = 0.92 was conducted as a control test for sacrificial pile scour experiments based on the result of the temporal scour evolution experiment. Additional single-pier tests were conducted at three additional flow intensities (0.68, 0.78, and 0.88) to study the effect of flow intensity on scour depth. From the experiment, it was found that the depth of local scour varied linearly with flow intensity. The higher the flow intensity, the greater the scour depth and longer the deposition length behind. This was because the strength of the horseshoe vortex depends directly on the inflow velocity. During the analysis, the maximum scour depths were determined by two methods: (a) from the graduated tape pasted directly on the pier face and (b) by analyzing the data obtained from the laser scanner. In general, the maximum scour depth obtained after processing the data obtained from the laser displacement meter was slightly higher than the graduated tape readings because maximum scour depth was usually found to be located at a small distance away from the pier face rather than exactly at the pier face. The higher value of the scour depth readings obtained from graduated tape and laser scanner was recorded as the maximum local scour depth. The maximum scour depth results are tabulated in Table 5.
The final scour depth readings from the graduated tape are shown in Figure 4.
The scour hole profile and cross-section data from the single-pier scour experiment were plotted and are presented in Figure 5.
The variation of maximum scour depth with flow intensity and the contour diagram of scour and deposition geometry are presented in Figure 6.
In Figure 6b, XX represents the streamwise direction (cm), YY represents the cross-stream direction (cm), and ZZ represents the vertical direction (cm). The dotted contour lines represent points of equal scour depth below the original bed level, while the solid contour lines represent points of equal deposition height above the original bed level. In addition, the size (length and width) of the scour hole as well as the length and width of the deposition can also be observed from the contour diagrams. The larger white circle represents the position of the pier model, while small black circles represent the position of sacrificial piles.

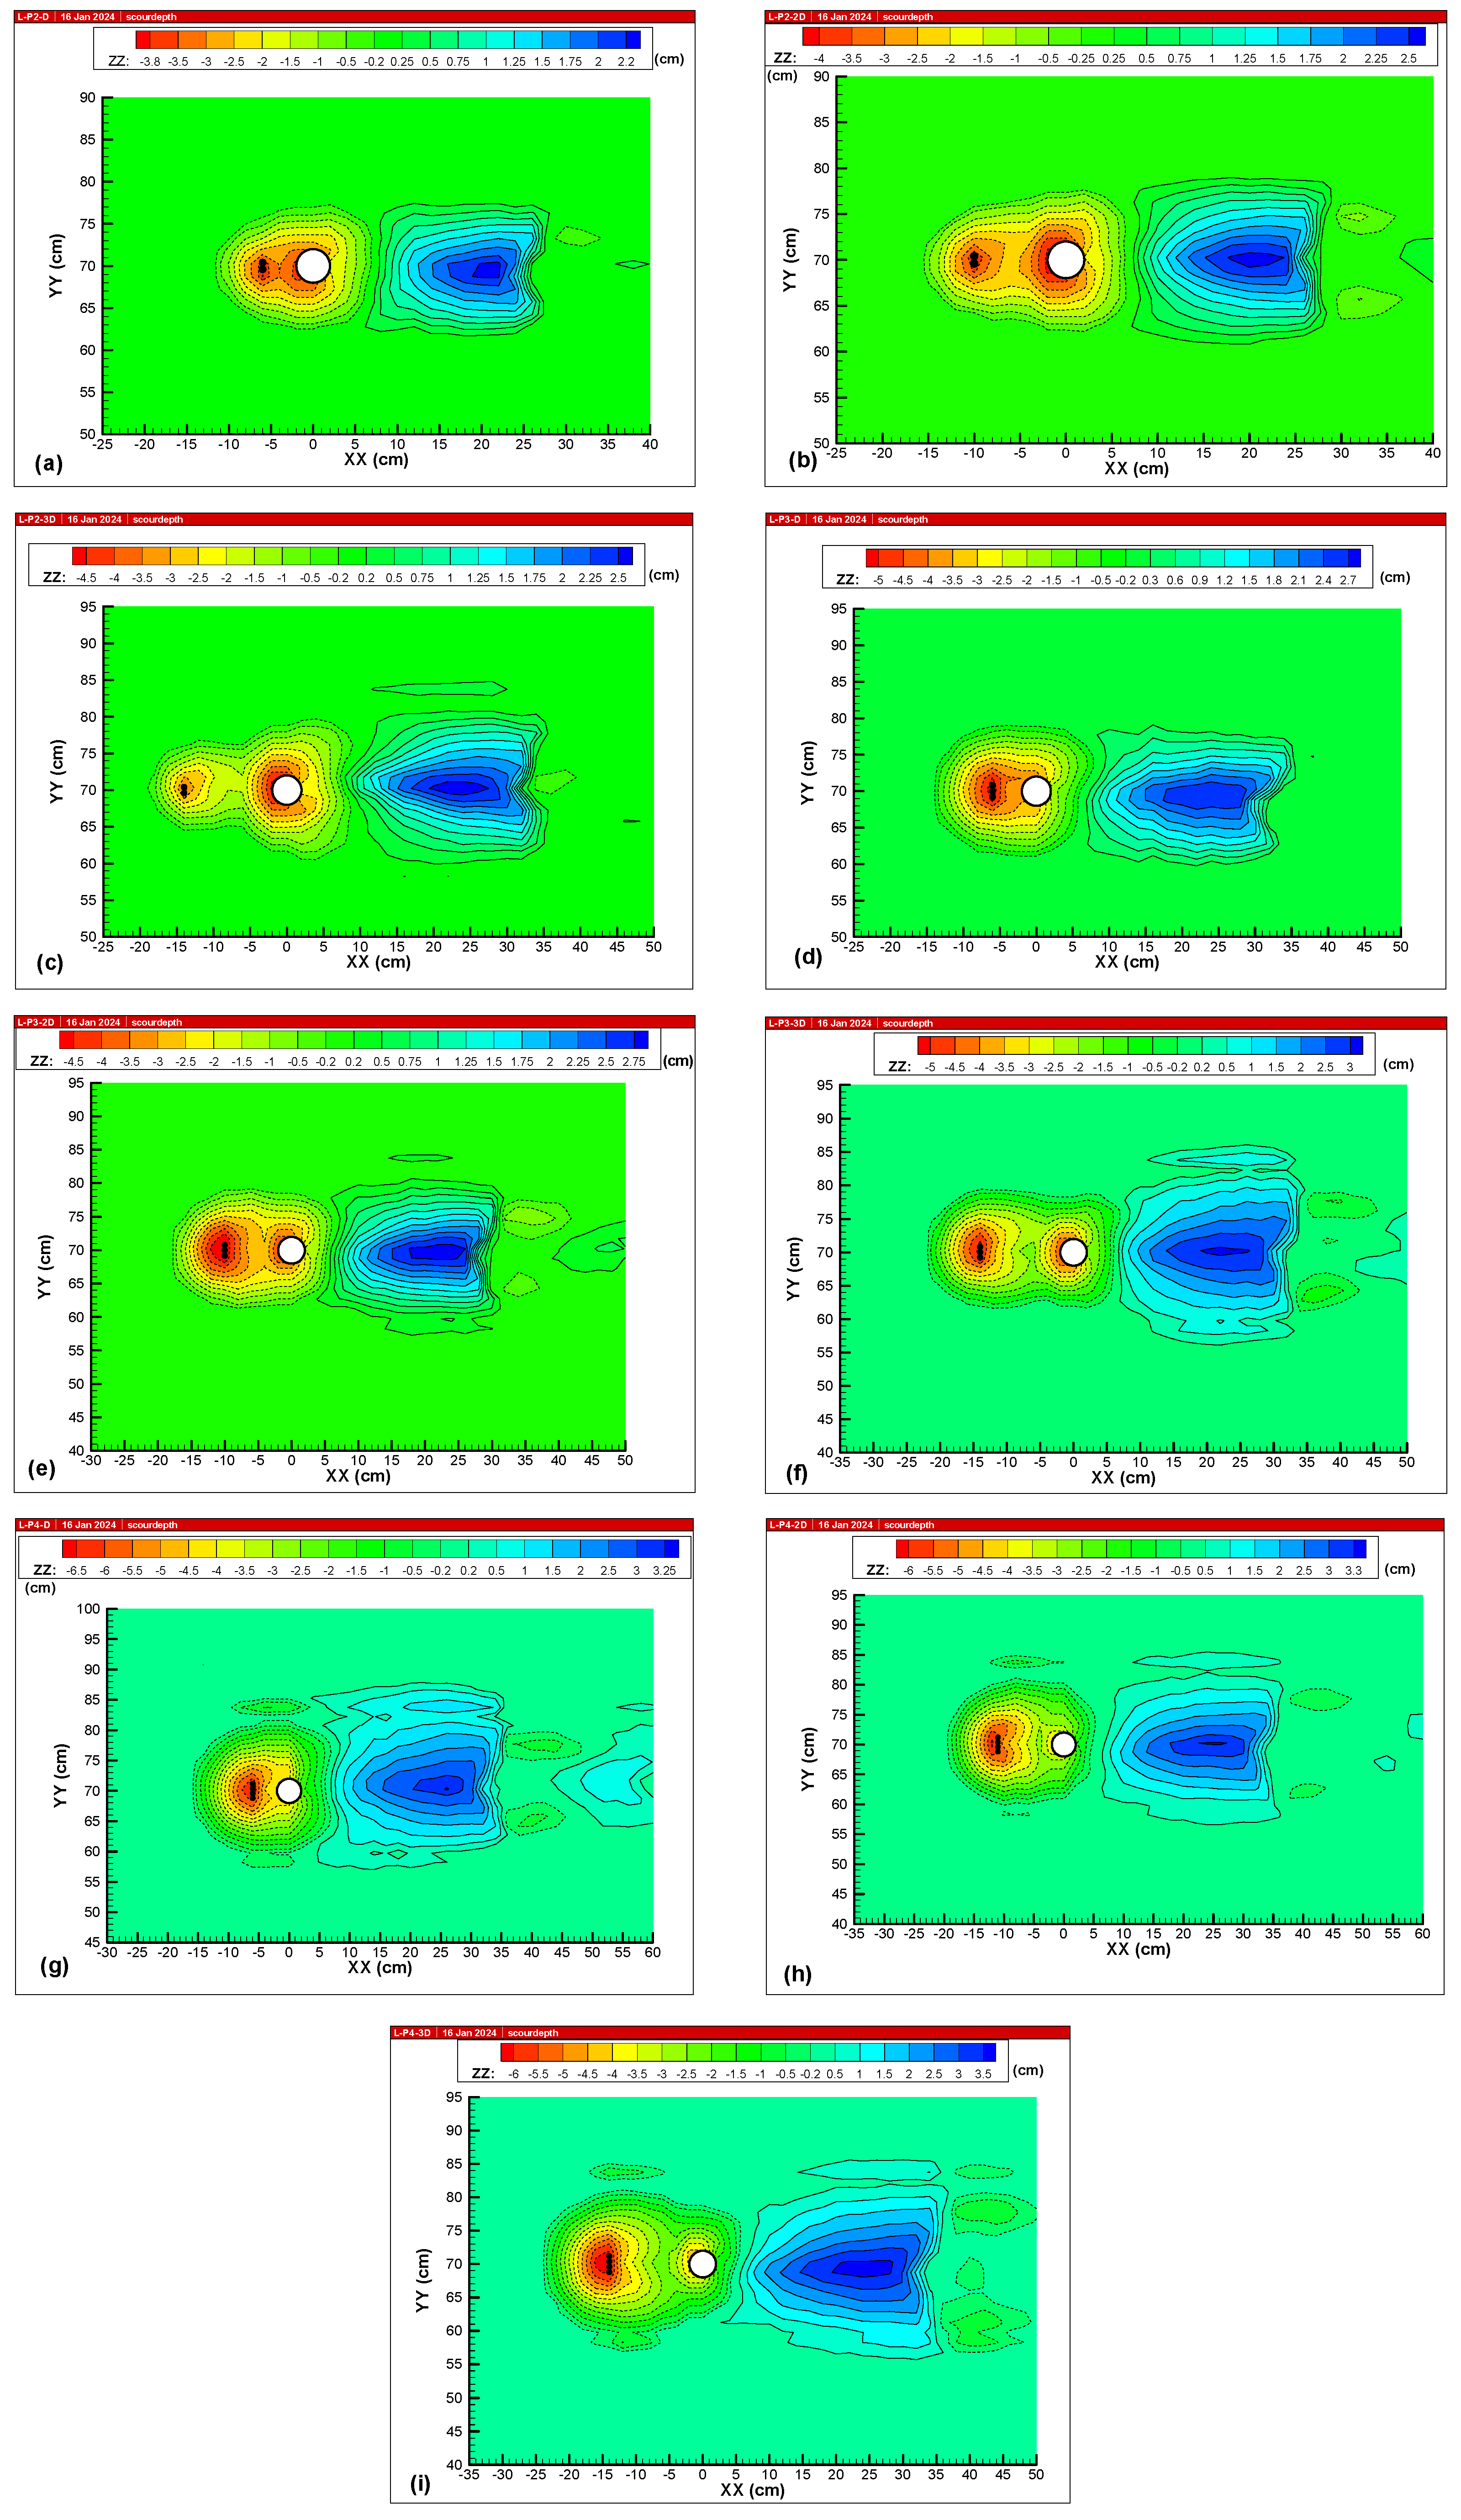
3.2. Linear Sacrificial Pile Scour Experiments

Experiments were conducted by placing sacrificial piles in a variety of configurations in front of the pier for protection against local scouring. Sacrificial pile configurations were made by varying the number of piles and the distance between piles and the pier, and the experimental cases are listed in Table 6. When the approach flow reached the sacrificial pile group, it was obstructed, and a local flow field was generated around the sacrificial pile group due to three-dimensional boundary-layer separation. The horseshoe vortex at the front toe of the piles and lee-wake vortices on the rear side of the piles acted together, forming a local scour hole around the pile group. The size of the scour hole around the piles increased with an increase in the number of piles as more flow was obstructed, and consequently, the size and strength of the horseshoe and wake vortices also increased. Due to the formation of a wake region behind the piles, the flow velocity was substantially reduced behind the piles. Due to this reduction in velocity, the strength of vortices (horseshoe and wake) forming at the pier located in the wake region behind the piles was also reduced. This is called the shielding effect of sacrificial piles. The shielding effect depended on the number of sacrificial piles as well as on the distance between the pier and the piles, and thus, a varying protection effect was observed for different configurations of piles.
In addition to the shielding action, another action of piles was also observed during the experiment. The bed materials scoured from around the piles were carried downstream by the turbulent eddies shedding from the piles before being deposited at some distance behind the piles. When a pier was located behind the piles, the scoured bed materials reached the pier scour hole and filled it partially, due to which the scour depth around the pier was reduced. This sediment flux from piles depended on the number of piles installed. The higher the number of piles, the higher the sediment flux due to the increased scouring around the piles. The amount of sediment reaching the pier was affected by the gap width between piles and the pier. This was also a reason for the varying efficiency of sacrificial piles observed in the experiment under different configurations.
A schematic diagram showing the mechanism of local scour in the case of linear sacrificial piles scour experiment is presented in Figure 7.
The results of the sacrificial pile scour experiments were compared with the single-pier scour experiment at V/Vc = 0.92. In all sacrificial pile experiments, the maximum scour depth around the pier was less than that of an unprotected pier, thus justifying the protection provided by the sacrificial piles to the pier. However, it was observed that the linear arrangement of piles itself was subjected to substantial scour. The scour depth in front of the piles also exceeded that in front of the pier in many cases tested, particularly when the number of piles was high. The efficiency of each arrangement in reducing the maximum scour depth around the pier is presented in Table 6 in terms of % reduction in the maximum depth of local scour around an isolated bridge pier without the protection of sacrificial piles.
The above calculations were performed based on the maximum scour depth of 6.2 cm recorded in the test of an unprotected, single pier. From the results, it was seen that the highest protection was obtained when two piles were linearly arranged in front of the pier at distance D (i.e., L-P2-D), while the least protection was obtained when the same was placed at distance 3D (i.e., L-P2-3D).
Scour and deposition profiles for all the experimental cases were plotted, and the variations in maximum scour depth with change in sheltered area (As) and spacing between piles and pier (X) were also plotted, which are presented in Figure 8.
Figure 8b shows the importance of the number of piles (or sheltering area) for a given X/D value. From the results, it can be concluded that when the sacrificial pile groups are placed close to the pier (at distance D), the maximum scour depth at the protected pier is likely to rise with a rise in the number of sacrificial cylinders (or sheltered area). This is because when the number of piles was increased, the size and strength of the wake vortices behind the piles increased significantly, which caused a deeper scour hole to be formed behind the piles due to the higher entrainment of the sediments into the flow. When the number of piles was high, and the piles were placed close to the pier (at D), the gap width was directly under the influence of those strong wake vortices, and the bed materials in the gap width were eroded by the recirculating flow, which were then transported downstream of the pier. In addition, the strong wake vortices caused high turbulence in the small gap width, which did not allow the scoured materials from around the piles be deposited in the pier scour hole; rather, they were transported downstream from the sides of the pier. Due to this action, the bed material in the gap width eroded over time, resulting in an increased scour depth in front of the pier. This shows the adverse effect of placing a large number of piles close to the pier. On the other hand, when a small number of piles (two piles) were placed at distance D, the wake vortices behind the pile group were small in size, which were not able to scour the vicinity of the pier and were also able to reduce the flow velocity behind them for the desired shielding of the pier. In addition, the materials scoured from the piles fed the scour hole around the pier properly. On the contrary, the scenario was opposite in the case of three and four piles, where the gap width D was insufficient to avoid the ill effect caused by the increased size of the wake vortices, as explained above. However, if the pile groups are placed far from the pier (at distances of 2D and 3D), the maximum scour depth around the pier decreases with an increase in the number of piles (or sheltered area). This is because when the distance between the piles and the pier was larger (2D and 3D), the wake vortices behind the piles could not affect the bed in the vicinity of the pier directly, as in the case when the gap width was D, and the scouring around the pier was primarily due to the horseshoe vortex formed in front of the pier. When the number of piles is increased, the size of the wake region behind the piles also increases, due to which the pier is subjected to a low-velocity near-wake region. As the flow velocity increases in the streamwise direction along a wake region, a pier located in a near-wake region will have a weaker horseshoe vortex. In addition, the volume of scouring around a higher number of piles is also higher. This increases the volume of scoured materials reaching the pier compared with a smaller number of piles. In the case of a small number of piles, the volume of scoured materials from around the piles is also small, which is mostly deposited in the gap width, and hence, fewer materials reach the pier scour hole. Due to this reason, the variation in scour depth with sheltering area showed an opposite trend at 2D and 3D compared to the case when the piles were located at distance D. From the slope of the plots, we can conclude that when the spacing between piles and the pier was 2D, the protection offered by the piles was the least sensitive to the change in sheltered area, while it was more sensitive to the sheltered area at lower and higher values of spacing (at D and 3D).
Figure 8c shows the importance of the distance between the pile group and the pier for a given value of the sheltered area (or pile numbers). For lower values of the sheltered area (40% and 60%), the protection provided by the pile group tended to decrease as the distance increased. This is because when the distance between piles and the pier increases while keeping the number of piles constant, the pier is subjected to a higher approach velocity as it shifts from the near-wake region to the far-wake region of the piles. In addition, when the distance is increased, materials scoured from around the piles are mostly deposited in the gap width, and hence, a smaller volume of scoured materials reach the pier scour hole to fill it. Due to this reason, the pier placed close to the piles (at distance D) experienced less local scouring in the current experiment. However, for 80% sheltering (four piles), the strong wake vortices directly influenced the pier at distance D, and hence, protection was better when the pier was placed outside the direct influence zone of the wake vortices. In this experiment, the optimum protection was observed at X = 2D. From the slope of the plots, it can be concluded that the efficiency of piles in reducing the depth of local scour was highly sensitive to the spacing between the piles and the pier for lower sheltering conditions, which decreased as the sheltered area was increased.
The scour and deposition contours for all sacrificial piles and pier arrangements are presented in Figure 9.
The contour plots of linear sacrificial piles only (without placing the pier), i.e., cases L-P2, L-P3, and L-P4, are presented in Figure 10. Pier locations were placed on the resulting contour diagrams to understand the effect of sacrificial piles. The purpose of these cases was to understand the scouring and deposition patterns around the piles.
From Figure 10, it can be seen that when the pier is located in the outer region of the scour zone of sacrificial piles, the maximum scour depth around the pier tends to reduce, and when the pier is placed in the inner region of the scour zone or outside the scour region (or in the deposition zone) of the piles, the highest scour depth in the vicinity of the pier tends to increase.
The results obtained in this experiment for lower sheltering (40% and 60%) conditions are consistent with the results obtained by [6] in their scour experiments using a single sacrificial pile. Ref. [6], in their study, concluded that the optimal gap width for scour reduction using a single sacrificial pile (d = 1 cm) in front of a circular pier (D = 5.6 cm) as 1D, for which the scour-reduction efficiency decreased as the gap width increased. In the present experiment, the highest protection was observed at 1D in the cases of two and three piles, and the efficiency was reduced as X increased. Ref. [20], in their numerical simulations, also concluded that the closer the sacrificial pile to the pier, the higher the protection efficiency. Ref. [7] also reported a higher percentage of scour depth reduction at the pier when a single sacrificial pile was close to the pier. In their experiment with the tandem arrangement of bridge piers, [21] also mentioned a reduction in the shielding effect when the spacing was increased beyond 1D. These results conclude that the closer the sacrificial pile to the pier, the better the protection against local scouring. This is because when the pier was close to the sacrificial piles, the pier was in the low-velocity wake region formed by the piles, resulting in a weaker horseshoe vortex in front of the pier, while it was exposed to higher approach velocity when placed at larger distances. In addition, more scoured materials from around the piles reached the pier scour hole when the piles were placed close to the pier.
However, protection against local scouring is not only governed by the gap width but also by the size of the pile group (sheltering area). The scouring around the piles itself is another important factor, which depends on the overall size of the pile group. In the experiment of [6], when they increased the diameter of the sacrificial pile and kept the gap width equal to the optimum value 1D, the protection decreased with increase in the sacrificial pile diameter. This result is consistent with the results obtained in the present experiment at X = 1D. The size and extent of scouring around the pile group increased with the increase in the number of piles. In the linear arrangement of piles in the present study, substantially high scouring around the piles was observed, particularly in cases with a larger number of piles. When the number of piles was increased while keeping the piles close to the pier (at 1D), scour depth increased sharply around the pier, which was similar to the findings reported by the previous studies. This is because the stronger wake vortices directly affected the gap width region, resulting in scouring in front of the pier.
From the above discussions, it can be concluded that the spacing between sacrificial piles and piers should be small enough for the pier to be located within the low-velocity wake region formed by the piles (particularly in the near-wake region), while it should be large enough to avoid the high-turbulence recirculation zone behind the piles eroding the materials from the vicinity of the pier. Taking these into consideration, it can be concluded that the optimal gap width for a linear arrangement is 1D for sheltering areas below 60%, and the gap width should be increased for higher sheltering conditions to avoid reduced efficiency caused by the increased size of wake vortices behind the piles. In their study, [8] concluded that increasing the sheltering area from 60% to 100% in the case of linearly arranged sacrificial piles upstream of a circular cylinder at 2D yielded a sharp rise in the depth of the scour hole, suggesting that the gap width of 2D was insufficient for a 100% sheltering condition. Comparing this with the results of the present study, 2D can be considered the optimal gap width for more than 60% to around 80% sheltering conditions, and the gap width should be increased further for higher sheltering conditions (above 80%).

4. Conclusions

An experiment at model scale was carried out in this investigation for the purpose of studying the performance of sacrificial piles linearly arranged in a group ahead of a bridge pier on minimizing local scour phenomena in proximity to the pier. Sacrificial pile configurations with three different values of sheltering area to the pier were tested for three different values of distance between piles and the pier. A single pier without the protection of sacrificial piles was tested as a control experiment. Piles-only cases without placement of the pier were also tested. After conducting a number of experiments for the current investigation, the following results were drawn:
  • Sacrificial piles linearly arranged in front of a circular bridge pier are effective in controlling the local scour around bridge piers. In the present research, their efficiency in controlling the maximum depth of local scour around the pier ranged between 25.5–41.6%;
  • A configuration consisting of two piles placed at distance D was found to minimize the local scour depth in proximity of the bridge pier to the highest extent (41.6%), while the least protection was achieved when two piles were placed at a distance of 3D (25.5%);
  • The closer the sacrificial piles to the pier, the better the protection. However, piles should be far enough apart to avoid the scouring effect of the recirculation zone behind the piles. The selection of the optimal distance depends on the sheltering area (or the number of piles);
  • The efficiency of linearly arranged sacrificial piles depends on both the gap width (X) and the sheltering area (As). A gap width of 1D is suggested for sheltering areas below 60%, while 2D is suggested for sheltering areas around 80%, and a higher gap width is suggested for sheltering areas above 80%.
In this study, experiments were conducted using a circular pier and emergent sacrificial piles under steady, uniform, turbulent, and subcritical flow conditions on a uniform, cohesionless sediment bed. The sheltering area values of 40%, 60%, and 80% with the distance between piles and pier (X) values of D, 2D, and 3D were adopted. Due to the limitations of available facilities and materials, the results of this experiment may have suffered some inherent scale/size effects (to some extent) associated with laboratory flume experiments of local scouring, as stated by [18]. However, the authors of this study tried to minimize this by following the suggestions provided by past researchers [4,8,14,15,16,18] during the selection of experimental parameters (explained in Table 1) and believe that the results are a closer representation of the actual phenomenon occurring in the field, thereby providing a sufficient idea about the efficiency of sacrificial piles. Considering the availability of experimental facilities and materials, future experiments using prototype-sized models, leading to more accurate geometric similitude between model and prototype, are recommended for higher accuracy in the assessment of local scour depths. In addition, the efficiency of sacrificial piles is also affected by the variation in thickness of the oncoming boundary-layer flow. In this experiment, due to the limitations of the experimental facility, measurement of boundary-layer thickness ( δ ) was not performed. Future studies are recommended with the measurement of flow velocity variation along the flow depth to determine the boundary-layer thickness at the locations of sacrificial piles and the pier and to understand the effect of boundary-layer thickness on the performance of sacrificial piles.
Future experiments are also suggested to be performed considering different pier shapes (e.g., rectangular, elliptical, sharp nose, etc.) to understand the performance of linear sacrificial piles on different pier shapes. In addition, submerged piles with different degrees of submergence can be studied to understand the effect of pile submergence. Likewise, a greater number of flow intensity values (low to high) and flow skewness conditions can be studied for understanding the performance under such flow conditions. A wider range of sheltering area values and wider range of values of distance between piles and the pier are recommended to be tested for a better understanding of the functioning of linear sacrificial piles. For each parameter investigated, statistical analysis should be conducted to confirm whether the difference is meaningful or not for the future study.

Author Contributions

Conceptualization, S.G. and N.T.; methodology, S.G.; model preparation S.G., investigation S.G., data processing and analysis, S.G.; writing—original draft, S.G.; visualization, S.G.; resources, N.T.; writing—review and editing, N.T.; supervision, N.T.; project administration, N.T.; funding acquisition, N.T. All authors have read and agreed to the published version of the manuscript.

Funding

This research received no external funding.

Institutional Review Board Statement

Not applicable.

Informed Consent Statement

Not applicable.

Data Availability Statement

Data are contained within the article.

Acknowledgments

The authors would like to acknowledge the support of the Japan Development Services-JDS Scholarship. The authors also acknowledge the anonymous reviewers for their valuable comments to improve this manuscript. I also sincerely thank Yoshiya Igarashi, Sai Seisin, Shohail Iqbal, and Dipak Negi for their continuous support of my studies.

Conflicts of Interest

The authors declare no conflicts of interest.

References

  1. Hughes, D.; Ramey, G.E.; Hughes, M.L. Effects of Extreme Scour and Soil Subgrade Modulus on Bridge Pile Bent Buckling. Pract. Period. Struct. Des. Constr. 2007, 12, 96–108. [Google Scholar] [CrossRef]
  2. Wardhana, K.; Hadipriono, F.C. Analysis of Recent Bridge Failures in the United States. J. Perform. Constr. Facil. 2003, 17, 144–150. [Google Scholar] [CrossRef]
  3. Raudkivi, A.J. Functional Trends of Scour at Bridge Piers. J. Hydraul. Eng. 1986, 112, 1–13. [Google Scholar] [CrossRef]
  4. Melville, B.W. The Physics of Local Scour at Bridge Piers. In Proceedings of the Fourth International Conference on Scour and Erosion 2008, Tokyo, Japan, 5 November 2008. [Google Scholar]
  5. Melville, B.W.; Hadfield, A.C. Use of Sacrificial Piles as Pier Scour Countermeasures. J. Hydraul. Eng. 1999, 125, 1221–1224. [Google Scholar] [CrossRef]
  6. Kharbeche, M.; Williams, P.; Balachandar, R. Effect of Gap Width and Pile Diameter on Efficacy of Sacrificial Piles for Scour Mitigation. In Proceedings of the International Conference on Scour and Erosion, Washington, DC, USA, 18–20 October 2021. [Google Scholar]
  7. Kayatürk, Y.; Gö, M. Application of Sacrificial Piles to Control Scouring Around Bridge Piers. In Proceedings of the 3rd International Conference on Scour and Erosion (ICSE-3), Amsterdam, The Netherlands, 1–3 November 2006. [Google Scholar]
  8. Tafarojnoruz, A.; Gaudio, R.; Calomino, F. Evaluation of Flow-Altering Countermeasures against Bridge Pier Scour. J. Hydraul. Eng. 2012, 138, 297–305. [Google Scholar] [CrossRef]
  9. Elngar, M.A.; AboulAtta, N.M.; Saad, N.Y.; El-Molla, D.A. Effect of Sacrificial Piles on Local Scour around Complex Bridge Piers. Ain Shams Eng. J. 2024, 15, 102410. [Google Scholar] [CrossRef]
  10. Gamboa, J.; Quintanilla, V.; Guzmán, E.; Santos, S. Evaluation of Diameter and Distance of Sacrificial Piles from the Bridge Pier in Reducing Local Scour. Int. J. Struct. Civ. Eng. Res. 2021, 10, 113–118. [Google Scholar] [CrossRef]
  11. Qi, H.; Chen, G.; Zou, W.; Yuan, T.; Tian, W.; Li, J. Characteristics and Mechanism of Local Scour Reduction around Pier Using Permeable Sacrificial Pile in Clear Water. Water 2022, 14, 4051. [Google Scholar] [CrossRef]
  12. Wang, C.; Liang, F.; Yu, X. Experimental and Numerical Investigations on the Performance of Sacrificial Piles in Reducing Local Scour around Pile Groups. Nat. Hazards J. Int. Soc. Prev. Mitig. Nat. Hazards 2017, 85, 1417–1435. [Google Scholar] [CrossRef]
  13. Park, J.H.; Sok, C.; Park, C.K.; Kim, Y.D. A Study on the Effects of Debris Accumulation at Sacrificial Piles on Bridge Pier Scour: I. Experimental Results. KSCE J. Civ. Eng. 2016, 20, 1546–1551. [Google Scholar] [CrossRef]
  14. Raudkivi, A.J.; Ettema, R. Clear-Water Scour at Cylindrical Piers. J. Hydraul. Eng. 1983, 109, 338–350. [Google Scholar] [CrossRef]
  15. Melville, B.W.; Sutherland, A.J. Design Method for Local Scour at Bridge Piers. J. Hydraul. Eng. 1988, 114, 1210–1226. [Google Scholar] [CrossRef]
  16. Chiew, Y.M.; Melville, B.W. Local Scour around Bridge Piers. J. Hydraul. Res. 1987, 25, 15–26. [Google Scholar] [CrossRef]
  17. Sheppard, D.M.; Odeh, M.; Glasser, T. Large Scale Clear-Water Local Pier Scour Experiments. J. Hydraul. Eng. 2004, 130, 957–963. [Google Scholar] [CrossRef]
  18. Ettema, R.; Melville, B.W.; Barkdoll, B. Scale Effect in Pier-Scour Experiments. J. Hydraul. Eng. 1998, 124, 639–642. [Google Scholar] [CrossRef]
  19. Melville, B.W. Pier and Abutment Scour: Integrated Approach. J. Hydraul. Eng. 1997, 123, 125–136. [Google Scholar] [CrossRef]
  20. Zhang, Z. Study on Local Scour Protection Countermeasures of Bridge Pier. Highlights Sci. Eng. Technol. 2022, 28, 464–470. [Google Scholar] [CrossRef]
  21. Malik, R.; Setia, B.; Banik, A. Mechanism of Scouring Around Group of Bridge Piers in Tandem Arrangement. J. Inst. Eng. India Ser. A 2023, 104, 633–642. [Google Scholar] [CrossRef]
Figure 1. Schematic of the experimental setup: (a) plan view; (b) side view.
Fluids 09 00035 g001
Figure 2. Scour experiment with a linear arrangement of sacrificial piles: (a) general layout; (b) a picture of the experimental run.
Fluids 09 00035 g002
Figure 3. Temporal scour evolution of single pier at V/Vc = 0.92.
Fluids 09 00035 g003
Figure 4. Final scour hole depth readings at the end of each test: (a) V/Vc = 0.92, (b) V/Vc = 0.88, (c) V/Vc = 0.78, and (d) V/Vc = 0.68.
Fluids 09 00035 g004
Figure 5. Scour and deposition plot from single pier scour experiment: (a) stream-wise centerline profile; (b) cross-section.
Fluids 09 00035 g005
Figure 6. Results of single-pier scour experiments: (a) variation of maximum scour depth with flow intensity; (b) contour diagram for single-pier scour experiment at V/Vc = 0.92.
Fluids 09 00035 g006
Figure 7. Flow structures and mechanism of local scour in the case of sacrificial piles with pier: (a) plan view; (b) side view.
Fluids 09 00035 g007
Figure 8. Results of linear sacrificial pile scour experiment: (a) comparative profile; (b) variation of dsmax with the sheltered area for a given distance between piles and pier; (c) variation of dsmax with the spacing between piles and pier for a given value of the sheltered area; (d) % reduction in dsmax for different configurations tested.
Fluids 09 00035 g008
Figure 9. Contour plots of sacrificial piles experimental cases: (a) L-P2-D, (b) L-P2-2D, (c) L-P2-3D, (d) L-P3-D, (e) L-P3-2D, (f) L-P3-3D, (g) L-P4-D, (h) L-P4-2D, and (i) L-P4-3D.
Fluids 09 00035 g009
Figure 10. Contour plot of cases of sacrificial piles only: (a) L-P2, (b) L-P3, and (c) L-P4.
Fluids 09 00035 g010
Table 1. Summary of selection of experimental parameters.
SelectionParametersSelection CriteriaSuggested ByPurposeSelected ValueRemarks
SandMean size (d50)d50 > 0.7 mm[14]To avoid ripple formationd50 = 0.87 mmSilica sand no. 4
Geometric s.d. ( σ g ) σ g < 1.3[15]To avoid the armoring effect σ g = 1.27
PierDiameter (D)B/D ≥ 10[16]To avoid side wall effectD = 4 cmB = 70 cm
D/d50 = 25–50[4]To avoid the effect of sediment sizeD = 4 cm
FlowDepth (y)y/D ≥ 2.5[18]To avoid the effect of flow shallownessy = 12 cm
Velocity (V)0.9 < V/Vc < 1[8]Maximum scour under clear-water conditions 0.92
Table 2. Flow conditions adopted.
ParametersModelPrototypeRemarks
Flow depth (y)12 cm3 mLr (Length ratio)
Critical flow velocity (Vc)30.1 cm/s1.50 m/sVr = Lr0.5
Mean flow velocity (V)27.6 cm/s1.38 m/sVr = Lr0.5
Design discharge (Q)23.2 lps72.4 m3/sQr = Lr5/2
Froud no., Fr = V/(gy)0.50.2540.254Froude similarity
Pier Reynold’s no., Re = VD/v11,0401.38 × 10−6
Table 3. Single pier experimental cases.
Experimental Case NamePier Diameter (D) [cm]Flow Depth (y) [cm]Flow Intensity (V/Vc)
S-0.924.012.00.92
S-0.884.012.00.88
S-0.784.012.00.78
S-0.684.012.00.68
Table 4. Experimental cases with linear arrangements of sacrificial piles.
Experimental Case NameNo of Piles (N)Sheltered Area (As) [%]Diameter. of Pile (d) [mm]Distance of Piles from the Face of the Pier (X)Remarks
L-P2-D2408D
L-P2-2D24082D
L-P2-3D24083D
L-P3-D3608D
L-P3-2D36082D
L-P3-3D36083D
L-P4-D4808D
L-P4-2D48082D
L-P4-3D48083D
L-P22 8 Piles only
L-P33 8 Piles only
L-P44 8 Piles only
Table 5. Measured scour depth values of single pier scour experiments.
Experimental Case NameFlow Intensity (V/Vc)Measured Value of Scour Depth [cm]Maximum Scour Depth (dsmax) [cm]
FrontBackSides (Averaged)
S-0.920.926.203.905.356.20
S-0.880.885.643.104.705.64
S-0.780.784.802.604.054.80
S-0.680.683.401.803.303.40
Table 6. The efficiency of linear arrangements of sacrificial piles.
S.N.Experimental Case Namedsmax
Observed [cm]
Reduction in dsmax Compared to Unprotected Pier [cm]% Reduction in dsmax
1L-P2-D3.622.5841.6
2L-P2-2D4.152.0533.1
3L-P2-3D4.621.5825.5
4L-P3-D3.852.3537.9
5L-P3-2D4.052.1534.7
6L-P3-3D4.41.829.0
7L-P4-D4.231.9731.8
8L-P4-2D4.042.1634.8
9L-P4-3D4.112.0933.7
Disclaimer/Publisher’s Note: The statements, opinions and data contained in all publications are solely those of the individual author(s) and contributor(s) and not of MDPI and/or the editor(s). MDPI and/or the editor(s) disclaim responsibility for any injury to people or property resulting from any ideas, methods, instructions or products referred to in the content.

