1. Introduction
External Gear Pumps (EGPs) are positive displacement machines commonly used in hydraulic and fluid power systems for both industrial and mobile applications. They are selected due to their simplicity, low cost, small size and weight, high efficiency, and the ability to operate in a broad range of pressures and rotational speed. One of the major drawbacks of this type of machine is the relatively high levels of noise and vibration emissions. Until recent times, this kind of issue has always been overlooked because the prime mover used to power these hydraulic machines was the internal combustion engine (ICE), which produces higher noise and vibrations. The recent trend of electrification is affecting both off-road and on-road mobile fields [
1,
2], where the ICE is replaced with quiet electric machines, thus shifting the attention back to hydraulic machines as the main source of noise. This conversion has forced research to analyze the noise emissions of hydraulic machines and to find solutions to limit them.
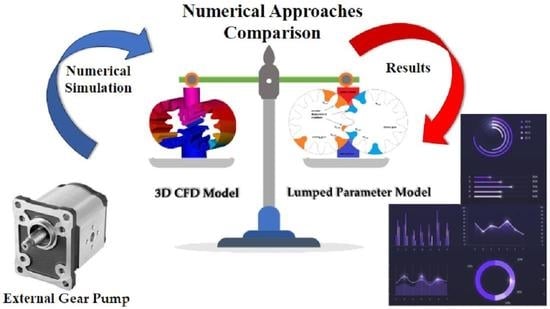
The operational mechanism of positive displacement pumps produces flow ripples function of both mechanical (displacement, pumping elements number, etc.) and fluid-dynamics (oil compressibility, backflow, leakages, and cavitation phenomenon) characteristics. These ripples mainly affect the fluid-borne noise and vibrations of the pumps. To reduce these fluctuations and lower the noise and vibration emissions of the pumps, many approaches could be considered. For EGPs, one of these approaches consists of the implementation of helical gears instead of spur ones. This typology of gear allows for the obtaining of a more progressive mechanical meshing and a smaller gradient variation of the displacement chambers’ volumes against the traditional spur gears. To better understand these advantages and further reduce noise and vibrations, the scientific community introduces digital twins of the unit for studying and optimizing their geometries. As known, numerical simulations could be implemented through different methodologies: the three-dimensional CFD (Computer Fluid-Dynamics) and the lumped parameters approaches. On one side, 3D CFD numerical models have successfully been used by several authors to analyze both spur gear pumps [
3,
4] and helical gear pumps [
5,
6,
7], showing great accuracy in predicting the pumps’ behavior. On the other, lumped parameter models are based on a series of control volumes with homogeneous properties interconnected by a series of resistive and capacitive elements. Many different works of different authors can be found in the literature using this methodology. Zhao et al. [
8] investigated the theoretical kinematic flow ripples’ source of EGPs through a lumped parameter approach. Borghi et al. [
9,
10] developed and validated a lumped parameter model that predicts both the volumetric and mechanical efficiency of the EGPs. Battarra et al. [
11] and Ransegnola et al. [
12] explored the dynamic behavior of both spur and helical EGPs. Even if many examples can be found in the literature focusing on one or the other approach, only very few works performed a comparison between them for the specific application of the EGPs. Zhao et al. [
6] compared these two numerical approaches for a non-conventional typology of EGP (continuous-contact helical gear pumps) but using a 3D CFD numerical model that implements geometrical approximation.
The aim of this work is precisely to make up for this shortage in the scientific literature by comparing a 3D CFD numerical model with a new feature of the helical gears with a lumped parameter model implemented in a multi-environmental tool completely developed by the authors, named EgeMATor MP+ [
13], to identify strengths and weakness of each one of them when employed for helical EGPs. These two approaches have been deeply detailed, showing and explaining all the tweaks and setups required to obtain accurate simulations. The results of the simulations have then been compared with experimental data performed on the reference pump on a dedicated test rig. The comparison has been performed by analyzing both steady-state and dynamic variables, the average flow-rate, and dynamic pressure ripples at different working conditions.
Results showed that both approaches are consistently obtaining good agreement with the experimental results. The 3D CFD approach reaches higher accuracy but only for limited working conditions and requires high computational power and time; the lumped parameters approach, on the contrary, achieves a relatively lower accuracy but for a wider range of working conditions and requires lower computational power and time.
2. Reference Pump and Experimental Test Campaign
The analysis proposed in this paper has been conducted on a reference external gear pump with helical gears with a displacement of 14.5 cm
3/rev; the basic technical data of the reference pump are listed in
Table 1.
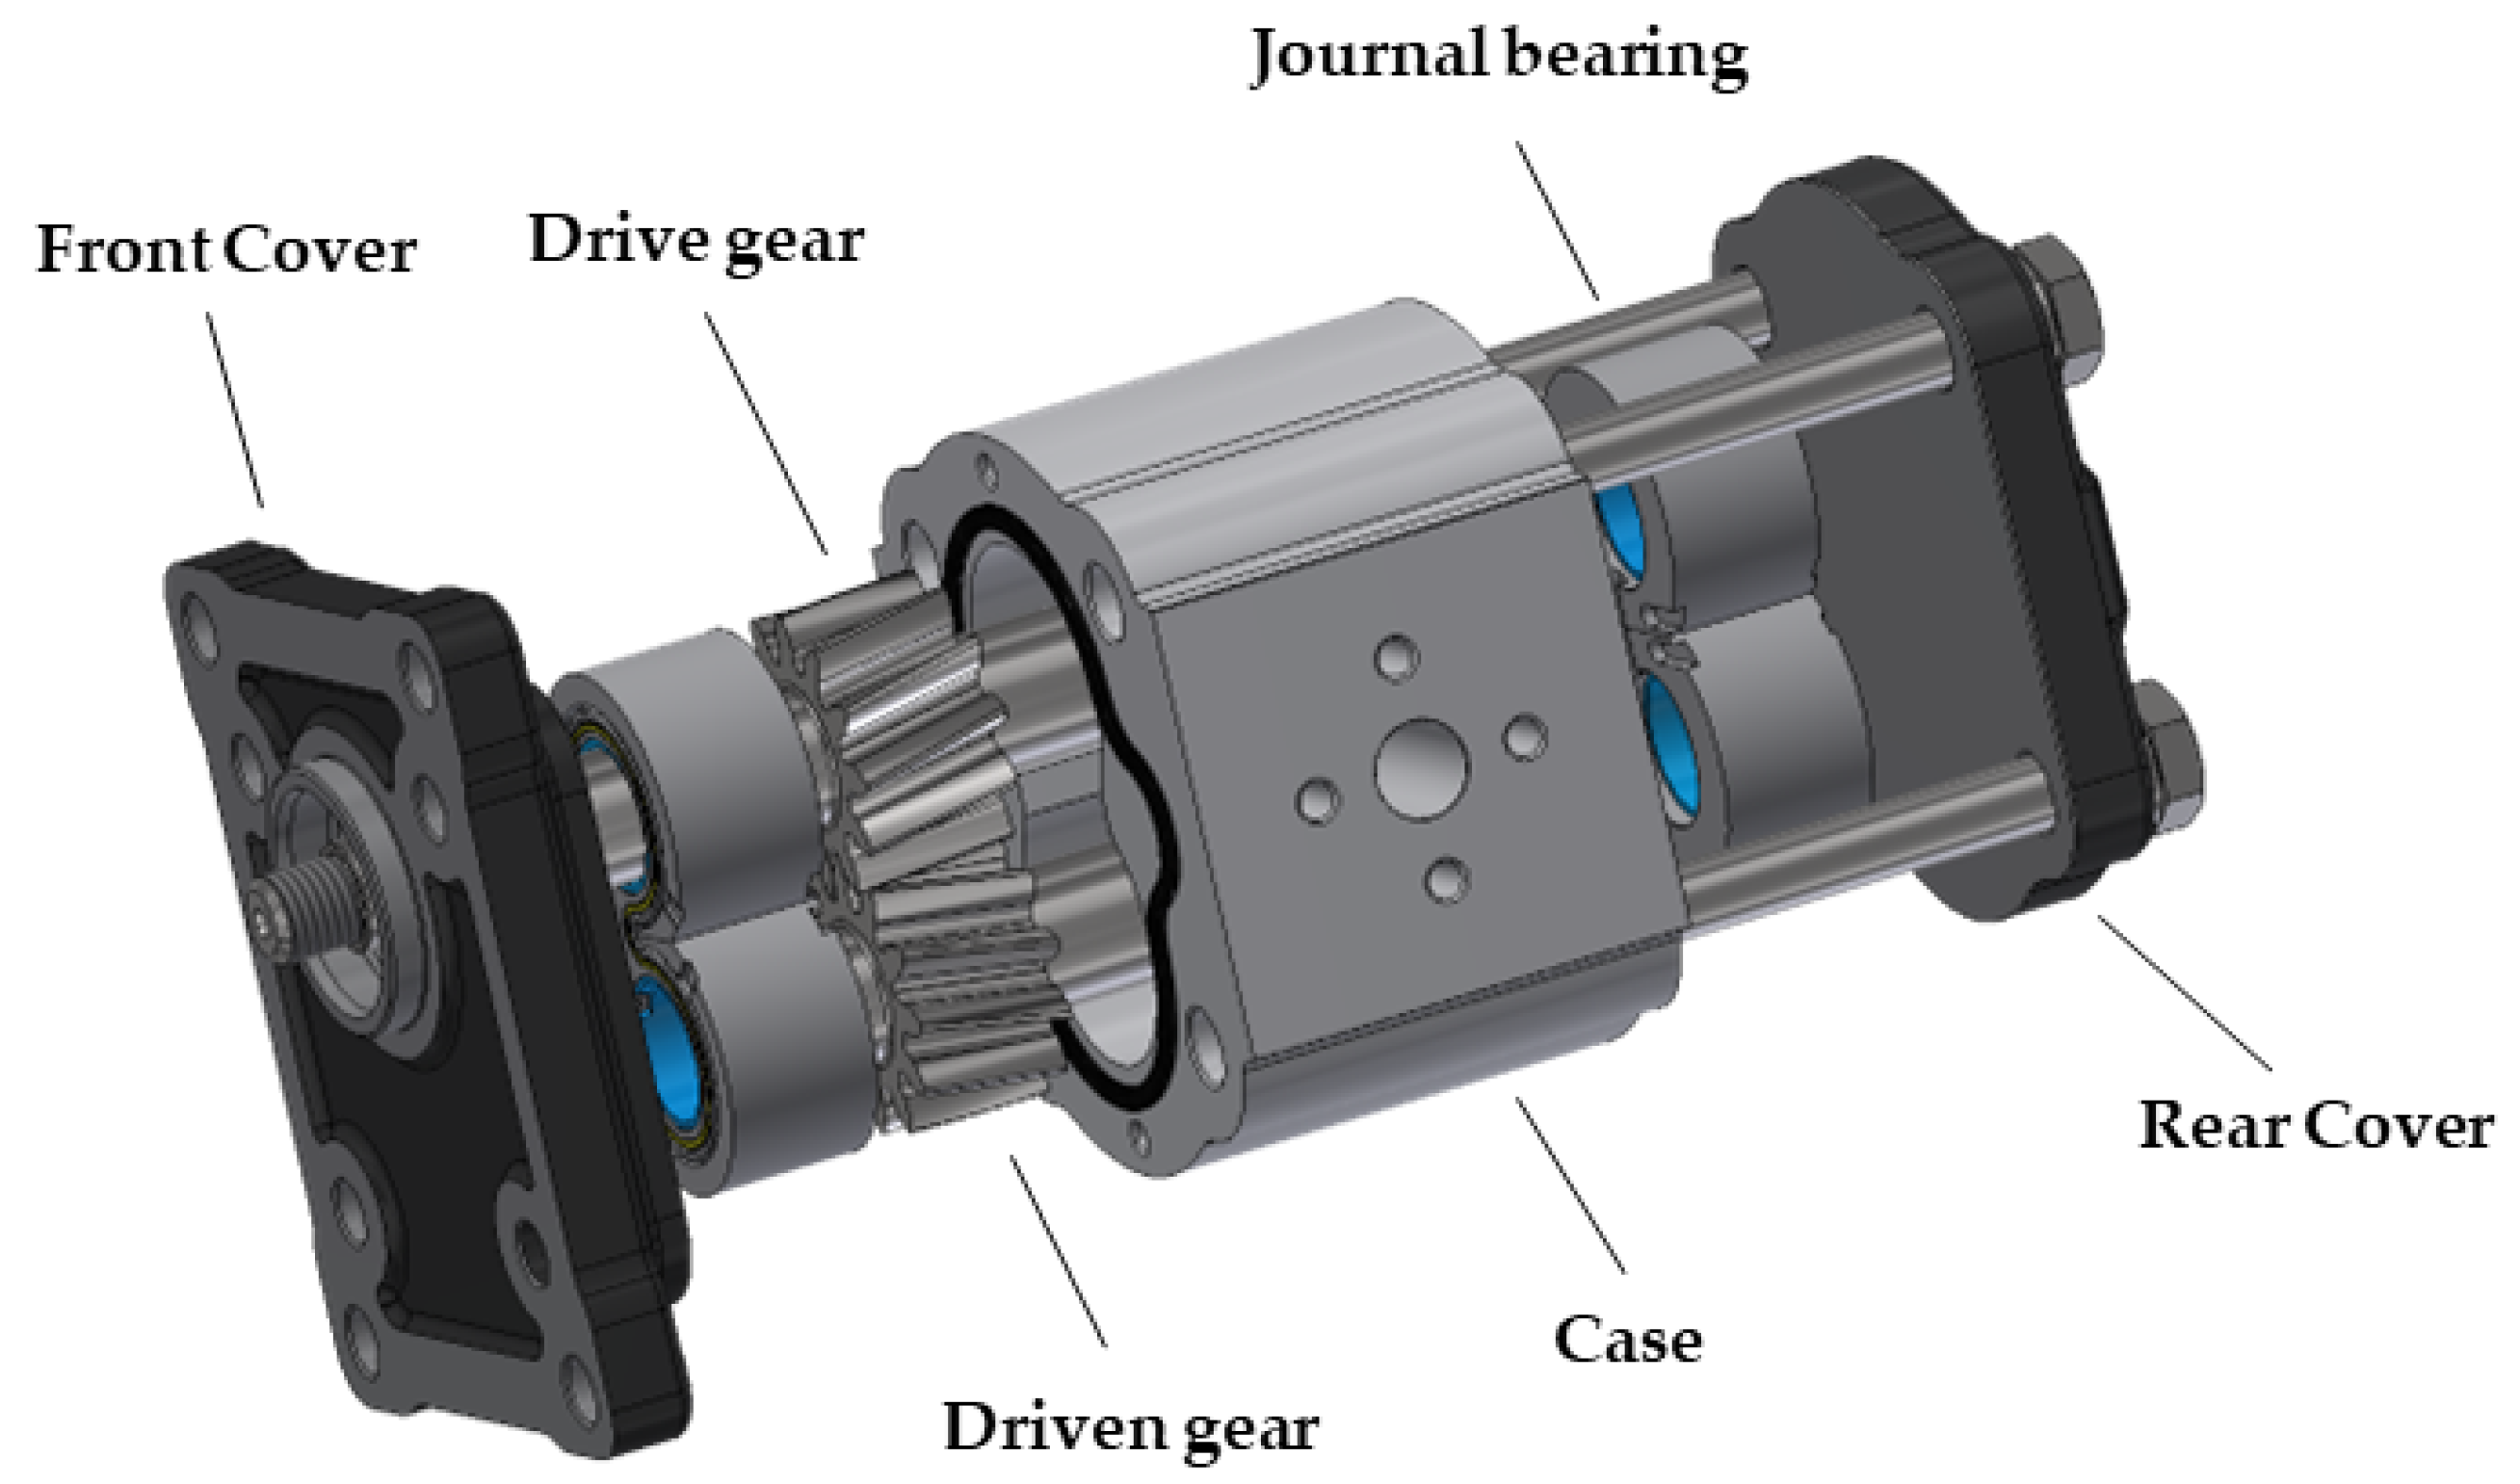
Figure 1 shows the exploded view of the pump. The pump consists of a case made from die-cast alloy, while the front and the rear covers are made of cast iron, allowing it to reach higher maximum pressures while maintaining a small weight, making it ideal for mobile applications.
An experimental campaign has been performed on the pump with the aim of validating the numerical models that will be later shown in the next paragraphs. Tests have been performed on the test rig in
Figure 2.
A servomotor drives the tested pump by a flexible coupling. The proportional pressure relief valve V1 generates the load for the pump at the required pressure, while the proportional pressure relief valve V2 is mounted in parallel with the previous one for safety reasons. Two strain gauge sensors, P1 at the inlet side and P2 at the delivery side, are used to acquire the pressure signal. A high-pressure filter is installed before the flowmeter Q1 to avoid pollutants reaching the reservoir and protect it from debris. Lastly, the thermal conditioning system consists of a water-cooled heat exchanger that recovers the oil directly from the reservoir. It is placed after the loading valve and allows control of the oil temperature in a range of ±1 °C. The detailed information on each described component is listed in
Table 2.
The setup to acquire pressure ripples using the sensor P3 has been obtained by adding a rigid duct with a calibrated fixed orifice, O1, placed right after the P3 pressure sensors (as shown in
Figure 2). The orifice, which has a diameter of 1.72 mm, gives the requested load.
Tests have been carried out with an oil ISO 46, grade HL, maintaining the temperature in the range of 40 °C ± 1 °C. The pump has been tested, varying the delivery pressure from minimum to maximum continuous for different speeds. The experimental campaign has involved the analysis of several working conditions with the additional measurement of the noise and vibration levels. Being the numerical models focused on the fluid dynamic aspect, only a reduced number of the acquired parameters corresponding to the working conditions tested have been utilized to validate the numerical models.
3. The Three-Dimensional CFD Numerical Model
The 3D computational fluid dynamics numerical modeling constitutes the most advanced method for evaluating the flow field in positive displacement pumps. This methodology is based on the resolution of the Navier-Stokes equations in a three-dimensional domain discretized with a varying geometry mesh. The major difficulties of this methodology are the procedure to deform and transpose the grid mesh as the gears rotate and the grid refinement required to model the small gaps. Overcoming these difficulties permit the correct evaluation of the non-uniform pressure distribution in each displacement chamber and takes into account different variable chamber shapes and effects of the inlet and outlet structures.
In this analysis, for the three-dimensional CFD numerical model, a novel approach has been applied by using a new capability available in the commercial code Simerics MP+ v.5.2.15®, developed by Simerics Inc. (1750 112th Ave NE, Ste C250, Bellevue, WA, USA 98004). This approach implements the use of a body-fitted binary tree grid generator that accurately follows the fluid volume extracted along the gears’ helical angle. The parent-child tree architecture permits to obtain expandable data structure requiring reduced memory storage, generating thus an accurate and efficient grid, hence eliminating the need for geometry approximations, as can be found in previous works in literature.
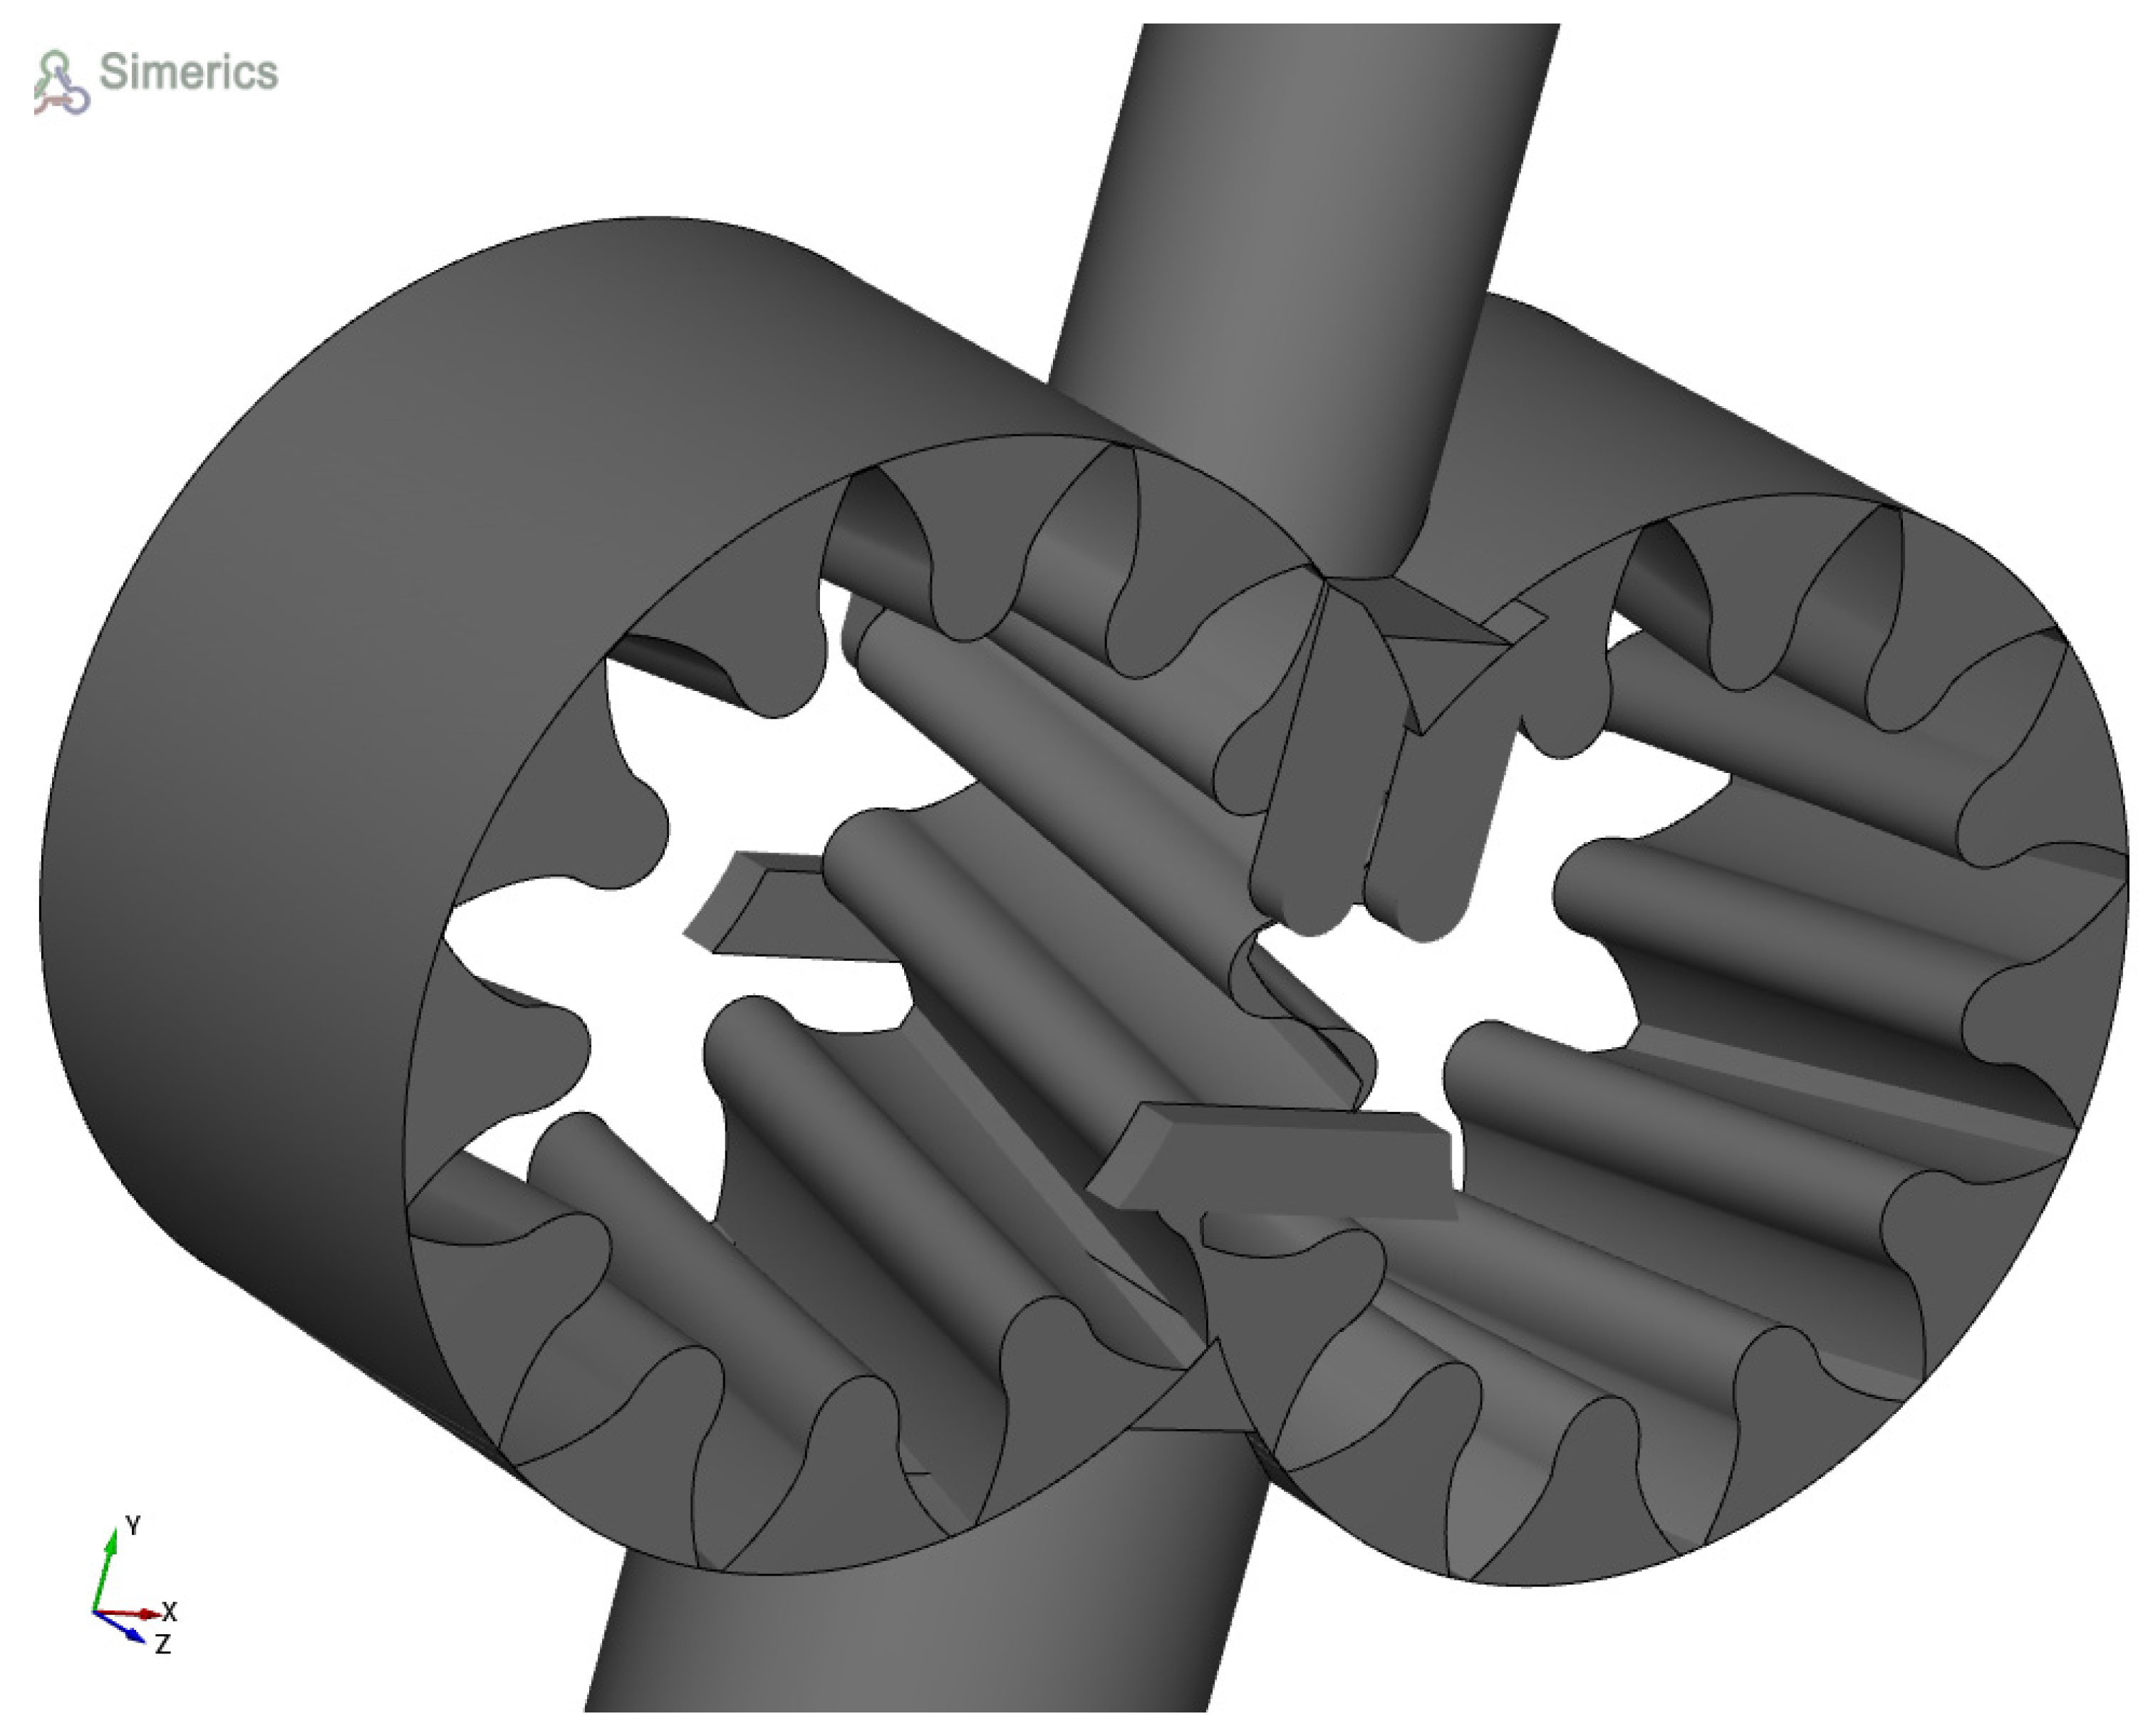
The fluid domain has been obtained from the CAD files of the pump, extracting only the necessary surfaces and volumes required from the developed model, as shown in
Figure 3.
The fluid volumes obtained have been meshed using the rotor template Mesher for EGPs with a structural mesh for the gears that is updated automatically during the rotation. A mesh sensitivity analysis has been executed by varying the number of cells used to discretize the helical gears and the wear plates and comparing the mean volumetric flow rate with the acquired during experimental tests; four different rotor and wear-plates grids with progressively finer mesh have been modeled.
Table 3 lists the number of cells used to model them for each analyzed mesh, while
Figure 4 reports the convergence of the volumetric flow rate performed with the four models.
The results obtained from this analysis show that the coarser mesh #1 has proved to have low accuracy with an error of 18%, while the finer mesh has a convergence increment so minor that it does not justify the higher computational power and time that it requires. Mesh #3 has been chosen to be employed in the following analysis.
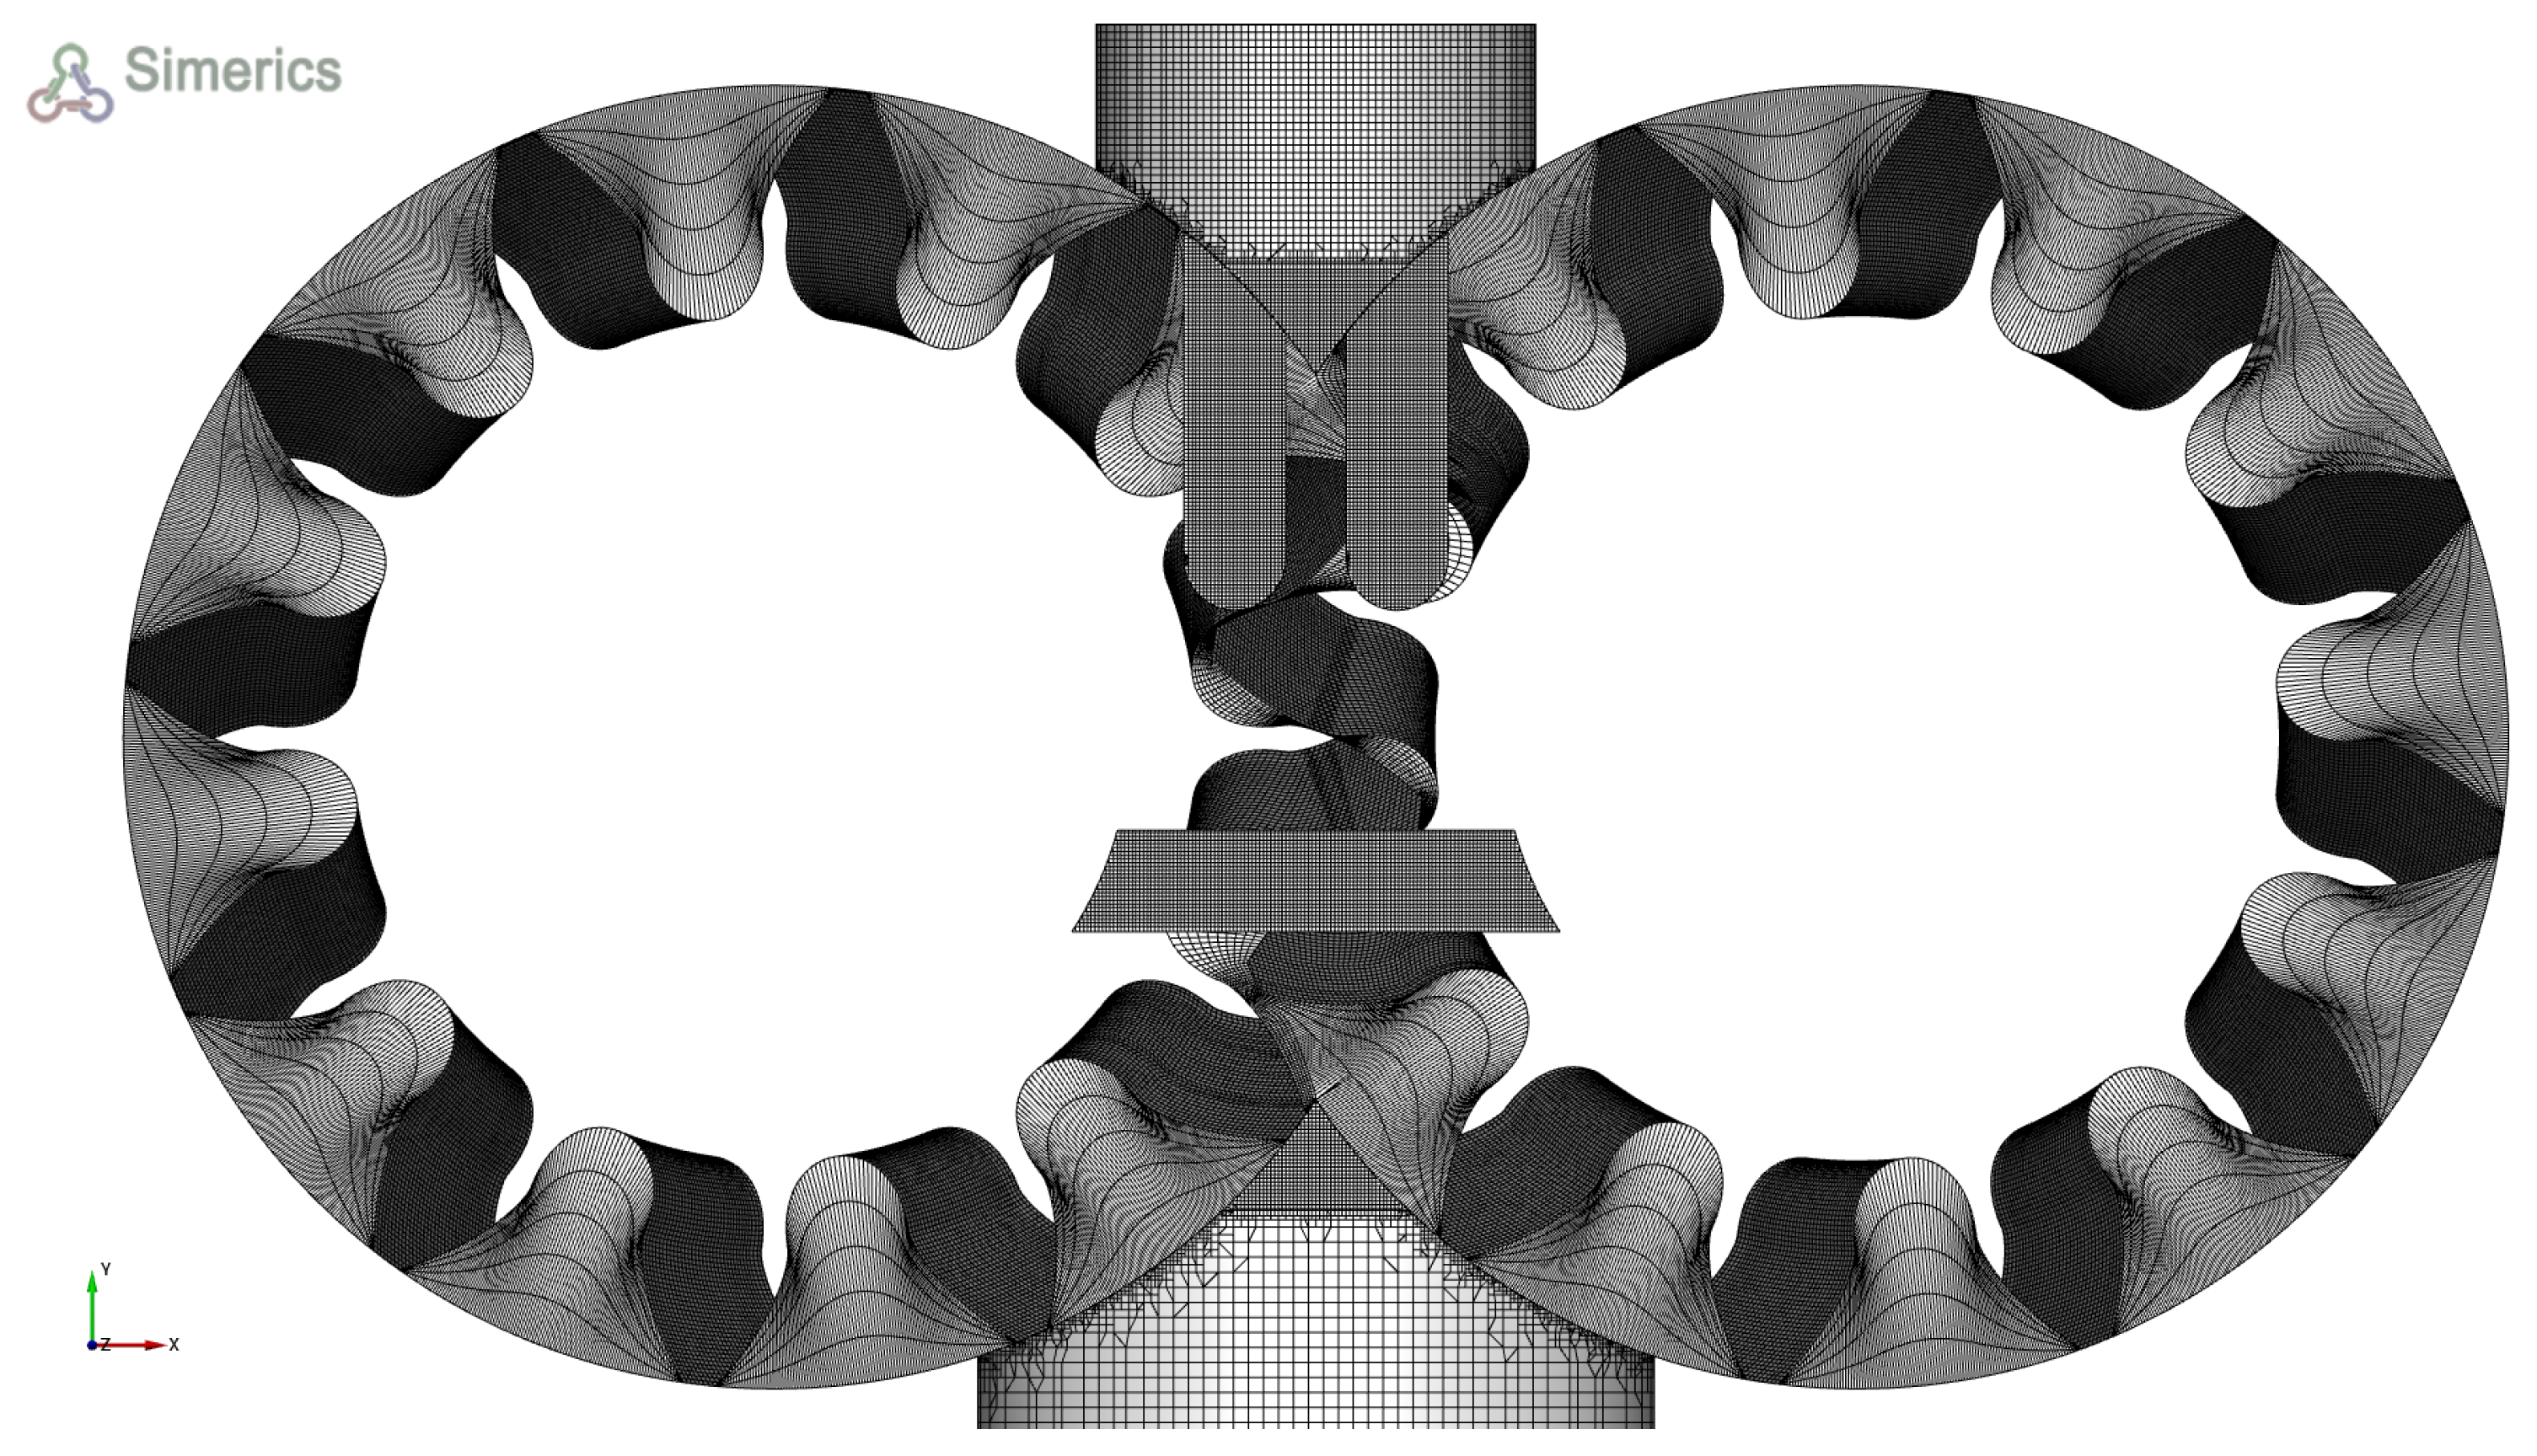
The final model with the chosen grid mesh contains approx. 950 k cells, and it is shown in
Figure 5.
The simulations have been run on a workstation provided with an Intel® Xeon® CPU E5-2640v2 @ 2.00 GHz (two processors) with 192 GB RAM. The computational time required to complete a shaft revolution, with a saving angle step of 0.5 degrees, is about 36 h.
The pressure forces effect that acts on the gears have been considered in the model by translating them along the vertical axis toward the inlet side, reducing the clearance between the gears’ tooth tip and the housing. Along with the contact between the driving and the driven gear, this entails a problem for the 3D CFD numerical model, which does not permit inserting null clearances. Thus, the choice of the value of these gaps is of the utmost importance to replicate real working conditions. The driven gear has also been rotated to reproduce the contact with the driving gear. This aspect imposed the execution of a gap analysis to find a value that permits a void of leakages through the gaps without losing the convergence of the simulation. A starting value of 25 µm has been chosen. The analysis has yielded that the chosen initial value prompts unrealistic high crossflow values during the meshing, while the more restrictive value of 5 µm reports a minimal leakage. Therefore, a gap of 5 µm has then been chosen for both gaps inquired and shown in
Figure 6. For the pump analyzed, the value employed the offsetting of the gear by 35 µm toward the inlet side and a relative rotation of 0.11 degree of the driven gear against the driving one.
The numerical model includes the evaluations of turbulence and cavitation. The turbulence has been predicted using a standard k-ε turbulence model with the implementation of the Renormalization Group Theory (RNG) statistical technique. This statistical technique permits to increase in the model response to rapid strains, thus increasing the results’ accuracy but requiring only an exiguous amount of additional computational power. The solidity of this implemented methodology can be found in numerous works available in the literature [
14,
15,
16,
17,
18,
19]; the model includes the standard k-ε turbulence model, and more details are available in previous works published by the research group [
20,
21].
The cavitation model employed is directly available in Simerics MP+
® and is capable of predicting cavitating conditions with high reliability. It is an extension of the work of Singhal et al., based on the Rayleigh-Plesset equation [
22], and appraises cavitation, aeration, and liquid compressibility. This model considers the fluid in cavitating conditions to be a mixture of liquid, vapor, and some non-condensable gas (NCG). The vapor distribution is characterized by this model with the following equation:
where
is the diffusivity of the vapor mass fraction and
is the turbulent Schmidt number. For this analysis, these two numbers are set equal to the mixture viscosity and unity, respectively. The vapor generation term,
, and the condensation rate,
, are evaluated with the following equations:
Singhal’s cavitation theory has been expanded to also include non-condensable gases (NCG) in the liquid [
21]. The unsteady mixture (liquid, liquid vapor, and NCG) density ρ is evaluated in accordance with the formula (4):
The NCG in the hydraulic fluid can be found in a free and/or dissolved state. The cavitation modeling utilized for this analysis is the Equilibrium Dissolved Gas Model. This model assumes that the free NCG mass fraction is not constant; its evaluation is obtained by the resolutions of a further transport equation for the mass fraction of the dissolved gas (5):
where
is a user-specified value and represents the equilibrium mass fraction of the dissolved gas at the reference pressure
, another user-specified value as well;
is the law of gas dissolution or release defined by the user. The time scale τ, for this model implemented, tends toward zero, resulting so in a near-instant mass transfer. The mass fraction of the free gas is evaluated from the following condition:
where
is another user-specified value.
The model developed requires a certain number of parameters to characterize the modeled fluid and the boundary conditions of the pump. For this analysis, the parameters utilized are listed in
Table 4.
The simulations have been executed for three different pump shaft speeds and two different outlet pressures for a total number of six different working conditions simulated, as listed in
Table 5.
One of the main advantages of the 3D CFD numerical model is the possibility of evaluating the cavitation phenomenon inside the computational domain of the gear pump simulated due to the unfeasibility of the lumped parameter model to evaluate this phenomenon, and this work being focused on the comparison between the two numerical methods. Additional results related to the cavitation have been shown in
Appendix A with the iso-surface of the total gas volume fraction above 0.5 in some working conditions.
The 3D CFD numerical model also allows for the study of the pressure wave effects, so an analysis of the pressure ripple at the delivery side of the pump has also been conducted. To reproduce the same conditions of the experimental validation campaign, the numerical model has been implemented with a supplementary volume. This new volume has the same geometry as the one used on the test bench, which consists of a rigid duct with a calibrated fixed orifice of 1.72 mm at its end. The final geometry implemented in the numerical model is shown in
Figure 7, where there is also represented the position of the monitoring point added into the model located at the same position as the high-frequency pressure transducer (P3 in
Figure 2) used during the experimental campaign.
4. The Lumped Parameters Numerical Model
A lumped parameter numerical simulation has also been built up for studying the reference pump. As known, the model subdivides the computational domain into a number of control volumes, each of them assumed to have homogeneous properties, such as pressure, temperature, density, etc. This numerical simulation approach is one of the most utilized thanks to the excellent compromise between the accuracy obtained and the computational power and time required [
8,
9,
10,
11,
12,
13,
14,
15,
16,
17,
18,
19]. The control volumes are modeled as capacitive elements that evaluate the pressure as a function of the net ingoing flow rate. The connections between these control volumes are modeled by resistive elements computing the flow rate as a function of the pressure drop through them. These resistive elements could be of different types: for connections between the rotating variable chambers and their connections with the inlet and outlet volumes, the resistive elements are modeled as variable restrictors, with a flow regime typically turbulent; laminar restrictors instead are used to model the leakages through the gaps between the gears and between each gear and the casing. This way, at a higher level, the lumped parameter approach schematizes the gear pump as a sequence of capacitive and resistive components, some of them with a variable geometry function of the shaft angle.
In this work, the lumped parameters approach has been implemented by the authors developing a complete simulation tool to analyze and predict both the fluid dynamics and the mechanical properties of EGPs. This tool is based on the previously described methodology [
13] with a better focus on the modeling of the leakages, especially the ones coming into effect over the tip of the gears’ teeth.
Figure 8 shows a schematization of all the control volumes and internal connections into which the pump has been divided by the developed tool and used in this analysis. As it can be seen, the pump domain has been divided into four types of control volumes: one for the outlet volume, one for the inlet volume, and the last two types for the volume between a couple of following teeth, one for each gear and in number equal to the gears’ teeth.
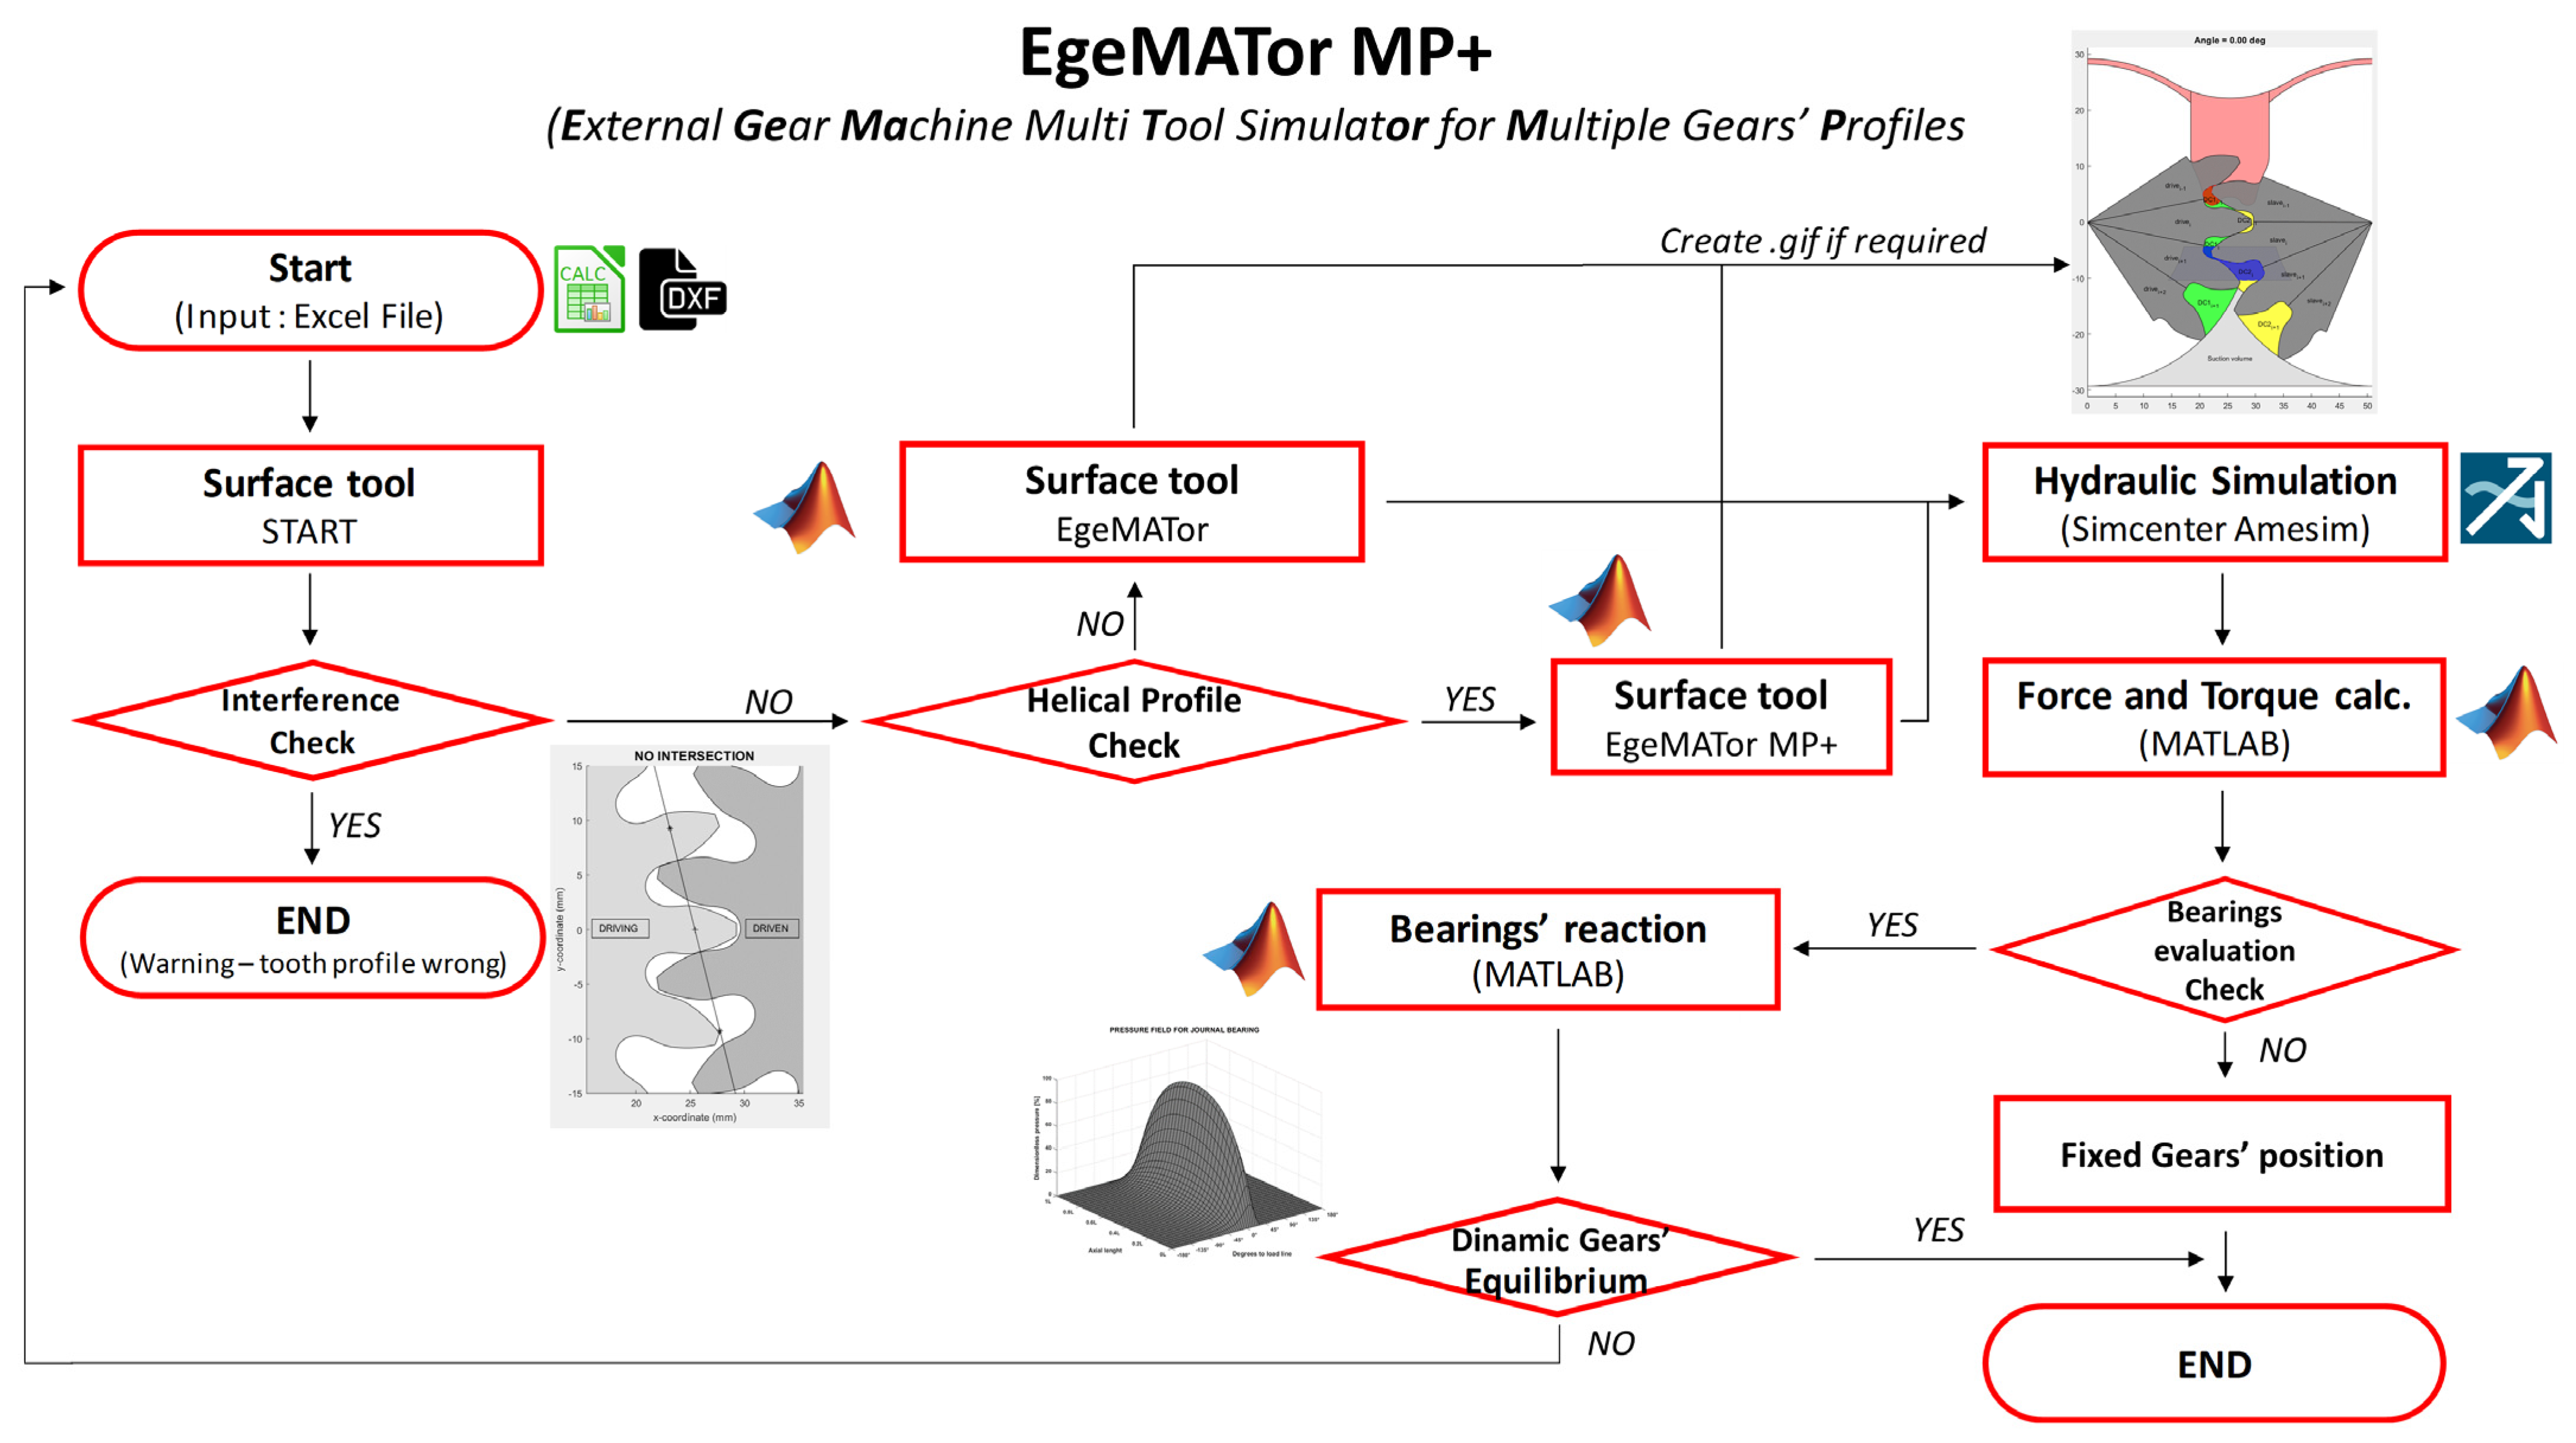
The tool developed by the authors for numerical simulations of external gear machines is called EgeMATor MP+ (External Gear Machine Multi Tool Simulator for Multiple Gears’ Profiles). It permits simulating pumps with both traditional spur gears and helical gears profiles. The tool is comprised of different subroutines developed in diverse environments, interconnected to each other, as apparent from its workflow presented in
Figure 9, to study the EGMs in depth.
Following the flow chart in
Figure 9, the tool starts receiving as input an Excel file that contains all the pump geometrical properties of the pump analyzed. This file also contains the links to the DXF files (Drawing Exchange Format) of tooth profiles and relief groove geometries. This data is acquired by the first subroutine developed so-called Surface Tool, which is the core of EgeMATor MP+. This subroutine, written in the MATLAB
® (MathWorks Inc., Natick, MA, USA) environments, initially verifies the correctness of the gear engagement with the chosen inputs, finding the relative rotation angle to obtain teeth contact with zero gaps and checking the presence of interference in the meshing zone. In case of interference, the tool produces a warning, stopping the procedure; otherwise, it moves to the next step, where the gears’ profile typology is checked. In the case of spur gears, the tool proceeds with the standard subroutine generating all the required data and files needed by the lumped parameter model and the subsequent hydraulic simulation; if gears are helical, the tool activates a new subroutine to consider the profile shifting along the axial dimension. EgeMATor MP+ is an evolution of the tool EgeMATor already developed by the research team [
13] for the only EGMs with spur gear with the introduction of a new subroutine for the helical profiles.
The modified subroutine subdivides the gears into a series of slices with a limited axial extension, and each slice is shifted to a certain degree compared to the others to replicate the helical axial shifting. The relation between the slice axial extension (
dz) and its angular shift (
dφ) against a reference slice is the following:
where
b is the axial length of the gears, and
β is the total helical angle. For each slice, the standard subroutine is executed; the total values of the geometric characteristics of the pump analyzed (e.g., the volume of the displacement chamber) are achieved by integration:
where the
and
are respectively the top and bottom surfaces of the gear;
and
are their respective profile angle on the area curve, and the function
A(
φ) is the area curve that could represent a displacement area or a variable area.
Following the steps in
Figure 9, after the integration process, the subroutine generates the required data and files, thus giving the start to the following hydraulic simulation. The hydraulic simulation subroutine, visible in
Figure 10, is developed in the environment Simcenter Amesim
® (Siemens AG, Munich, Germany). It loads the files generated by the Surface Tool and runs a numerical simulation of the pump that evaluates the pressure and the volumetric fluxes for each of the control volumes and connections modeled in the lumped parameters approach adopted. These values are then gathered in table files to be post-processed or used by the following subroutines that are focused on the force and torque calculations.
The next subroutine is responsible for simulating the mechanical characteristics of the pump. This subroutine is also written in MATLAB® environment and loads data from the table created by the Surface Tool and the hydraulic simulation performed in Simcenter Amesim®. Therefore, it obtains geometrical data, control volumes, and connection values function of the rotation angle; from the latter, it extracts the fluid-dynamics properties of the aforementioned control volumes, thus permitting the evaluation of forces and torques acting on the pump’s gears. This evaluation considers the contribution of the friction forces due to the leakages and the contact forces due to the gears’ meshing.
The final subroutine of the EgeMATor MP+ tool is tightly related to the previous one and enables the evaluation of the bearings’ reactions. This subroutine has been written in MATLAB® and requires the input of the geometrical data of the bearings, while the load applied on them is obtained from the force and torque subroutine just described. The code resolves the pressure film around the bearing that develops a reaction to counterbalance the load through a finite difference method. The eccentricity and the angle of minimum film thickness values are found through an iterative inverse procedure.
EgeMATor MP+ works in a closed loop; after the evaluation of the gear positions, thanks to the bearing subroutine, the results are compared with the initial chosen positions, and if the results are different, the tool begins a new iteration, restarting from the Surface Tool subroutine. Therefore, following the workflow in
Figure 8, at the stage “bearing evaluation check”, in the case of dynamic gears’ position, EgeMATor MP+ evaluates the bearing reaction; in the case of fixed gears’ position, the evaluation of the bearings’ reaction is excluded, leading to termination.
At the moment, the bearings’ reaction has not yet been validated for helical gears, even if it has already been developed, so for this analysis, fixed gears’ positioning has been used in addition to the evaluation of the teeth contact in the meshing zone.
The tool developed requires, besides the geometrical characteristics of the pump under investigation, a certain number of parameters and boundary conditions. The analysis carried out in this work has the aim to compare the two different numerical modeling approaches, thus, to operate a comparison between the two approaches investigated as freely as possible from external factors, the same parameters utilized in the 3D CFD numerical model and listed in
Table 4 have been adopted.
A simulation for a chosen working condition requires small computational power and time. On a standard notebook equipped with an Intel
® Core
® CPU i7-8750H @ 2.20 GHz with 32 GB of RAM, a complete simulation with a saving delta angle ∆φ, that is, the shaft angle difference for two consecutive points saved by the Surface Tool and the hydraulic simulation, requires approximately 45 min to complete. The small time required allowed for the simulation of a great number of working conditions, but for this study, only the same working conditions also simulated by the 3D CFD numerical model and listed in
Table 5 have been reported and analyzed.
The analysis of the dynamic effects due to the pressure wave effects is virtually impossible to be executed with a lumped parameter approach numerical model due to the nature itself of the approach to impose the homogeneity of the physical properties inside the control volumes. Thus, to evaluate pressure ripples at the delivery side of the pump, a modification of the approach used has been implemented. The Simcenter Amesim
® environment used to develop the hydraulic simulation subroutine has the capability to simulate straight hydraulic pipe by means of a one-dimensional (1D) CFD model, therefore allowing the study of the pressure variations inside the pipe. The hydraulic model has then been revised with the introduction of the hydraulic straight pipe model with the same fixed orifice used in the 3D CFD model and during the experimental tests that have been positioned on the delivery side of the pump. Finally, a pressure sensor transmitter has been added in the same position as the high-frequency pressure transducer P3 implemented in the experimental test campaign (as displayed in
Figure 2).
5. Results Comparison
This section presents a comparative analysis between the experimental test campaign data, the 3D CFD, and lumped parameters numerical models. The analysis has been split into two parts: the first part has been focused on flow-rate mean values in which the available experimental data have been used to evaluate the accuracy of the developed models on a steady state aspect; the second part has been centered on a comparison between the two numerical models and the experimental data regarding the pressure ripples on the delivery outlet, thus focusing on a more dynamic aspect. If not specified, the following results have been referred to a rotational speed of 1500 rev/min and delivery pressure of 200 bar, the typical operational value for the reference pump.
5.1. Delivery Flow Mean Value
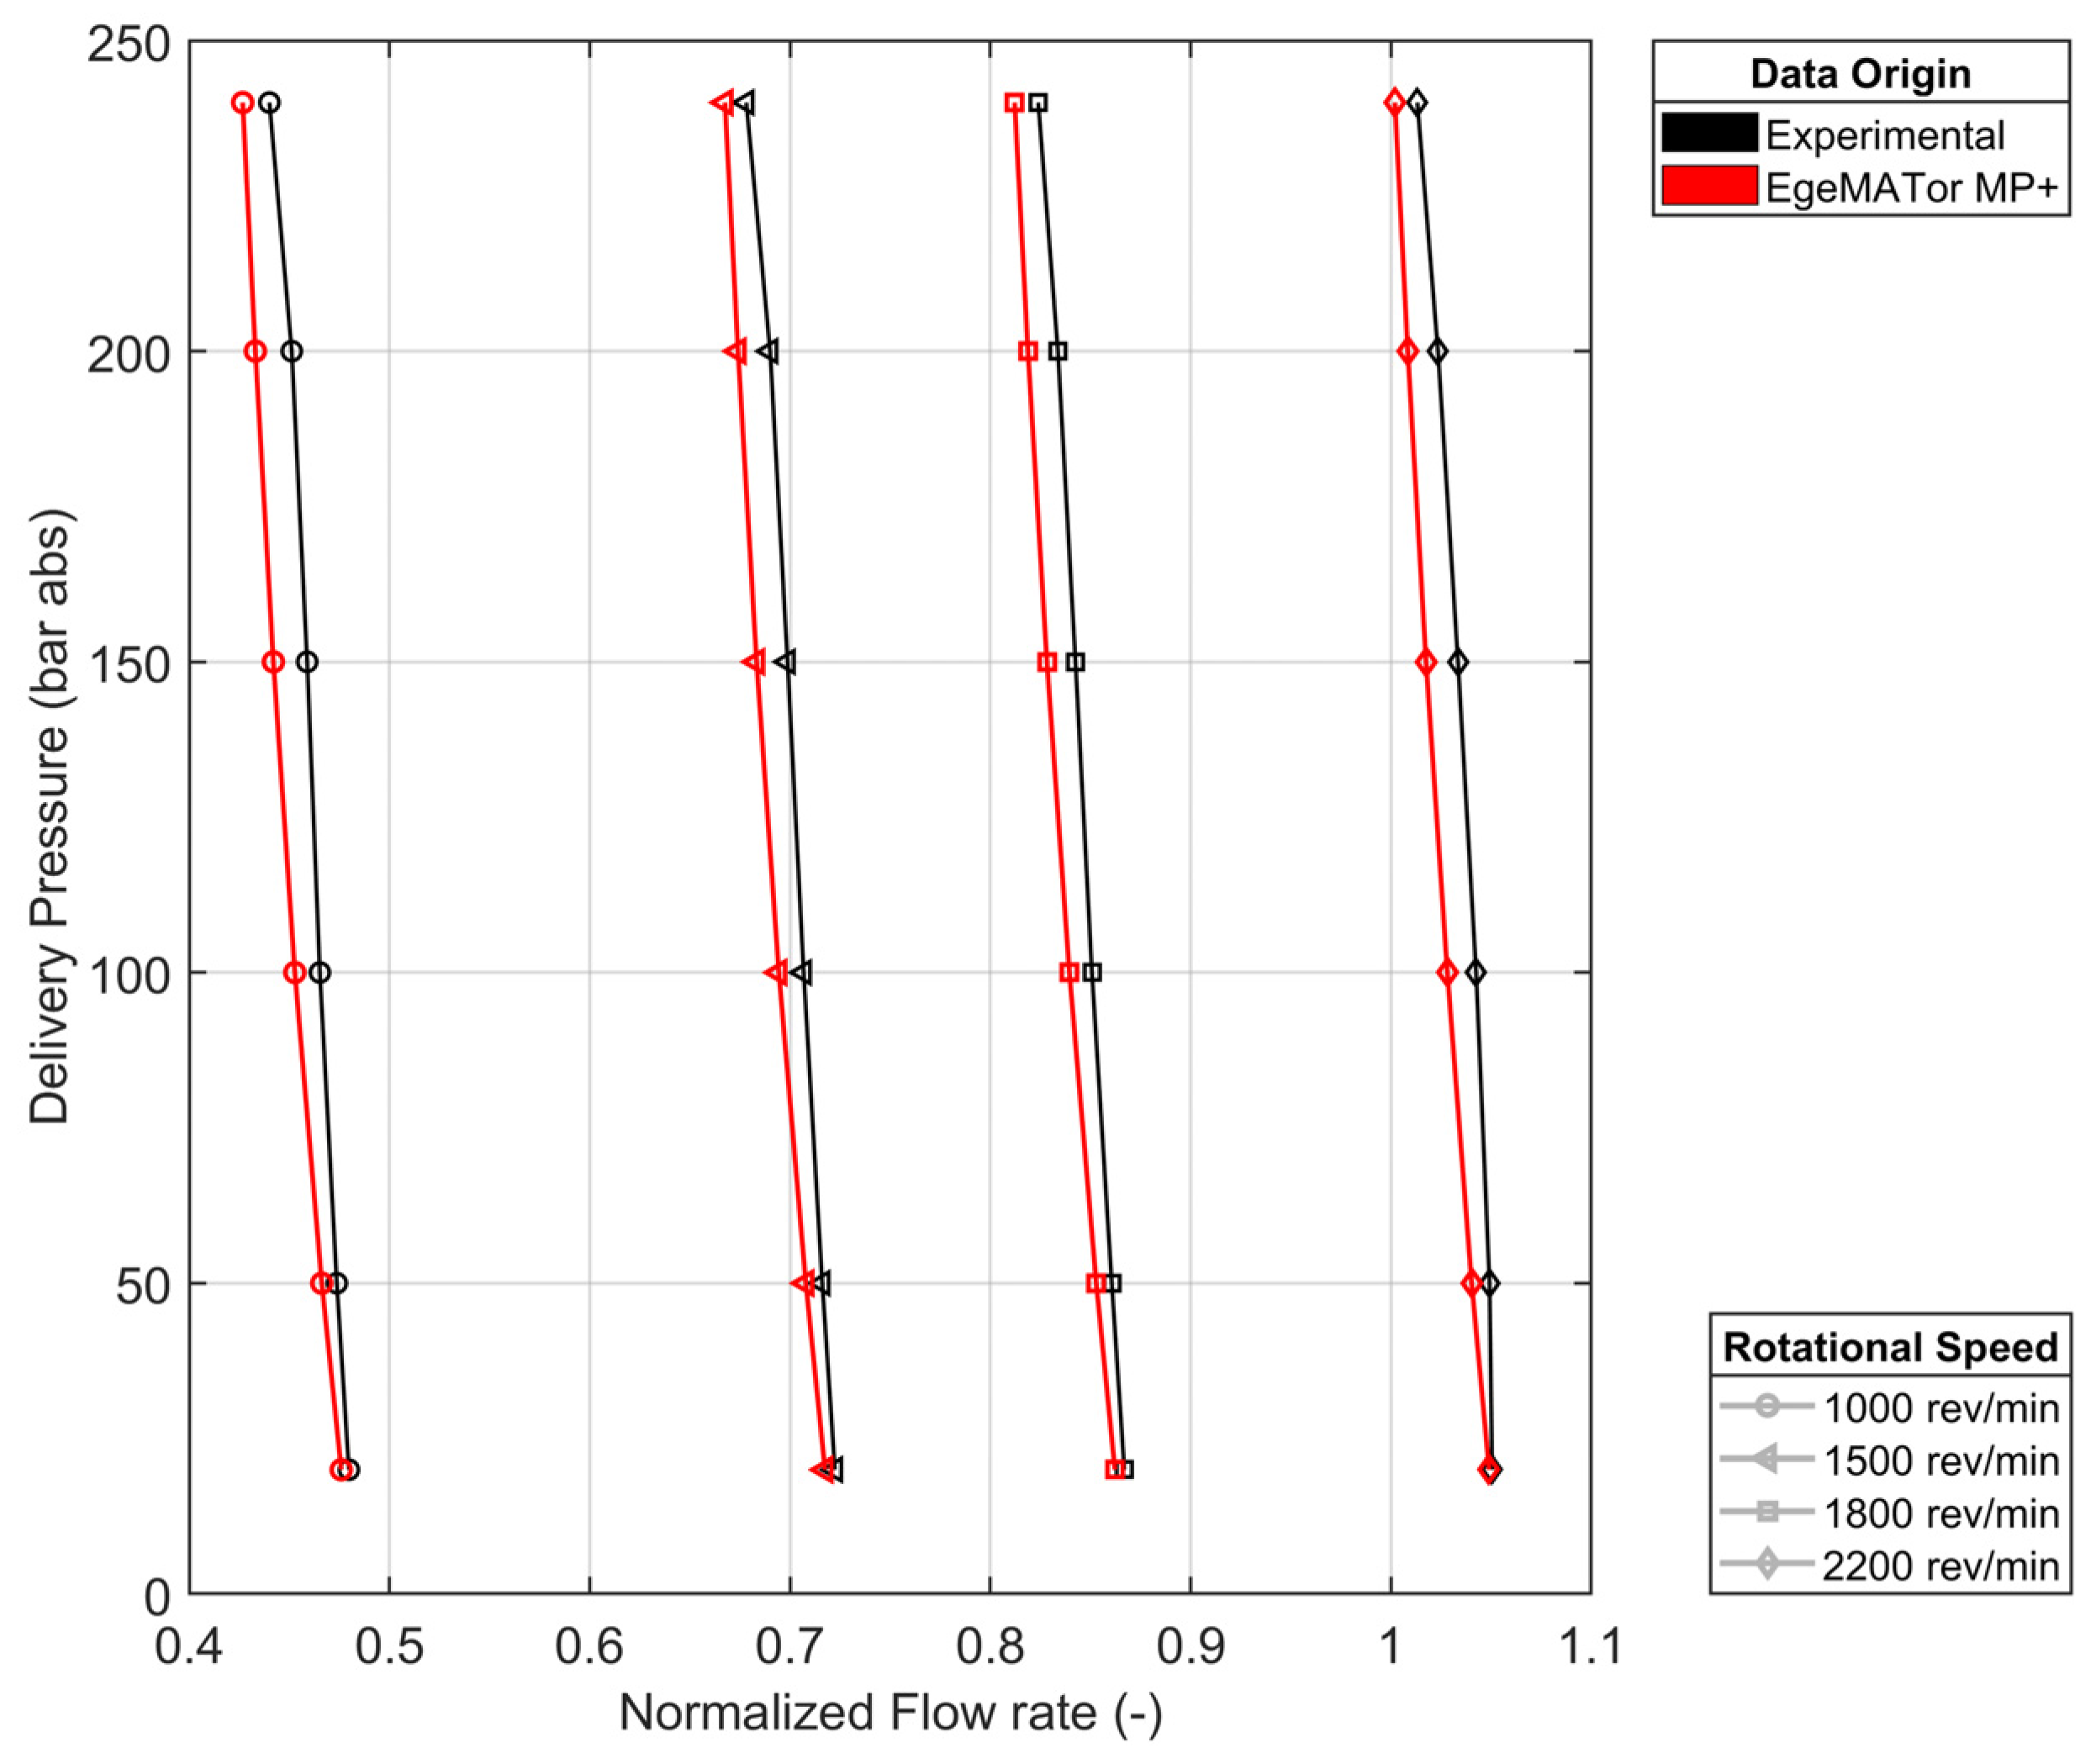
Figure 11 displays a comparison of the delivery flow-rate mean values between the experimental and the simulated data for a number of different working conditions. The flow-rate values have been normalized to a reference value,
, for competitive reasons.
The chart shows that both the numerical model predicts the delivery flow-rate mean values and trend with great accuracy, with a percentage difference from the experimental data of less than 1% for the 3D CFD numerical model and less than 3% for the lumped parameters model, staying thus under the uncertainty range of the experimental measurements.
The 3D CFD approach shows excellent accuracy for the rotational speed of 1500 rev/min, while the other two analyzed speeds exhibit less accuracy. This is likely due to the constraint required to execute the simulations approximating the real pump conditions for the rotational speed of 1500 rev/min compared to the others.
The lumped parameters approach exhibits accuracy inferior to the CFD but constant for every speed analyzed, thus ensuring reliability for a greater number of working conditions.
Furthermore, the lumped parameters model seems to overestimate internal leakage values, as this could explain the inverse proportionality of the accuracy to the delivery pressure.
Finally, it has also to be noted that for the lumped parameter model, more working conditions have been simulated with respect to the 3D CFD numerical model thanks to its reduced required computational time. The extra simulation values have not been included in the comparison for visual clarity but can be found in
Appendix A.
5.2. Pressure Ripple Analysis
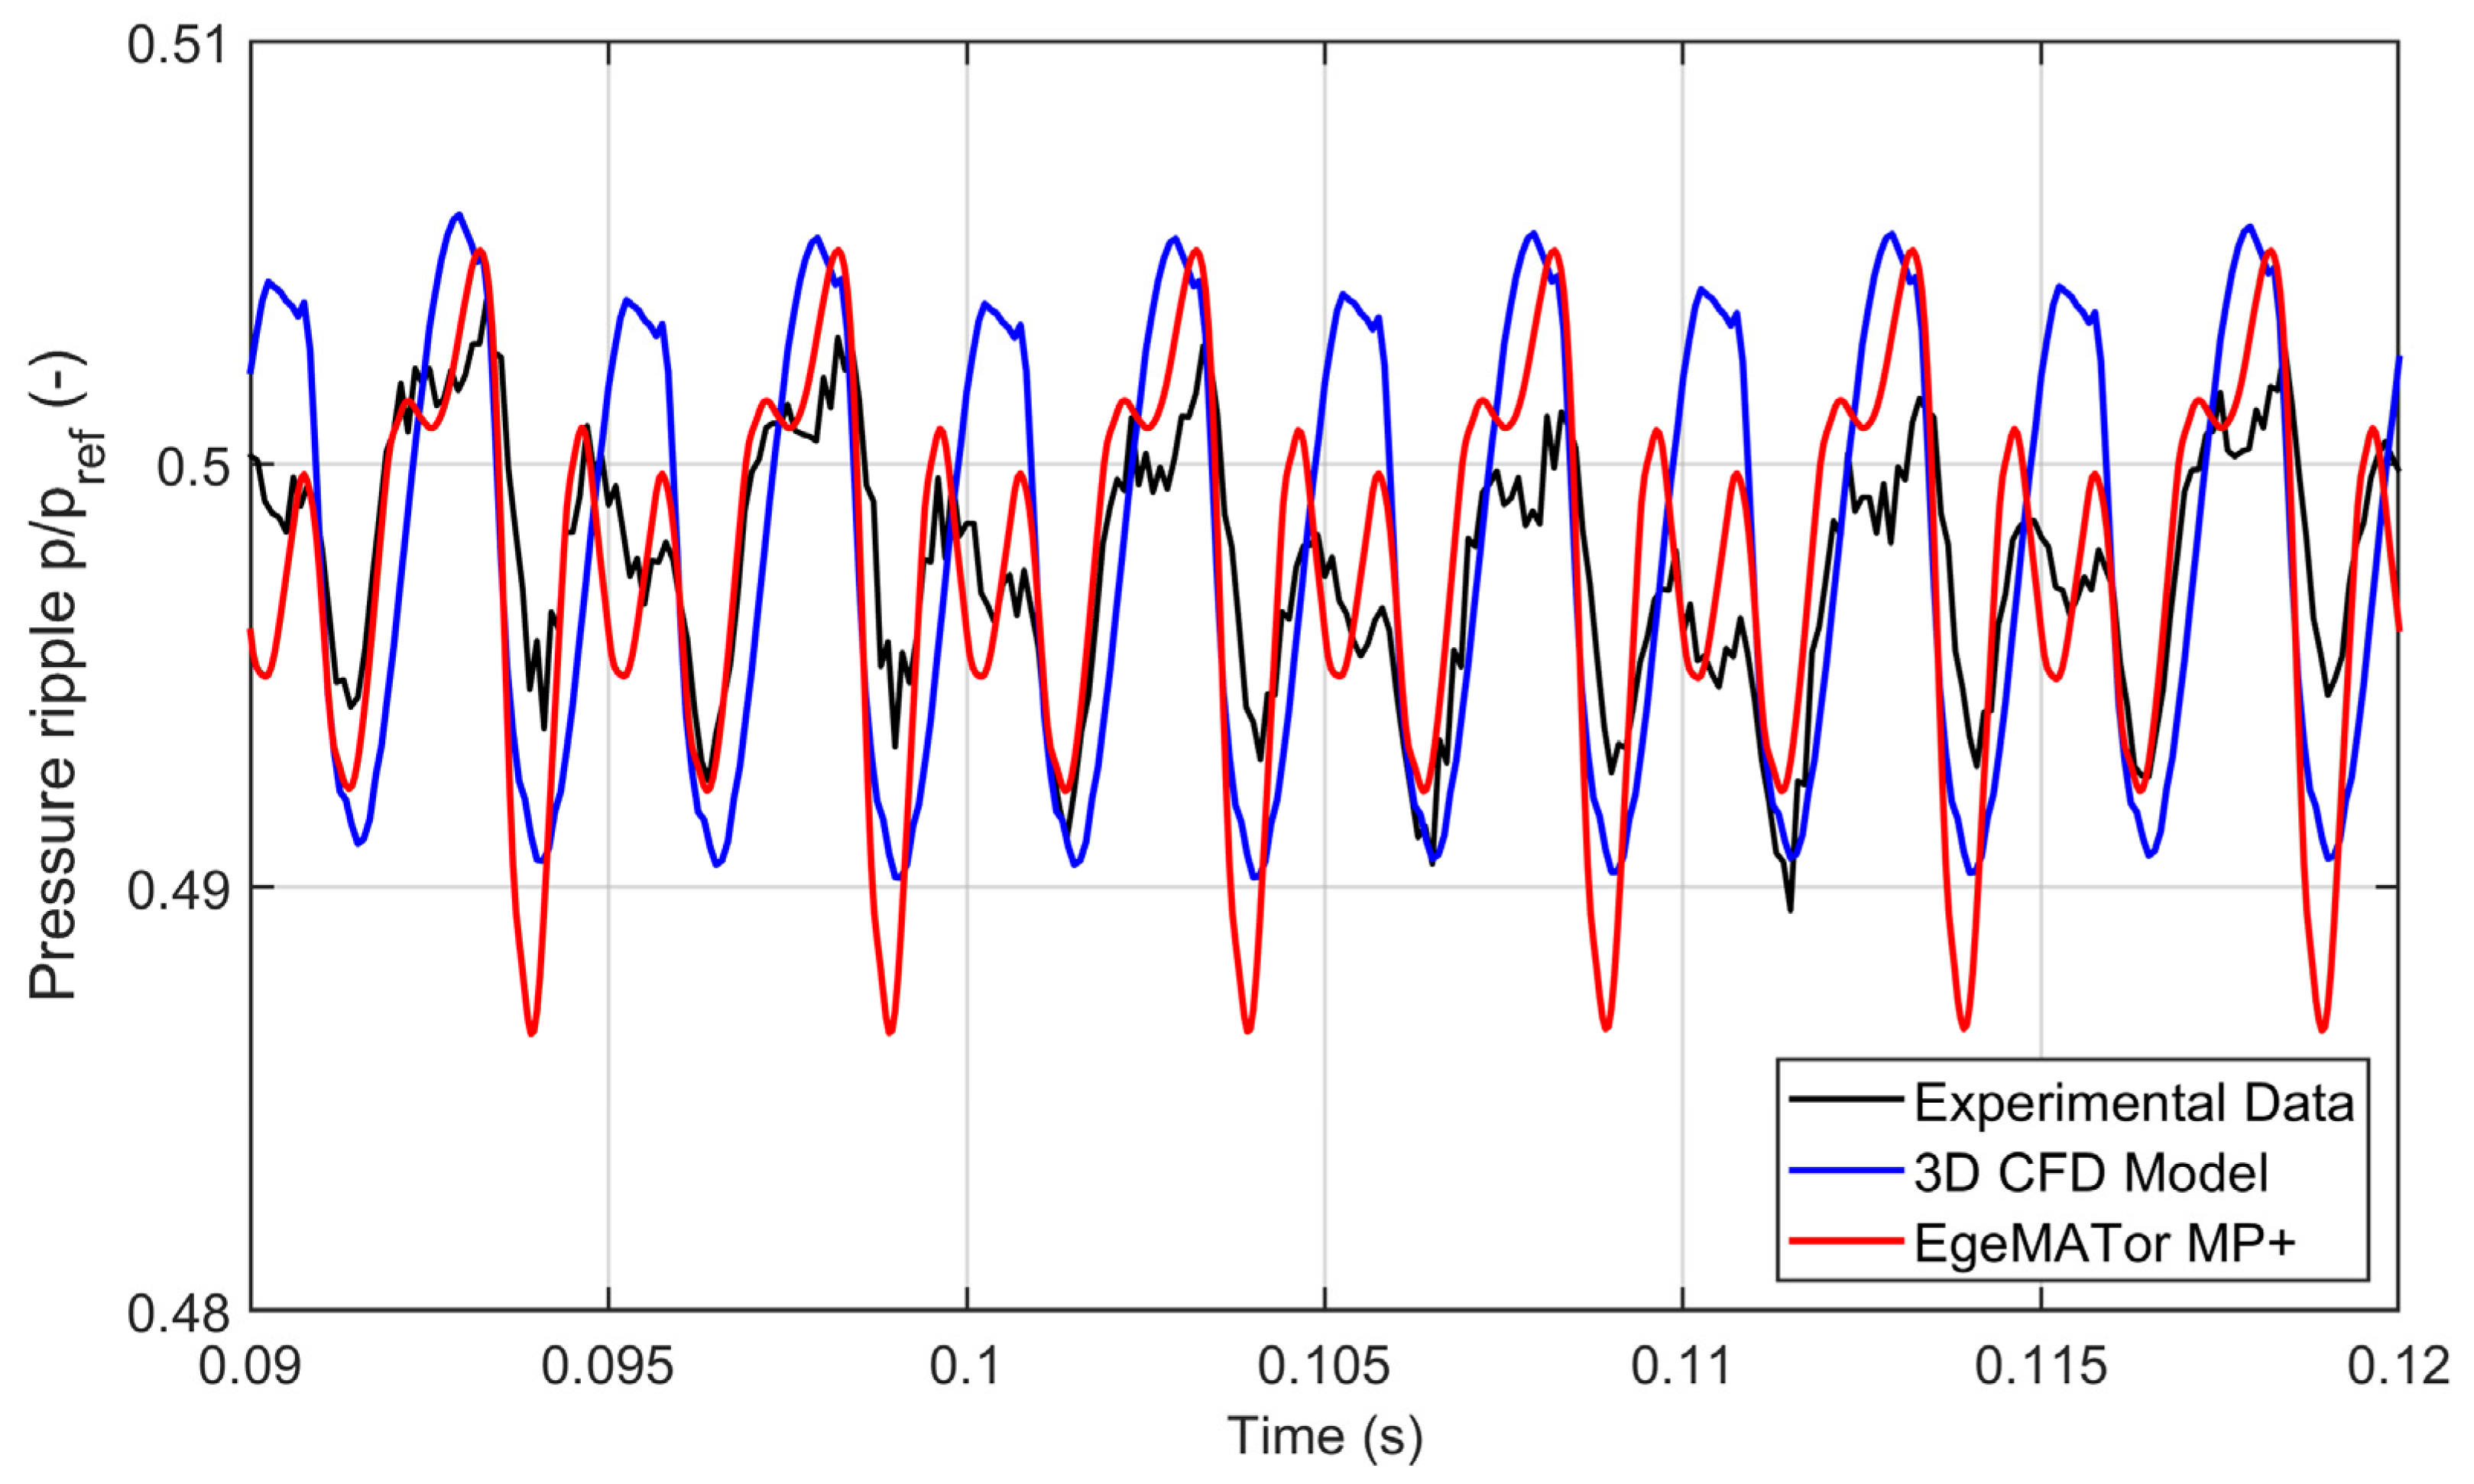
Figure 12 displays a comparison of the pressure ripples trends between the experimental and the simulated data for a rotational speed of 1500 rev/min and with a fixed orifice diameter of 1.72 mm. The pressure ripples values have been normalized to the reference value,
, for competitive reasons.
The examination of the experimental data suggests that the pump exhibits a dual-flank behavior for the working condition analyzed. Both numerical models correctly predict this behavior, reproducing the amplitude and the frequency of the pressure ripples measured with great accuracy. The CFD numerical model generally seems to better follow the ripple amplitude trends while the lumped model follows, with good accuracy, the first pressure ripple but overestimates the pressure drop of the intermediate throat and the second ripple peak of the meshing teeth couple.
Figure 13 displays the same pressure ripple trends comparison for a different working condition, that is, a rotational speed of 1000 rev/min with the same fixed orifice diameter of 1.72 mm. The pressure ripples values have again been normalized to the reference value,
, for competitive reasons.
The experimental data reveals that for this working condition, the dual-flank behavior is still present. Analyzing the chart, it can be seen that both numerical models replicate this behavior, correctly predicting the frequency of the pressure ripples measured with good accuracy, albeit with more amplitudes deviations than the previously analyzed case. The CFD numerical model, in fact, correctly predicts the first pressure ripple but greatly overestimates the second one. This error could be plausibly attributed to the model constraint of fixed gears’ positions and no null clearance.
The lumped parameter model again exhibits a higher pressure drop of the intermediate throat but generally demonstrates better trend prediction of the second ripple compared to the 3D numerical model. This is partly thanks to the lower delivery pressure for the case analyzed that reduces the negative effect of the overestimation of leakages and brings out the positive effect of the evaluation of the teeth contact that the lumped parameters approach allows considering.
As a further means of comparison and validation, a pressure analysis inside the meshing zone between the two numerical models has been conducted to evaluate how the approaches handle the pressure spikes during the meshing of the gears.
Figure 14 presents the pressure spikes comparison for a variable chamber of the driven gear for the rotational speed of 1500 rev/min and with a fixed orifice of 1.72 mm. For this case as well, the pressure values have been normalized to the reference value,
, for confidentiality reasons.
Both numerical approaches handle the pressure spikes in the meshing zone in the same way, with the lumped parameter model reaching a slightly higher maximum pressure value and reaching the inlet pressure earlier than the 3D CFD model. This is most likely due to the wave effect phenomenon that the 3D CFD model can evaluate, but the lumped parameter cannot, which contributes to the build-up of a certain “hydraulic inertia” that delays the actual pressure increase or decrease.
6. Conclusions
The paper is focused on the analysis of two different methodologies for studying helical EGPs: the first one is based on a 3D CFD approach using the commercial software Simerics MP+®; the second is based on a lumped parameter approach entirely developed by the authors in multiple environments, tightly interconnected. For this work, a commercial helical EGP has been utilized as a reference to validate and compare numerical models, thanks to the availability of experimental data performed on a dedicated test rig. Both numerical approaches have been detailed, highlighting their strengths and weaknesses and the tweaking required to reach more accurate results. Both numerical models have been set up with the same boundary conditions to obtain a more accurate comparison. In particular, the comparison has been focused on both steady state and dynamic behavior, analyzing the average flow rate and the pressure ripples at different working conditions.
The comparison of the steady-state outputs shows excellent agreement between both numerical models and the experimental data; in particular, the CFD numerical model exhibits slightly better accuracy, but both models exhibit differences against the experimental data inferior to the uncertainty range of the experimental measurements.
In addition, the pressure ripples comparison displays that both numerical models correctly predict the pressure ripples and the double flank behavior of the pump for the working condition analyzed. The amplitude of the pressure ripples is less accurate, with the first working condition showing a more accurate prediction for both models. This analysis reveals the impact of the no-zero clearance and fixed gears positioning constraints for the 3D CFD approach for the dynamic aspects analyzed, highlighting its weakness when it is used. The analysis also shows the strength of the lumped parameters approach, with its possibility to evaluate the teeth contact that permits the evaluation of the dynamic aspects with good accuracy for a wider number of working conditions.
In summary, both approaches show good agreement with the experimental results. The 3D CFD approach reaches great accuracy for both static and dynamic aspects, allowing thus deep analysis. These results, however, are limited to specific working conditions and require high computational power and time to be run. The lumped parameters approach, on the contrary, permits achieving good accuracy for a wider range of working conditions (
Appendix A), requiring just a small fraction of computational power and time, making it ideal for faster and extended optimization studies.
Future work will explore further the dynamic capabilities of the approaches and their adaptability to different types of EGMs. The effect of the wear on EGPs’ noise and performances will also be implemented in the numerical models, and the results will be compared to experimental results.


