1. Introduction
The idea of using air jets to manipulate aerodynamic forces on a body in an airstream has been around for a long time. In the world of aviation, the high lift performance of aircraft wings is typically enhanced using slotted flaps, but a similar effect can be obtained using the so-called jet flap. The idea was actively investigated from the late 1930s to the mid-1960s (see, for example, Küchemann [
1]) but was only ever applied to research aircraft, such as the Hunting 126, which, in 1963, achieved extremely high lift coefficients.
Applications of air jets to car design have been more modest. Götz [
2] explored the use of air jets to deflect airflow upstream of a car’s windscreen to reduce the demands on windscreen wipers at high speed.
Active flow control, using pulsed air jets for drag reduction of bluff bodies, has been extensively researched over many years, although there is little evidence of any practical application in the near future. For the purposes of this paper, only the application of passive air jets is considered, as these can be implemented more readily, especially if ducted from existing flows. In a few cases, the use of air jets to manipulate the shape of the body has been investigated. Osborne [
3] used an air jet on the trailing edge of the boot (trunk) to create an effective rear spoiler on a notch-back car shape and showed that the pressure distribution on the rear surfaces could be substantially manipulated. A similar device was applied to an Aston Martin sports car (Coe [
4]), producing a useful reduction in rear axle lift with a small drag benefit. Littlewood and Passmore [
5] showed that a passive air jet deflected downwards at an angle of 45° on the roof trailing edge of a simple Windsor Body produced a drag coefficient reduction in excess of 0.015 with a low momentum air jet.
The most common application of air jets to manipulate the aerodynamics of cars is in the use of air curtains around the front wheel apertures. Initially introduced by BMW [
6], these devices have become almost ubiquitous, although the drag reduction appears to be relatively small in many cases. A useful side effect is an apparent reduction in soiling on the body-side behind the front wheels.
The wind tunnel tests reported in this paper were conducted some time ago as a proof-of-concept study to promote interest in a more substantial investigation into the use of air jets to act as wheel spoilers to reduce the substantial drag produced by the front wheels of passenger cars. That interest did not materialise as very simple flat plate wheel spoilers were considered to be sufficiently effective, and the idea was shelved.
Other studies of similar air-driven wheel spoilers, both experimental and virtual, show conflicting results. Wolf [
7] has shown that using the airflow ducted from front-mounted heat exchangers and deflected vertically downwards forward of the front wheels had a benefit on the 1997 model of the Porsche 911, although the improvement in drag coefficient was not quantified. Two recent CFD studies conducted by Nabutola and Boetcher [
8,
9] to investigate air jet wheel spoilers on a simplified body and a DrivAer model concluded in both cases that there were no drag benefits available.
As the cost/benefit relationship of aerodynamic devices has changed in recent years with increasing costs for generating emissions, the idea of an air jet wheel spoiler may have become more relevant, and this original research may be worthy of consideration.
2. Experimental Set-Up
2.1. Basic Model
The simple model used for this experiment is shown in
Figure 1. It crudely represents the lower half of a typical car body with the cabin section removed. It was considered essential to have the wheels positioned in a realistic manner in the body and at a sufficient scale to avoid issues concerning Reynold’s number sensitivity. At the same time, a blockage ratio of approximately 5% was desirable, and this could not be reconciled with a full car shape. The basic body has an overall length of 1.245 m and is 0.6 m wide. The depth of the body between the wheels is 0.24 m, but the nose section forward of the front wheels is only 0.21 m deep. All edges of the main body are sharp except for the top and sides of the front face, which have a radius of 0.075 m. An add-on front underbody section was fitted for most tests, which had the same plan shape as the nose and extended back to the front face of the wheelhouse. This add-on was 0.025 m thick and 0.075 m long and had a radius on the front and side edges of 0.025 m.
The wheels are solid discs with a diameter of 0.24 m and are 0.08 m wide. The edges have a 45° chamfer and are 0.01 m wide to give a ‘tread’ width of 0.06 m. The bottom surface of each wheel is cut away by 0.005 m to provide a flat surface, crudely representing a loaded tyre. The wheelbase is 0.75 m, and the ground clearance is 0.065 m. The wheels are fixed and do not rotate. The frontal area, A, of the body and wheels, is 0.154 m2. The wheels are representative of the wheels on a typical lower medium hatchback car, which are approximately 0.6 m in diameter and have tyre widths of 0.20 m. As such, they can be considered to be 40% to scale.
The wheels are mounted on rigid axles that pass through the body and are set flush with the outer surface of the body. They are installed in rectangular wheel housings. At the front, the wheelhouses are 0.40 m long and are 0.15 m wide. At the rear, the wheelhouses are 0.36 m long and 0.11 m wide. At the rear, the wheels are located at the mid length of the wheelhouse, with a minimum tyre face lengthwise clearance of 0.06 m, while in the front, the wheelhouse clearance forward of the wheel is 0.10 m. The outer wall surface of all wheelhouses is 0.01 m thick, and the wheelarch is cut away to give a clearance of 0.02 m to the wheel diameter. The wheelhouses are the full height of the body, with a top surface wall thickness of 0.01 m.
2.2. Air Jet System
The air jet is created from an external compressed-air source that feeds into a box module mounted to the front face of each front wheelhouse. The module, which is sketched in
Figure 2, consists of a plenum chamber at the top that feeds through a contraction to a nozzle pointing vertically downwards at the bottom. The original modules were 0.15 m wide and 0.11 m tall and were the full width of the front wheelhouses. They had a nozzle 0.14 m wide by 0.001 m across. As this was not very effective, a reduced-width module was produced, which was 0.07 m wide, had a nozzle 0.06 m wide and was 0.003 m across. For both sets of modules, the cross-section of the plenum was 0.05 m tall by 0.05 m deep and was the width of the nozzle. The contraction is 0.05 m above the nozzle. The modules were fitted with a static pressure tapping in the plenum and just above the nozzle exit to provide an approximate idea of jet velocity.
The air supply to the model is from an external 600 kPa (80 psi) compressed-air source. It feeds into the underside of the model, on the centre line, just upstream of the base, through a 0.01 m bore flexible plastic pipe from the balance chamber beneath the wind tunnel working section floor. The pipe beneath the floor was routed vertically for a considerable length to minimise any force interactions with the model. The pipe runs forward through the model to between the front wheels, where it splits to feed the rear of the plenum of each module in the front wheelhouses. The arrangement is illustrated in
Figure 2. The air supply is controllable, and the pressure is measured before it enters the wind tunnel working section. The hole in the wind tunnel floor has clearance to the pipe and is covered by a streamlined fairing, mounted to the wind tunnel floor and extending upwards to approximately 0.003 m from the underside of the model.
2.3. Wind Tunnel
The wind tunnel used for this experiment was the Loughborough University Large Wind Tunnel. This tunnel is an open-circuit, closed-working section facility of novel design, as described by Johl [
10]. The test section is 1.92 m wide by 1.32 m high, with 0.2 m by 0.2 m corner fillets, and has a length of 3.6 m. The working section area, A
WT, is 2.45 m
2.
The operating airspeed range for the wind tunnel is 5–45 m/s. At 40 m/s, the turbulence intensity is 0.2%. The working section floor represents the fixed ground surface. The boundary layer on the floor of the working section at the turntable centre in the empty tunnel has a total thickness (99% freestream velocity) of 0.060 m, and the displacement thickness is 0.009 m.
A 6-component virtual centre balance is installed beneath the wind tunnel. The balance can be yawed, and it is connected to a turntable flush with the wind tunnel floor. It is connected to the model via four 0.008 m diameter unshielded struts that pass through small-diameter holes in the turntable into the centre of the flat underside of each wheel. The tare drag from the mounting struts is negligible.
Force coefficients are non-dimensionalized with respect to the frontal area, A, and the free stream velocity. The axis centre is located at the mid-wheelbase at ground level on the centre line. No corrections were applied to the measured coefficients. With a frontal area of 0.155 m2, the blockage ratio for the body with wheels is 6%, and corrections of the order of 10% may be applicable based on continuity principles. The accuracy of the underfloor balance allows force and moment coefficients to be determined significantly better than 1 count (0.001) at normal operating wind speeds for this model size. The overall repeatability for the drag coefficient is typically better than ±0.002 but is increased slightly for the lift coefficient.
3. Results
3.1. Basic Body
The aerodynamic characteristics of the basic body in the configuration, as shown in
Figure 1, were obtained with the air jet installed but not operational. The effect of varying the wind tunnel airspeed on the drag and lift coefficients is shown in
Figure 3, where the coefficients are plotted against the Reynolds number based on the model length, Re
L. The drag coefficient, C
D, is relatively high because the body is dominated by the wheels. The front axle lift coefficient, C
LF, is also high because of pressurisation inside the wheelhouse and the influence of the upper leading-edge radius on the body. Note that the rear axle lift coefficients, C
LR, are negative, which is typical of squareback geometries.
The wind tunnel airspeed varies from 20 to 40 m/s. Over that range, the drag coefficient reduces by ΔCD = −0.014 but is fairly consistent at the highest speeds. The total lift coefficient is reasonably constant over the speed range.
3.2. Plain Wheel Spoiler Comparison
Prior to testing with the air jets, a single wind tunnel test was conducted with a pair of plain wheel spoilers mounted on the front face of each front wheelhouse. This was undertaken in order to have a basic comparison for evaluating the effectiveness of the air jet. Each spoiler was a simple flat plate, each 0.120 m wide and protruding into the airstream by 0.018 m. The outboard edge of the spoiler was inset from the outside face of the wheel by 0.025 m. These would represent full-scale wheel spoilers that were 0.30 m wide by 0.045 m deep, which were typical at the time of the experiment as anything larger was unpopular with some car designers (stylists) for aesthetic reasons.
With a wind tunnel airspeed of 40 m/s, the reduction in the overall drag coefficient generated by the pair of wheel spoilers was ΔCD = −0.012.
3.3. Air Jet Performance
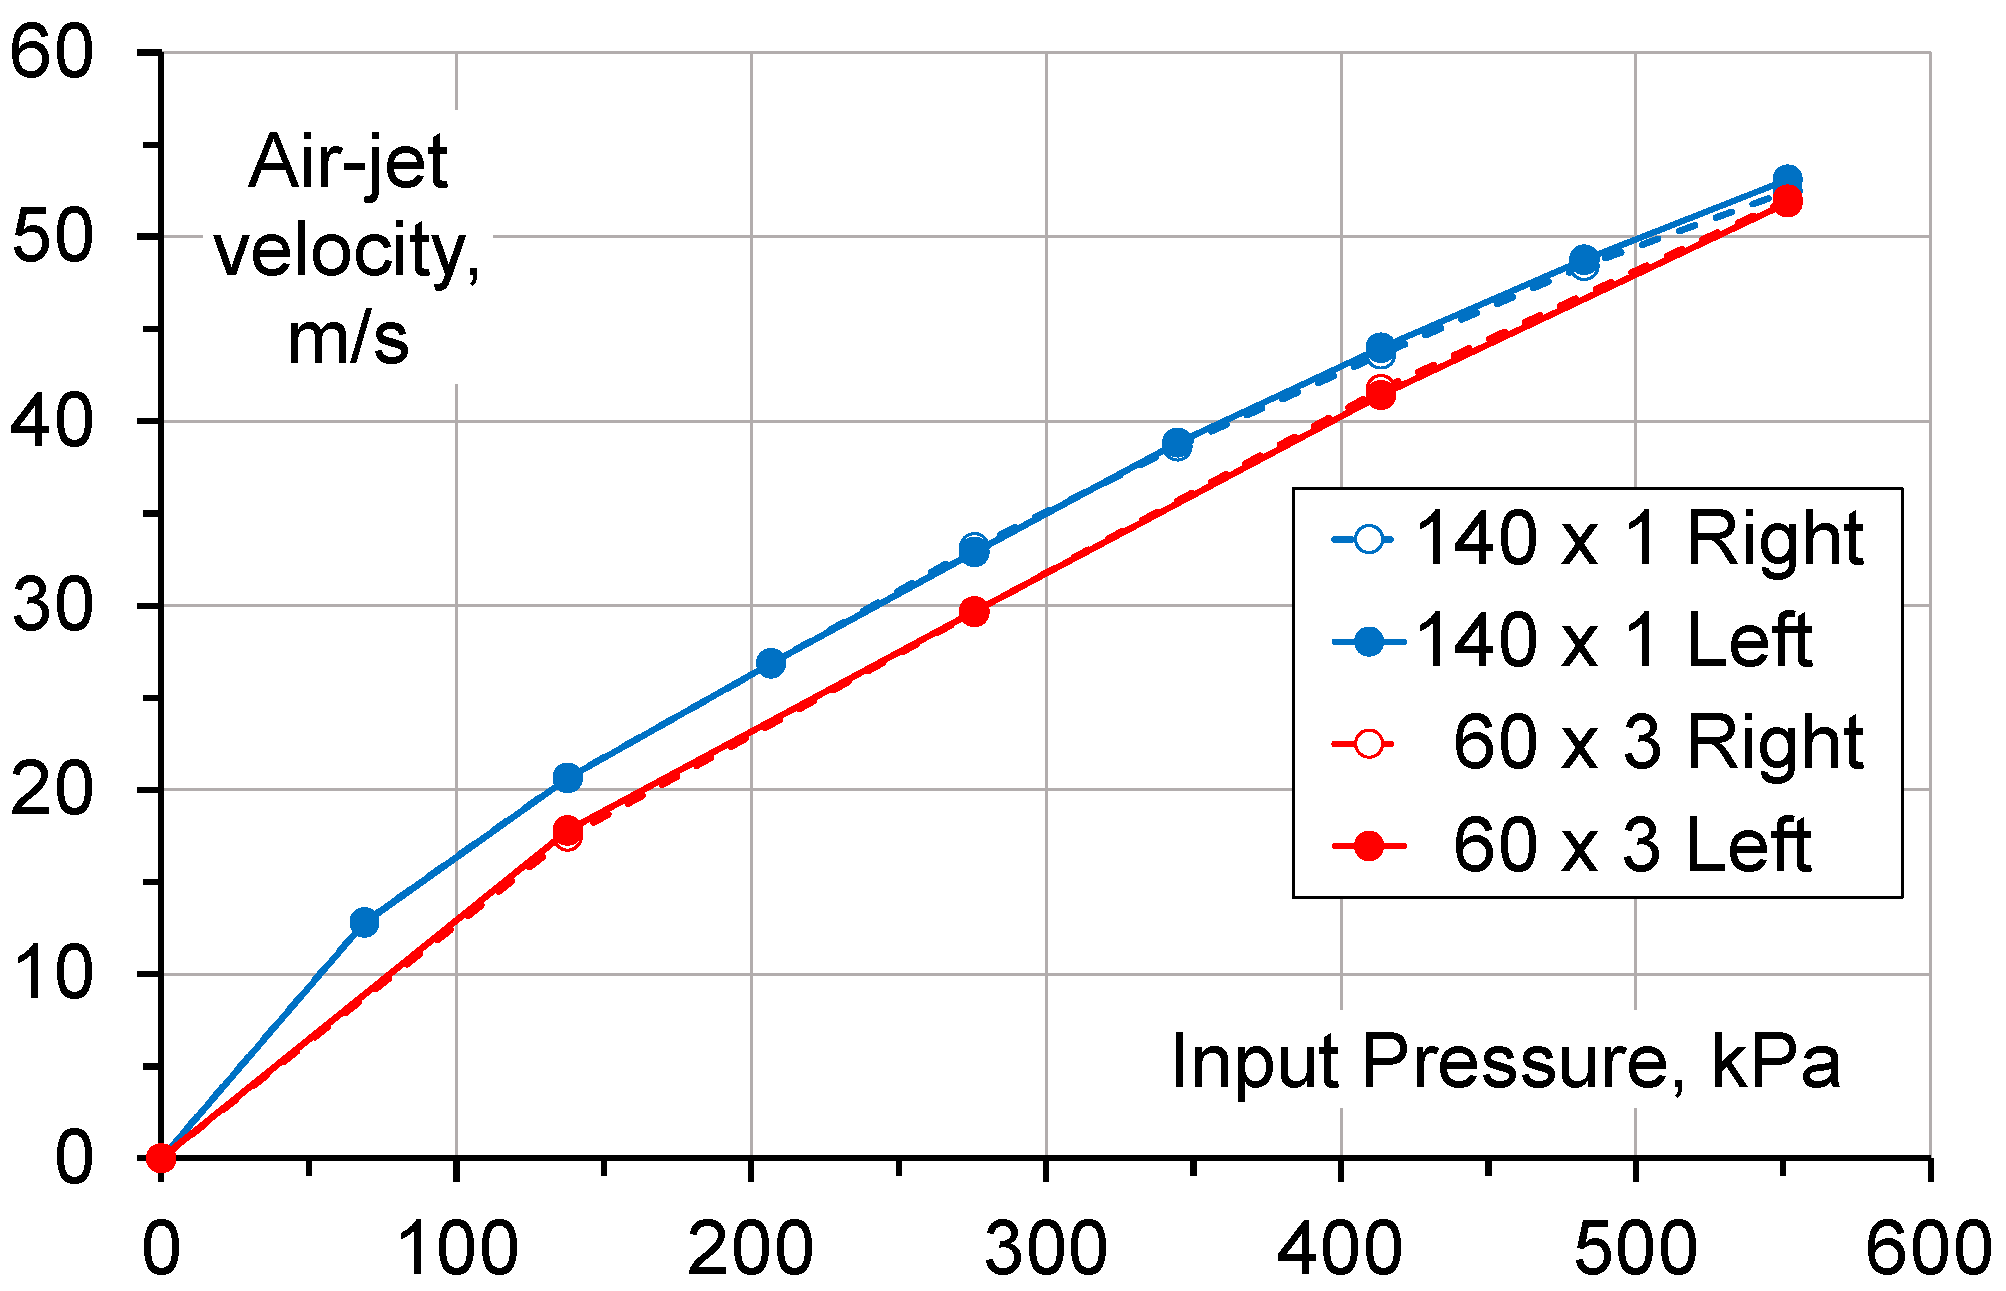
Air jet velocity as a function of the compressed-air pressure input is shown in
Figure 4 for the two air jet configurations with no airflow in the wind tunnel. The air jet with a 0.14 m × 0.001 m nozzle is shown in blue, and the 0.06 m × 0.003 m nozzle is shown in red. Solid symbols show the air jet mounted on the left wheelhouse, while the open symbols are for the one mounted on the right side. Some unsteadiness was experienced with the velocity measurement when the maximum pressure was applied.
The measurement is obtained at the centre, width-wise, of each air jet. The larger cross-section nozzle provides a similar output to the slightly smaller one. The distribution of the velocity across the width of the jet is not expected to be uniform. Given the exploratory nature of the experiment, a full calibration of the air jet output was not conducted. Based on a notional maximum volume flow rate for the compressed air input, the mean air jet velocity is approximately 60% of the measured centre line velocity. The data that follows are presented as a function of the known input parameter, the inlet pressure.
3.4. Tare Force Coefficients
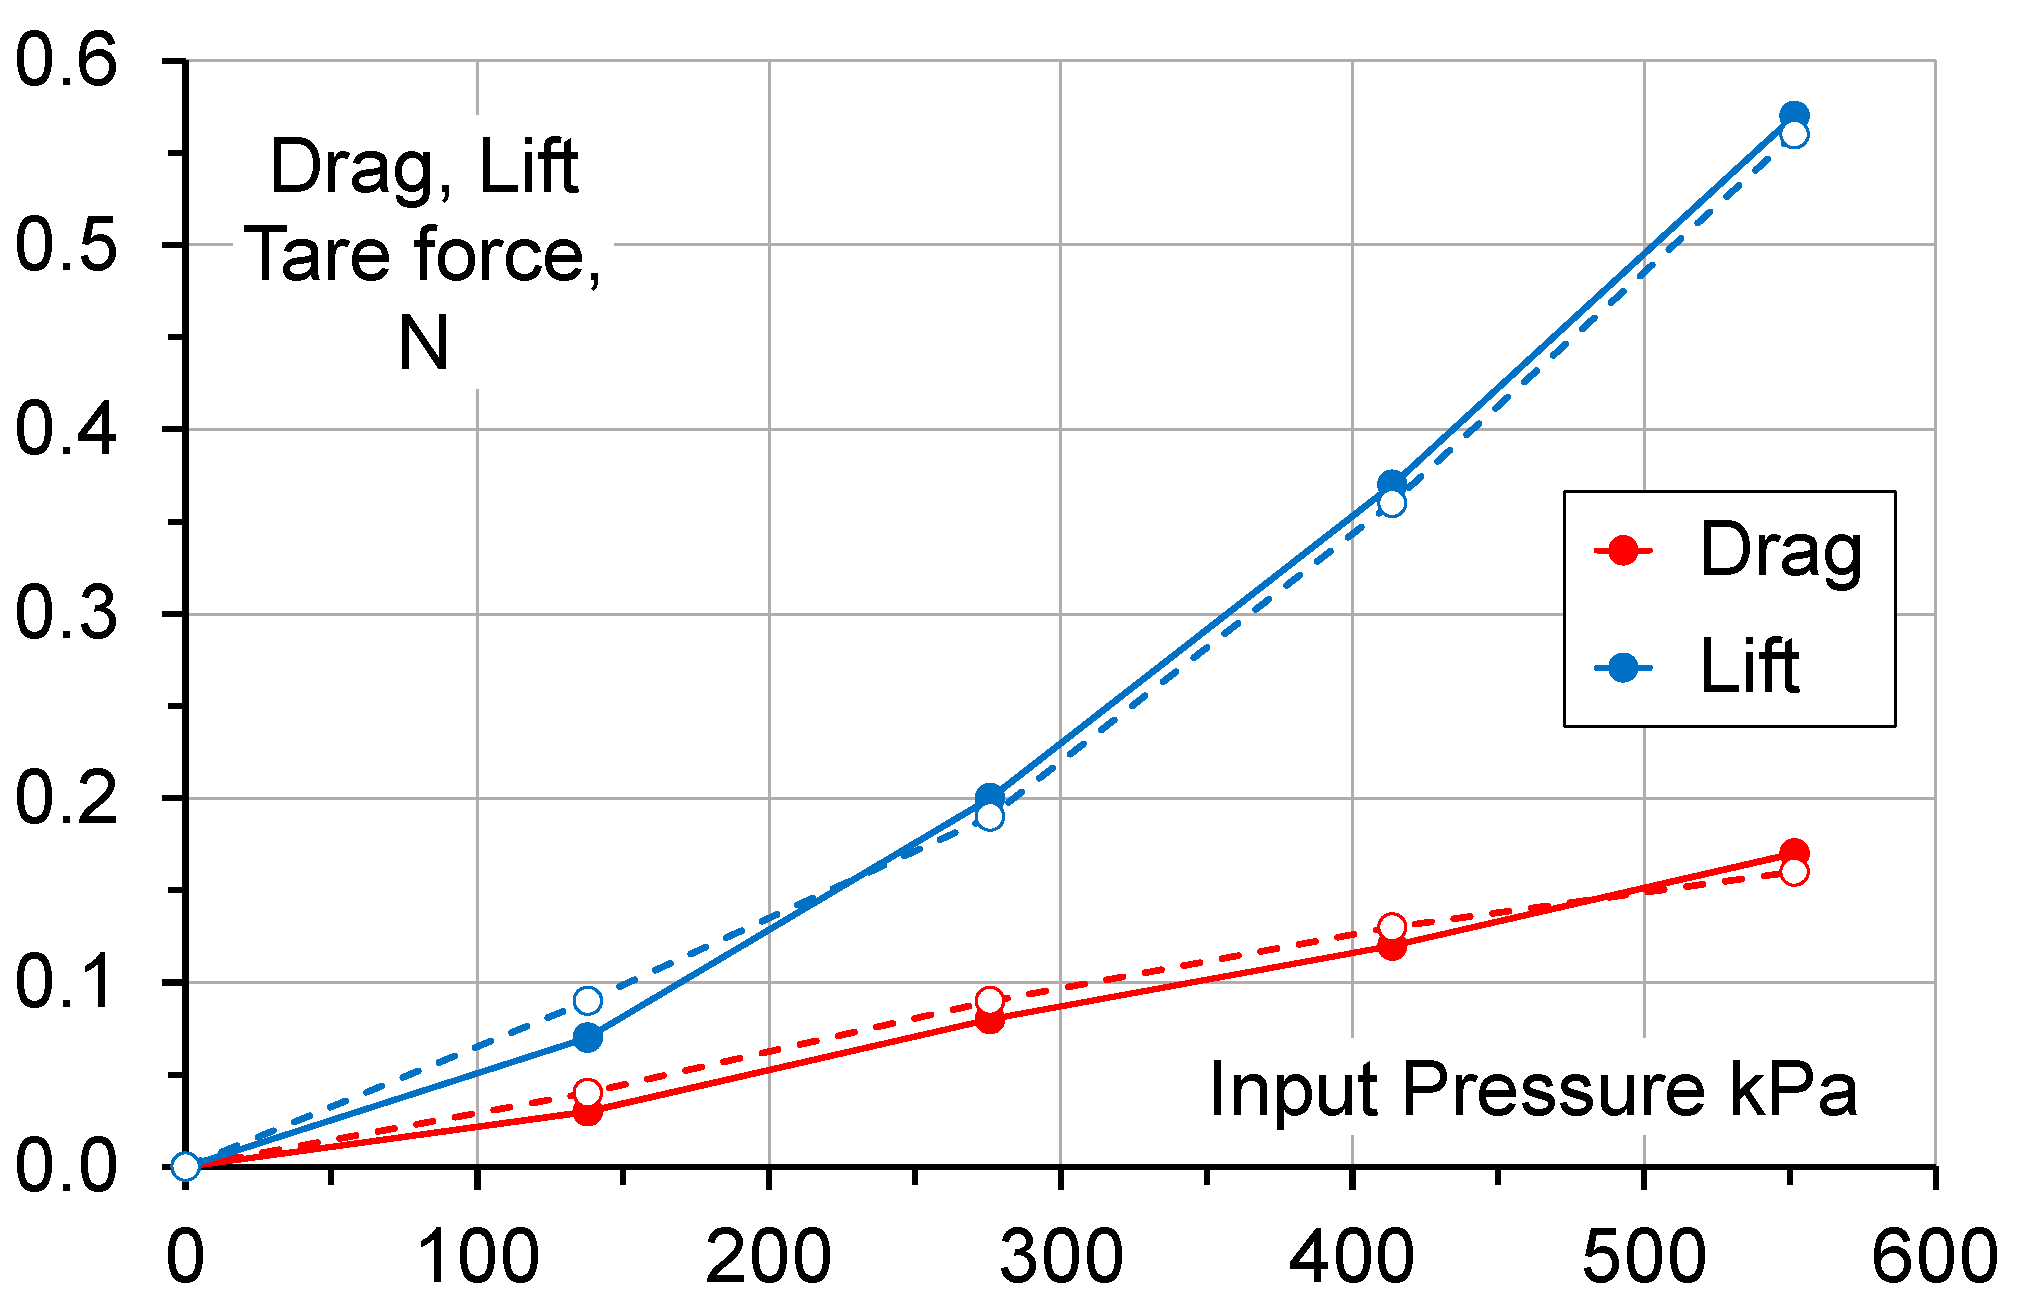
For the air jet with the 0.06 m × 0.003 m nozzle, the tare forces acting on the body were obtained with no wind tunnel airflow. The air jet was located so that the outboard edge of the nozzle was 0.035 m inboard of the outside face of the wheel. The drag and lift forces are shown in
Figure 5 as a function of input pressure. The solid and open symbols are for two runs and demonstrate reasonable repeatability.
Both forces are positive with the air jet, creating both drag and lift. On the assumption that these forces will exist when the wind tunnel is running,
Table 1 shows the effective increase in coefficient that results for a range of airspeeds.
For both drag and lift, the tare coefficients are small. They have not been applied to the following data because of a degree of uncertainty in their application when the tunnel is running, but if directly applied, they would enhance any drag benefit and reduce increases in lift.
3.5. AirJets—Initial Test
The initial air jet modules with the wide, thin nozzles produced very small changes in the overall drag coefficient. With a wind tunnel airspeed of 20 m/s and the maximum air pressure at the nozzle, the drag coefficient benefit obtained from applying the air jet was only ΔCD = −0.006. Increasing the wind speed to 40 m/s reduced this drag benefit to 1 count (ΔCD = −0.001). It was assumed that the thin jet sheet was overwhelmed by the onset airflow. Reducing the width of the air jet by 0.05 m by simply taping over the exit, as a crude attempt to increase the jet velocity, increased the drag benefit at a wind speed of 20 m/s to ΔCD = −0.010. A thicker jet was considered necessary, but in order to maintain a jet velocity close to that in the wind tunnel, the air jet had to be of reduced width, and so the pair of air jets with nozzles 0.06 m by 0.003 m were produced.
For the initial test with the revised air jet module, it was located 0.03 m inboard of the body-side and the outside face of the wheel and at the front of the wheelhouse. The edge of the air jet was 0.035 m inboard of the outside face of the wheel and close to the centre line of the wheel. The drag and lift coefficient changes as a result of applying an increasing air jet supply pressure for a range of wind tunnel airspeeds are shown in
Figure 6.
There is considerable sensitivity to the relationship between the air jet velocity, represented by the supply pressure, and the wind speed. At the lowest wind speed of 20 m/s, there is an initial pronounced reduction in the drag coefficient, which has a maximum when the supply pressure is approximately half the maximum, followed by a sharp reduction in the drag benefit. As the wind speed is increased, the air jet velocity for maximum drag reduction is increased, and with a wind speed of 40 m/s, the drag reduction continues to increase, almost linearly, with air jet velocity over the range of supply pressures available. A maximum drag coefficient reduction of approximately ΔCD = −0.015 is achieved.
Lift is always increased by the action of the air jet for the range of wind speeds and supply pressures investigated. The lift coefficient initially increases with the supply pressure and the wind speed, reaches a peak and then reduces. As with the drag reduction, the peak lift increase occurs at a higher pressure as the wind speed increases. At the highest wind speed of 40 m/s, the variation in the lift coefficient is small.
3.6. Effect of Lateral Position
The effect of changing the lateral position of the air jet module was investigated. The drag coefficient reduction and lift coefficient increase are shown in
Figure 7 for a range of positions. The offset represents the position of the outboard edge of the jet relative to the outside face of the wheel. Although data were obtained for a range of wind speeds, the data are only presented for a wind speed of 30 m/s.
The initial effect on drag due to increasing the air jet velocity (i.e., increasing the input pressure) is similar for all offset positions, with drag reducing linearly with pressure. At the initial offset position of 0.035 m, the rate of drag reduction reduces when the pressure is half the maximum, and the minimum occurs at approximately three-quarters of the maximum. Increasing the offset increases the linear range, and for the larger offsets investigated, the linear range is for all input pressures. The optimum value would appear to be close to an offset of 0.055 m. The inboard location for improved performance reflects the positioning of rigid wheel spoilers and is due to the pronounced flow angularity upstream of the front wheels, as shown by Wickern et al. [
11].
For the lift increase, this occurs at about half the maximum input pressure for all offset conditions. The maximum lift increases slowly as the offset is increased but reduces markedly for the largest offset considered.
The effect of the longitudinal position for the air jet module was briefly investigated. Spacing the module 0.025 m rearwards from the front face of the wheelhouse for a couple of offset conditions was found to have an almost negligible effect on both drag reduction and lift increase.
3.7. Repeatability
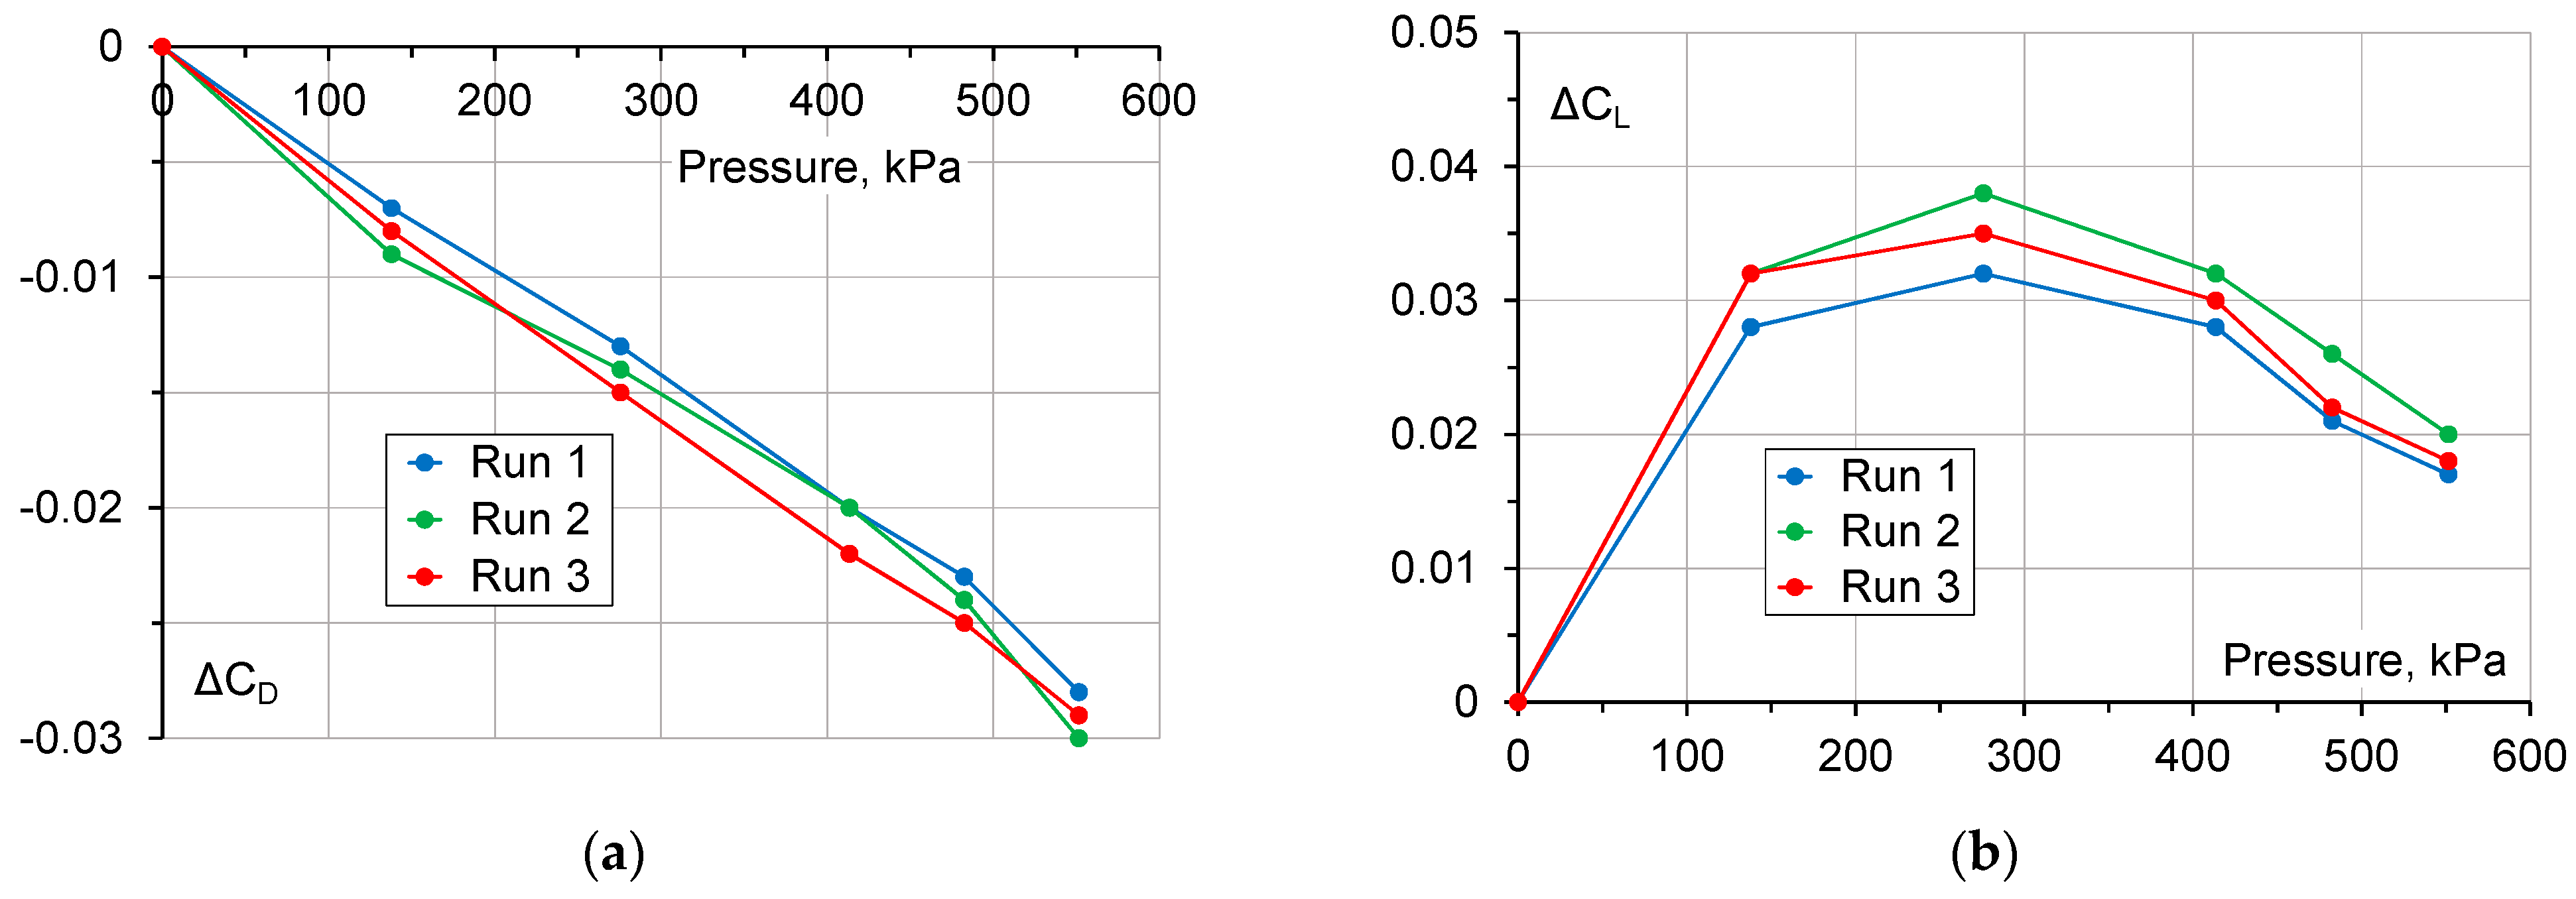
With the air jet module in the largest offset position of 0.065 m, the repeatability of the drag and lift data was investigated, as shown in
Figure 8.
From the limited data available, the drag coefficient is shown to be repeatable to approximately ±1 count (ΔCD = 0.001), while for the lift coefficient it is approximately ±0.003.
3.8. Effect of Wind Speed
The effect on drag and lift from increasing air jet pressure at the near-optimum offset configuration of 0.055 m for a range of wind tunnel airspeeds is shown in
Figure 9. The characteristics have changed noticeably from those shown in
Figure 6 for the initial configuration, particularly for the drag coefficient.
For drag, the reduction with pressure is approximately linear for all wind speeds investigated. The drag coefficient reduction at a given air jet pressure is reduced as the airspeed increases above 30 m/s. To maintain a particular drag reduction, the air pressure must be increased as the airspeed increases for airspeeds greater than 30 m/s. Lift initially increases as the pressure increases but then reduces. The maximum lift occurs at a wind speed of 30 m/s but is reduced substantially at higher wind speeds.
In
Figure 10, the drag and lift data shown in
Figure 9 are presented as a function of the ratio of mean air jet velocity to the wind tunnel free stream velocity. The centre line air jet velocity is derived using the calibration shown in
Figure 4. The mean air jet velocity, U
j, is then assumed to be 60% of the centre line velocity, as suggested in the earlier section of the results on air jet performance.
For the air jet configuration tested, the drag coefficient reduction is very consistent for wind tunnel airspeeds of 30 m/s and higher. The drag coefficient is reduced approximately linearly as a function of the air jet to free-stream velocity ratio, and the reduction is constant for a given velocity ratio. The potential drag coefficient reduction is likely to be greater than that measured as the linear trend could be maintained at higher velocity ratios. This suggests that an air jet ducted from an intake in the front bumper would have desirable characteristics.
The lift data show that at airspeeds greater than 30 m/s, the air jet has a consistent and very small effect on lift. At lower airspeeds, the lift coefficient is considerably higher for velocity ratios less than 1.0 but is substantially reduced at higher velocity ratios. The reason for the significant change in the lift characteristics is not known.
4. Discussion
4.1. Wheel Drag
The wheels and wheelhouses on a passenger car are a significant source of aerodynamic drag. Wickern et al. [
11] have shown that the combined drag can be as much as 30% of the total for a typical medium-sized hatchback. In that experiment, the overall drag coefficient was 0.32, and the contribution from the four wheels and wheelhouses was 0.10. For a low-drag body shape, the drag from the wheel/wheelhouse combination would be approximately the same, and the contribution from the wheels to the overall drag would increase. Since the study by Wickern et al. [
11] was conducted, car drag coefficients have tended to decrease, and the most aerodynamic passenger cars have drag coefficients approaching 0.2. At the same time, tyre widths have tended to increase, and, in the case of SUVs, ground clearance has increased, with both parameters increasing wheel drag. This increase has been partly offset by a drag reduction from reduced wheelhouse volume through the use of relatively close-fitting wheelhouse liners, as first demonstrated by Cogotti [
12].
4.2. Scale Effects
The coefficient data presented above for drag reduction and lift increase are exaggerated because the reference area is unrepresentative of real vehicles. The simple body in which the wheels were mounted did not represent a typical car shape but was reduced in size to give a representative spacing between the four wheels, with a wheel size that was Reynolds number-insensitive while maintaining a reasonable wind tunnel blockage. According to Cogotti [
12], the Reynolds number for an isolated wheel to be post-critical is 3 × 10
5, based on diameter. This is achieved for the model wheels tested for airspeeds greater than 20 m/s.
On the basis that the wheels can be considered to be 40% scale for a lower medium-size passenger car, as suggested in the Basic model section, the frontal area would scale to 1.0 m2. As a typical frontal area for cars of this type is about 2.0 m2, the presented coefficients must be halved for a realistic data set. For different body types, the drag reduction would also depend directly on the ratio of the exposed wheel frontal area to the overall frontal area.
4.3. Implementation
When first proposed, implementation was resisted on the grounds of complexity and cost/benefit. Since then, however, the implementation of similar devices, such as the air curtain, has become commonplace. The introduction of increased penalties for emissions and the need to improve the range of electric vehicles has driven an increased awareness of the potential benefit of aerodynamic drag reduction within OEMs.
In the experiment described here, the air jet was supplied from an external compressed-air source. In practice. the air jet would function in the same way as an air curtain. with air ducted from the front of the car, ideally in a near stagnation region. This will entail some small duct losses if the ducting is properly designed. Alternative sources to supply the air jet could be devised using an exhaust-driven turbocharger or utilising the wheel as a pump, as suggested by Morelli [
13].
The volume flow rates required are relatively modest. A scaled-up air jet from that tested would have a width of 0.15 m and a thickness of 0.0075 m with an air jet velocity of approximately twice the free stream speed. At 30 m/s, this equates to a total volume flow rate of approximately 0.10 m3/s. It should be noted, however, that the design has not been optimised. The data shown suggest that the potential drag reduction will increase with increasing air jet velocity.
As stated, this was a very basic experiment to demonstrate that the concept was plausible. The variables of air jet width, thickness, angle, velocity, velocity distribution and position have either been only partially explored or, in most cases, not examined at all. The potential for the air jet to supplement existing wheel spoiler performance and the effect of yaw angle has not been investigated.
The important test feature that could not be explored in this experiment was the impact of rotating realistic wheels and tyres and the influence of relative ground motion. Introducing rotating wheels and a moving ground will, in general, change the absolute values of overall drag and lift coefficients, but trends will be similar; see, for example, Howell and Hickman [
14]. In this experiment, where the device is in close proximity to both wheel and ground, the effect is unknown, but it can be expected that the curvature of the air jet on its downward trajectory will be increased by the influence of the ground and reduced by the effect of wheel rotation. In any application to a passenger car, the optimum set-up will be dependent on the shape of the body, the size and design of the wheels and other details. As with other aerodynamic aids, there will be some vehicles where the device is effective and others where it has negligible benefits. With this consideration, an appropriate next step would be to investigate the effectiveness of the device as part of a car development programme, especially if an innovative idea is required. Initially, this would be carried out using CFD but with confirmation from full-scale wind tunnel testing.
4.4. Application
At the time this experiment was being conducted, it was thought that the interest in passenger cars would be limited to 4 × 4 s and sports cars. In the case of 4 × 4 s, the owners were usually requested by the manufacturers to remove wheel spoilers before any off-road driving. In the case of sports cars, the low ground clearance meant that any protrusions on the underbody were vulnerable to kerbs and speed bumps. There may have also been an opportunity for executive cars as some designers considered features such as wheel spoilers to be an inappropriate appendage for up-market cars. As time has elapsed and ideas have evolved with changing circumstances it would seem that the air jet wheel spoiler could be applied to almost any passenger car.
5. Conclusions
A wind tunnel experiment has been conducted to investigate the effectiveness of using air jets to act as wheel spoilers.
In the experiment, the air jet spoiler was created using a compressed air supply, but in practice, the device would operate in a similar way to wheelhouse air curtains, which have become commonplace on passenger cars.
The drag and lift changes are presented as a function of the air supply pressure, which can be taken as a crude measure of air jet velocity.
The drag coefficient reduction increases approximately linearly with increasing air jet velocity for the range of air supply pressures and wind tunnel airspeeds investigated.
For wind tunnel airspeeds of 30 m/s, drag coefficient reduction is a function of the ratio of air jet to free-stream velocity. A constant velocity ratio occurs naturally with an airstream-generated air supply.
The lift coefficient initially increases with increasing air jet velocity and then decreases. For wind speeds above 30 m/s, the lift coefficients and the variation of lift with jet velocity are low.


