Article

Portable Air Purifiers’ Predicted Efficacy in Mitigating Airborne Pathogen Transmission in an Office Room Featuring Mixing Ventilation

School of Engineering, RMIT University, Melbourne, VIC 3000, Australia
*
Author to whom correspondence should be addressed.
Fluids 2023, 8(12), 307; https://doi.org/10.3390/fluids8120307
Submission received: 30 October 2023 / Revised: 20 November 2023 / Accepted: 23 November 2023 / Published: 27 November 2023

Abstract

:
Portable air purifiers have been extensively used to improve indoor air quality and mitigate the transmission of airborne diseases. However, the efficacy of mitigation is strongly affected by the interactions between jet flows of processed air from the air purifiers and the background airflows driven by the ventilation system. Critical factors in this context include the position and capacity of air purifiers and the ventilation rate of the heating ventilation and air-conditioning (HVAC) system. These factors are investigated in this study via computational fluid dynamics (CFD) simulations and the infection probability for different scenarios is quantified using the latest airborne infection predictive model incorporating recent pathological and clinical data for SARS-CoV-2. The results show that the use of air purifiers can significantly reduce the concentration of particulate matter, thus contributing to a generally lower risk of airborne transmission. However, the position of air purifiers affects their overall efficacy remarkably. Comparatively, a central HVAC system is more efficient at removing airborne particles under an equivalent ventilation rate assuming it uses a mixing ventilation scheme.

1. Introduction

Portable air purifiers that are based on the technology of high-efficiency particulate air (HEPA) filters have been used extensively to remove particulate matter (PM), e.g., pollen, dust, bacteria, fungi, etc., and to improve indoor air quality (IAQ) in human-occupied indoor spaces. These air purifiers are theoretically able to remove ≥99.97% of particles with a diameter of 0.3 microns from the air [1], with particles larger or smaller than 0.3 μm potentially trapped with even higher efficiency. As they do not rely on a centralised air-handling system [2], they can be freely deployed as demanded, offering great flexibility and scalability of use. Previous studies demonstrated that HEPA air purifiers can reduce the indoor concentration of PM2.5 by as much as 92% [3]; thus, the use of HEPA air purifiers in indoor spaces is believed to have the potential to offer health benefits.
Since the beginning of the COVID-19 pandemic, HEPA air purifiers have been widely used in schools, hospitals, offices, etc., to help combat the spread of this disease. Health authorities the world over have published guidelines to help effectively use air purifiers in different settings [4]. In most cases, however, it is left to the users to determine how to position and operate the air purifiers according to their specific demands. Studies [5,6,7,8,9] reveal that the positioning of air purifiers may have a significant effect on their efficacy due to the interactions between the air jets from air purifiers and the background ventilation airflow in the room. An experimental measurement by Na et al. [5] in a classroom showed that an improperly placed air purifier can increase the PM concentration by 278% in localised regions. Ham [8] suggests that the virus-laden droplets released by an infected person may spread throughout the room via airflow from an air purifier, so that a single infected person can give rise to an infection cluster. Thus, they argue that the use of air purifiers to control the spread of COVID-19 should be approached with caution. Bertolín et al. [7] investigated the use of air purifiers to mitigate COVID-19 transmission in elevator cabins, finding that although optimal positioning can improve ventilation, a good choice of air purifier flow rate is more critical to ensure an adequate air turnover.
Although the COVID-19 pandemic has officially ended, air purifiers are still extensively used especially in healthcare, school, office, and residential settings all over the world and this trend may continue for a long period. This has raised concerns about their energy consumption in addition to noise and thermal discomfort [9], etc. Moghadam et al. [10] suggested auxiliary equipment including air purifiers may need to be integrated with the central heating ventilation and air-conditioning (HVAC) system for more effective contaminant control and energy saving.
This study using computational fluid dynamic (CFD) simulations aims to elucidate how air purifiers interact with the central HVAC system to jointly determine the air organisation and PM distribution patterns in a typical office room. CFD as a powerful tool has been extensively used in the analysis of pathogen transport and airborne infection in indoor spaces [4,11]. In particular, two-phase flow models have recently been integrated with biological and pathological data and models [11], allowing comprehensive analysis of the infection risks of various pathogens under different ventilation conditions. In this study, the infection risk associated with the inhalation of pathogen-laden particles is analysed based on the PM distribution in combination with a spatiotemporally solved infection risk model. The contribution of air purifiers to the mitigation of airborne transmission is thus determined and reported below. Compared to existing studies, this study is novel in that it presents a demonstration of how to use a combination of engineering techniques and pathological data to quantify the airborne infection under the effects of portable air purifiers.

2. Materials and Methods

The techniques used in this study are based on computational fluid dynamics (CFD) simulations of dilute air-particle flows. Details of these are presented below.

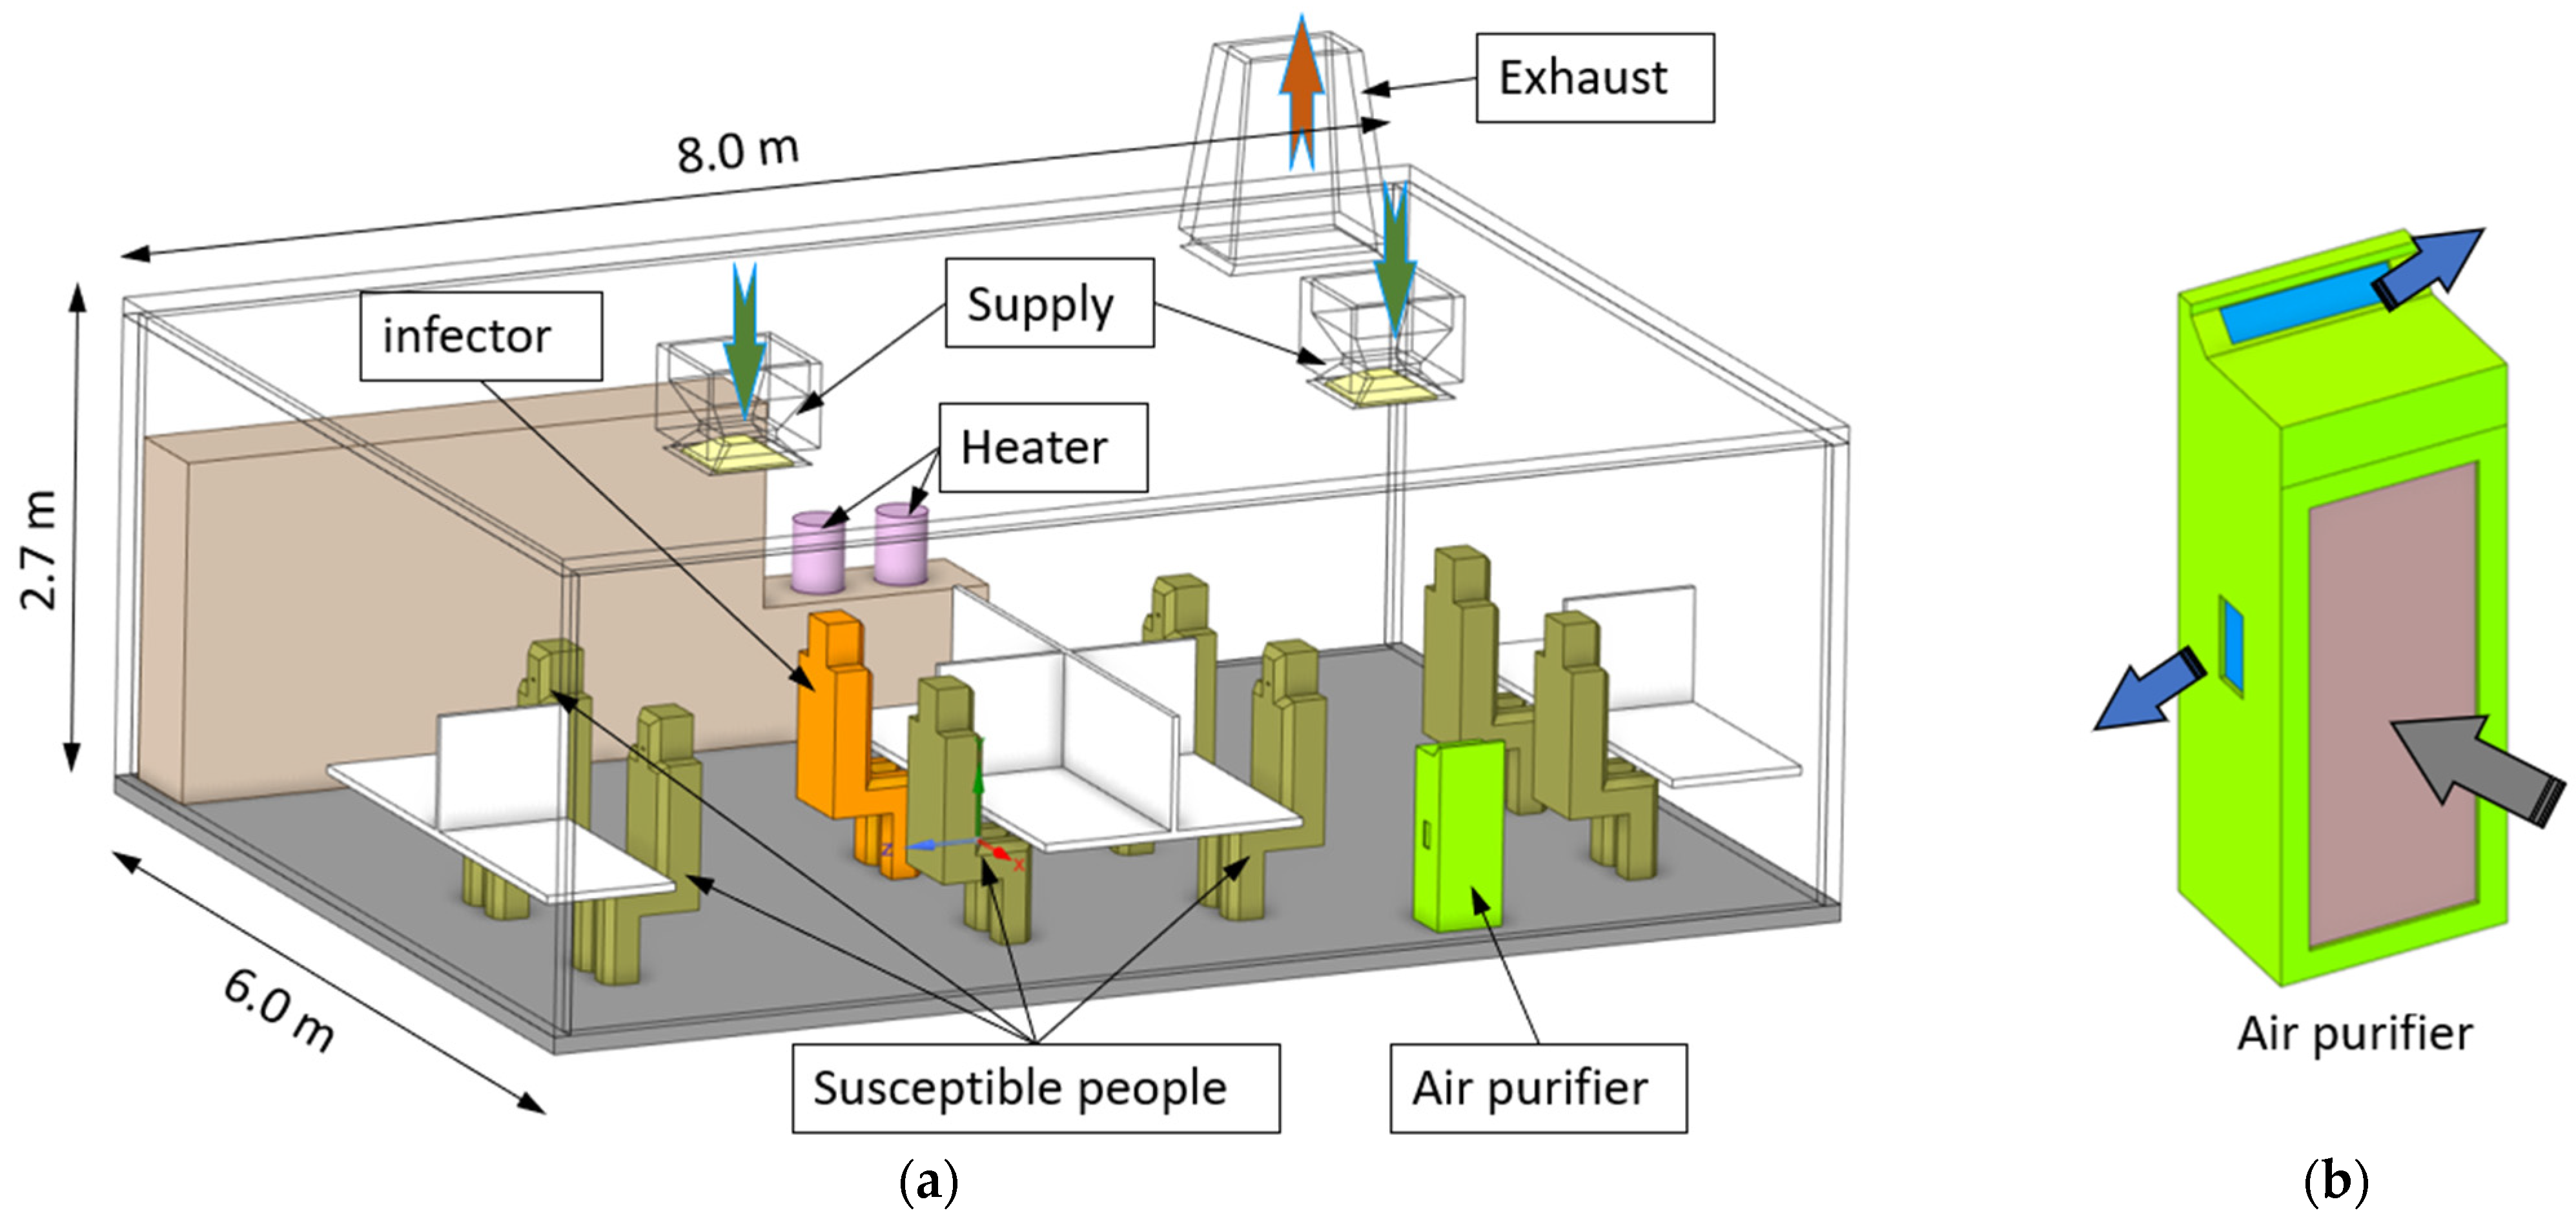
2.1. The Office Model

To investigate numerically the effects of air purifiers on indoor air quality and transmission of airborne diseases, an office room accommodating 8 occupants was developed; see Figure 1. Occupants had a fixed exhalation rate of 9 litres per minute, representing the typical human pulmonary rate while in a low physical activity state. The virtual office room had an effective floor area of 45.0 m2 and height of 2.7 m. The room’s HVAC system employed a mixing ventilation scheme by which air was supplied and exhausted via diffusers and exhaust vents, respectively, which were mounted in the ceiling. The supplied air had a constant temperature of 21 °C and a flow rate equivalent for this room to 3.0 air changes per hour (ACH). A small background ventilation rate was used in this study in order to minimise the effects of background airflow generated by the central HVAC system. In fact, field tests conducted by the authors in a research project funded by the Victorian Government [12] demonstrated that office buildings operating with a 5-star energy rating can have an ACH value as low as 3.0. Therefore, the selected ventilation rate represents a practical common value selected by the building service industry in Australia.
Heat sources in the room included 8 occupants and 2 heaters. The average human metabolic heat output is ~100 W/person, which is released via convection, thermal radiation, sweating, breathing, etc. This study only considered the convective component as the others were not expected to significantly affect the airflow pattern and thus aerosol transport. Metabolic convective heat was estimated at 60 W/person [13]. The office heaters, collectively representing all the heat-generating devices in the room, had a heat generation rate of 1800 W each. The combined heat load of the office room was 3880 W, which corresponds to a floor area-averaged heat load of 85 W/m2 and is close to the 87 W/m2 cooling load for offices as recommended by building service guidelines [14].
The office was further equipped with a portable air purifier that could be placed at different locations. As shown in Figure 1b, the air purifier ingested polluted indoor air from its front panel, filters out particulate pollutants, and then re-emitted air via three vents (one at the top, one on each narrow vertical side), with the emitted air being split with 40% from the top vent and 30% from each side vent. This air purifier model represents a typical type of HEPA air purifier used in Australian schools, healthcare facilities, and offices during the COVID-19 pandemic. The air purifier had a maximum air processing capacity of 700 m3/h and a filtration efficiency of 99.97% for 0.3 μm particles. In this study, the filtration efficiency was assumed to be 100% as the average particle size of this study (6.6 μm) was ≫0.3 μm; thus, complete filtration was expected.
It was assumed one of the 8 occupants (coloured orange) was infected with an airborne disease and was continuously exhaling pathogen-laden respiratory droplets. The other 7 occupants (coloured olive) were thus susceptible to infection. Due to the complex particle concentration distribution in the room, which was affected by the positions of the infector and air purifier, susceptible people sitting in different positions may have had different chances to be infected. These are quantified here via CFD simulations.
The main boundary conditions of the CFD simulations are listed in Table 1.

2.2. The Algebraic-Slip Mixture Model for Dilute Air-Particle Flows

This study focuses on the transport of human respiratory droplets because airborne pathogens are emitted within them during respiratory activities during coughing, sneezing, talking, and breathing. Although human respiratory droplets can be distributed across a large size range, only small droplets can become airborne because larger droplets quickly settle under gravity after being exhaled. In addition, airborne droplets typically evaporate quickly as they move through less than fully humid air, resulting in droplet nuclei that are ~26.5% of their original size [15]. Previous studies report that the average diameter of airborne human respiratory droplet nuclei is 6.6 μm in a typical indoor environment [11]. These droplet nuclei are termed ’particles’ in this study because they are water-free solid particles. The average particle exhalation rate is estimated to be 100 particles per second [16]. At such a low particle concentration and small particle size, the movement of the particles is strongly controlled by ambient airflows, which allows the overall aerosol flow to be reliably simulated using a mixture model.
The mixture model assumes the air-particle mixture as a single pseudo-fluid; thus, it only solves one set of conservation equations for the mass, momentum, and internal energy of the mixture, in addition to an additional transport equation for the volume fraction of the particulate phase. Momentum transfer due to the relative velocity between the phases is encoded via an algebraic equation as detailed momentarily.
The continuity equation of the mixture is expressed by
ρ m t + · ρ m U m = 0 ,
where ρ , t, and U are fluid density, time, and velocity, respectively. The subscript ‘ m ’ represents the air-particle mixture. Let the local volume fractions of air and particles be α a and α p , respectively, such that α a + α p = 1 . The mixture density and velocity are then defined by
ρ m = α a ρ a + α p ρ p ,
U m = α a ρ a U a + α p ρ p U p α a ρ a + α p ρ p
The subscripts ‘ a ’ and ‘ p ’ represent the air and particulate phases, respectively. In this study, the density of particles is assumed to be constant while air is modelled as an incompressible ideal gas [17] to account for the effects of thermal buoyancy flows.
The mass fraction c p and volume fraction α p of the particulate phase are related by
c p = α p ρ p α a ρ a + α p ρ p
The momentum equation of the air-particle mixture is expressed by
t ρ m U m + · ρ m U m U m = p + · μ m U m + U m T + ρ m g · μ p ρ p U d r , p U d r , p
where p is the fluid pressure, g is gravitational acceleration, and μ m is the mass-weighted mixture viscosity. Compared to the momentum equation for single-phase flows, the above equation contains an additional term (the last term) on the right-hand side that represents the momentum transport between the phases due to interphase slip.
U d r , p is the drift velocity of the particulate phase, defined as the particulate velocity relative to the mixture velocity
U d r , p = U p U m
The drift velocity U d r , p is related to the relative velocity of the phases U p a (such that U p a = U p U a ) by
U d r , p = U p a 1 c p
For small particle size and at low particle concentration, local equilibrium between the phases can be reached over a short spatial length scale. In this case, the drift velocity can be formulated using an algebraic-slip formulation [17] accounting for the effects of particle and air properties (e.g., density, viscosity, particle size, etc.), particle drag, buoyance force, particulate concentration, etc.
U d r , p = ρ p d p 2 18 μ a f d r a g ρ p ρ m ρ p g η t σ t α p α p α a α a 1 c p
where the drag coefficient f d r a g is calculated according to Schiller and Naumann [18]. σ t is the turbulent Schmidt number and η t is the turbulent diffusivity.
In the energy conservation equation, the enthalpy of the mixture is defined as the sum of the enthalpy of each phase weighted by its local volume fraction:
t i α i ρ i h i + · i α i U i ρ i h i = · i α i U i p + · τ e f f · U m + · λ e f f T + S h
where h is the sensible enthalpy, i = a or p representing the air and particulate phases, respectively. The effective viscous stress τ e f f is calculated based on the mixture properties, and the effective conductivity λ e f f is the sum of the molecular thermal conductivity and turbulent thermal conductivity of the phases.
The particulate volume fraction is modelled using a conservation equation applied to this transportable scalar and incorporating the particle drift velocity.
t α p ρ p + · α p ρ p U p + U d r , p = 0
The validity of the above algebraic-slip mixture model for dilute air-particle flows has been demonstrated using the experimental data of Chen et al. [19], as shown in Figure 2, which shows good agreement between the predicted particle concentration and experimental data along 3 selected lines in the domain. Details regarding the model’s validation have been presented in previous studies [11,20] and are not repeated here for brevity.

2.3. The Numerical Procedures

To solve the above theoretical model, a fluid domain was extracted from the CAD models presented in Figure 1. The computational domain was discretised using a poly-hexacore mesh composed of a 3D Cartesian mesh in the bulk region and polyhedral cells in the near-wall regions, as shown in Figure 3. The use of a Cartesian mesh in the bulk region can significantly reduce the overall cell count and improve numerical stability, while the polyhedral cells provide improved flexibility to capture complex domain geometries [17]. To better depict the boundary layer flows and heat transfer from solid surfaces, inflated polygonal prism layers were generated locally, which resulted in a y+ < 2.5 on heat-generating surfaces and y+ < 5.0 on remaining surfaces, which collectively allowed for the use of the SST k - ω model [21] for better depiction of near-wall flows including boundary layer and separating flows. Mesh independence [22] was achieved at 6.5 million cells; i.e., further mesh refinement by a factor of 1.25 in all the 3 coordinate directions caused only a small change (<0.2%) in the predicted particle concentration at the centroid of the domain.
During the computations, constant heat fluxes calculated simply from division of input power by surface area were applied at the occupant and heater surfaces. Mass flow boundary conditions were applied at the inlet and outlet of the air purifier according to its capacity of air processing. The heating effects of the air purifier were ignored, thus the air temperature at the air purifier outlet (an inlet for the computational domain) was specified as the area-average temperature at the air purifier inlet (which is an outlet for the computational domain).
The equations were discretised using the finite volume method and solved using the commercial CFD code Ansys-Fluent (2022R2, Ansys Inc., Canonsburg, PA, USA). A pressure-based coupled solver [17] was used to accelerate convergence. Convergence of these steady state CFD simulations was achieved within 5000 iterations, at which the normalised residuals dropped below 1 × 10⁻⁵ and mass imbalance over all inlets and outlets was <0.2%.

2.4. Analysis Tools

Several tools were used to analyse the airflow and particle transport phenomena, as well as the efficacy of air purifiers at mitigating the infection of airborne diseases.
First, the turbulent vortexes of airflow are known to have a strong effect on the dispersion of particles. To quantify the turbulent vortexes and their effects, the velocity gradient and its transpose were manipulated to form a vorticity tensor V and a strain rate tensor S . We began with
U m = 1 2 U m + U m T + 1 2 U m U m T
where the first and second term on the right-hand side of the equation are the vorticity and strain rate tensor, respectively:
S = U m + U m T 2
V = U m U m T 2
The Q criterion of Haller [23] was then used to measure the relative importance of the vorticity and strain rate
Q = V 2 S 2 2
By inspection, Q > 0 means the local flow is vorticity-dominant while Q < 0 represent the local flow is dominated by strain.
The inhalation of pathogen-laden particles may cause infections. The probability of infection was estimated using the Wells-Riley model [24,25], where the infection probability is given by a Poisson process and is dependent on the accumulated dose of pathogens inhaled by a susceptible person. The Wells-Riley model uses “infectious quanta” to characterise the dose of inhaled pathogens, which must be defined for specific pathogens. Li et al. [11] incorporated the pathological and clinical data of SARS-CoV-2 infection into the Wells-Riley model and developed a spatiotemporally resolved infection risk model for airborne transmission of COVID-19.
P = 1.0 exp 1 β ln 2 T C I D 50 δ α p d p , 0 3 d p 3 c p t h v t e
In the above equation, β is the filtration efficiency of personal protective equipment (PPE) worn by the susceptible person, which is not included in this study as people generally do not wear PPE in offices. T C I D 50 and δ are pathological data, representing the medium infection dose in tissue culture [26] and immunisation level of the susceptible person, respectively. The product of T C I D 50 and δ is then the pathogen dose needed to infect 50% of the susceptible population, known as the medium human infection dose ( H I D 50 = T C I D 50 δ ) [27]. d p , 0 and d p are the average diameter of hydrated droplets and desiccated particles, which jointly account for the dehydration process of respiratory droplets as they move the air [15]. c p t h is a clinical index, representing the number concentration of pathogens in the infector’s respiratory fluid, known as the pathogen load. v is the pulmonary rate of the susceptible person and t e is their time of exposure. Although the equation was originally developed based on the data variant of SARS-CoV-2, it can be easily extended for other pathogens if pathological and clinical data of the pathogen are available. The virological data of the delta variant of SARS-CoV-2 were used in this study to quantify the infection risk. The values of the above parameters are listed in Table 2 according to a previous study [11].

3. Results

3.1. Effect of Air Purifiers on the Airflow Field

The air purifier used in this study had a maximum air processing capacity of 700 m3/h, which increased the ventilation rate of the room by an additional 5.8 ACH when running in full mode, making the total ACH value 8.8. This was almost three times the original ventilation rate without a purifier. It was therefore expected that the air purifier would significantly change the airflow pattern and particulate concentration distribution. CFD simulations were conducted both with and without an air purifier being placed close to one of the tables (Figure 4). The predicted airflow field is presented in Figure 4a,b, which show the iso-surfaces of U m = 0.4 m/s in the room before and after the air purifier was turned on, respectively.
Figure 4 demonstrates that before the air purifier was turned, regions with velocity larger than 0.4 m/s only existed near the supply diffusers and exhaust vent (Figure 4a). When the air purifier was switched on, it created three significant jet flows (Figure 4b) towards different directions. The air jets then spread out when they hit solid surfaces such as walls and ceilings, significantly increasing the average air velocity in the room while also making the air velocity more unevenly distributed.
The contours of air velocity in the horizontal plane at the human nose height (1.32 m above the floor, termed here as the ‘breath plane’) are plotted in Figure 5a,b, before and after the air purifier was turned on, respectively. The location of the air purifier is illustrated by a grey dot and the direction it faces is indicated by an arrow. The unaugmented background ventilation airflow demonstrates air velocity in the breath plane as mostly lower than 0.2 m/s, although obvious velocity gradients were present in the room (Figure 5a). As the air purifier was switched on, it significantly increased the air velocity in the plane; i.e., a significant portion of the room showed air velocity > 0.4 m/s. In particular, the jets from the air purifier created several high-speed regions in the vicinity of the purifier and near the walls that were hit by the jets (Figure 5b).
The Q criterion is plotted in Figure 5c,d. According to Equation (14), green and blue regions in the figure denote where local flow was dominated by vorticity and strain, respectively, while grey regions had comparable intensities of vorticity and strain. The simulations show that in both cases, strain dominated near-wall regions while vorticity dominated the bulk region, showing large velocity gradients. The simulations show that although the area fraction dominated by vorticity ( Q > 0) only slightly increased from 52% to 55% when the air purifier was switched on, there was a 12.9-fold increase of the maximum Q in the plane from 2792 to 360,611 s−2, meaning strong dominance by vorticity in these regions.

3.2. Effects of Air Purifier Locations

Figure 4 shows that the air purifier created three air jets on its top and both sides, which resulted in high-speed flow regions in its vicinity. The increased air velocity and air vorticity (Figure 5) had a strong effect on air-particle mixing in the room. The simulated airflow field also indicates that the location of the purifier may influence the pattern of particle concentration and thus the infection probability pattern in the room. To understand the effects of air purifier relative to the infector, computations were conducted with the air purifier being placed at five different positions; see Figure 6. The positions were selected to be close to the walls of the room, based on the practice of using portable air purifiers in a general indoor setting; that is, the placement of air purifiers should not block walking paths in the room. In this section, the computations are performed with only one air purifier turned on for each case.
The predicted 3D particle concentration fields for different air purifier locations are shown in Figure 7. For the convenience of comparison, the particle concentration where the air purifier is turned off is also included in the figure. The particle concentration in the figures was normalised according to the particle exhalation concentration at the infector’s mouth. Figure 7 shows the scenario before the air purifier was turned on (Figure 7a), where high particle concentration existed in most of the room space, with the vicinity of the infector having a particularly high concentration. The concentration significantly decreased as the purifier was turned on and only a small region of high particle concentration was predicted in the vicinity of the infector. For AP position 1, the area-weighted average particle concentration (normalised) in the breath plane decreased from 2.8 × 10⁻³ down to 8.8 × 10⁻⁴, indicating a 69% decrease of the particle concentration in the plane, which would certainly contribute to a lower risk of airborne infections. Figure 7b–f indicate that the position of purifier location also had an effect, although this effect is minor compared to that shown in Figure 7a.
The Wells-Riley infection probability was calculated using Equation (15) based on the clinical and pathological data of the Omicron variant of SARS-CoV-2 [28] and an exposure time of 8 h. The infection probability may be quantified in a similar way for other airborne diseases when relevant data are available. The predicted infection probability distribution in the breath plane is shown in Figure 8, where the probability field is organised into four bands representing different levels of risk.
The results show that the infection probability was very high (larger than 0.75) throughout the breath plane when the room was ventilated only using the central HVAC system with an ACH value of 3.0. The risk was significantly reduced when the air purifier was turned on, with the infection probability in majority of the plane dropping below 0.5 no matter where the air purifier was placed. However, the position of the air purifier did have an effect on the pattern of risk. When the air purifier was placed at Position 1, the plane had a significant portion of infection probability between 0.50 and 0.75. This portion became very small when the air purifier was placed at Position 4. In addition, low-risk regions with an infection probability lower than 0.25 were created when the purifier was place at Position 4 and 5. In addition, Figure 7 shows that the medium/high-risk regions were located in different locations when the air purifier was placed at different positions.
The ratio of the area of each risk band shown in Figure 8 to the total area of the breath plane is quantitatively plotted in Figure 9, where Position 0 means the air purifier is turned off. It can be seen that the risk bands are very sensitive to the position of the air purifier relative to the infector. Considering the many possible positions in which an infector can be sitting or an air purifier can be placed in real-world indoor settings, it would be very challenging to effectively control the infection risk to a very low level throughout the space using portable air purifiers. It is therefore proposed that advanced air purifier control strategies [29,30] should be developed or the air purifiers should be integrated with the central HVAC system for more efficient particle removal and infection control. More efforts should be devoted to the development of smart control strategies concerning air purifiers.

3.3. Air Purifiers vs. Central HVAC System

Essentially, the use of air purifiers to remove particulate contaminants from indoor air produces an additional amount of clear air to dilute the contaminants in the space and remove the contaminants by discharging the polluted air to somewhere else for processing. This works in a similar way as that by supplying a large amount of processed air into the room via the central HVAC system. To compare the efficacies of air purifiers and a central HVAC system in removing particles from indoor air, two groups of computations were performed. One group assumed different air supply rates (ACH = 3.0–21.0) from the supply diffusers presenting the HVAC-only scenario, while the other group used a constant background ventilation rate of ACH = 3.0 from the central HVAC system in addition to three air purifiers located at AP Positions 2, 3, and 4. The air purifiers were assumed to be running at different levels (0% to 100%) of the full capacity, making the combined ventilation rate of room ACH = 3.0–20.3, which is comparable to the HVAC-only scenario. It should be noted that a wide range of ACH values were used here in order to conduct the investigation in a wide parametric range. The upper end of the ACH spectrum is very high and rarely used in practical building services due to the large noise, energy consumption, and thermal discomfort.
The infection probability was calculated for different ACH values based on the simulated particle volume fraction. The infection probability in the breath plane was divided into 3 bands: p < 0.25, 0.25 < p < 0.75, and 0.75 < p, representing low-risk, medium-risk, and high-risk regions. The area fraction of each band relative to the area of the breath plane under various ACH values is shown in Figure 10a. The figure shows that for the HVAC-only cases, ACH = 6.0 is a turning point where the regions of medium risk reach the maximum area fraction and the high-risk regions decrease to a very small area fraction. Beyond the point, the area fraction of the medium-risk regions begins to decrease while the low-risk regions gradually increase in size. When the room is ventilated using a combination of the central HVAC system and air purifiers, the changes of the area fraction of each band are much slower with increasing ACH. As shown in Figure 10a, the medium-risk regions gradually increased in size and reached the maximum area fraction at an equivalent ventilation rate of 13.4 ACH. Correspondingly, the increase of low-risk regions and decrease of high-risk regions were slower than those of the HVAC-only scenario. For example, the area fraction of high-risk regions (0.75 < p) quickly dropped to a negligible 0.02% at a ventilation rate of 6.0 ACH in the HVAC-only scenario, while it was still 60 times larger (1.2%) at the ventilation rate of 20.3 ACH in the HVAC+APs scenario.
Correspondingly, the area-weighted infection probability in the breath plane under different scenarios is shown in Figure 10b. It can be seen that when only the central HVAC system was used, the average infection probability quickly decreased as soon as the ventilation rate started to increase. The speed of probability drop gradually decreased so that there was only a small drop as the ventilation rate increased from 9 to 21, which, however, means a significant increase in energy consumption. The HVAC + APs scenario showed a similar trend; however, the decreasing speed of infection probability was slower in the beginning stage of low ventilation rates, although the two scenarios had comparable average infection probabilities when the ventilation rate exceeded 20 ACH.
The above results suggest that under the same equivalent ventilation rate, the central HVAC system may be a better option than air purifiers. This probably is because the mixing ventilation system of this study generated an even airflow field and well-mixed particle concentration field in the room; thus, the increase in the volume of ventilation airflow could effectively remove the particles. The air purifiers, however, created a complex airflow field in the room as they ran at a higher level of capacity. As mentioned before, the position of portable air purifiers can have a significant effect on the indoor airflow field and thus their efficacy in removing airborne particles. In this study, the air purifiers were placed at three positions determined based on the consideration of room use, which represents the practice in many circumstances. However, this may not be optimal for particle removal and infection control. More in-depth studies are needed to understand the interactions between the air purifier jets and background ventilation flows, and thus optimise the operation of air purifiers.

4. Conclusions

This study investigated the efficacy of using HEPA air purifiers to remove virus-laden particles and mitigate airborne diseases in an office room. CFD simulations of air-particle flows under different air purifier positions and ventilation rates were performed using the algebraic-slip mixture model, based on which the infection probability of COVID-19 was quantified using an improved Wells-Riley model. The conclusions rising from this study are as follows:
(1)
Air purifiers can effectively remove particulate matter and thus mitigate the infection risk of airborne diseases in the room. The efficiency of particle removal is proportional to the capacity of air processing by air purifiers.
(2)
Due to the complex interactions between the air jets from air purifiers and background ventilation airflow, the efficiency of particle removal is strongly affected by the position of the air purifier.
(3)
With the same ventilation rate measured by air changes per hour (ACH), the central HVAC system is more efficient than air purifiers for particle removal and infection control.

Author Contributions

Conceptualization, X.L., M.J.P. and I.S.C.; methodology, X.L.; software, X.L. and M.J.P.; formal analysis, X.L.; investigation, X.L.; resources, X.L., M.J.P. and I.S.C.; data curation, M.J.P.; writing—original draft preparation, X.L.; writing—review and editing, X.L., M.J.P. and I.S.C.; visualization, X.L.; supervision, I.S.C.; project administration, M.J.P. and I.S.C. All authors have read and agreed to the published version of the manuscript.

Funding

This research received no external funding.

Data Availability Statement

Data are contained within the article.

Conflicts of Interest

The authors declare no conflict of interest.

References

  1. Energy Department. Doe Technical Standard—Specification for HEPA Filters Used by DOE Contractors; Energy Department: Washington, DC, USA, 2015.
  2. Srikrishna, D. Can 10× cheaper, lower-efficiency particulate air filters and box fans complement High-Efficiency Particulate Air (HEPA) purifiers to help control the COVID-19 pandemic? Sci. Total Environ. 2022, 838 Pt 1, 155884. [Google Scholar] [CrossRef]
  3. Cheek, E.; Guercio, V.; Shrubsole, C.; Dimitroulopoulou, S. Portable air purification: Review of impacts on indoor air quality and health. Sci. Total Environ. 2021, 766, 142585. [Google Scholar] [CrossRef] [PubMed]
  4. Available online: https://www2.education.vic.gov.au/pal/ventilation-air-purification/guidance/operation-placement-air-purifiers (accessed on 11 August 2023).
  5. Na, H.; Kim, H.; Kim, T. Dispersion of droplets due to the use of air purifiers during summer: Focus on the spread of COVID-19. Build. Environ. 2023, 234, 110136. [Google Scholar] [CrossRef]
  6. Kim, C.; Yu, J.; Lee, Y.G.; Kim, J.; Bae, S. Identifying behavior of long-distance virus transmission and mitigation performance from a COVID-19 outbreak of a daycare center. Environ. Res. 2022, 212 Pt B, 113318. [Google Scholar] [CrossRef] [PubMed]
  7. Bertolín, L.S.; Oro, J.M.F.; Díaz, K.A.; Vega, M.G.; Velarde-Suárez, S.; Del Valle, M.E.; Fernández, L.J. Optimal position of air purifiers in elevator cabins for the improvement of their ventilation effectiveness. J. Build. Eng. 2023, 63, 105466. [Google Scholar] [CrossRef]
  8. Ham, S. Prevention of exposure to and spread of COVID-19 using air purifiers: Challenges and concerns. Epidemiol. Health 2020, 42, e2020027. [Google Scholar] [CrossRef]
  9. Cooper, E.; Wang, Y.; Stamp, S.; Burman, E.; Mumovic, D. Use of portable air purifiers in homes: Operating behaviour, effect on indoor PM2.5 and perceived indoor air quality. Build. Environ. 2021, 191, 107621. [Google Scholar] [CrossRef]
  10. Moghadam, T.T.; Morales, C.E.O.; Zambrano, M.J.L.; Bruton, K.; O’Sullivan, D.T. Energy efficient ventilation and indoor air quality in the context of COVID-19—A systematic review. Renew. Sustain. Energy Rev. 2023, 182, 113356. [Google Scholar] [CrossRef]
  11. Li, X.; Lester, D.; Rosengarten, G.; Aboltins, C.; Patel, M.; Cole, I. A spatiotemporally resolved infection risk model for airborne transmission of COVID-19 variants in indoor spaces. Sci. Total Environ. 2021, 812, 152592. [Google Scholar] [CrossRef]
  12. Li, X.; Restrepo, J.P.; Dalaney, J.; Cheng, C.T.; Gunasekera, S.; Langhorne, M.; Patel, M.J.; Lester, D.; Qin, K.; Pang, T.Y.; et al. Digitisation for Safe Workplaces—Victorian Higher Educaton State Investment Fund; RMIT University: Melbourne, Australia, 2023. [Google Scholar]
  13. de Dear, R.J.; Arens, E.; Hui, Z.; Oguro, M. Convective and radiative heat transfer coefficients for individual human body segments. Int. J. Biometeorol. 1997, 40, 141–156. [Google Scholar] [CrossRef]
  14. Hawkins, G. Rules of Thumb—Guidelines for Building Services, 5th ed.; BSRIA: Bracknell, UK, 2011. [Google Scholar]
  15. Li, X.; Shang, Y.; Yan, Y.; Yang, L.; Tu, J. Modelling of evaporation of cough droplets in inhomogeneous humidity fields using the multi-component Eulerian-Lagrangian approach. Build. Environ. 2018, 128, 68–76. [Google Scholar] [CrossRef] [PubMed]
  16. Chao, C.Y.H.; Wan, M.P.; Morawska, L.; Johnson, G.R.; Ristovski, Z.D.; Hargreaves, M.; Mengersen, K.; Corbett, S.; Li, Y.; Xie, X.; et al. Characterization of expiration air jets and droplet size distributions immediately at the mouth opening. J. Aerosol Sci. 2009, 40, 122–133. [Google Scholar] [CrossRef] [PubMed]
  17. Ansys, I. Ansys Fluent Theory Guide; ANSYS, Inc.: Canonsburg, PA, USA, 2023. [Google Scholar]
  18. Schiller, L.; Naumann, Z. A drag coefficient correlation. VDI Ztg. 1935, 77, 318–320. [Google Scholar]
  19. Chen, F.; Yu, S.C.M.; Lai, A.C.K. Modeling particle distribution and deposition in indoor environments with a new drift–flux model. Atmos. Environ. 2006, 40, 357–367. [Google Scholar] [CrossRef]
  20. Li, X.; Yan, Y.; Shang, Y.; Tu, J. An Eulerian–Eulerian model for particulate matter transport in indoor spaces. Build. Environ. 2015, 86, 191–202. [Google Scholar] [CrossRef]
  21. Menter, F.R. Two-equation eddy-viscosity turbulence models for engineering applications. AIAA J. 1994, 32, 1598–1605. [Google Scholar] [CrossRef]
  22. Celik, I.B.; Ghia, U.; Roache, P.J.; Freitas, C.J. Procedure for estimation and reporting of uncertainty due to discretization in CFD applications. J. Fluids Eng.-Trans. ASME 2008, 130, 078001. [Google Scholar]
  23. Haller, G. An objective definition of a vortex. J. Fluid Mech. 2005, 525, 1–26. [Google Scholar] [CrossRef]
  24. Wells, W.F. Airborne Contagion and Air Hygiene: An Ecological Study of Droplet Infections. J. Am. Med. Assoc. 1955, 159, 90. [Google Scholar]
  25. Riley, E.C.; Murphy, G.; Riley, R.L. Airborne spread of measles in a suburban elementary school. Am. J. Epidemiol. 1978, 107, 421–432. [Google Scholar] [CrossRef]
  26. Lei, C.; Yang, J.; Hu, J.; Sun, X. On the Calculation of TCID(50) for Quantitation of Virus Infectivity. Virol. Sin. 2021, 36, 141–144. [Google Scholar] [CrossRef] [PubMed]
  27. Nikitin, N.; Petrova, E.; Trifonova, E.; Karpova, O. Influenza virus aerosols in the air and their infectiousness. Adv. Virol. 2014, 2014, 859090. [Google Scholar] [CrossRef] [PubMed]
  28. Boucau, J.; Marino, C.; Regan, J.; Uddin, R.; Choudhary, M.C.; Flynn, J.P.; Chen, G.; Stuckwisch, A.M.; Mathews, J.; Liew, M.Y.; et al. Duration of viable virus shedding in SARS-CoV-2 omicron variant infection. medRxiv 2022. [Google Scholar] [CrossRef]
  29. Shang, W.; Liu, J.; Wang, C.; Li, J.; Dai, X. Developing smart air purifier control strategies for better IAQ and energy efficiency using reinforcement learning. Build. Environ. 2023, 242, 110556. [Google Scholar] [CrossRef]
  30. Wang, Y.; Cooper, E.; Tahmasebi, F.; Taylor, J.; Stamp, S.; Symonds, P.; Burman, E.; Mumovic, D. Improving indoor air quality and occupant health through smart control of windows and portable air purifiers in residential buildings. Build. Serv. Eng. Res. Technol. 2022, 43, 571–588. [Google Scholar] [CrossRef]
Figure 1. (a) The office room model; (b) the air purifier model.
Fluids 08 00307 g001
Figure 2. Validation of the algebraic-slip mixture model using the experimental data of Chen et al. [19].
Fluids 08 00307 g002
Figure 3. The hybrid mesh composed of Cartesian mesh and polyhedral cells.
Fluids 08 00307 g003
Figure 4. The air purifier created significant jet flows in the room. Note that ‘AP’ is the abbreviation of ‘air purifier’.
Fluids 08 00307 g004
Figure 5. Effects of air purifier on the airflow field in the room.
Fluids 08 00307 g005
Figure 6. Different positions of the air purifier to be investigated.
Fluids 08 00307 g006
Figure 7. Normalised particle concentration field with different air purifier locations. Note: the particle concentration is normalised according to the exhaled particle concentration at the infector’s mouth.
Fluids 08 00307 g007
Figure 8. Distribution of the Wells-Riley probability on the breath plane (Y = 1.32 m).
Fluids 08 00307 g008
Figure 9. The efficacy of air purifiers in infection control is sensitive to the location of air purifier relative to the infector.
Fluids 08 00307 g009
Figure 10. Area of different risk levels as a function of equivalent ventilation rate. (a) The area fraction of different risk levels; (b) average probability on the breath plane.
Fluids 08 00307 g010
Table 1. Main boundary conditions of CFD simulation.
Air supply rate per inlet (m3/s)0.051 (ACH 3)–0.354 (ACH 21)
Air processing rate per air purifier (m3/s)0 (off)–0.195 (full capacity)
Human exhalation rate (L/min)9.0
Human heat flux (W/m2)22.4
Heater heat flux (W/m2)4000
Table 2. Parameters to determine the infection risk.
VariableValueVariableValue
β0.0TCIF504000 virons
dp,025 μmdp6.6 μm
cpth1.0 × 109 virons/mLv9.0 L/min
te6 h
Disclaimer/Publisher’s Note: The statements, opinions and data contained in all publications are solely those of the individual author(s) and contributor(s) and not of MDPI and/or the editor(s). MDPI and/or the editor(s) disclaim responsibility for any injury to people or property resulting from any ideas, methods, instructions or products referred to in the content.

