Article

Experiments on Water Gravity Drainage Driven by Steam Injection into Elliptical Steam Chambers

by
Jonathan Enrique Martínez-Gómez
1,†,
Abraham Medina
2,*,†,
Francisco J. Higuera
3,† and
Carlos A. Vargas
4,†
1
SEPI ESIME Zacatenco, Instituto Politecnico Nacional, Av. Miguel Othon de Mendizabal SN, La Escalera, Ciudad de México 07738, Mexico
2
SEPI ESIME Azcapotzalco, Instituto Politecnico Nacional, Av. de las Granjas 682, Col. Sta. Catarina Azcapotzalco, Ciudad de México 02250, Mexico
3
ETSIAE, Universidad Politécnica de Madrid, Plaza Cardenal Cisneros 3, 28040 Madrid, Spain
4
Departamento de Ciencias Básicas, Universidad Autónoma Metropolitana-Azcapotzalco, Av. San Pablo 180, Col. Reynosa Azcapotzalco, Ciudad de México 02200, Mexico
*
Author to whom correspondence should be addressed.
These authors contributed equally to this work.
Fluids 2022, 7(6), 206; https://doi.org/10.3390/fluids7060206
Submission received: 21 March 2022 / Revised: 2 June 2022 / Accepted: 6 June 2022 / Published: 16 June 2022
(This article belongs to the Collection Advances in Flow of Multiphase Fluids and Granular Materials)

Abstract

:
Based on a recently published theoretical model, in this work we experimentally studied the problem of gravity water drainage due to continuous steam injection into an elliptical porous chamber made of glass beads and embedded in a metallic, quasi-2D, massive cold slab. This configuration mimics the process of steam condensation for a given time period during the growth stage of the steam-assisted gravity drainage (SAGD) process, a method used in the recovery of heavy and extra-heavy oil from homogeneous reservoirs. Our experiments validate the prediction of the theoretical model regarding the existence of an optimal injected steam mass flow rate per unit length, ϕ o p t , to achieve the maximum recovery of a condensate (water). We found that the recovery factor is close to 85% when measured as the percentage of the mass of water recovered with respect to the injected mass. Our results can be extended to actual oil-saturated reservoirs because the model involves the formation of a film of condensates close to the chamber edge that allows for gravity drainage of a water/oil emulsion into the recovery well.

1. Introduction

The China National Petroleum Corporation (CNPC), China’s largest oil and gas producer and supplier, has predicted that, after 2027, the global production of heavy oil and oil sand will surpass the global production of conventional crude oil [1]. This means that, as conventional light oil supplies become less abundant, unconventional sources will supply a greater share of the world’s liquid hydrocarbon.
Despite the fact that, in the future, the need for liquid hydrocarbons will be partially fulfilled by heavy and extra heavy oil, waste lignocellulosic (LC) biomass has attracted a great deal of attention in recent years due to its conversion into higher-value chemicals or liquid transportation fuels. A typical thermochemical approach to the conversion of LC biomass into liquid transport fuel involves a two-step process in which solid biomass or its components are depolymerized in the first step by pyrolysis, dissolution/liquefaction (LIQ), or gasification, and low-value intermediates (i.e., pyrolysis oil, liquefaction oil, or synthesis gas) are subsequently upgraded by catalytic hydro-treatment or Fischer–Tropsch synthesis to obtain a competitive-quality liquid biofuel [2,3]. Liquid biofuels are on the rise, particularly as transport fuel. In Brazil and Sweden, the use of liquid biofuels already accounts for more than 15% of fossil oil consumption (for transport and heat production). In most other countries, the use of liquid biofuel is equivalent to between 2 and 5% of the fossil oil used [4].
On the other hand, there are numerous reservoirs, usually shallow, that contain highly viscous oil (heavy oil with an API gravity of 10– 20 ° API and a dynamic viscosity μ o i l ranging from 1000 to 10,000 cP; extra heavy oil or natural bitumen under 10 ° API and a dynamic viscosity greater than 10,000 cP). Highly viscous oil does not flow at reservoir conditions, and its production requires unconventional recovery processes, such as thermal recovery [1,5].
The most successful method for increasing the oil temperature within the reservoir is the injection of steam. This reduces the in situ oil viscosity through the addition of thermal energy. This method works well for relatively good-quality oil sand reservoirs and oil with extremely high viscosity. One of the most efficient thermal methods is the steam-assisted gravity drainage (SAGD) method, which was proposed and developed by Butler et al. in the 1980s [6,7]. The key features of the method are the introduction of double horizontal wells and the formation of a steam chamber in the reservoir through which the majority of the oil is drained.
The SAGD method involves the injection of steam at constant pressure into the reservoir through the upper horizontal pipe and extraction of the mobilized oil through the parallel pipe beneath the injection pipe. The injected steam displaces the oil that initially saturates the reservoir, leading to the formation of a steam chamber that is partially depleted of oil around the injection pipe. During the continuous injection, the steam flows into the chamber from the upper injection pipe, cools down by losing heat to the oil and the solid matrix while moving away from the pipe, and condenses at the boundary of the steam chamber. The latent heat that is released during the condensation process heats up the oil close to the edge of the chamber. The viscosity of the oil significantly reduces within a thin layer surrounding the chamber, which allows gravity to efficiently drain the oil lying within this layer, along with the condensed water, toward the underlying production pipe [8,9,10,11,12,13,14].
In this paper, we report on a series of controlled laboratory experiments that were performed to validate a new theoretical model recently proposed by Higuera and Medina [15], which highlights the shape of the steam chamber and the control of the mass flow rate of the injected steam, among others, as dominant features of the SAGD. The described experiments show that the flow of steam (occurring in a region of the chamber devoid of oil) enables the formation of a water layer that is mainly drained along the wall of the steam chamber. This occurs only for a specific steam flow rate. To our knowledge, this approach has never been tested in the specialized SAGD literature.
In actual SAGD processes, the steam chamber is the portion of the reservoir from which the majority of the oil is drained, and, outside this chamber, the oil generally remains in the solid state. The theoretical model assumes that, at a given time, the steam chamber has a symmetric shape in the plane that is normal to the injection and production pipes, and the steam flow develops inside this plane. Consequently, the steam flow can be analyzed as a plane flow that occurs through the homogeneous reservoir, satisfying the continuity equation, Darcy’s law and the energy equation, and other mass and energy conservation equations for the condensation front, i.e., the thin liquid layer surrounding the steam.
In agreement with the assumptions of the theoretical model, in this experimental study, we analyze a symmetric steam chamber. The chamber is a hollow elliptical space with a horizontal semi-major axis carved out of a metallic slab filled with dry glass beads that serve as the porous packing material. The injection well is placed in the center, and the recovery well (which is a hole open to the atmosphere) is placed at the bottom. This configuration contrasts that used in typical laboratory studies of SAGD [6,7,8,9,10,11,12,13], where a porous layer saturated with natural or synthetic oil is sandwiched in between rectangular transparent plates that allow the formation of growth of the steam chamber to be observed due to the continuous injection of steam. Evidently, airtightness is maintained at the edges of these systems.
To show a clear distinction between the natural formation of the steam chamber in an oil-saturated porous medium confined in an elliptical space and the performance of an elliptic steam chamber during steam injection, we carried out two experiments. First, in the oil-saturated porous medium, we visualized the growth process of the steam chamber with infrared (IR) thermography. Second, the steam injection was performed in an initially dry and cold porous medium occupying the same elliptically shaped space, and we visually tracked the motion of the condensation front. After the condensation front reached the cold solid edge, a steady-state temperature distribution in the porous medium, steam condensation near the edge, and a temperature distribution in the solid slab were observed. We report on experiments conducted for several constant values of the flow rate per unit length ϕ at constant injection temperature and pressure, T I and p I , respectively. By following this procedure, we show that there is an optimal flow rate value, ϕ o p t , for which the recovery of the injected mass is maximal.
To reach our goals, this work is presented as follows: in the next section, we summarize the heat and mass transfer problem of the steam flow and its condensation at the edge of the chamber [15], and the dimensionless parameters involved in the characterization of the problem are specified. There, we also provide the analytical expression of the elliptical chamber employed in the experiments. Later on, in Section 3, the experimental setup is presented, and qualitative experiments of steam injection into the heavy-oil-saturated porous medium are described to visually show (with IR thermography) the formation process of the steam chamber. In Section 4, we describe the performance of experiments related to steam injection into dry porous media, which were conducted to observe the transient condensation front. Then, we provide measurements of the injected steam and the accumulated quantities of recovered water to identify the best definitions of low flow rate, high flow rate, and optimal flow rate for injected steam. In Section 5, we discuss the agreement between the experimental results and the hypothesis of the model. Finally, in Section 6, the main conclusions and limitations of this study are presented.

2. Basis of the Simple Model for Steam Flow in the Chamber

2.1. The Steam Condensation Problem

Many laboratory [6,7,8,9,10,11,12,13] and field [16,17] studies have shown that the formation of the steam chamber follows different stages of growth as the steam is injected into the oil reservoir. In the first stage of growth, before the steam chamber reaches the production pipe, the displacement of cold oil requires a large overpressure, but once the lower end of the chamber reaches the production pipe, the pressure in the chamber decreases to approximately the level of pressure in the production pipe, which is not very different from that of the reservoir [18]. In this second stage, the spatial pressure variations in the steam chamber are small compared with the hydrostatic pressure variation in the distance of the order of the height of the steam chamber, which is of the order of pressure variation involved in the drainage of the mobilized oil. These small spatial pressure variations determine the flow of steam in the chamber and the distribution of the condensation mass flow rate at its boundary. Subsequent upward and sidewise growth of the steam chamber is determined by the rate of oil drainage in the thin layer around its boundary, which frees space that is occupied by the steam [9,10,11,12].
In a real reservoir, the process is complicated by additional factors. On one hand, the oil left in the chamber and part of the oil mobilized near its boundary may fall directly across the chamber, rather than in the thin layer mentioned above. These complexities are disregarded in the simple model introduced by Higuera and Medina [15], which focuses on the steam flow and the steam condensation at the boundary of a stationary chamber of a given size and shape.
The injected steam displaces the oil in the porous medium of porosity φ and permeability K, which initially saturates the reservoir, leading to the formation of a steam chamber that is partially depleted of oil around the injection pipe (see Figure 1). The steam flows radially into this chamber from the injection pipe, cools down by losing heat to the oil and the solid matrix while moving away from the pipe, and condenses at a layer of thickness δ θ close to the chamber edge r = R c ( θ ) . The location is given in polar coordinates (r, θ ) and its origin is at point o. The shape of the chamber edge can be conveniently proposed. The latent heat that is released during condensation is used to heat the oil around the chamber. The viscosity of the oil significantly decreases in a thin layer surrounding the chamber, which allows gravity to efficiently drain the oil in this layer, together with the condensed water, toward the underlying production pipe.
The continuity equation, Darcy’s law, and the energy equation for the stationary two-dimensional (plane) flow of steam in the chamber are [15]
· ( ρ v ) = 0 , v = K μ p , ρ c p v · T = k e 2 T ,
where v , p, and T are the velocity, pressure, and temperature fields, respectively. The quantities μ and c p are the dynamic steam viscosity and specific heat, and k e is the effective conductivity of the medium, given by k e = 1 φ k s + φ k f , where k s is the thermal conductivity of the porous matrix and k f is the thermal conductivity of the fluid that saturates the porous medium [19,20]. The thermal diffusivity is α = k e / ρ b c p , with ρ b denoting the steam density at boiling temperature T b .
The local thickness of the liquid layer of density ρ w and viscosity μ w at the condensation front δ ( θ ) is used in the boundary conditions to solve Equation (1), and it can be estimated through the balance of the mass flow rate of liquid across a section of the layer characterized by a given value of θ and the mass flow rate of steam condensed between the uppermost point θ = 0 and that section. This gives the mean thickness of the layer as
δ μ w ϕ ρ w 2 g K ,
where ϕ is the injected constant mass flow rate of steam per unit length normal to Figure 1 and g is the acceleration due to gravity. The estimation is valid if δ R c .
Another important result is that the solution of the problem, which must be computed numerically, will be physically admissible only for a particular value of ϕ o p t , which depends on the dimensionless parameters
S = c p T b L , Π = ρ w 2 K g H L μ w k e T b T b T R T b , T I T b , ϵ = R I H ,
where L is the latent heat of condensation, H is the distance between the injection and production pipes, T b is the boiling temperature of the phase change, T I and T R are the temperatures of the injected steam and the edge of the steam chamber, and R I is the radius of the injection pipe.
In brief, the numerical solution of the stated problem shows that if the injected flow rate is greater than ϕ o p t , then a fraction of the steam will reach the production pipe without condensing inside the chamber. If the injected flow rate is smaller, then it will rapidly condense and flow to the production pipe. The value ϕ o p t that separates these undesirable conditions must be found as a function of the aforementioned parameters (3).

2.2. The Geometry of the Chamber

The goal of this experimental study was to verify whether the assumptions and results validate the previous model. Because steam is injected from a horizontal pipe, it is commonly assumed that, for homogeneous reservoirs, the steam chamber has a symmetrical shape with respect to the injection pipe [6,7,8]. The limit of the steam chamber is the chamber edge, which has the form r = R c ( θ ) , with the symmetry condition written as R c ( θ ) = R c ( θ ) , where 0 θ π / 2 and θ are measured clockwise from the upper vertical axis ( θ = 0 ) to the lower vertical axis ( θ = π / 2 ).
In Figure 2, we depict a cross-section of the elliptical chamber, centered at the origin O, with a width of 2 a and a height of 2 b (chosen this way for ease of machining). The edge of such a chamber is
R c θ = a b a 2 cos 2 θ + b 2 sin 2 θ 1 / 2 .
where the semi-major axis is a = 0.157 m, and the semi-minor axis is b = 0.105 m, which corresponds to a horizontally elongated ellipse.

3. Experiments of Steam Injection into an Oil-Saturated Porous Medium in an Elliptical Chamber

3.1. Experimental Setup

We manufactured, in a cast iron slab 0.36 m in height, 0.50 m in width, and 0.041 m in thickness, a hollow steam chamber with similar dimensions to those referred to in the previous section. On each side of the chamber, we embedded a transparent armored glass with an elliptical shape and a thickness of 0.013 m. Thus, the chamber was w = 0.015 m in depth. Armored glass was selected to avoid an explosive rupture, and because it would be subject to multiple cycles. To obtain the porous layer sandwiched between the glasses, the hollow elliptical space was filled with glass beads (soda lime) of diameter d = 0.6 mm, and we achieved random loose packing with a porosity of φ 0.40 [20,21]. The permeability of this porous medium was estimated through the Carman–Kozeny formula [20,22] given by K = d 2 φ 3 / 180 1 φ . Thus, K 3 . 55 × 10 8 m 2 .
As depicted in Figure 2, the location of the injection pipe was O and that of the production pipe was P, and the distance between these points was H = 0.09 m. At O, the steam injection was carried out radially using a diffuser with an external radius R I = 7 × 10 3 m, meaning that the dimensionless radius was ϵ = R I / H = 0.07 , and the radius of the orifice of recovery, which was open to the atmosphere, was the same as R I . The drilled bores for the diffuser and the recovery port were machined only on the rear glass plate.
To continuously supply steam into the chamber, we used a commercial steam generator (Vapamore, model MR-750 Ottimo) that used distilled water. The technical characteristics were as follows: peak temperature, 140 ° C; peak pressure, 340 kPa; and steam time, 3 h. In Figure 3, we show the experimental array, where the cast iron slab enclosing the steam chamber is mounted on a support structure, and from the rear, the jet nozzle is connected to the diffuser. We used IR and optic cameras to visualize, in real time, the isotherm distribution and the fluid motion, whenever possible.
Since the generator had an adjustable steam output, we needed to know the mass flow rate of steam for different apertures. Our procedure to measure this quantity was based on the direct contact condensation of steam jets [23,24]. We plunged the jet nozzle into cold, distilled water and measured the added mass as a function of time, m ( t ) . We applied this procedure to eight different apertures. In Figure 4, we show a plot of the added mass as a function of time for an intermediate aperture of the steam generator. From the plot, it can be appreciated that the data fit a straight line, which allowed us to obtain the steam mass flow rate produced by the generator, m · = d m / d t . In this case, we found that m · = 0.66 ± 0.03 gr/s.
Consequently, for any injection experiment, m · is always known. Similarly, it is possible to quantify the condensate liquids recovered by a collector reservoir, located below the metallic slab. Later, we present (a) qualitative experiments of injection in oil-saturated chambers (saturated porous media of elliptic shape) and (b) quantitative experiments of steam injection in initially air-saturated chambers. Experiments with extra heavy oil were only carried out to qualitatively demonstrate that our steam injection method produces steam and condensates at the recovery orifice.

3.2. Extra-Heavy-Oil-Saturated Chamber

To observe how an extra-heavy-oil-saturated porous medium produces a natural steam chamber due to steam injection, we performed an experiment where the porous medium was saturated with extra heavy crude oil 7 . 9 ° API ( μ o i l = 10,000 cP) from Samaria, a heavy-oil-producing field located in onshore Mexico. The saturation process was carried out as follows: first, we made a horizontal bed in the hollow chamber. Then, it was fully saturated by gravity action with hot crude (70 ° C). Then, once the oil-saturated chamber had, once again, reached room temperature ( T r o o m 24   ° C), we placed the front transparent glass sheet, and the slab was positioned vertically. Finally, steam was injected into the cold steam chamber.
In Figure 5, we present a photograph of the slab containing the oil-saturated chamber (where the natural steam chamber was formed). The picture was taken 20 min after the injection start-up. There, the production of an oil–water emulsion was observed. Steam was injected at a rate of m I s · = 0.66 ± 0.03 gr/s at approximately T I 95 ° C.
In Figure 6, we show a series of thermographies of the same experiment. This technique allowed us to visualize the formation and growth of the steam chamber (contained in the region limited by the red isotherm) for approximately 1 h. The thermographies were taken by employing a high-performance infrared camera (FLIR SC660; 1 Kelvin and 640 × 480 resolution). We obtained infrared thermographies at different time points to observe the time evolution of the overall temperature distribution in the chamber. In Figure 6c,d, the steam chamber is shown in white, because the temperature in this area remained near-constant, as will be proven in the next section.
From the thermographies shown in Figure 6, several interesting facts can be observed: for short periods of time, steam slowly heats the chamber and the formation of the steam chamber is incipient (there is a slight red color above the black point, which represents the recovery orifice); however, in the solid slab, a conductive heat transfer process also occurs (Figure 6a). A few minutes later, the red isotherm, which we labeled T b 77 ° C, reaches the recovery orifice, and this isotherm remains attached to the recovery orifice, which is an indication that the red isotherm is close to the layer of drainage of the condensates (Figure 6b–d).
We also observed that the steam chamber expanded upwards and sideways, but the upwards rate was greater than the sideways growth. It is clear that more quantitative studies on the evolution of the steam chambers for different injection rates are necessary. Moreover, the theoretical model of the steam chamber considers flows in short time periods. This is the main reason that injection in steam chambers devoid of heavy oil must be quantitatively studied.

4. Elliptical Steam Chamber

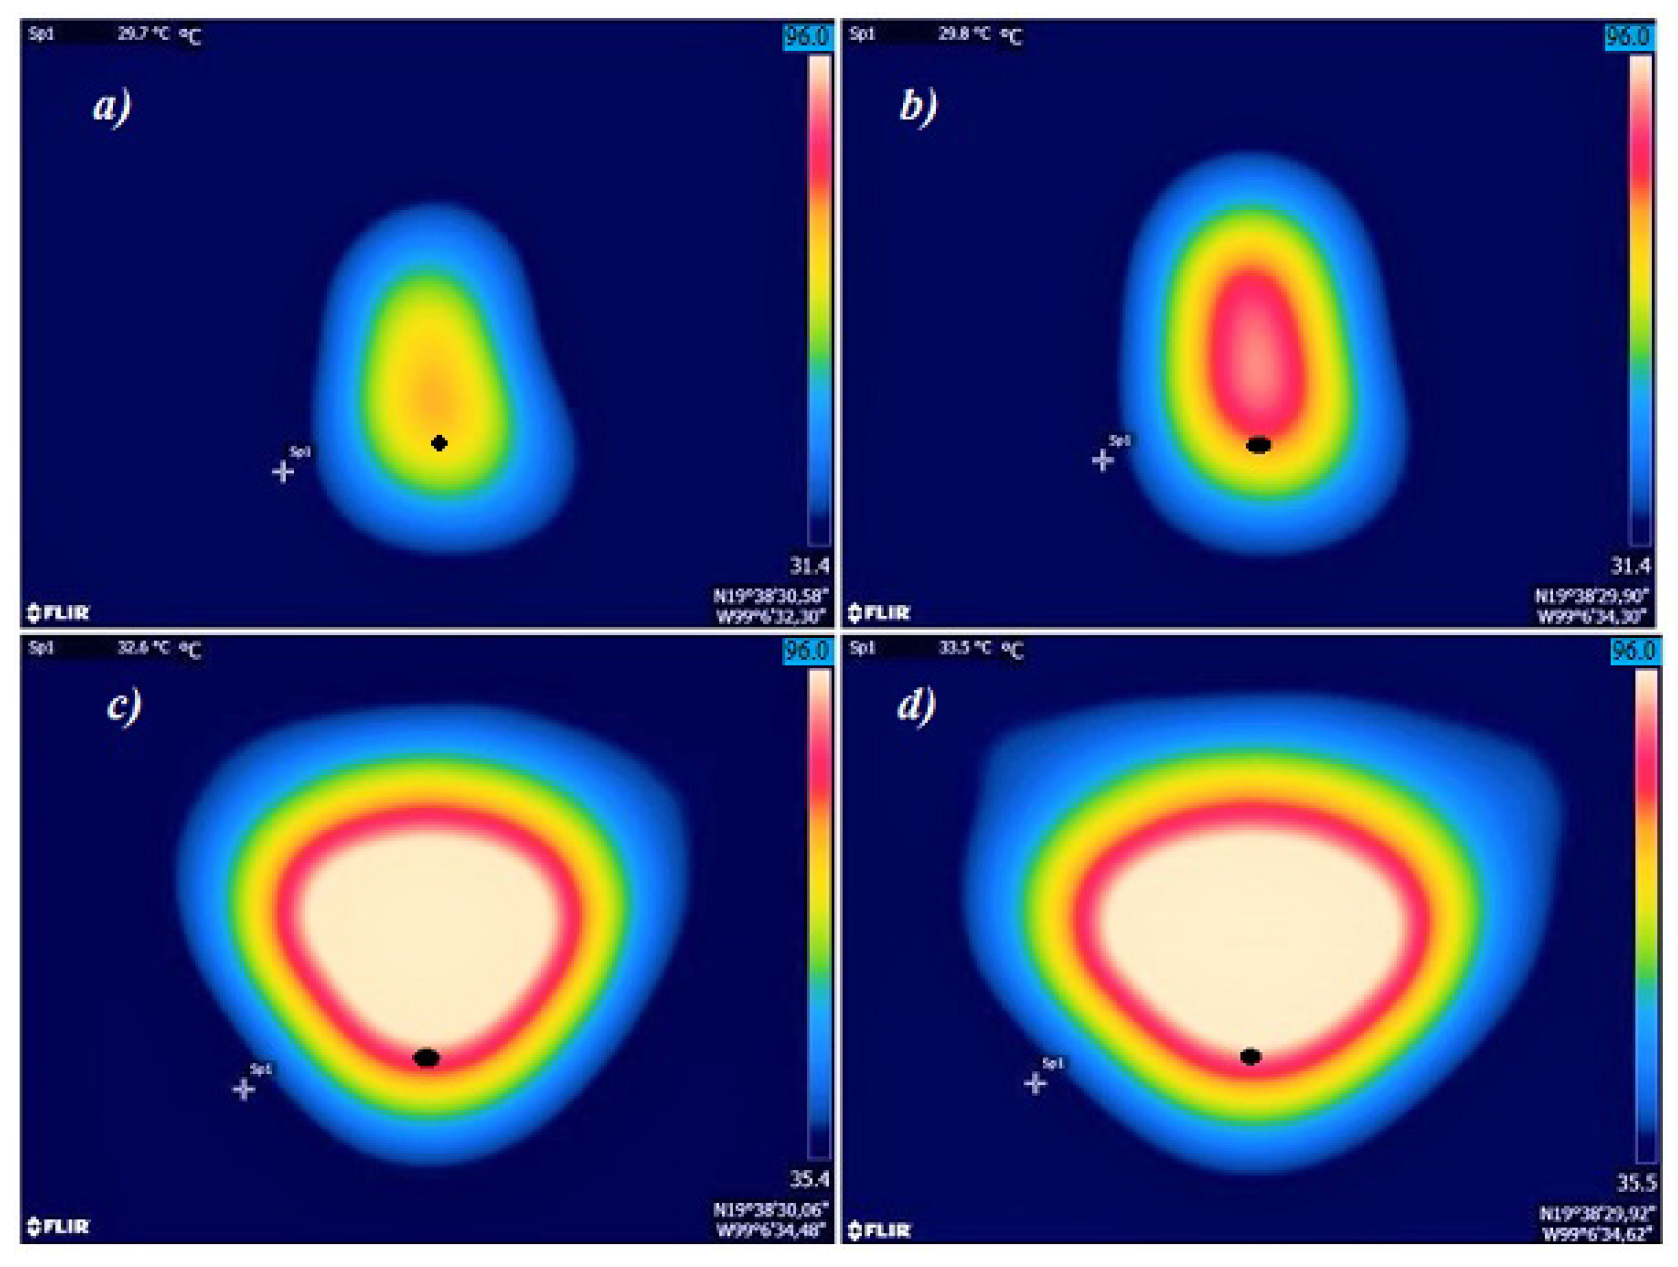
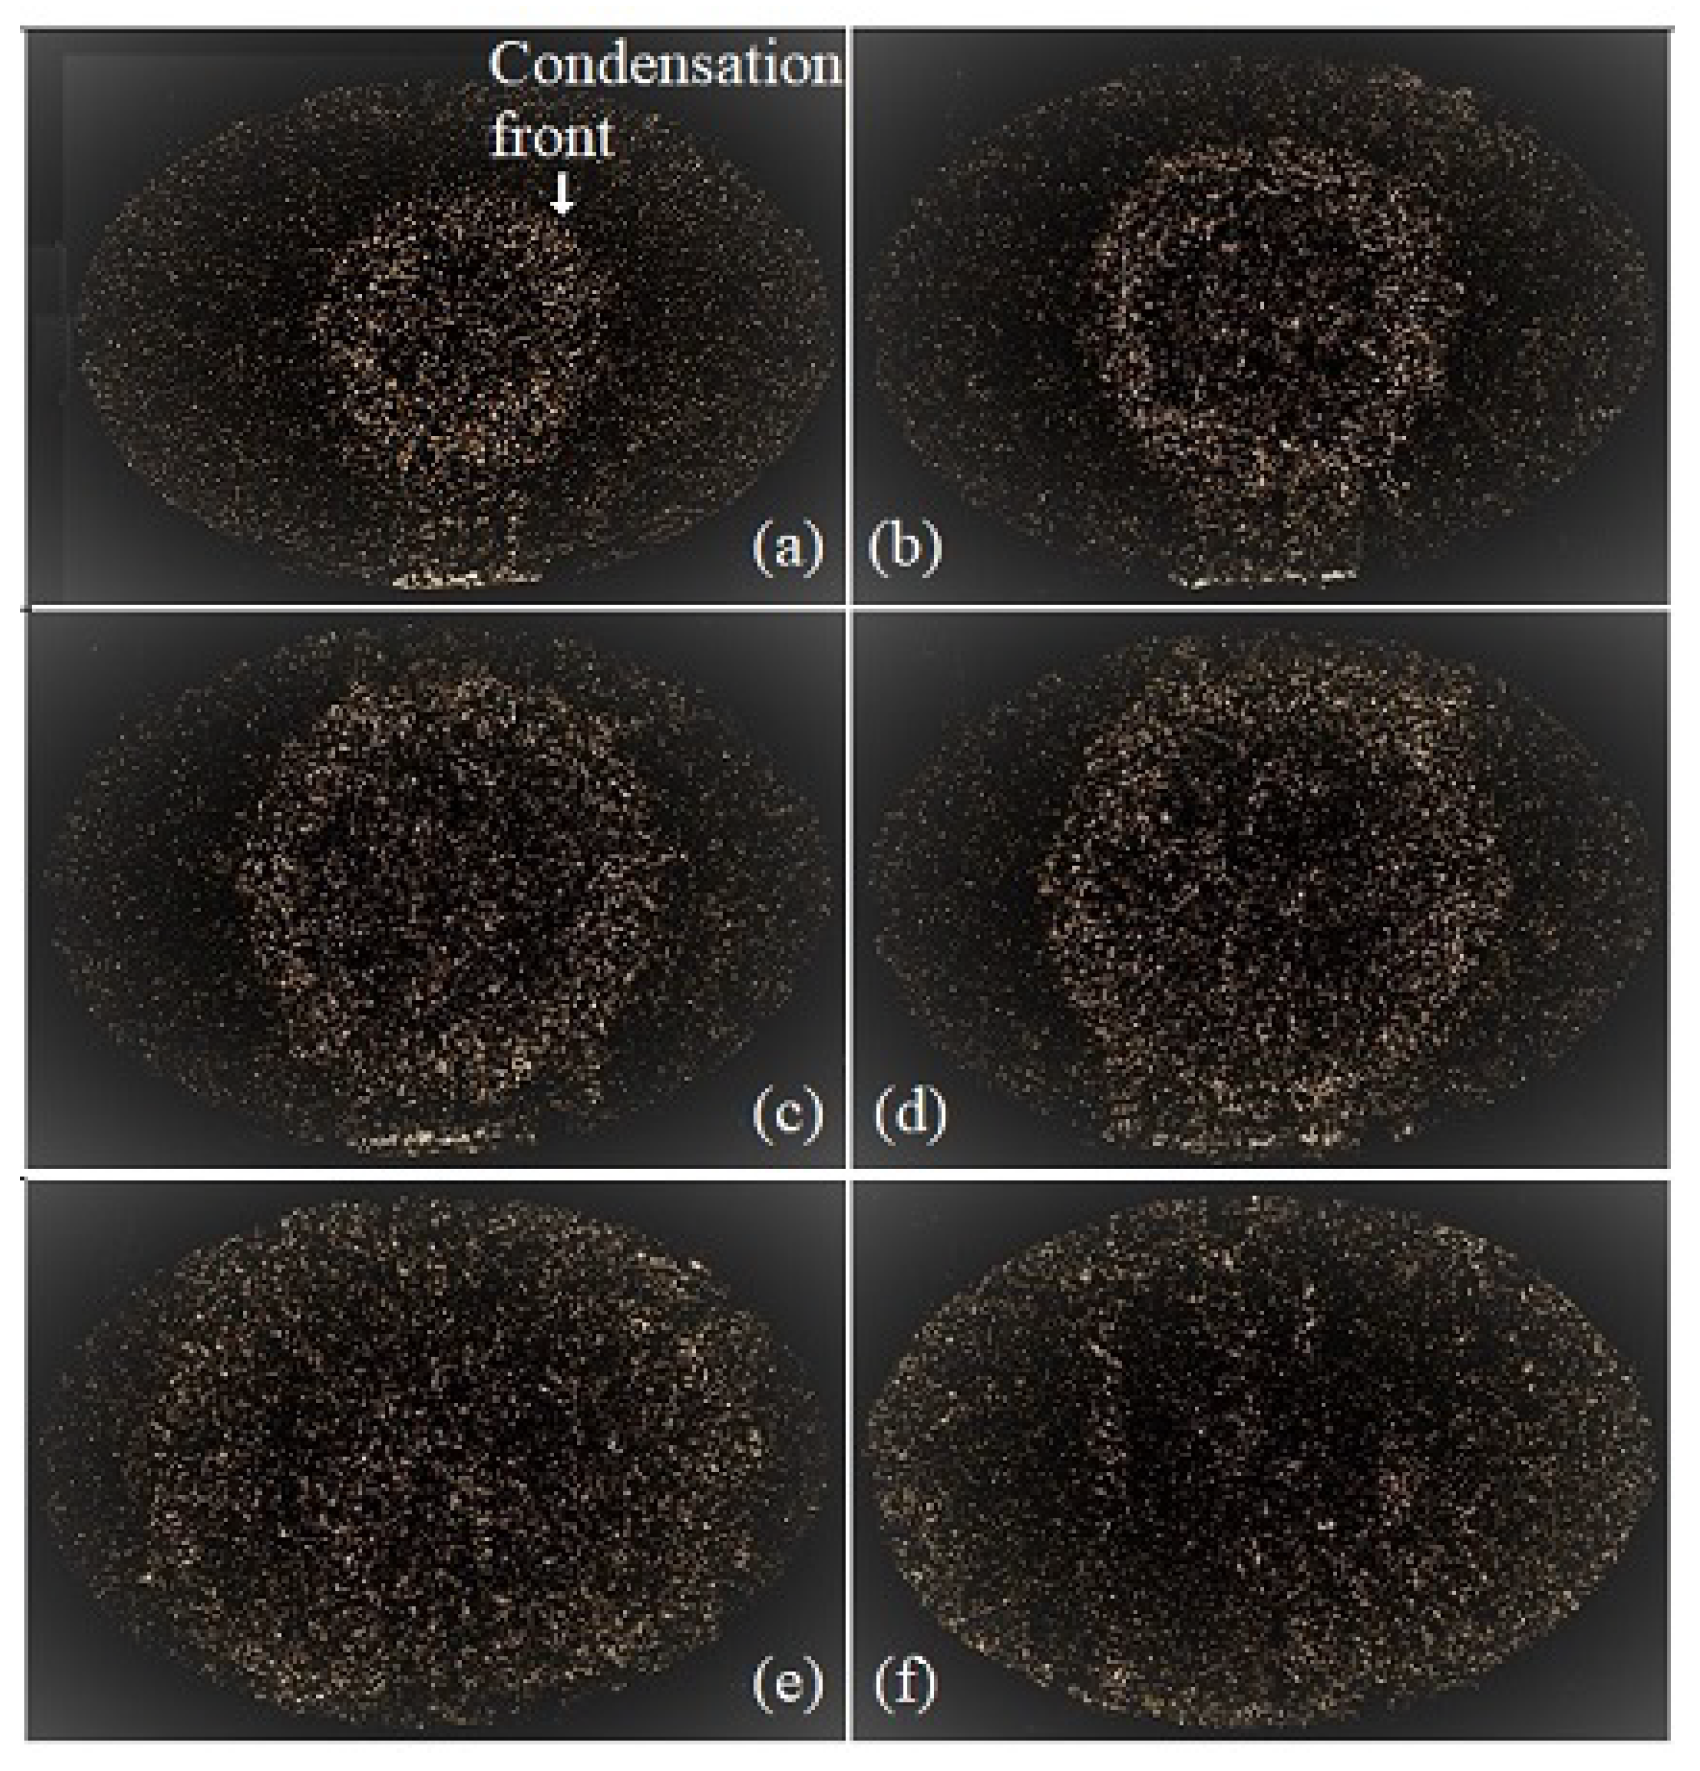
4.1. Transient and Steady Steam Flows

In the aforementioned theoretical model, it was assumed that once the steam chamber was formed, the oil inside would have been depleted, and then a steam flow would advance towards the edge of the chamber. In the laboratory experiments, we started the steam injection in a dry and cold (at temperature T r o o m ) homogeneous porous medium, and thus the transient flow of steam was the first stage studied, since, under these circumstances, a condensation front appears [25].
In Figure 7, the steam chamber in the slab is shown, i.e., the pre-established form. Measurements of the injection temperature for all values of the mass flow rate used showed the same injection temperature T I 92 ° C, and by using the plot for the data of the water saturation pressure as a temperature function (Figure 8), we found that the absolute pressure at the point of injection was p I 75 kPa. The experimental results discussed here were obtained for a m I s · = 0.246 ± 0.012 gr/s. As will be seen afterwards, this mass flow rate produces optimal condensation and, consequently, maximal recovery of water.
During the steam injection, we observed that the steam is immediately condensed because it cools down by losing heat to the porous matrix (at temperature T r o o m 24 ° C), and this condensate moves away from the injection pipe to reach the edge. By using a CCD camera, we took visual photographs every 12 s. Optical visualization of the steam flow and the condensate is very challenging, since the contrast between steam and the glass beads is nearly unnoticeable. However, through the image subtraction, the condensation front motion could be appreciated, as shown in Figure 9. We also observed that the condensation front is complex, because, at the lower end, it heads directly to the recovery orifice, which is open to the atmosphere. Finally, the front reaches the horizontal limits of the elliptic chamber.
To quantify the evolution of the condensation front, in Figure 10, we show the time evolution of the front r f ( t ) along the horizontal ( θ = π / 2 ) and vertical ( θ = 0 ) axes. The fits for both cases correspond to power laws of the form r f t n , where n = 0.28 ± 0.01 if θ = 0 and n = 0.26 ± 0.01 if θ = π / 2 . Moreover, in the same figure, it can be observed that the rate of change of r f ( θ = 0 ) is slightly larger than that for r f ( θ = π / 2 ) , perhaps due to the influence of the buoyancy. These results show that the motion of the condensation front may be affected by the compressibility of the steam [27], the buoyant forces, and the chamber shape. In contrast, when a hot liquid is injected into a similar geometry at a constant flow rate q, the Darcy velocity of the front v r evolves as v r = d r f / d t = q / 2 π r f , which yields r f t 0.5 [28].
A confirmation that thermographies in this case also accurately describe the evolution of the condensation fronts is given in Figure 11. The thermographies presented in Figure 11a,b show isotherms corresponding to radial fronts that reach the recovery orifice (white points). Note that, in Figure 11b, the light blue isotherm surpasses the lower limit of the metallic chamber edge where the recovery orifice is located. The same occurs for Figure 11c,d, but there, as in the case of Figure 6, the red isotherm, corresponding to the phase change, touches the injection orifice and consequently contains the layer of drained, condensed fluid. It is important to observe that the shape of the red isotherm of Figure 11d did not change any further for later time periods, which indicates that the steam chamber edge meets the metallic chamber edge and, therefore, the main assumptions (fixed shape for the steam chamber, continuous steam flow, etc.) of our theoretical model were satisfied.
In the thermography shown in Figure 11d, the temperature distribution in the solid region was produced by the heat flux reaching the condensation front and by the heat released by steam condensation in each unit of time and for each unit of area of the condensation front. These conditions impose conductive heat transfer to the surrounding spaces outside the chamber, where the temperature changes along distances of the order l α t [29]. By taking into account that the thermography was taken at time t = 900 s and given the thermal diffusivity α of the cast iron, shown in Table 1, we determined that l 10 cm, which agrees with the lengths observed in this figure.
Figure 11d also shows that steam condenses at any point of the chamber edge at 900 s after the injection start-up. After this time, by using the particle image velocimetry (PIV) technique, we determined the velocity fields for a couple of consecutive images (obtained 12 s apart), as shown in Figure 12. By looking at the direction of the vector field, it is possible to infer that the steam flow is, at any part of the edge, directed towards the chamber wall.
Next, we estimated the thickness of the drainage layer δ , given by Equation (2). To apply such a formula, we needed to estimate the mass flow rate per unit length ϕ = m · I s / l , where l is the size of drilled bores issuing the radial flow from the diffuser to the chamber, which is d d r i l l = 0.2 cm. The thermography of Figure 11b reveals that the boiling temperature close to the wall is T b 80   ° C and, therefore, the water dynamic viscosity and density at this temperature have the values μ w = 0.355 × 10 3 N/s·m 2 and ρ w = 971 kg/m 3 [26]. The use of these data allowed us to determine that δ 0.2 mm. It is possible that the small size of the drainage layer is the reason that we could not visually appreciate macroscopic stream only at the chamber edge.
The detailed studies presented here contribute to the validation of the main assumptions of the simple model of SAGD [15]. An interesting fact related to heat transfer in the solid is that the heat conduction itself modifies the temperature difference between the boiling temperature and the reservoir temperature, T b T R , which should be taken into account.
To obtain an estimate of the dimensionless parameters of the theoretical model, given in Formula (3), we computed the other values of the involved physical quantities (at T b 353.15 K): ρ w = 971 kg/m 3 , L = 2312.32 × 10 3 kJ/kg, μ w = 0.355 × 10 3 Pa·s, k e = 1.10 W/m·K; additionally, T I 365.15 K. In the current experiments, the main issue was the determination of a realistic value of T R , the temperature at the edge of the steam chamber, since, outside this edge, there is a temperature distribution, instead a single isotherm (see Figure 11d), as was assumed in the theoretical model.
In the theoretical model, T R is the reservoir temperature, measured only at the chamber edge, located at r = R c = 0.157 m. Ideally, in actual reservoirs, the temperature outside the steam chamber ( T R ) should not change, since the energy required to heat up this part of the reservoir must be extremely large. However, in laboratory experiments, the slab that contains the steam chamber has a finite mass, which allows heat diffusion to change the temperature of the slab itself. Thus, the temperature T R was determined following the criterion that if a medium under one temperature is exposed to a medium of another temperature, the temperature difference between the object and the medium will undergo exponential decay. This means that the temperature will be reduced significantly at a distance of r = R c ( 1 + 1 / e ) . This point is located at r 0.20 m, and by using Figure 13, we found that the corresponding temperature is T R 338.15 K. This value allowed us to find that Π = 20,202, and also, it was found that S = 0.30 , T I / T b = 1.03 , and ϵ = 0.07 . These values are also valid for the results of the accumulated amounts discussed afterwards.
An important observation related to Figure 13 is that the spatial temperature distribution changes slightly within the steam chamber, where r R c . This latest result justifies the assumption given in Section 3, where the white-colored isotherm (white-colored region), presented in Figure 6c,d and identified as the steam chamber, is formed during the steam injection into the oil-saturated porous medium. Another important observation is that the shapes of the white-colored isotherms in later thermographies were maintained as nearly invariant. Physically, it can be assumed that the steady-state temperature distribution was achieved.

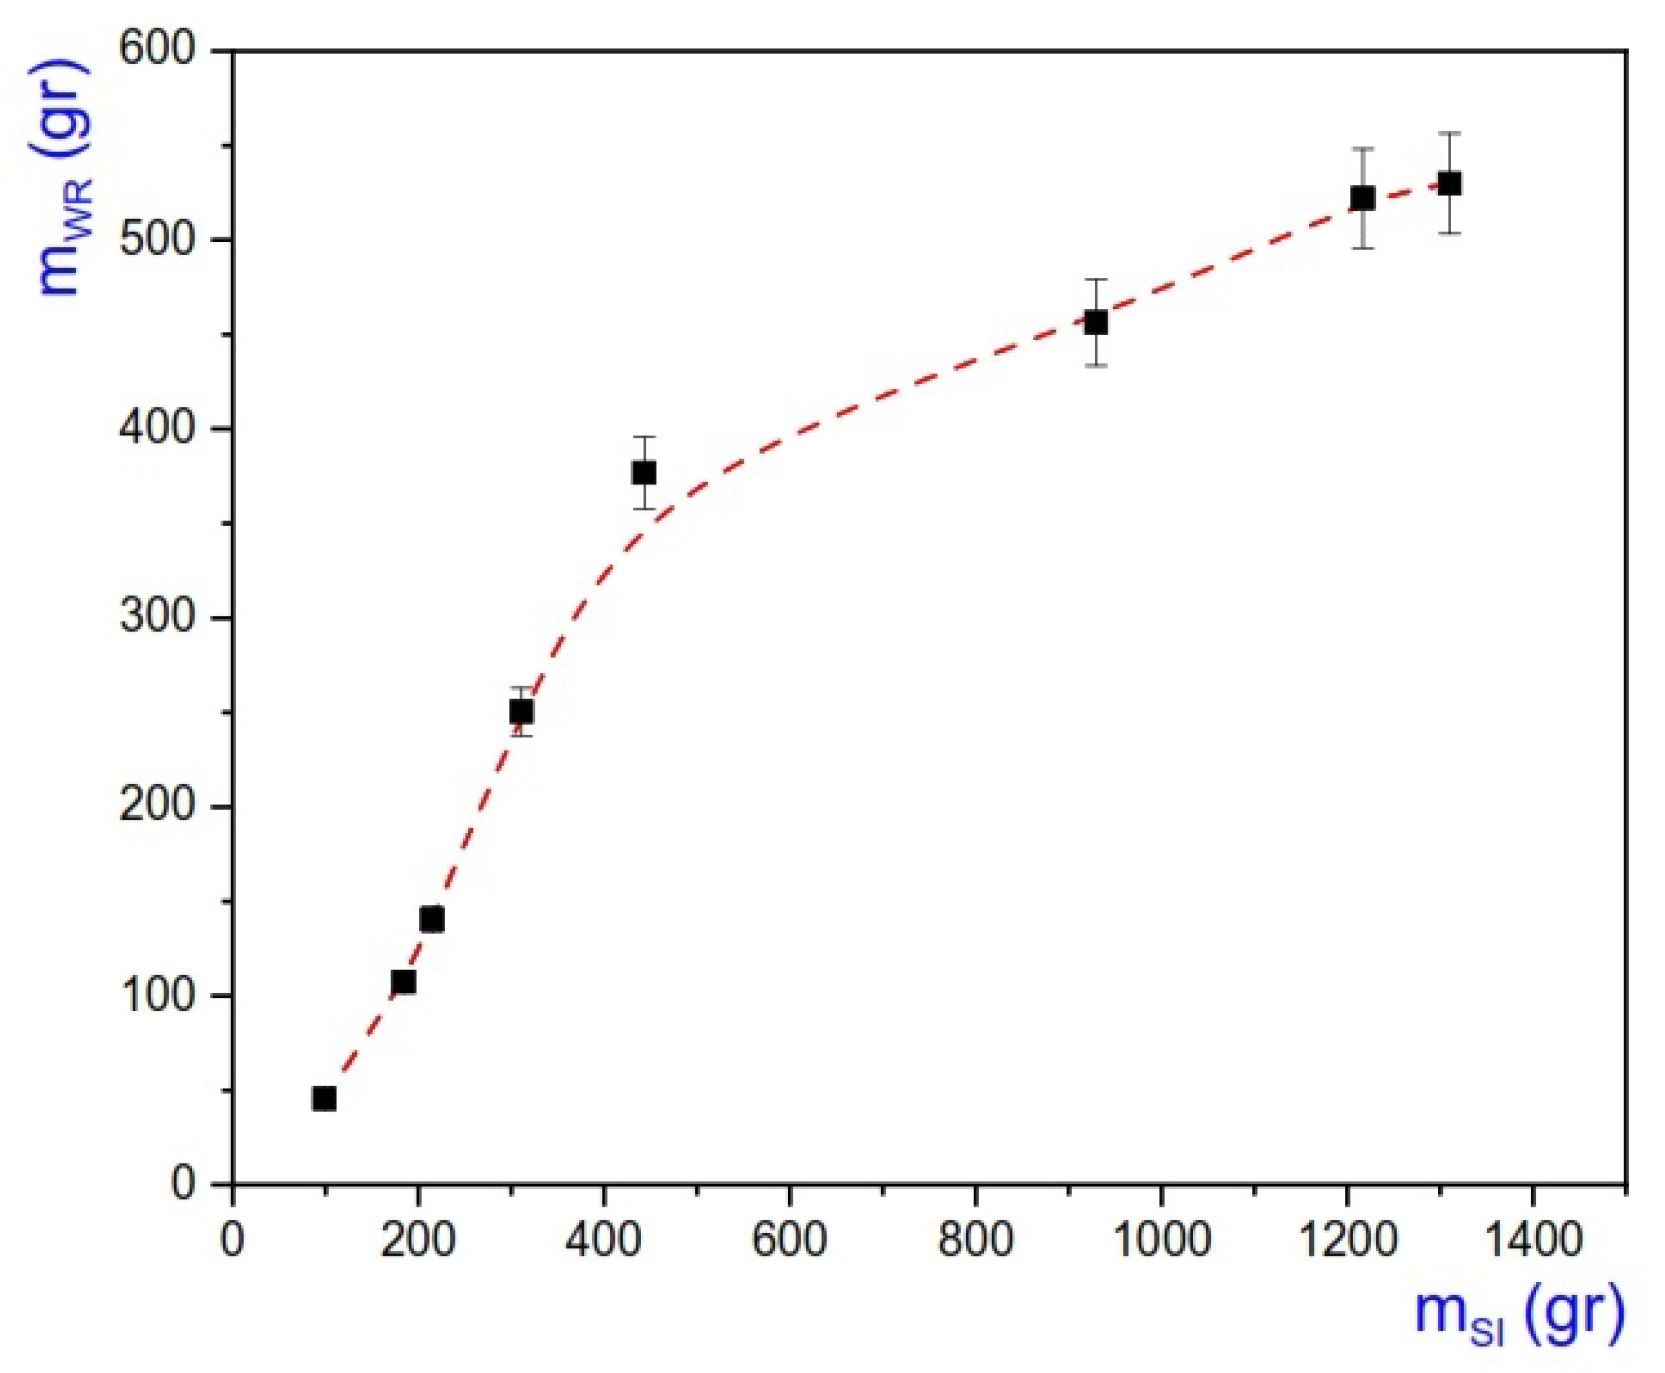
4.2. Accumulated Amounts of Injected and Recovered Fluids

To complete the validation of the theoretical model [15], we present the results for steam injection at a constant rate into dry and cold steam chambers and the subsequent recovery of condensates. The accumulated quantities of injected steam and condensate produced were measured during a half-hour period after the injection start-up. The amount of steam injected during a time period Δ t was quantified as m S I = m I s · Δ t . Meanwhile, the mass of water recovered in the same period was taken as m W R , and the mass flow rate of water recovered was m · R = m W R / Δ t . We chose Δ t = 1800 s (half an hour) as the time period to quantify the injected and recovered masses. It is important to note that, in addition to water production through the production orifice, steam also emerged and rapidly bent upwards and around due to the gravitational field [30], which means that this phase does not contribute to the measured mass.
In Figure 14, we show the plot of the mass flow rate of recovered water m · R as a function of the mass flow rate of injected steam m · I s . We observed that the data obeyed two different condensation mechanisms, as there were two different slopes for small and large fluxes of injected steam. A similar plot is given in Figure 15 in terms of the water recovered mass m W R versus the injected steam mass m S I for the time period considered. The efficiency of the steam injection can be estimated through the factor of recovery efficiency e r , defined as the ratio of the mass of water recovered to the steam mass injected
e r = m W R m S I ,
An ideal experimental process should give e r = 1 , since the overall injected mass will be recovered.
In SAGD, steam injection is measured by means of the mass flow rate per unit length, ϕ = m · I s / l , and, in this study, we assumed that l = 0.2 cm. This allowed us to obtain the plot of e r versus ϕ for eight different values of ϕ (see Figure 16). In the latest plot, we observed an optimal injected flow rate value of ϕ = ϕ o p t 1.23 ± 0.06 gr/cm s, given that, for such a value, up to 85% of the steam condensed as water.
The latest result confirms the prediction of the theoretical model [15] in that, if the injected mass flow rate is larger than ϕ o p t , then a fraction of the steam reaches the production pipe without condensing inside the chamber. This means that, in actual exploitation under a SAGD process, a considerable amount of steam is wasted. Moreover, the model also predicts that if the injected flow rate is smaller than ϕ o p t , the steam cools down and condenses rapidly before it reaches the chamber wall, thus explaining the production of water at 45–65% of the mass of injected steam for the low flow rates observed in Figure 15 and Figure 16. In conclusion, the cases when ϕ is far from ϕ o p t imply that, in real processes, large amounts of water and energy are wasted.

5. Discussion of the Results

The study of the key factors influencing the characteristics of gravity water drainage, such as the shape and expansion speed of the steam chamber, is of great significance for predicting the boundary of the SAGD steam chamber, evaluating the development effect, and controlling production [16,17]. In this work, we dealt with the issue of validating the main assumptions of a theoretical model that predicts the existence of an optimal injected steam flow rate to achieve well-defined temperature and velocity fields in the steam chamber and in the layer of condensation and drainage close to the edge of the steam chamber, the instantaneous shape of which is essential for the solution to the problem [15].
Consequently, the study of steam flow within the porous medium over short time periods (as compared to the expansion period of the chamber) is possible if the actual growth of the chamber is very slow, because the shape of the chamber can be assumed as fixed, as was assumed in the theoretical model and the current experiments. Conveniently, it has been previously determined that the typical expansion velocity of actual steam chambers d R c / d t is approximately 0.2 cm/day [16,17]. Moreover, it was also estimated that the rising stage (beginning of drainage) of the chamber lasts around one year and that the lateral expansion stage (peak of drainage) and the falling stage (end of drainage when the chamber reaches the boundary of the reservoir) last two to six years [17].
Similarly, it has been reported that some extra heavy oil reservoirs have initial temperatures as low as T R 20 ° C [17], which is consistent with our porous chamber slab system, which is at room temperature, making this a realistic condition.
We performed experiments for different mass flow rates per unit length ϕ and found that there is an optimal value of ϕ , defined as ϕ o p t , which allows maximal water production for an elliptical chamber for injection sessions lasting half an hour. It is appealing to consider other axially symmetric shapes for the steam chamber in order to asses its influence on the value of ϕ o p t . The accurate determination of the actual shape of steam chambers in pilot proofs and real exploitation processes is challenging, but analytical studies [31,32,33,34] and numerical simulations [35,36,37] allow other specific shapes of steam chambers to be evaluated, which can be used to predict efficient scenarios of SAGD injection and production processes.
If the shape of the steam chamber is to be maintained, another parameter to be taken into account in the experimental search for optimal values of the injection flow rate is the distance H between the injection and production pipes. Studies on the influence of H on the production of water–oil emulsion have been conducted, including proposals for the asymmetric placement of the recovery well [38,39].
The majority of experiments on steam chambers in oil-saturated reservoirs have shown that the condensate recovered in SAGD mainly consists of a water–oil emulsion. Thus, we can infer that the conditions required for the maximal production of water are similar to the conditions required for the maximal production of emulsion. In summary, based on previous and current results related to the existence of optimal values of ϕ o p t , we believe that it is possible to avoid the loss of large volumes of high-quality water and to reduce the vast quantities of energy required for steam generation.

6. Conclusions

In this work, we experimentally studied water gravity drainage due to steam injection into elliptical steam chambers based on a theoretical model that assumes a generic shape for the chamber [15]. In the experiments, we first performed steam injection into an elliptical, oil-saturated porous chamber. The porous chamber was a hollow space within a metallic slab filled with glass beads saturated with extra heavy oil. Given that the porous chamber had a size of tens of centimeters and that the injection pipe had a small radius, the radial injection allowed for the formation and growth of a natural steam chamber. Afterwards, we injected steam at different mass flow rates into cold and dry steam chambers, which allowed us to find that, effectively, an optimal mass flow rate per unit length, ϕ o p t , exists for which the production of condensate (water) is maximal. Based on the theoretical model, we propose that, in addition to the selection of a specific steam chamber shape, to obtain the a maximal rate, it is also possible to change the distance between the injection and production pipes to obtain the optimal flow rate. Finally, it is clear that more studies in this area are necessary.

Author Contributions

Design and performance of experiments: J.E.M.-G., A.M., F.J.H. and C.A.V.; modeling: A.M., F.J.H., J.E.M.-G. and C.A.V.; writing and revision: A.M., F.J.H., J.E.M.-G. and C.A.V. All authors have read and agreed to the published version of the manuscript.

Funding

This research received no external funding.

Institutional Review Board Statement

Not applicable.

Informed Consent Statement

Not applicable.

Data Availability Statement

The data presented in this study are available from the corresponding author upon request. The data are not publicly available as we do not have a publicly accessible repository.

Acknowledgments

A.M. acknowledges the support from Fondo de Hidrocarburos-CONACYT and Universidad Politécnica de Madrid with the project “Fundamental models for the thermal methods of steam injection in EOR”. He also appreciates the enormous support of A. Liñan, who guided him through a large part of this work. Finally, the authors acknowledge Abel Lopez-Villa and his engineering team for machining the steam chamber in the cast iron slab and the glass-made plates, allowing us to look at the fluid flows and the temperature distribution taking place inside the steam chamber.

Conflicts of Interest

The authors declare no conflict of interest.

References

  1. Liu, Z.; Wang, H.; Blackbourn, G.; Ma, F.; He, Z.; Wen, Z.; Wang, Z.; Yang, Z.; Luan, T.; Wu, Z. Heavy Oils and Oil Sands: Global Distribution and Resource Assessment. Acta Geol. Sin. 2019, 93, 199–212. [Google Scholar] [CrossRef] [Green Version]
  2. Grilc, M.; Likozar, B.; Levec, J. Hydrotreatment of solvolytically liquefied lignocellulosic biomass over NiMo/Al2O3 catalyst: Reaction mechanism, hydrodeoxygenation kinetics and mass transfer model based on FTIR. Biomass Bioenergy 2014, 63, 300–312. [Google Scholar] [CrossRef]
  3. Grilc, M.; Likozar, B.; Levec, J. Simultaneous Liquefaction and Hydrodeoxygenation of Lignocellulosic Biomass over NiMo/Al2O3, Pd/Al2O3, and Zeolite Y Catalysts in Hydrogen Donor Solvents. ChemCatChem 2016, 8, 180–191. [Google Scholar] [CrossRef]
  4. Pelkmans, L. IEA Bioenergy Countries’ Report—Update 2021, Implementation of Bioenergy in the IEA Bioenergy Member Countries. Technical Coordinator, IEA Bioenergy TCP. 2021. Available online: https://www.ieabioenergy.com/wp-content/uploads/2021/11/CountriesReport2021_final.pdf (accessed on 1 June 2022).
  5. Meyer, R.F.; Attanasi, E.D.; Freeman, P.A. Heavy Oil and Natural Bitumen Resources in Geological Basins of the World, Open File-Report 2007-1084; U.S. Geological Survey: Reston, VA, USA, 2007. [Google Scholar]
  6. Butler, R.M.; Stephens, D.J. The gravity drainage of steam-heated heavy oil to parallel horizontal wells. J. Can. Pet. Technol. 1981, 22, 90–96. [Google Scholar] [CrossRef]
  7. Butler, R.M. A new approach to the modelling of steam-assisted gravity drainage. J. Can. Pet. Technol. 1985, 24, 42–51. [Google Scholar] [CrossRef]
  8. Chung, K.H.; Butler, R.M. Geometrical effect of steam injection on the formation of emulsions in the steam-assisted gravity drainage process. J. Can. Pet. Technol. 1988, 27, 36–42. [Google Scholar] [CrossRef]
  9. Sasaki, K.; Akibayashi, S.; Yazawa, N.; Doan, Q.; Farouq Ali, S.M. Experimental modelling of the SAGD process 3/4 enhancing SAGD performance with periodic stimulation of the horizontal producer. In Proceedings of the SPE Annual Technical Conference and Exhibition, Houston, TX, USA, 3–6 October 1999. Paper SPE-56544-MS. [Google Scholar]
  10. Sasaki, K.; Akibayashi, S.; Yasawa, N.; Kaneko, F. Microscopic visualization with high resolution optical-fiber scope at steam chamber interface on initial stage of SAGD process. In Proceedings of the SPE/DOE Improved Oil Recovery Symposium, Tulsa, OK, USA, 16–18 April 2002. Paper SPE-75241. [Google Scholar]
  11. Mohammadzadeh, O.; Rezaei, N.; Chatzis, I. Pore-level investigation of heavy oil and bitumen recovery using hybrid SAGD process. In Proceedings of the 2010 SPE Improved Oil Recovery Symposium, Tulsa, OK, USA, 24–28 April 2010. Paper SPE 130011. [Google Scholar]
  12. Mohammadzadeh, O.; Chatzis, I. Pore-level investigation of heavy oil recovery using steam assisted gravity drainage (SAGD). Oil Gas Sci. Technol. Rev. IFP Energies Nouv. 2010, 65, 839–857. [Google Scholar]
  13. Li, S.; Yu, T.; Li, Z.; Zhang, K. Experimental investigation of nitrogen-assisted SAGD in heavy-oil reservoirs: A two-dimensional visual analysis. Fuel 2019, 257, 116013. [Google Scholar] [CrossRef]
  14. Velayati, A.; Nouri, A. Emulsification and emulsion flow in thermal recovery operations with a focus on SAGD operations: A critical review. Fuel 2020, 267, 117141. [Google Scholar] [CrossRef]
  15. Higuera, F.J.; Medina, A. A simple model of the flow in the steam chamber in SAGD oil recovery. In Supercomputing. ISUM 2019. Communications in Computer and Information Science; Torres, M., Klapp, J., Eds.; Springer: Cham, Switzerland, 2019; Volume 1151. [Google Scholar] [CrossRef]
  16. Edmunds, N.R.; Gittins, S.D. Effective application of steam assisted gravity drainage of bitumen to long horizontal well pairs. J. Can. Pet. Technol. 1993, 32, 49–55. [Google Scholar] [CrossRef]
  17. Zhou, Y.; Lu, T.; Wu, S.; Shi, L.; Du, X.; Wang, J. Models of steam-assisted gravity drainage (SAGD) steam chamber expanding velocity in double horizontal wells and its application. Petrol. Explor. Dev. 2019, 46, 347–354. [Google Scholar] [CrossRef]
  18. Fattahpour, V.; Mahmoudi, M.; Roostaei, M.; Wang, C.; Kotb, O.; Nouri, A.; Sutton, C.; Fermaniuk, B. Sand control testing for steam injection wells. In Proceedings of the SPE Canada Heavy Oil Technical Conference, Calgary, AB, Canada, 13–14 March 2018. Paper SPE-189766-MS. [Google Scholar]
  19. Phillips, O.M. Geological Fluid Dynamics: Sub-Surface Flow and Reactions; Cambridge University Press: Cambridge, UK, 2009. [Google Scholar]
  20. Nield, D.A.; Bejan, A. Convection in Porous Media; Springer: New York, NY, USA, 2013. [Google Scholar]
  21. Berryman, J.G. Random close packing of hard spheres and disks. Phys. Rev. A 1983, 27, 1053–1061. [Google Scholar] [CrossRef]
  22. Carman, O.C. Flow of Gases through Porous Media; Butterworths: London, UK, 1956. [Google Scholar]
  23. Chun, M.-H.; Kim, Y.-S.; Park, J.-W. An investigation of direct condensation of steam jet in subcooled water. Int. Commun. Heat Mass Transf. 1996, 23, 947–958. [Google Scholar] [CrossRef]
  24. Kim, H.Y.; Bae, Y.Y.; Song, C.H.; Park, J.K.; Choi, S.M. Experimental study on stable steam condensation in a quenching tank. Int. J. Energy Res. 2001, 25, 239–252. [Google Scholar] [CrossRef]
  25. Peralta, S.; Aragón, F.; Serrano, E.; Carbajal, I.; Medina, A. Visualization of steam injection into homogeneous porous media. J. Vis. 2017, 20, 277–288. [Google Scholar] [CrossRef]
  26. Properties of Saturated Steam—SI Units. Available online: https://www.engineeringtoolbox.com/saturated-steam-properties-d_101.html (accessed on 1 June 2022).
  27. Bruining, J.; Marchesin, D.; Schecter, S. Steam condensation waves in water-saturated porous rock. Qual. Theory Dyn. Syst. 2004, 4, 205–231. [Google Scholar] [CrossRef]
  28. Medina, A.; Higuera, F.J.; Pliego, M.; Gomez, G. Temperature profiles due to continuous hot water injection into homogeneous fluid-saturated porous media through a line source. Rev. Mex. Fís. 2021, 67, 365–368. [Google Scholar] [CrossRef]
  29. Landau, L.D.; Lifshitz, E.M. Fluid Mechanics (Volume 6 of Course of Theoretical Physics); Pergamon Press: Oxford, UK, 1987. [Google Scholar]
  30. Abramovich, G.N. The Theory of Turbulent Jets; The MIT Press: Cambridge, MA, USA, 1963. [Google Scholar]
  31. Zargar, Z.; Farouq Ali, S.M. Analytical modelling of steam chamber rise stage of Steam-Assisted Gravity Drainage (SAGD) process. Fuel 2018, 233, 732–742. [Google Scholar] [CrossRef]
  32. Jia, X.; Qu, T.; Chen, H.; Chen, Z. Transient convective heat transfer in a steam-assisted gravity drainage (SAGD) process. Fuel 2019, 247, 315–323. [Google Scholar] [CrossRef]
  33. Zargar, Z.; Razavi, S.M.; Farouq Ali, S.M. Analytical model of steam-assisted gravity drainage (SAGD) process in relation to constant injection rate. Fuel 2020, 265, 116772. [Google Scholar] [CrossRef]
  34. Nie, R.-S.; Wang, Y.-M.; Kang, Y.-L.; Jia, Y.-L. A steam rising model of steam assisted gravity drainage production for heavy oil reservoirs. Energy Explor. Exploit. 2020, 38, 801–818. [Google Scholar] [CrossRef] [Green Version]
  35. Huang, S.; Chen, X.; Liu, H.; Xia, Y.; Jiang, J.; Cao, M.; Li, A.; Yang, M. Experimental and numerical study of steam-chamber evolution during solvent-enhanced steam flooding in thin heavy-oil reservoirs. J. Pet. Sci. Eng. 2019, 172, 776–786. [Google Scholar] [CrossRef]
  36. Wang, Y.; Liu, H.; Zhou, Y. Development of a deep learning-based model for the entire production process of steam-assisted gravity drainage (SAGD). Fuel 2021, 287, 119565. [Google Scholar] [CrossRef]
  37. Yang, Z.; Sun, X.; Luo, C.; Xu, B.; Yang, B.; Li, B. Vertical-well-assisted SAGD dilation process in heterogeneous super-heavy oil reservoirs: Numerical simulations. Undergr. Space 2021, 6, 603–618. [Google Scholar] [CrossRef]
  38. Fernandez, B.; Ehlig-Economides, C.A.; Economides, M.J. Multilevel Injector/Producer Wells in Thick Heavy Crude Reservoirs. In Proceedings of the 1999 SPE Latin American and Caribbean Petroleum Engineering Conference, Caracas, Venezuela, 21–23 April 1999. Paper SPE 53950. [Google Scholar]
  39. Tao, L.; Yuan, X.; Cheng, H.; Li, B.; Huang, S.; Zhang, N. Experimental study on well placement optimization for steam-assisted gravity drainage to enhance recovery of thin layer oil sand reservoirs. Geofluids 2021, 2021, 9954127. [Google Scholar] [CrossRef]
Figure 1. Schematic of the cross-section of the steam chamber at a certain point in time. It has a symmetrical shape, r = R c ( θ ) , where θ is measured clockwise from the upper vertical axis ( θ = 0 ). The steam chamber is a porous medium of porosity φ and permeability K, and we assume that the main flow is due to the steam spreading to the chamber edge, where it condensates in the layer δ ( θ ) .
Fluids 07 00206 g001
Figure 2. Cross-section of the steam chamber subject to gravity action. In this work, the elliptical chamber is characterized by the equation r = R c ( θ ) , Equation (4), where the location of the injection pipe is O and that of the production pipe is P. The inner region of the ellipse is a homogeneous porous medium of permeability K and porosity φ . Meanwhile, the temperature of the injection of steam is T I , the boiling temperature of the phase change is T b , and the overall reservoir temperature is T R . Once the condensation of steam occurs, the water drains down through the slim layer of thickness, δ θ .
Fluids 07 00206 g002
Figure 3. Experimental setup for the real-time observation of steam injection into a steam chamber enclosed in a metallic slab. The IR camera allowed us to observe the time evolution of the temperature field in the steam chamber.
Fluids 07 00206 g003
Figure 4. Plot of the added mass, as a function of time, into a cold, distilled water reservoir produced with the minimum aperture of the steam generator. In this case, the steam nozzle produced a mass flow rate equal to m · = 0.66 ± 0.03 gr/s.
Fluids 07 00206 g004
Figure 5. Picture of the oil-saturated chamber 15 min after the injection start-up. Notice the dripping of the oil emulsion in the lower part.
Fluids 07 00206 g005
Figure 6. Thermographies that allow the formation and growth of the natural steam chamber in the oil-saturated porous medium contained in the elliptical chamber to be visualized. Each thermography was taken at different time points after the injection start-up: (a) t = 9.33 min, (b) t = 13.16 min, (c) t = 44.50 min, and (d) t = 58.66 min. Notice the symmetry of the steam chamber (white region) and that of the isotherms in (c,d). The black point indicates the position of the recovery orifice, and it is here that the red isotherm remains nearly invariant in (ad), meaning that the steam-to-water phase change occurs at around T b = 77 ° C.
Fluids 07 00206 g006
Figure 7. Actual dry elliptic chamber made in a 3.18 cm ( 1.5 ”) thickness cast iron slab.
Fluids 07 00206 g007
Figure 8. Plot of the water saturation pressure as a function of temperature (taken from [26]).
Fluids 07 00206 g008
Figure 9. Images of the temporal evolution of the condensation front during the steam injection (af). The steam is injected at the center of the chamber and it condensates due to the low temperature of the dry porous medium. For short periods of time, the front is mainly radial, but in the lower part, there is also a stream directed towards the recovery hole. In (a) it is observed that, the front reaches the vertices of the ellipse too, i.e., it reaches the overall edge of the chamber and is kept there.
Fluids 07 00206 g009
Figure 10. Plots of the condensation front r f ( θ , t ) along the vertical ( θ = 0 ) and horizontal ( θ = π / 2 ) lines for different time periods. Measurements were made from images in Figure 9.
Fluids 07 00206 g010
Figure 11. Thermographies during the transient stage of growth of the steam chamber: (a) thermography taken at t = 10 s after the injection start-up, (b) t = 120 s, (c) t = 360 s, and (d) t = 900 s. The white point indicates the position of the recovery orifice.
Fluids 07 00206 g011
Figure 12. Velocity vectors (green arrows) of the steam flow when the condensate reaches the camera edge. It becomes apparent, by following the direction of the velocity vectors, that condensation occurs on the wall of the chamber. The vector sizes were exaggerated to visualize them.
Fluids 07 00206 g012
Figure 13. Temperature distribution along r ( θ = π / 2 ) . The distribution was obtained from the thermography shown in Figure 11d. Note that, in the steam chamber, the temperature changes slowly, but outside the chamber edge, located at r = R c = 0.157 m, the temperature changes in a rapid manner.
Fluids 07 00206 g013
Figure 14. Plot of the mass flow rate of water recovered m · R as a function of the mass flow rate of steam injected m · I s .
Fluids 07 00206 g014
Figure 15. Plot of water recovered mass m W R versus the steam injected mass m S I for a time period of Δ t = 1800 s.
Fluids 07 00206 g015
Figure 16. Plot of e r versus ϕ , where the occurrence of an optimal value can be observed at ϕ = ϕ o p t 1.23 ± 0.06 gr/cm s. The dashed curve is used as a visual guide.
Fluids 07 00206 g016
Table 1. Thermophysical properties (at T = 25 ° C) of the materials of the steam chamber.
MaterialDensity
ρ (kg/m 3 )
Thermal
Conductivity
k (W/m K)
Specific
Heat
c (J/kg K)
Thermal
Diffusivity
α · 10 6 (m 2 /s)
Glass spheres (soda lime)25001.47500.74
Cast iron787180.244722.80
Publisher’s Note: MDPI stays neutral with regard to jurisdictional claims in published maps and institutional affiliations.

