
A Modular Wave Energy Converter for Observational and Navigational Buoys

Abstract
:
1. Introduction
2. Materials and Methods
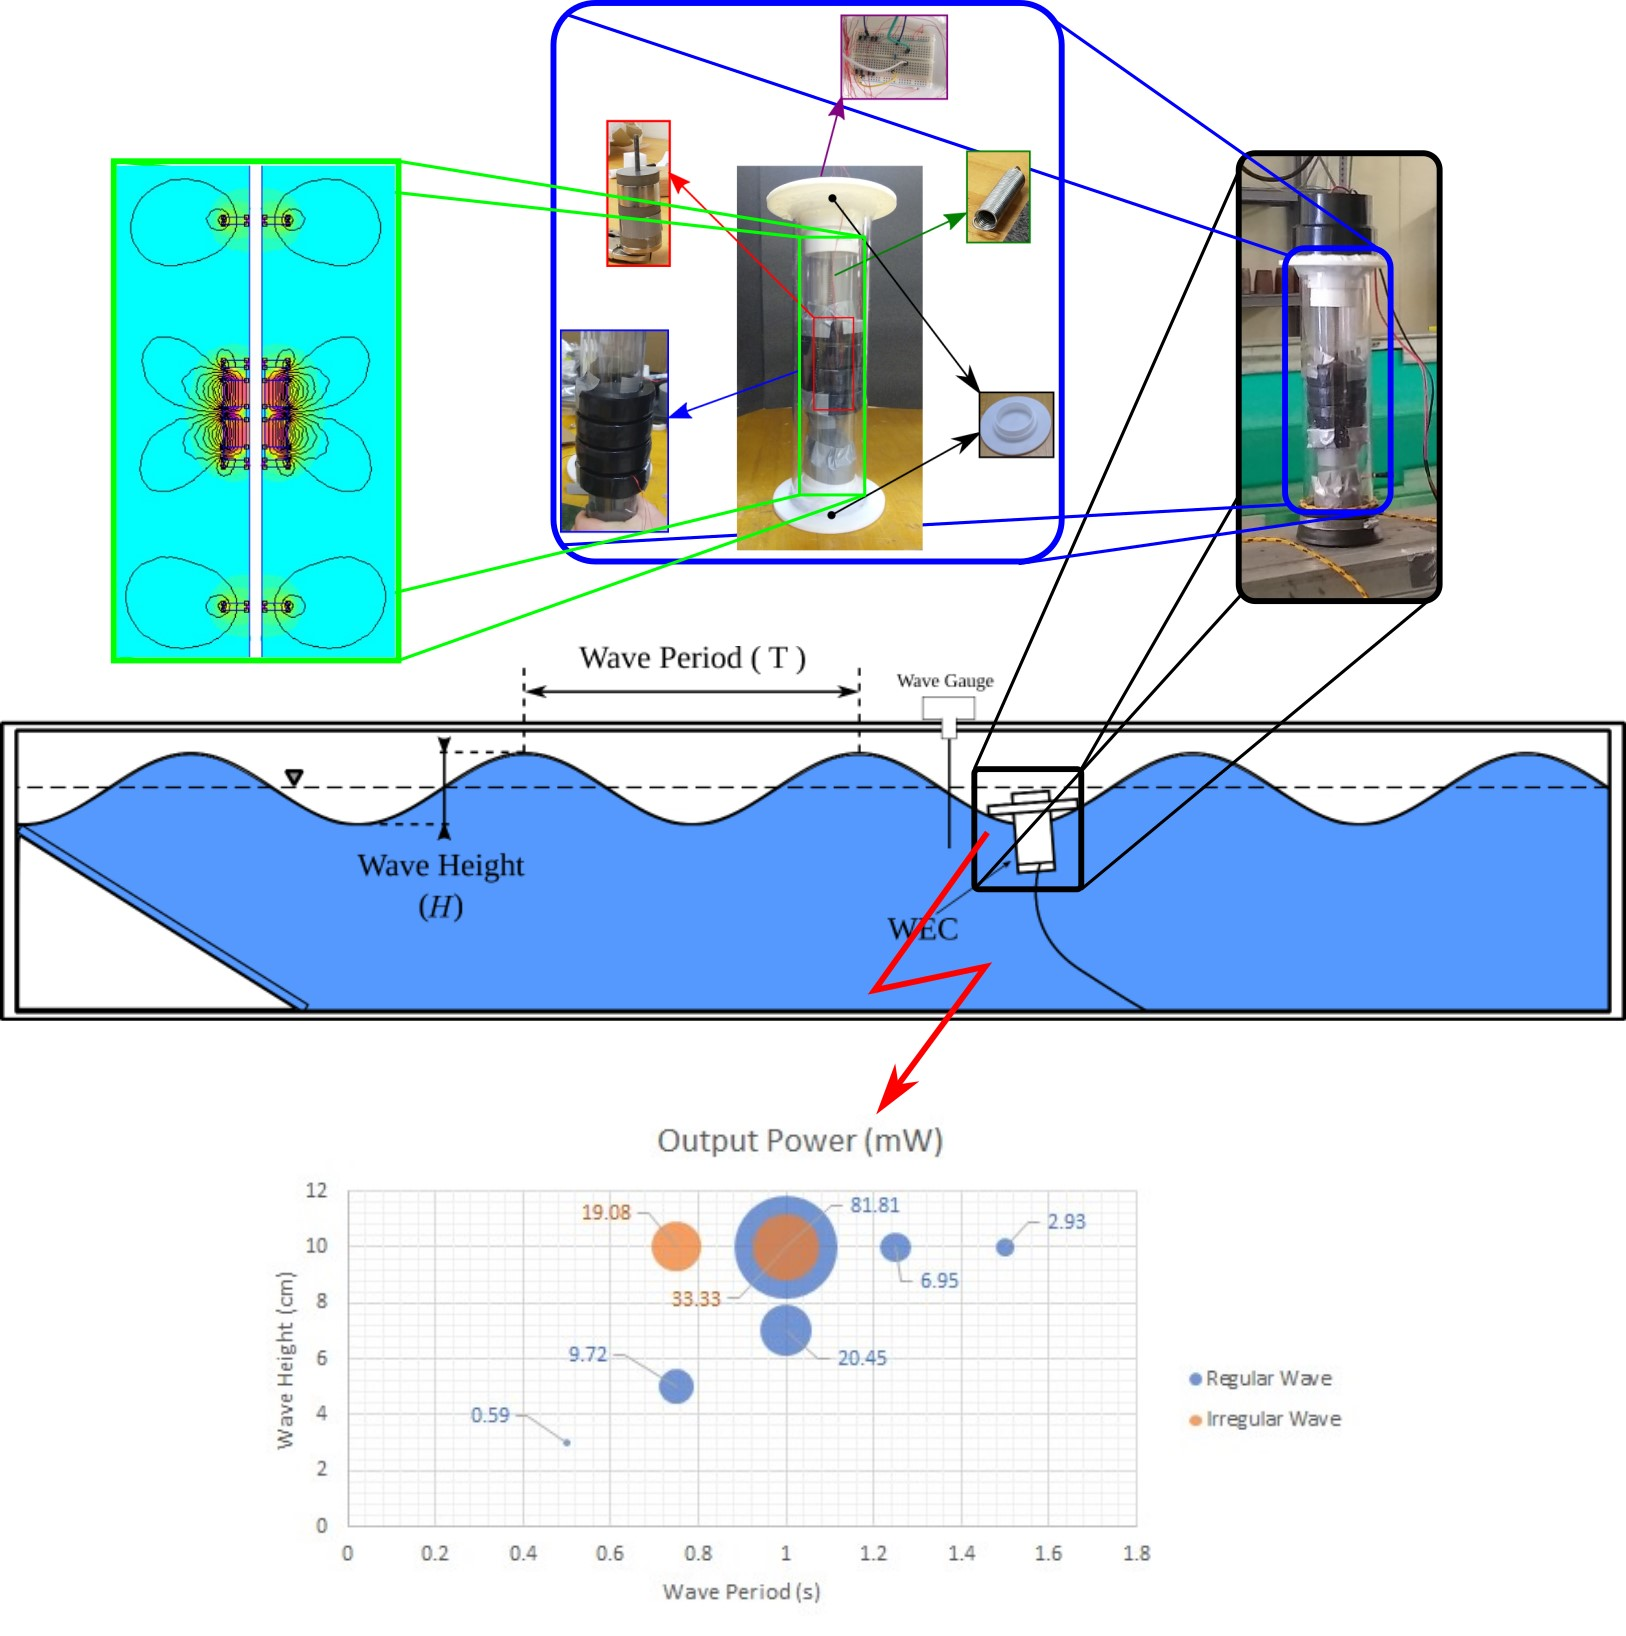
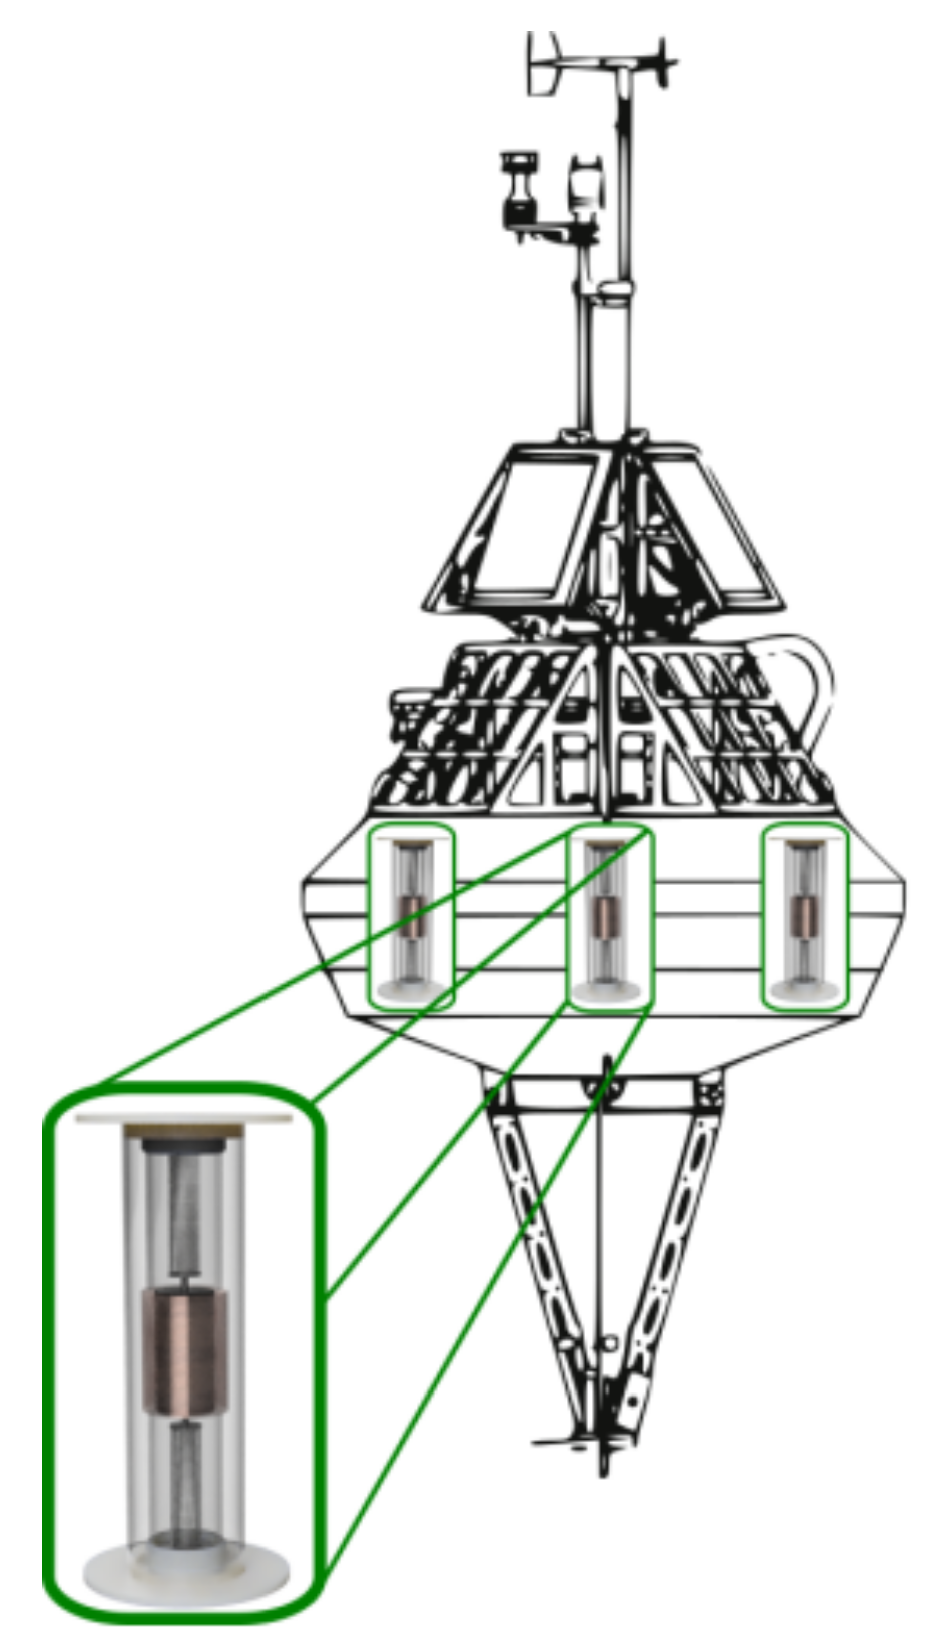
2.1. Overview of the System
2.2. Modeling
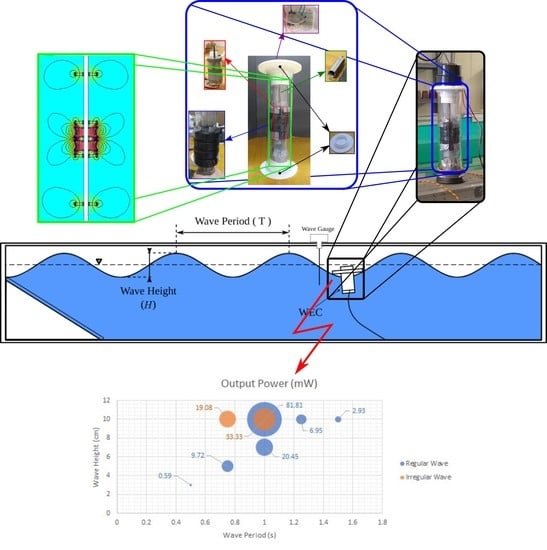
2.3. Experiments
3. Results
3.1. Numerical Results
3.1.1. Magnetic Fields and Restoring Forces
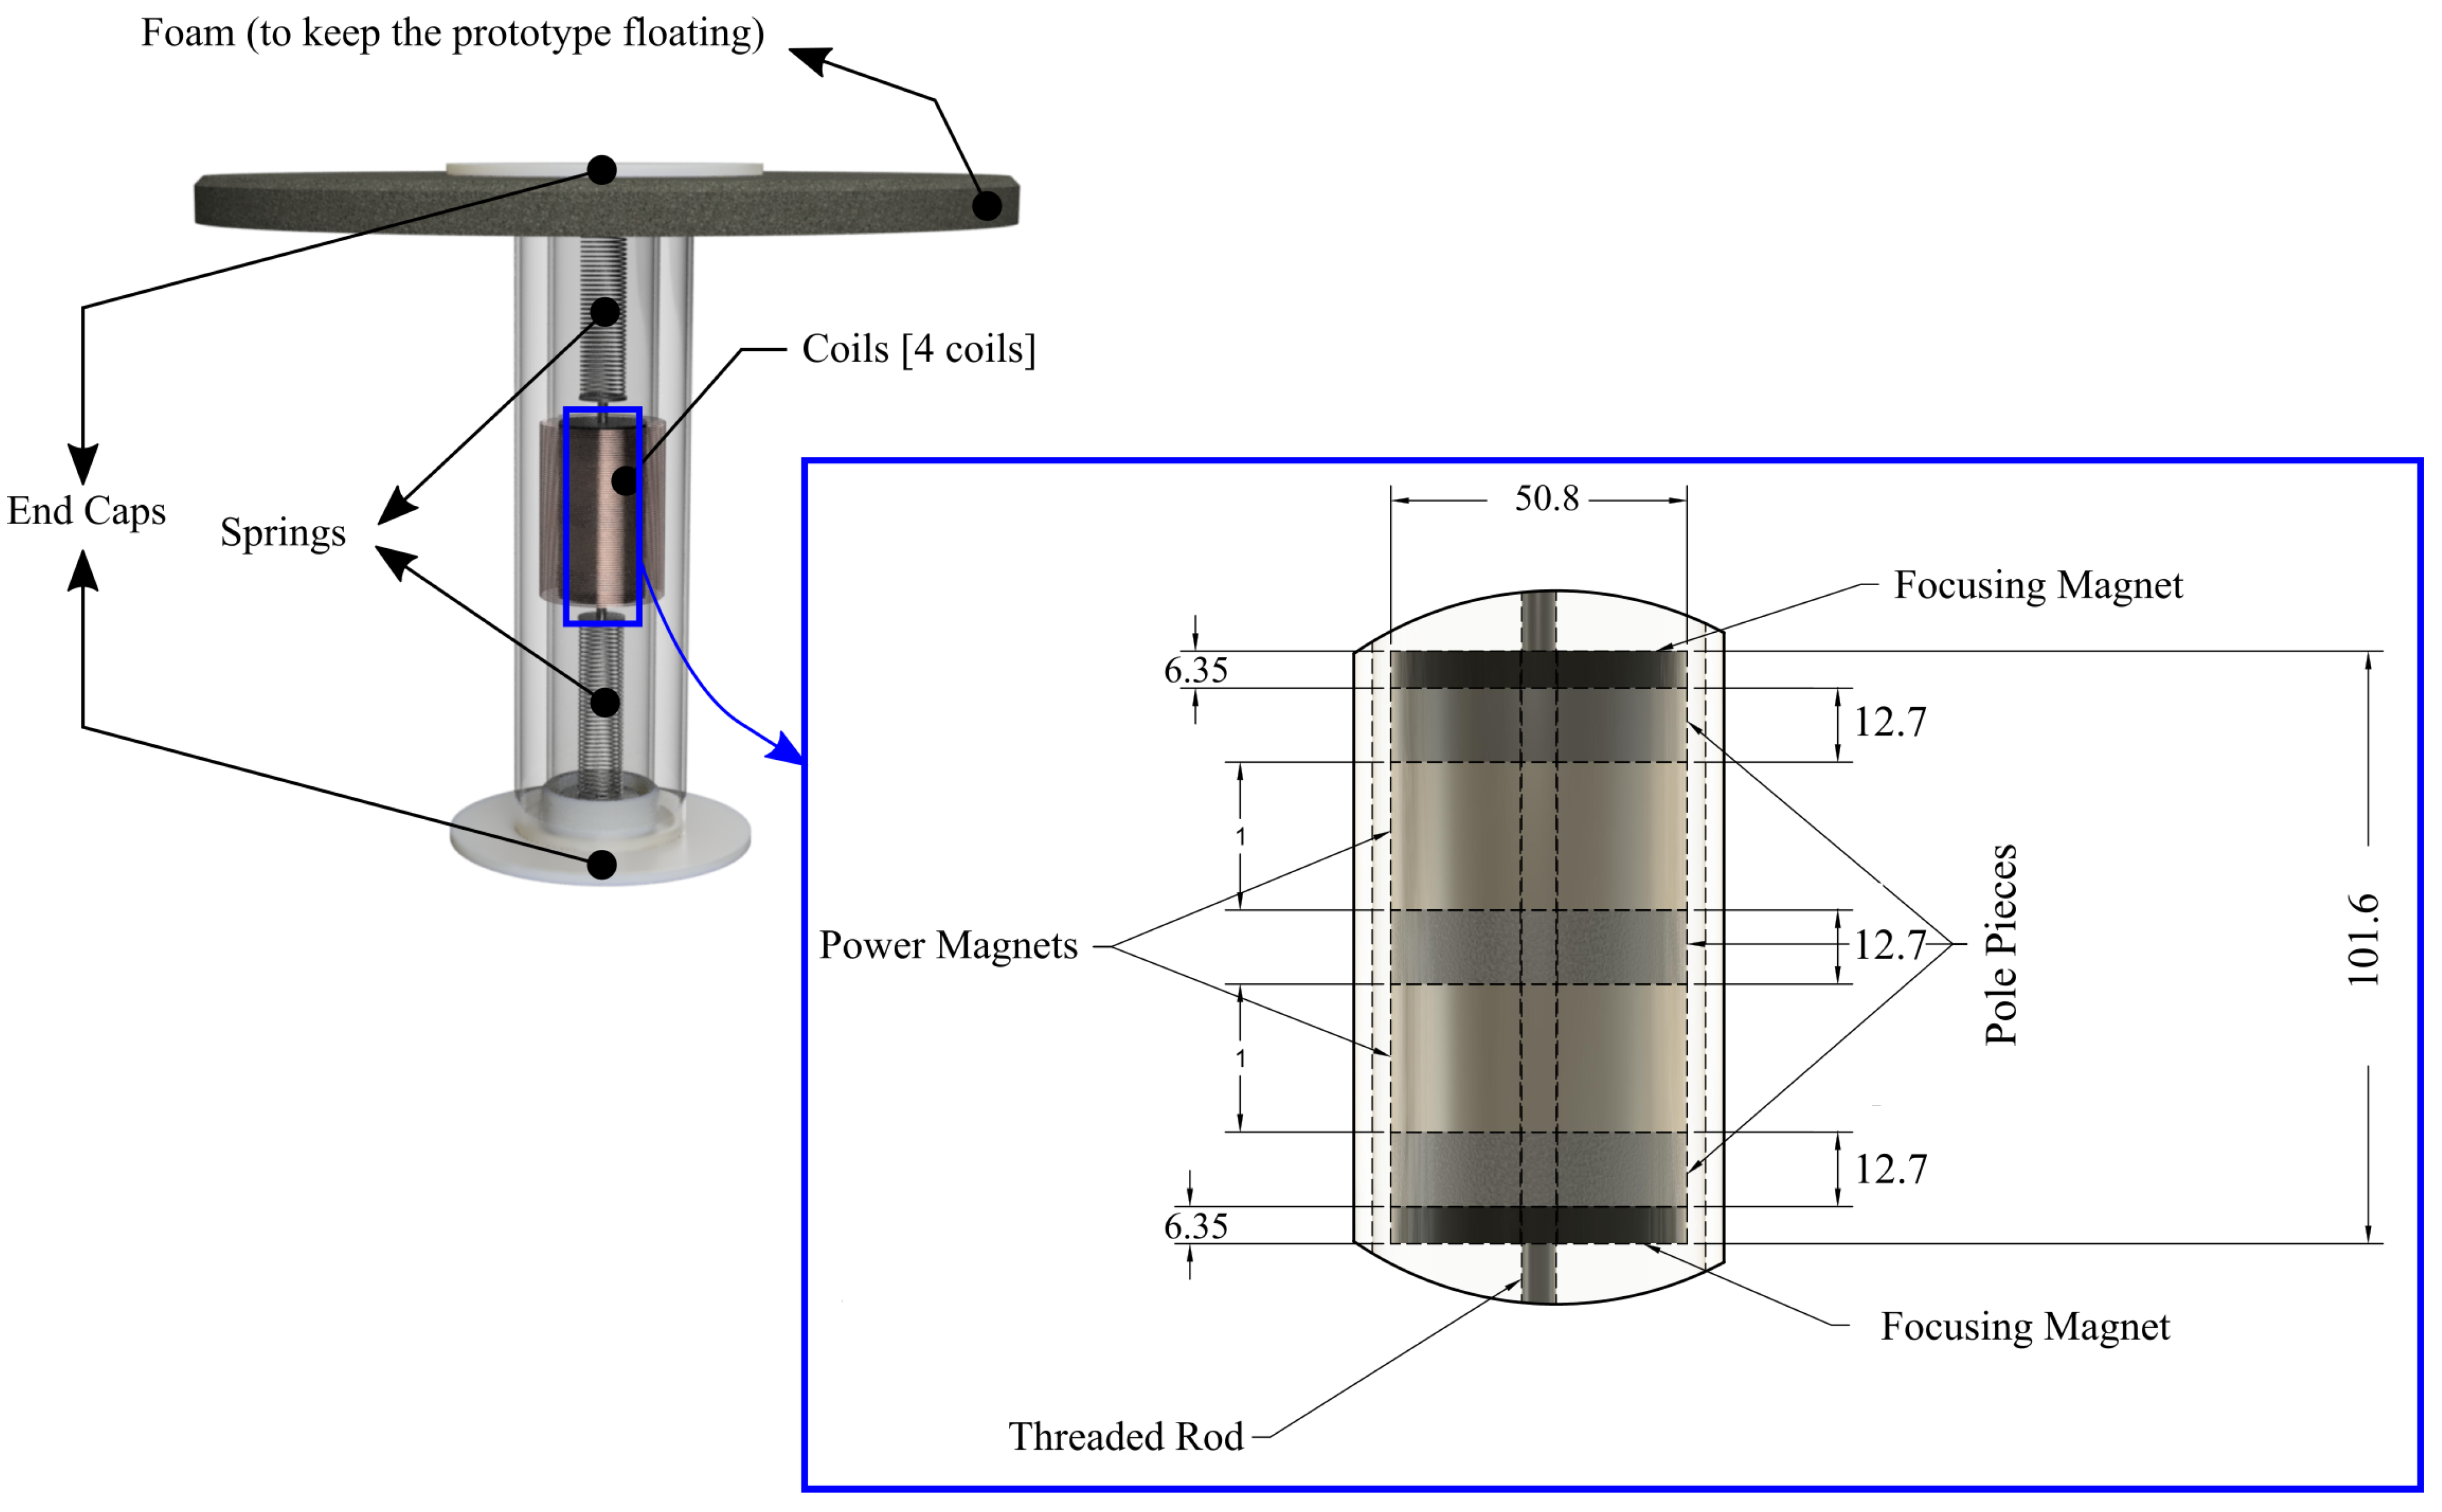
3.1.2. Dynamic Modeling and Power Generation
3.2. Experimental Results
4. Discussion
5. Conclusions
Author Contributions
Funding
Data Availability Statement
Conflicts of Interest
References
- Glenn, S.M.; Dickey, T.D.; Parker, B.; Boicourt, W. Long-term real-time coastal ocean observation networks. Oceanography 2000, 13, 24–34. [Google Scholar] [CrossRef]
- Dickey, T.D. Emerging ocean observations for interdisciplinary data assimilation systems. J. Mar. Syst. 2003, 40, 5–48. [Google Scholar] [CrossRef]
- Favali, P.; Beranzoli, L. Seafloor observatory science: A review. Ann. Geophys. 2006, 49, 515–567. [Google Scholar] [CrossRef]
- Gould, J.; Sloyan, B.; Visbeck, M. In situ ocean observations: A brief history, present status, and future directions. Int. Geophys. 2013, 103, 59–81. [Google Scholar]
- Zhao, T.; Xu, M.; Xiao, X.; Ma, Y.; Li, Z.; Wang, Z.L. Recent progress in blue energy harvesting for powering distributed sensors in ocean. Nano Energy 2021, 88, 106199. [Google Scholar] [CrossRef]
- Green, R.; Copping, A.; Cavagnaro, R.J.; Rose, D.; Overhus, D.; Jenne, D. Enabling power at sea: Opportunities for expanded ocean observations through marine renewable energy integration. In Proceedings of the OCEANS 2019 MTS/IEEE SEATTLE, Seattle, WA, USA, 27–31 October 2019. [Google Scholar]
- Hakkarinen, W. Solar power on the NOMAD buoy. In Proceedings of the 1970 IEEE International Conference on Engineering in the Ocean Environment—Digest of Technical Papers, Panama City, FL, USA, 1 September 1970; pp. 240–245. [Google Scholar]
- Chen, J.; Li, Y.; Zhang, X.; Ma, Y. Simulation and Design of Solar Power System for Ocean Buoy. J. Phys. Conf. Ser. 2018, 1061, 012018. [Google Scholar] [CrossRef] [Green Version]
- Guerriero, P.; Attanasio, C.; Matacena, I.; Daliento, S. Merged Photovoltaic/Wave System for the Power Supply of a Marine Buoy for Harbour Monitoring. In Proceedings of the 2019 International Conference on Clean Electrical Power (ICCEP), Otranto, Italy, 2–4 July 2019; pp. 664–668. [Google Scholar]
- Mayville, P.; Patil, N.V.; Pearce, J.M. Distributed manufacturing of after market flexible floating photovoltaic modules. Sustain. Energy Technol. Assess. 2020, 42, 100830. [Google Scholar] [CrossRef]
- Omar, A.H.; Kadir, H.A.; Arshad, M.R. An Analysis of Energy Harvesting System for Ocean Data Acquisition System (ODAS) Buoy. In Proceedings of the 12th National Technical Seminar on Unmanned System Technology 2020; Springer: Singapore, 2022; pp. 161–170. [Google Scholar]
- Cavagnaro, R.J.; Copping, A.E.; Green, R.; Greene, D.; Jenne, S.; Rose, D.; Overhus, D. Powering the blue economy: Progress exploring marine renewable energy integration with ocean observations. Mar. Technol. Soc. J. 2020, 54, 114–125. [Google Scholar] [CrossRef]
- Hegarty, A.; Westbrook, G.; Glynn, D.; Murray, D.; Omerdic, E.; Toal, D. A low-cost remote solar energy monitoring system for a buoyed IoT ocean observation platform. In Proceedings of the 2019 IEEE 5th World Forum on Internet of Things (WF-IoT), Limerick, Ireland, 15–18 April 2019; pp. 386–391. [Google Scholar]
- Becker, W.W. An Inquiry into the Feasibility of Using Ocean Surface Wave Energy to Power an Oceanographic Data Collection Buoy; Technical Report; Rhode Island Univ Kingston Dept of Ocean Engineering: Narragansett, RI, USA, 1969. [Google Scholar]
- Isaacs, J.D.; Castel, D.; Wick, G.L. Utilization of the energy in ocean waves. Ocean Eng. 1976, 3, 175–187. [Google Scholar] [CrossRef]
- Bastien, S.P.; Sepe, R.B.; Grilli, A.R.; Grilli, S.T.; Spaulding, M.L. Ocean wave energy harvesting buoy for sensors. In Proceedings of the 2009 IEEE Energy Conversion Congress and Exposition, San Jose, CA, USA, 20–24 September 2009; pp. 3718–3725. [Google Scholar]
- Davis, E.P.; Ertekin, R.C.; Riggs, H.R. A buoy-based WEC device to provide low power to sensors. Int. Conf. Offshore Mech. Arct. Eng. 2009, 43444, 1109–1118. [Google Scholar]
- Symonds, D.; Davis, E.; Ertekin, R.C. Low-power autonomous wave energy capture device for remote sensing and communications applications. In Proceedings of the 2010 IEEE Energy Conversion Congress and Exposition, Atlanta, GA, USA, 12–16 September 2010; pp. 2392–2396. [Google Scholar]
- Gemme, D.A.; Greene, H.R.; Tucker, T.A.; Sepe, R.B.; Bastien, S.P. Hybrid resonant wave energy harvesting buoy for sensor applications. In Proceedings of the 2013 OCEANS, San Diego, CA, USA, 23–27 September 2013; pp. 1–6. [Google Scholar]
- Grilli, S.T.; Grilli, A.R.; Spaulding, M.L.; Bastien, S.P.; Sepe, R.P. Small buoys for energy harvesting: Experimental and numerical modeling studies. In Proceedings of the Twenty-First International Offshore and Polar Engineering Conference, Maui, HI, USA, 19–24 June 2011. [Google Scholar]
- Harne, R.; Schoemaker, M.; Dussault, B.; Wang, K. Wave heave energy conversion using modular multistability. Appl. Energy 2014, 130, 148–156. [Google Scholar] [CrossRef]
- Wu, S.; Liu, Y.; An, Q. Hydrodynamic Analysis of a Marine Current Energy Converter for Profiling Floats. Energies 2018, 11, 2218. [Google Scholar] [CrossRef] [Green Version]
- Mann, B.; Sims, N. Energy harvesting from the nonlinear oscillations of magnetic levitation. J. Sound Vib. 2009, 319, 515–530. [Google Scholar] [CrossRef] [Green Version]
- Masoumi, M.; Wang, Y. Repulsive magnetic levitation-based ocean wave energy harvester with variable resonance: Modeling, simulation and experiment. J. Sound Vib. 2016, 381, 192–205. [Google Scholar] [CrossRef] [Green Version]
- Chakrabarti, S.K. Hydrodynamics of Offshore Structures; WIT Press: Southampton, UK, 1987. [Google Scholar]
- Viswanathan, S.; Holden, C. Towards the development of an ocean engineering library for openmodelica. Int. Conf. Offshore Mech. Arct. Eng. 2019, 58851, V07BT06A025. [Google Scholar]
- Meeker, D. FEMM 3.4 Magnetostatic Tutorial. 2004. Available online: http://www.femm.info/Archives/doc/femm34tutor.pdf (accessed on 9 January 2022).
- Fritzson, P.; Aronsson, P.; Pop, A.; Lundvall, H.; Nystrom, K.; Saldamli, L.; Broman, D.; Sandholm, A. OpenModelica-A free open-source environment for system modeling, simulation, and teaching. In Proceedings of the 2006 IEEE Conference on Computer Aided Control System Design, 2006 IEEE International Conference on Control Applications, 2006 IEEE International Symposium on Intelligent Control, Munich, Germany, 4–6 October 2006; pp. 1588–1595. [Google Scholar]
- Van Rossum, G.; Drake, F.L. Python 3 Reference Manual; CreateSpace: Scotts Valley, CA, USA, 2009. [Google Scholar]
- Bitter, R.; Mohiuddin, T.; Nawrocki, M. LabVIEW: Advanced Programming Techniques; CRC Press: Boca Raton, FL, USA, 2006. [Google Scholar]
- Fritzson, P.; Engelson, V. Modelica—A unified object-oriented language for system modeling and simulation. In European Conference on Object-Oriented Programming; Springer: Berlin/Heidelberg, Germany, 1998; pp. 67–90. [Google Scholar]
- Scott, G.N. National Wave Energy Resource Refinement Using 30-Year Hindcast; Technical Report; National Renewable Energy Lab. (NREL): Golden, CO, USA, 2018. [Google Scholar]
- Jain, A.; Goupee, A.J.; Robertson, A.N.; Kimball, R.W.; Jonkman, J.M.; Swift, A.H. FAST code verification of scaling laws for DeepCwind floating wind system. In Proceedings of the Twenty-Second International Offshore and Polar Engineering Conference, Rhodes, Greece, 17–22 June 2012. [Google Scholar]
- Wheeler, H.A. Inductance formulas for circular and square coils. Proc. IEEE 1982, 70, 1449–1450. [Google Scholar] [CrossRef]
- Bouchard, R.H.; Jensen, R.E.; Riley, R.; LeBlanc, L.A.; Fiorentino, L.A. Calibration and Field Evaluation of the National Data Buoy Center’s New Wave Measurement System. In Proceedings of the 98th American Meteorological Society Annual Meeting, Austin, TX, USA, 7–11 January 2018. [Google Scholar]
- Kohler, P.C.; LeBlanc, L.; Elliott, J. SCOOP-NDBC’s new ocean observing system. In Proceedings of the OCEANS 2015—MTS/IEEE Washington, Washington, DC, USA, 19–22 October 2015; pp. 1–5. [Google Scholar]
- Hall, C.; Bouchard, R.H.; Riley, R.; Stewart, R.; Wang, D.; DiNapoli, S. Emerging National Data Buoy Center (NDBC) Wave Systems. In Proceedings of the Conference: JCOMM DBCP-34 Meeting, Cape Town, South Africa, 23–26 October 2018. [Google Scholar]
- Lee, C.H.; Newman, J.N. Wamit User Manual; WAMIT, Inc.: Chestnut Hill, MA, USA, 2006; p. 42. [Google Scholar]
- Ansys, A. AQWA User’S Manual Release 17.0; ANSYS Inc.: Canonsburg, PA, USA, 2016. [Google Scholar]
- Babarit, A.; Delhommeau, G. Theoretical and numerical aspects of the open source BEM solver NEMOH. In Proceedings of the 11th European wave and tidal energy conference (EWTEC2015), Nantes, France, 6–11 September 2015. [Google Scholar]


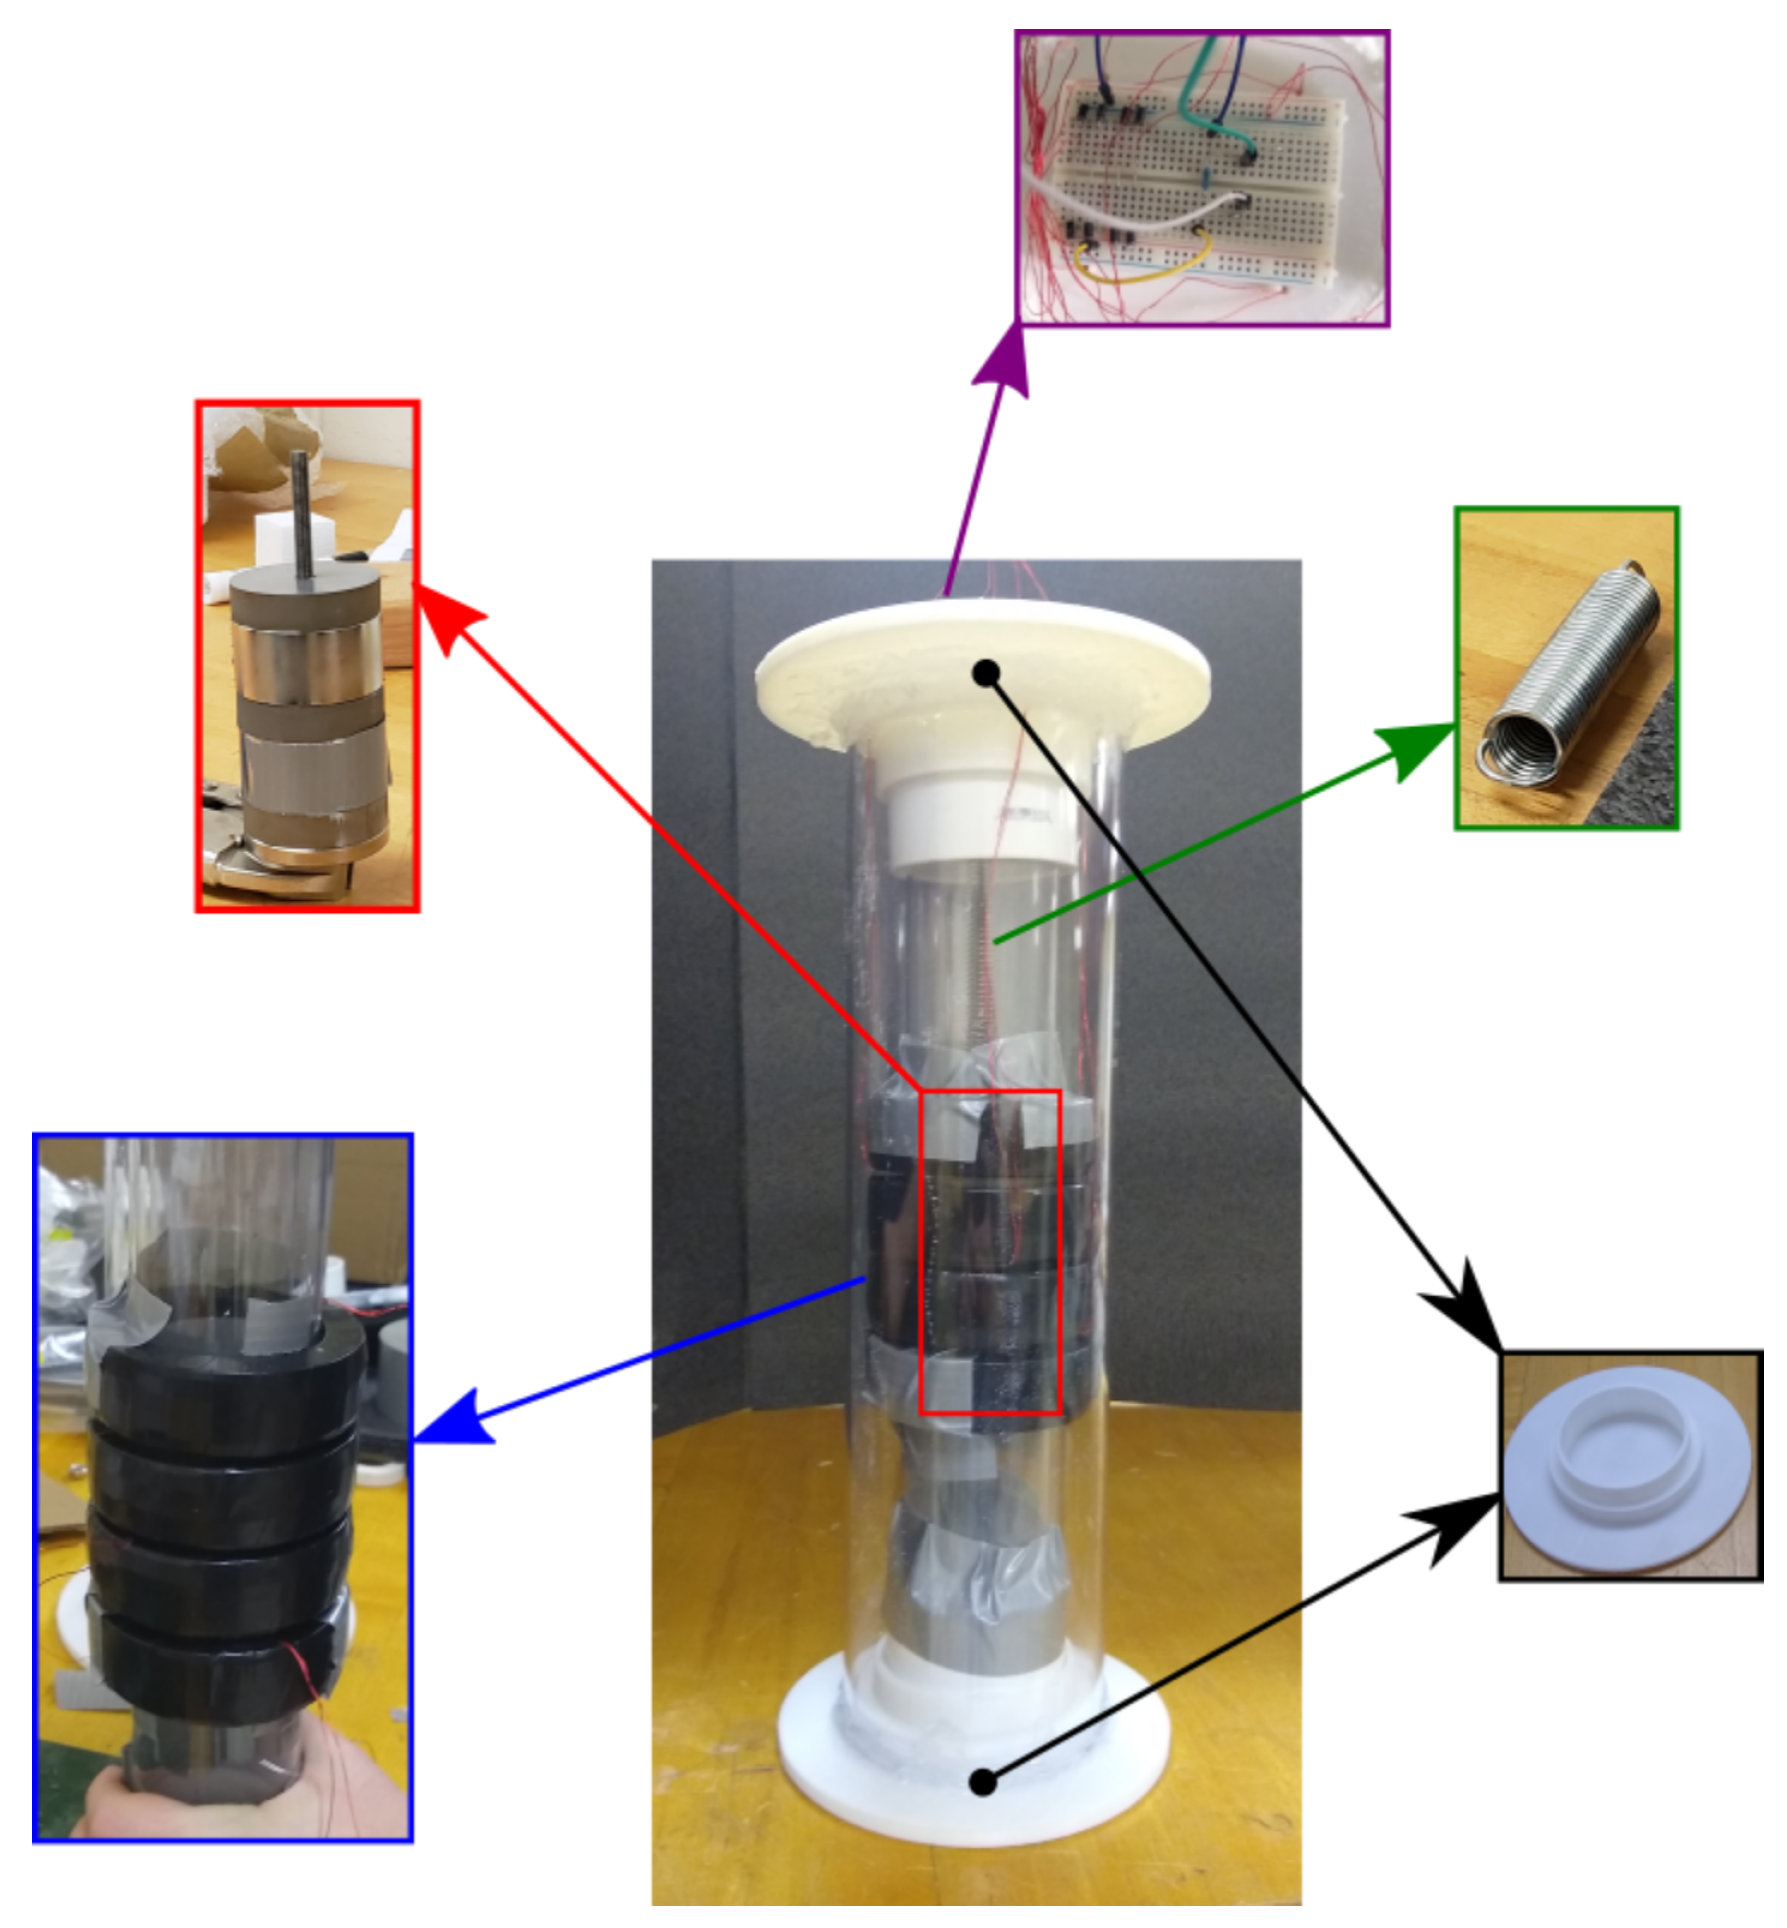
| Component | Description (All Dimensions Are in Millimeters) |
|---|---|
| Power Magnet | 50.8 OD, 6.35 ID, and 25.4 Th. |
| Braking Magnet | 50.8 OD, 6.35 ID, and 6.35 Th. |
| Focusing Magnet | 50.8 OD, 6.35 ID, and 6.35 Th. |
| 316 Stainless Steel Rod | 50.8 OD |
| Lexan Cylinder | 101.6 OD and 95.25 ID |
| Lexan Cylinder | 57.15 OD and 53.975 ID |
| PVC End Cap | 76.2 OD |
| Springs and Spring Anchors | Various Stiffness (for testing) |
| Stainless Steel Threaded Rod | 6.35 Diameter |
| Coil | 95.25 OD and 57.15 ID |
| Silicone Sealant | Marine Grade |
| Location | WD (m) | WP (s) | WH (m) | CS (m/s) | EF (kW/m) |
|---|---|---|---|---|---|
| San Francisco, CA | 51.8 | 10.3 | 1.64 | 0.1574 | 14.11 |
| Kapaau, HI | 60 | 7.97 | 1.34 | 0.1513 | 8.13 |
| Parameter | ||||||
|---|---|---|---|---|---|---|
| Value | 50 | 50 | 0.2 | 0.05 | 0.165 | 0.01 |
| Wave Period (s) | 0.5 | 0.75 | 1 | 1 | 1.25 | 1.5 |
| Wave Height (cm) | 3 | 5 | 7 | 10 | 10 | 10 |
| Peak Spectral Period (s) | 0.75 | 1 |
| Significant Wave Height (cm) | 10 | 10 |
Publisher’s Note: MDPI stays neutral with regard to jurisdictional claims in published maps and institutional affiliations. |
© 2022 by the authors. Licensee MDPI, Basel, Switzerland. This article is an open access article distributed under the terms and conditions of the Creative Commons Attribution (CC BY) license (https://creativecommons.org/licenses/by/4.0/).
Share and Cite
Vella, N.; Foley, J.; Sloat, J.; Sandoval, A.; D’Attile, L.; Masoumi, M. A Modular Wave Energy Converter for Observational and Navigational Buoys. Fluids 2022, 7, 88. https://doi.org/10.3390/fluids7020088
Vella N, Foley J, Sloat J, Sandoval A, D’Attile L, Masoumi M. A Modular Wave Energy Converter for Observational and Navigational Buoys. Fluids. 2022; 7(2):88. https://doi.org/10.3390/fluids7020088
Chicago/Turabian StyleVella, Nicholas, Jamie Foley, James Sloat, Alexander Sandoval, Leonardo D’Attile, and Masoud Masoumi. 2022. "A Modular Wave Energy Converter for Observational and Navigational Buoys" Fluids 7, no. 2: 88. https://doi.org/10.3390/fluids7020088