Article

Numerical Investigation and Fluid-Structure Interaction (FSI) Analysis on a Double-Element Simplified Formula One (F1) Composite Wing in the Presence of Ground Effect

by
Chris Sungkyun Bang
1,*,
Zeeshan A. Rana
2,
László Könözsy
2,
Veronica Marchante Rodriguez
1 and
Clive Temple
1
1
Advanced Vehicle Engineering Centre, School of Aerospace, Transport and Manufacturing, Cranfield University, Cranfield MK43 0AL, UK
2
Centre for Computational Engineering Sciences, School of Aerospace, Transport and Manufacturing, Cranfield University, Cranfield MK43 0AL, UK
*
Author to whom correspondence should be addressed.
Fluids 2022, 7(2), 85; https://doi.org/10.3390/fluids7020085
Submission received: 8 November 2021 / Revised: 9 February 2022 / Accepted: 11 February 2022 / Published: 19 February 2022
(This article belongs to the Special Issue Fluid Structure Interaction: Methods and Applications)

Abstract

:
This research paper focuses on a novel coupling of the aerodynamic and structural behaviour of a double-element composite front wing of a Formula One (F1) vehicle, which was simulated and studied for the first time here. To achieve this goal, a modified two-way coupling method was employed in the context of high performance computing (HPC) to simulate a steady-state fluid-structure interaction (FSI) configuration using the ANSYS software package. The front wing plays a key role in generating aerodynamic forces and controlling the fresh airflow to maximise the aerodynamic performance of an F1 car. Therefore, the composite front wing becomes deflected under aerodynamic loading conditions due to its elastic behaviour which can lead to changes in the flow field and the aerodynamic performance of the wing. To reduce the uncertainty of the simulations, a grid sensitivity study and the assessment of different engineering turbulence models were carried out. The practical contribution of our investigations is the quantification of the coupled effect of the aerodynamic and structural performance of the wing and an understanding of the influence of ride heights on the ground effect. It was found that the obtained numerical surface pressure distributions, the aerodynamic forces, and the wake profiles show an accurate agreement with experimental data taken from the literature.

Graphical Abstract

1. Introduction

The front wing of a Formula One (F1) racing vehicle, when operated in close proximity to the ground, generates approximately 30% of total downforce [1], which is utilised in conjunction with mechanical grip to boost acceleration, braking, and turning speed. The wing, being the first appurtenance subjected to fresh airflow, has a significant influence on management of downstream airflow, interacting with other aerodynamic devices such as bargeboards, the underfloor, and the rear wing. It can maintain not only a low level of turbulence but also high energy within the fluid. As a result of a great amount of aerodynamic loading exerted on the front wing, the focus lies in the structural design. The wing should be rigid enough to bear the aerodynamic forces through high-speed corners as well as sufficiently durable. Moreover, in order to enhance competitiveness in the motorsport world, the structural design should aim to reduce the weight.
In 2011 Australian Grand Prix, it was noticed that the front wing end of the Red Bull RB6 was deflected towards the ground far more than those of its competitors [2]. It was revealed that the wing becomes flexible under aerodynamic loads due to the elastic characteristic induced by the composite structure, and this is exploited to gain an aerodynamic advantage. The aeroelastic behaviour of the composite wing allows F1 engineers to improve aerodynamic performance by circumventing the technical regulation stating that all aerodynamic components must be satisfied with the static deflection test as a rigid body.
Both experimental and numerical studies on the inverted wing in ground effect have been extensively performed. In the F1 car, addition of extra elements on the wing can be an option to enhance aerodynamic performance by delaying trailing edge separation. Following single-element wing studies [3,4,5,6], investigation was thoroughly carried out on the double-element wing. It was started by Ranzenbach and Barlow conducting an experimental work on a two-dimensional NACA 63 2 215 Mod B aerofoil with 30% flap gap at the fixed ground facility [7]. It was observed that additional downforce is obtained compared to that of the single-element wing, and a region of force decrease was captured at large heights. Jasinski and Selig [8] conducted another experiment with the double-element wing. The ride height was fixed for 0.3 chord length, and the ground was not moving. It was shown that two trailing edge vortices at the endplate were created, and their size increased with higher flap angle. Following their single-element wing experiment, Zhang and Zerihan also investigated the ground effect of a two-element wing [9], which is a combination of the single-element wing extracted from the previous work [6] with an extra flap downstream. The results obtained from LDA, PIV, and oil flow visualisation presented the surface pressure on both elements and the sectional forces with the ride height variation. The downforce increase was mainly attributed to the main element with the help of significant circulation caused by the flap. As the wing was approached, the downforce increased up to the maximum and fell off due to the vortex breakdown at the small height. The double-element wing in ground proximity was tested experimentally by Mahon [10] with various configurations of flap position and ride heights. It was found that the forces generated by a wing with multiple elements in ground proximity were largely insensitive to variation in flap location. However, extreme values of flap gap and flap location resulted in significant reductions in aerodynamic forces (downforce and drag) and pitching moment due to the flap stalling. The same model as Mahon’s was experimentally tested by van den Berg [11] with a goal of ensuring and refuting Mahon’s hypotheses. However, unlike Mahon’s idea, he claimed that the cause of reduction in downforce is mainly from the edge vortex breakdown instead of the reversed flow within the lower wake. A region of larger flow reversal occurred as the edge vortex broke down.
Computational studies have been extensively performed on the double-element wing in ground effect. Ranzenbach and Barlow also examined the flow field around their double-element aerofoil using variants of the Standard k-ε model in a structured domain including a moving ground [12]. At low ride heights, they only noticed minor variations in downforce, but this did not affect their original conclusion on the cause of force reduction. The influence of various turbulence models was evaluated by Mahon and Zhang [13] using Zerihan’s double-element aerofoil [9]. It was noted that more than 80% of total downforce is generated by the primary element, whereas the flap creates a great deal of drag. With the limited dimensionality, it was argued that the numerical solution anticipates the boundaries of the wake inaccurately. Mahon also used a three-dimensional double-element wing to undertake a thorough computational examination [10]. The underestimated lower surface suction pressure caused weaker edge vortices and they showed close relationship with the pressure discrepancy between the wing’s bottom and upper surfaces. The three-dimensionality helped to better predict the wake profile compared to the two-dimensional result. Following the work of Mahon [10], the same wing model was numerically studied by van den Berg [14], focusing on improving the quality of the computational domain to obtain better results. Consequently, the correlation between experiment and numerical solution was improved in comparison with the work of Mahon [10]. However, the RANS results failed to converge for a region of the non-dimensionalised ground height (h/c) ranging between 0.158 and 0.317 due to limitation of capturing unsteady characteristic of the flow caused by the vortex breakdown. Heyder-Bruckner conducted a computational study on a double-element wing in ground proximity with ride height variation using RANS and detached eddy simulation (DES) [15]. The DES produced better prediction of the general feature of downforce and breakdown of the main edge vortex than that of RANS. It was also found that the wing downforce was only influenced at higher ride heights before the vortex breakdown occurred. Recent research carried out by Benjamin [16] was also focused on aerodynamic investigation of the double-element wing used for the motorsport application. It was observed that a bio-mimicked modification inspired by tubercles of a humpback whale flipper implemented on the leading edge of the wing has potential to enhance aerodynamic performance.
Despite the importance of the structural design of the inverted wing in ground effect, there have been few studies considering integration of the wing aerodynamics and structure. As a result of significant non-linear and interdisciplinary characteristics of the aero-structural coupled phenomenon, a numerical technique known as fluid-structure interaction (FSI) may be alternatively used because existing experiments and computations are restricted. The advent of numerical solutions can address complicated FSI engineering problems in an efficient manner in many industries such as aerospace, automotive, hemodynamics, and hydrodynamics. Aeroelastic behaviour of aircraft wings is one of the essential aspects to be taken into consideration to prevent the wing from static or dynamic aeroelastic problems [17,18,19]. In mechanical engineering, hydraulic system geometry consisting of hydrofoils can be developed by using the FSI approach to study effect of the interaction between the foils and flow on their performance [20,21]. In hydrodynamics, cavitation, which has a negative effect on the flow behaviour, was investigated by implementing the FSI analysis [22], and a new FSI method coupling the smoothed particle hydrodynamics (SPH) and finite element method (FEM) was developed to study a dam break problem with an elastic gate [23]. A new form of two-way coupling FSI modelling for a three-dimensional model for an asymmetric serpentine was introduced by using COMSOL and an arbitrary Lagrangian–Eulerian (ALE) method [24]. The reduced basis method (RBM) was integrated with the FSI modelling approaches to solve the complicated coupled problems in a more efficient manner [25,26]. However, the focus should lie on implementation of a separate method into existing modelling techniques, especially remeshing process. In addition, code implementation may be a lengthy process when the complexity of the problem is increased. Recently, many studies on hemodynamics using FSI analysis have been carried out [27,28,29,30]. Despite assessing different parts of the body or diseases, the main objective is to investigate the dynamic behaviour between blood flow and flexible aortic wall deformation and ultimately to better understand causes attributed to diseases.
Aeroelastic behaviour of car components has been the subject of research in the automotive industry. FSI analysis based on one-way coupling was employed to predict a potential panel problem caused by vibration of an elastic vehicle hood interacting with flow field, which is of great help in the preliminary design stage [31]. Ratzel et al. [32] carried out FSI simulations coupled to transient flow to investigate aerodynamic performance of a flexible flap attached to the rear of a generic vehicle model. Based on a geometric parameterisation study using the FSI technique, the flap shape was optimised in order to minimise deformation. A front spoiler was numerically analysed using a two-way FSI weakly coupled method to evaluate the effect of interaction between the component and near/far flow fields on vehicle drag [33]. The computational results were supported in comparison with the experiments performed in a wind tunnel. Hydroplaning, which occurs between the tyre surface and a layer of water on the road, was evaluated by coupling the finite element method and Navier–Stokes equation [34]. Despite more computational resources being required to simulate the FSI analysis, more accurate prediction for hydroplaning speed and associated tyre performance was achieved. There are few studies on development of race car wing performance using the FSI analysis. A Formula One car front wing was simulated by a CFD and FEA coupled method in order to investigate the wing performance regarding lift and drag [35]. However, the ground effect was not taken into consideration in this research. Castro et al. [36] performed an aero-structural coupled numerical analysis of a multi-element wing created based on 2022 F1 technical regulations. Several variations of the structural design of the wing were studied to quantify its behaviour related to aerodynamic forces applied. Another recent work studied aeroelastic behaviour of the wing in ground effect [37]. The single-element composite wing in ground effect was used to investigate and quantify the aeroelastic effect on the aerodynamic and structural performance of the wing using a two-way coupling method in ANSYS software, which has great benefits in reducing the resources required to develop a specific code and associated implementation procedure. A modified FSI framework using existing fluid and structural modules within the software was proposed in conjunction with the high performance computing system. The equivalent methodology was applied in a more complicated model in this study.
The multi-element wing in close ground proximity has been extensively researched in experimental and numerical studies due to its significant performance advantage. However, few comparative studies have been conducted to anticipate the aerodynamic and structural performance of the wing concerning the aeroelastic characteristics. Furthermore, limitations of the FSI modelling approaches have been found in previous studies [24,25,26,36], such as that the additional resources required to develop an code for specific problems which may take a substantial amount of time. Focus should also be placed on integration of the separate code into the existing coupling process between CFD and FEA and stability of the correlation of fluid and structural algorithms. The aim of this work was to implement a two-way coupled FSI approach using commercial CFD and FEA solutions to examine the effect of aeroelastic behaviour of a double-element wing operating in close ground proximity on the wing’s aerodynamic performance. This would be of great help for engineers to reduce computational resources for solving sophisticated the aero-structural problem as well as increasing accessibility to the software usage. In order to enhance credibility of the solution and to minimise uncertainty, a grid sensitivity study was performed, followed by a turbulence model study. Numerical results are presented in terms of surface pressure distribution, aerodynamic forces, and wake profile. In the next section, a modified two-way coupling method is presented that couples the aerodynamic and structural behaviour of a simplified double-element composite front wing of an F1 vehicle in the context of high performance computing (HPC) using the ANSYS software package.

2. Methodology

2.1. Numerical Modelling of Two-Way Coupling Fluid–Structure Interaction (FSI) Framework

The mutual contact between a deformable structure and an interior or surrounding fluid flow is defined as fluid-structure interaction (FSI) [38]. The choice of appropriate governing equations of the continuum, which determines the relationship between the deforming structure and the fluid domain, as well as the ability of numerical method to deal with large distortions, is a critical consideration when developing a numerical simulation algorithm [39]. Solutions for these multi-physics issues may be divided into two categories: monolithic and partitioned approaches. The monolithic approach containing governing equations for the fluid and structure dynamics within a single mathematical framework is solved simultaneously with a solitary solver [40,41]. This method can improve accuracy for interdisciplinary issues, but developing a code for a specific mix of such problems may require considerable resources. The partitioned method, on the other hand, solves the governing equations of fluid and structural dynamics independently with two distinct solvers [42]. By combining previously accessible codes or numerical methods that have been proven and utilised for complicated FSI issues, this methodology can reduce time for code development. However, in order to achieve coupling method stability, the focus should be on correlating the fluid and structural algorithms. The wing is considered as a tube type structure in the structural model, and our scope is to investigate the final shape of the wing affected by the fluid flow field [37]. Therefore, the effect of the structural damping is neglected as a modelling assumption. Equation (1) is a general form of the governing equation to represent the coupling phenomenon assuming that the structural damping matrix C is not considered [39] as
[ M s 0 ρ 0 R T M f ] { U ¨ P ¨ } + [ K s R 0 K f ] { U P } = { F S F f } ,
where M s and K s are the structural mass matrix and structural stiffness matrix and U , U ¨ ,   F s are the nodal displacement, the second derivative of nodal displacement, and the structural load vector, respectively. M f and K f are the fluid mass matric and the fluid stiffness matrix, and P , F f , P ¨ are the nodal pressure, the second derivative nodal pressure, and the fluid load vector, respectively. R is a coupling matrix of the fluid-structure interaction interface.
While the fluid puts pressure loads on the structure, causing it to deform, the fluid geometric domain is updated to account for the structural deformations. The information acquired from each numerical technique is communicated at the fluid-structure interface, which is reliant on one-way or two-way coupling mechanisms as illustrated in Figure 1 in the partitioned approach. The computed fluid forces from the CFD analysis are transmitted to the structure analysis as the boundary condition in one-way coupling, and the structure side is calculated until convergence is obtained, as illustrated in Figure 1a.
In the two-way coupling technique, on the other hand, the fluid field is solved using CFD until the convergence requirements are fulfilled. The CFD-derived aerodynamic pressures on the wing are then transferred to the FEA model as load boundary conditions. The structural reactions of the wing, such as deformation and stress distributions exposed to aerodynamic loads are then calculated using FEA, and the results are interpolated to the fluid mesh appropriately. These processes are continued until the changes in the flow forces and structural displacements fall below a predetermined threshold of tolerance, as shown in Figure 1b. In order to solve this complicated and repetitive process, it is vital to connect the solution process with a high performance computing (HPC) system. The FSI methodology framework used in this study is based on the existing analysis modules, fluent and mechanical, provided by ANSYS software, and with the support of ANSYS we developed a separate code file to connect the FSI modelling with a Linux-based cluster HPC system used at Cranfield University, which enables the coupled process between CFD and FEA techniques to be resolved more efficiently with the support of powerful computation.

2.2. Geometry and Mesh Generation

The double-element inverted wing used in the study was extracted from Zerihan’s experiment [43], which is composed of the single-element wing as the main element and the single flap. The total chord length from leading edge of the main element to the trailing edge of the flap is 380.0 mm, and the aspect ratio of the wing is 2.89. The generic rectangular endplate based on the racing car wing was used with dimensions of 400   mm × 170   mm × 4   mm . Detailed dimensions of the wing are described in Table 1, and the schematic configuration of the wing is depicted in Figure 2a. The variation of the ride height was also considered in the study of the double-element wing with a range of h/c = 0.079 to h/c = 0.592. With the reference incident of 1° of the main elements, the angle of attack of the double-element wing is 14.1°. To save computational resources, half of the wing model was used for this study. As shown in Figure 2b, the computational grid around the wing was produced using ICEM CFD. At varying ride heights, a multiblock hybrid mesh with both structured and unstructured grids was constructed, with the relative grid topology and structure preserved. Prism layers were used to properly capture the boundary layer of the wing and the ground, and an unstructured tetrahedral mesh was used to construct the rest of the domain. On regions of interest, refinement function was applied. An extra structural fine density box was positioned right behind the trailing edge of the wing for precise study of the wake profile. Within the boundary layer blocks of the wing and the ground, the first height cell was computed and set to y+ ≈ 1.
The wing model was meshed using surface elements in ANSYS Mechanical for structural analysis. The grid convergence study as a means of verification was performed only for the fluid mesh. The structural analysis consisted of a smaller number of grid cells in comparison with that of the fluid analysis. After the mesh sensitivity study was thoroughly conducted, it was concluded that the resultant wing performance is not significantly attributed to increase in the number of grid cells on the structural side [37]. The reason for not presenting a validation of the structural model is that there are no experimental data available for this particular problem in the literature. In the present work, we provide reference numerical data for the investigated coupled system which can be used for validation purposes of other numerical methods.

2.3. Numerical Setup

2.3.1. The Incompressible Fluid Model Due to the Low Mach Number Flow

Computational fluid analysis was carried out using Reynolds averaged Navier–Stokes (RANS) equations in conjunction with a high performance computing system including a Linux-based cluster. ANSYS Fluent was utilised to set up all cases in a three-dimensional segregated steady-state configuration. Due to the low Mach number of 0.09, the effect of compressibility can be neglected. Therefore, the numerical solution of the incompressible Navier-Stokes equations was determined in the fluid model. For all simulations, when second-order precision is required, the upwind discretisation scheme is employed. The coupled pressure-velocity coupling algorithm was used, which is suitable for coupling applications such as structural analysis. Six turbulence models were examined, each with its own set of wall treatments and variations: the one-equation Spalart–Allmaras model [44], the standard k-ε model [45], the standard k-ω model [46], the k-ω SST model [47], the k-ε RNG model [48], and the Realizable k-ε model [49]. Enhanced wall treatments were applied to all k-ε model variants.
The boundary conditions were created to duplicate the experiment arrangement, as illustrated in Figure 3. A velocity inlet boundary condition with 30 m/s uniformly distributed freestream in positive streamwise direction and appropriate turbulent viscosity ratios were used depending on the turbulence models. The upstream boundary was positioned 5c upstream from the leading edge. The downstream boundary placed 15c downstream from the trailing edge was modelled using a pressure outlet boundary condition with gauge pressure of 0 Pa. A solid wall with no-slip condition was used to simulate the wing and the ground. In order to depict moving ground effect, the ground had a tangential velocity equal to the freestream with the estimated boundary layer thickness of 0.025 m. The remainder of the boundary conditions were modelled as a symmetry condition to impose zero crossflow condition and to remove the requirement of additional boundary layer resolution.
Based on recommendations suggested by ANSYS [50], the smoothing method in the dynamic mesh function was used in order to update the fluid mesh according to the structural analysis results and to provide better quality mesh. The wing was configured as an interaction surface between the fluid and structural analysis where resultant data from each module are bidirectionally transferred. The physical time scale of the simulated process was approximately one second, which is a very short period of time. Furthermore, the main focus of the research was to investigate the fluid flow field and to quantify the wing’s aerodynamic performance in conjunction with the wing deflection where fluid flow is considered as steady-state in our simulations due to the short physical time of the wing deflection.

2.3.2. Structural Model

Due to the lack of detailed information in the public domain about the structural configuration of the wing, the upper and lower surfaces of the wing were created as a general form of composite structure with a number of composite material layers in ANSYS Composite PrepPost (ACP) considering the manufacturing limitation. The steady-state structural analysis was carried out in ANSYS Mechanical, and the wing model was discretised by quad-dominate shell elements including hexahedral elements for better mathematical representation of the physical model based on the finite element analysis technique. The composite materials used in this research were orthotropic carbon fibre-reinforced thermoplastics, which are commonly used in the motorsport industry, provided by ANSYS Engineering Data Library. The detailed material properties are presented in Table 2.

3. Results

3.1. Grid Sensitivity Study

In this section, the grid sensitivity study of the double-element composite wing with the FSI modelling is carried out to provide information on the validity of the aero-structural two-way coupling computational model and the independence of the discretisation from the grid resolution. An investigation into the grid convergence index (GCI) was conducted as recommended by Roache [51,52]. Three grids were constructed: A coarse mesh with 1.3 M grid points, a medium mesh with 3.1 M cells, and a fine mesh of 6.3 M grid points. Each numerical solution was completely converged with respect to iterations, and the drag coefficient was obtained from the solutions. According to the procedure given by Roache, in order to obtain the grid convergence index for the flow field, the effective grid refinement ratio, r e f f e c i v e ,   and the order of grid convergence, p , should be calculated using the total number of grid points (N) and dimension of the fluid domain— r e f f e c i v e , 12 for between coarse and medium grids and r e f f e c i v e , 23 for between medium and fine grids. The final grid convergence ratio was obtained as shown in Table 3 in relation to the GCI values for the coarse-medium grid and the medium–fine grid determined. Because the GCI ratio is 1.001, which is close to one, the asymptotic region of convergence was effectively achieved.
Followed by the grid convergence study suggested by Roache, the impact of grid resolution on computational outcomes is also explored by presenting the surface pressure distribution and the wake profile as shown in Figure 4. The turbulence model was built using the Spalart–Allmaras model with all three instances, and the three grids indicated in Table 3 were employed in this investigation. The surface pressure distribution at h/c = 0.211 presented in Figure 4a was obtained with the double-element composite wing at the reference incidence, and Zerihan’s experimental work is also presented for comparison [53]. Little variation of the pressure distribution is observed over different grid resolution. In addition, Figure 4b shows the wake flow field for three different grid resolutions at x/c = 1.066 at the same ride height in comparison with the experiment results obtained by Zerihan [53] using laser doppler anemometry (LDA) techniques. Between the results, the overall agreement of the velocity profile was effectively achieved for all three grids. However, the greatest velocity deficit from the main element as well as the horizontal position of the confluence point in the middle of two wakes are underpredicted by the coarse grid. Therefore, the medium grid resolution was selected for all simulations in this study, providing advantages of computational efficiency and ensuring the validity of the results.
For further analysis of the grid sensitivity study, a non-FSI simulation with a rigid double-element wing model was additionally conducted, and the associated results are presented in Figure 4. Due to the little discrepancy of the results obtained by between different grid resolutions of the FSI modelling, the finest grid was specifically selected for the non-FSI case. In Figure 4a, the resultant surface pressure distributions obtained by the non-FSI simulation show a similar shape to the experimental results. In comparison with the non-FSI data, the FSI results with a flexible wing generally present a comparable shape of the pressure distribution with approximately 4% difference of the suction peak pressure on the lower surface of the wing near the leading edge. As the lower surface of the wing, especially where the flow is constrained between the wing and ground, is sensitive to small perturbation, this discrepancy of the suction peak pressure could increase the possibility of change in the flow field characteristics and may influence the wing aerodynamics. In addition, Figure 4b depicts the associated results of the wake survey obtained from the non-FSI simulation with the rigid wing. The rigid wing simulation manages to capture the general tendency of the velocity profile in comparison with the experiment and the FSI cases apart from showing that the maximum error of the velocity deficit at the confluence point is roughly 9%. In the development of aircraft, there have been extensive studies on improvement of aerodynamic efficiency in order to increase the payload and reduce fuel consumption, which are sensitive to marginal changes in the aerodynamic performance [54,55,56]. Similarly, the ultimate goal of the F1 cars is to reduce the total time of a lap. Due to the sensitive operation conditions such as close ground proximity, a marginal difference of the aerodynamic performance caused by the ride height change would have an impact on the final lap time [57]. Thus, investigation of the aeroelastic behaviour of a double-element composite wing using the FSI modelling discussed in this research work is crucial to enhance accuracy of the wing performance associated with the complex fluid flow field.

3.2. Turbulence Model Study

This section outlines a numerical study on the suitability of various turbulence models for the aero-structural phenomenon using the double-element composite FSI wing model in terms of the incompressible fluid flow features near the surface and far from the trailing edge. Six turbulence models were quantitatively assessed at two particular ride height cases selected for clarification: h/c = 0.211 for a flow condition within the force enhancement region [9] and h/c = 0.079 near the maximum downforce with distinctive wake characteristics of the main element and flap. In this study, the main element wake is considered as the lower wake and the flap wake as the upper wake according to their location.
The surface pressure distributions on both the main element and flap are accurately captured by all turbulence models as shown in Figure 5a. Followed by the stagnation pressures close to the leading edge, C P s t a g , correctly captured, the suction peak representing the maximum downforce and fastest flow is also accurately predicted by all turbulence models. The details of quantitative data of the surface pressure distribution are presented in Table 4 in comparison with the experiment and numerical aerofoil result.
Figure 5b presents the velocity profile of the wake obtained by all turbulence models, which includes the LDA experimental results extracted from research carried out by Zhang and Zerihan [9]. Most turbulence models properly anticipate the wake below the lower wake; the vertical position of the lower wake’s lower limit was underpredicted by Standard k-ε. The velocity profile representing the resultant ground boundary layer is well captured by all computational models, and the Spalart–Allmaras model shows improvement in terms of the ground boundary layer. The discrepancy observed in the wake boundaries has a consequent influence on a variation within calculation of the upper ( ( δ 99 / c ) t o p ) and lower ( ( δ 99 / c ) l o w ) wake thickness. Table 5 shows the quantitative information of the wake profile obtained by each turbulence model at x/c = 1.066.
Figure 5c,d present the surface pressure distribution and the wake profile at x/c = 1.066, respectively, at lower ride height of h/c = 0.079. In a similar way to the higher ride height case, little variation of the surface pressure over the main element and flap obtained by the turbulence models is shown including the increased magnitude of the suction surface loading. The actual test results of the wake profile are not available at h/c = 0.079. According to the analysis, the best prediction of the quantitative feature of various turbulence models is achieved by the Spalart–Allmaras model, which was selected in this study. Note that the legends belong to different quantities in Figure 4 and Figure 5.

3.3. FSI Analysis

3.3.1. Chordwise Surface Pressure

The influence of aeroelastic behaviour of the double-element composite wing in ground effect is discussed with height variation in comparison with the experimental results. The impact of ground proximity on the surface pressure distribution of a two-element composite wing is examined and compared to experiment observations [53] shown in Figure 6. The overall shape of the surface pressures on both elements at all heights are accurately calculated. The leading-edge stagnation pressures are well captured for the main element and the flap. The pressures on the pressure surfaces of both the main element and flap are correctly predicted, remaining relatively independent of the ride height, whereas a significant increase in pressures on the suction surfaces with increase in ground proximity is observed. Figure 6b shows the surface pressure result at lower ride heights in comparison with the experiment. The increase in suction loading on the main element lower surface with increase in ground proximity is accurately captured. On the other hand, little change in suction loading on the lower surface of the flap is observed when the ground is approached.
Figure 7 shows the chordwise surface pressures at the wing centre and towards the wing tip, which are described at two heights for clarity and compared to experimental results [53]. Non-FSI modelling results at the wing tip at both ride heights are also included, and the aeroelastic effect is better represented at the wing tip area compared to the centre of the wing. Figure 7a presents the results of the surface pressure distribution at h/c = 0.395. From the centre to the tip, the suction on the bottom surface of the primary part is decreased. The spike on the leading edge has the most suction over the main part in the centre, whereas for the tip, the spike is not as sharp, and the suction peak at x/c = 0.1 is greater. The pressures on the upper surfaces of both the main element and flap are reduced from the centre to the tip. The non-FSI case with the rigid wing at the wing tip appears to follow the similar trend of the pressure distribution to the experimental result. It was observed that the aeroelastic composite wing produces less suction on the main element, but marginally more suction on the flap near the wing tip in comparison with the experimental data and non-FSI data. Figure 7b shows the surface pressure distribution at h/c = 0.105. The load on the main element suction surface is significantly reduced towards the wing tip, and the reduction is greater than at higher heights. From the centre to the tip, the pressure on the upper surfaces of both the main element and the flap is slightly reduced. Near the wing tip, the non-FSI simulation generally shows a good agreement with the experimental chordwise pressure distribution. It was found that with the FSI modelling, the suction peak on the lower surface of the main element is reduced and consequently alleviates the pressure recovery demand. The flap produces more suction load with the elastic wing, generating an additional favourable pressure gradient which might result from the wing flexibility. The velocity contours at the wing centre and tip at different heights are visualised in Figure 8. As discussed above, the accelerated flow underneath the main element is presented with the ground height decreased as shown in Figure 8a,c. It is depicted that the flow speed on the bottom surface of the main element was found to be slowed from the centre to the tip as shown in Figure 8a,b. In addition, the reduction in flow speed is greater at lower ride height, and Figure 8d illustrates a region of low velocity downstream underneath the trailing edge of the flap.
The double-element wing exerts extra stresses on the top and bottom surfaces of both the main element and the flap when compared to a single-element wing, the latter of which is relatively unaffected by the ride height variation. The main element suction surface generates more significant suction loading and the pressure recovery towards the trailing edge is less demanding. According to Smith [59], the existence of the second element, the flap, induces a larger portion of circulation on the main element, referring to as the circulation effect which is beneficial to increasing the wing performance with multiple elements. This effect may be seen in the surface pressures in the centre of the rigid wing, which shows an increase in suction pressure as the ride height decreases.
With the aeroelastic-modelled wing, the surface pressure distributions at various ride heights demonstrate the different pressure characteristics at the wing centre and tip. The suction loading on the main element lower surface reduces from the centre to the tip due to the reduced effective angle of attack caused by the wing tip vortex upwash. In comparison with the suction on the main element of the rigid wing cases near the wing tip at both ground heights, the aeroelastic effect derived by the composite elements causes the wing to be tilted backwards, resulting in less suction pressure and stabilising the pressure recovery. On the flap, the FSI modelled-composite wing marginally increases the suction pressure near the wing tip compared to the rigid wing. As the flap is deflected by the aerodynamic loading, the angle of attack is reduced producing a more favourable pressure gradient at the first part by moving the centre of pressure rearwards, which might help to decrease the drag. Simultaneously, additional suction may be generated by stronger interaction with the main element vortices underneath.

3.3.2. Spanwise Surface Pressure

In addition to the chordwise pressure distribution analysis, the spanwise surface pressures are numerically calculated at the quarter-chord positions on both the main element and flap and compared with the experimental results [53]. The estimated spanwise surface pressure distribution on the main element at various ride heights is depicted in Figure 9, presenting η, non-dimensionalised span from wing tip, on the x axis and pressure coefficient on the y axis. For the large heights shown in Figure 9a, it can be seen that the suction loading on the primary element suction surface increases with the decrease in distance between the wing and the ground, which shows a higher rate at the wing centre. However, similar to the chordwise pressures, the pressures on the upper surfaces remain independent of a change in the height. Figure 9b shows the same results for the smaller heights. As the height is lowered, the loading on the suction surface increases at a higher rate than that at higher heights, with minimal change in pressures on the pressure surfaces.
Figure 10 shows the spanwise pressure distribution on the flap in ground proximity. For the large heights shown in Figure 10a, a consistent increase in suction loading is observed on the lower surface of the flap near the tip outside of around η = 0.04 . The flow on pressure surfaces stays constant throughout the span when the wing height is changed. It can be seen that the gradient of suction pressures near the tip increases compared to the wing centre part, for example, at h/c = 0.211 C p   1.12 near the inboard part of the wing, whereas C p   1.89 near the tip. Figure 10b shows the same results at smaller heights. At this height, the suction at the central portion reduces with the increase in ground proximity. Furthermore, the suction surface loading near the tip reduces to a greater extent.
Following the analysis of the computational spanwise surface pressure distributions in ground proximity over the main element and flap, Figure 11 shows the numerical FSI findings at various heights in contrast to the experimental data; h/c = 0.395, 0.211, and 0.105. The spanwise pressures on the main element are shown in Figure 11a. The general trend of the suction increase on the suction surface with the decrease in ride height is accurately captured. However, it can be noticed that the magnitude of suction loading on the lower surface is underpredicted across the span compared to the experiment, and the discrepancy becomes greater towards the central portion of the wing—at h/c = 0.395, C p   2.22 for the numerical result compared to C p   2.64 for the experiment. The surface pressures on the upper surfaces are correctly predicted, remaining independent of changes in ride height. Figure 11b shows the flap with the same effects. Similarly, the estimated spanwise surface pressures on the suction surfaces accurately depict the rise in suction as the wing approaches; however, as with the main element scenario, less suction is created along the span for all heights. Again, the pressure across the pressure surfaces is precisely computed, revealing that there is minimal change as the ground height decreases.
Figure 12 illustrates the maximum deflection and the twist angle of the wing throughout a range of ride heights, which occur at the trailing edge of the flap. The overall trend of the deflection increase is achieved when the ground proximity is increased as shown in Figure 12a. With the decrease in ride height up to h/c = 0.158, the gradual increase in deflection is observed, reaching the corresponding value of 1.05 mm. For further reduction in the height, little variation is shown with the maximum value of 1.09 mm at h/c = 0.105. The boundary condition of the flow speed used in our investigations corresponds to the experimental conditions of the reference data. The maximum twist angle of the wing flap is also presented in Figure 12b. The variation of both deflection and twist angle computed in this research is marginal due to the low velocity inlet boundary condition and small wing aspect ratio. However, such variation analysed in this study indicates that the centre of pressure position is shifted downstream due to the incidence reduction induced by the aeroelastic effect, resulting in the pressure difference and ultimately aerodynamic performance change. The velocity streamline along with the surface pressure coefficient at various ride heights are visualised in Figure 13. As discussed above, as the wing is lowered, the flow speed under the main element near the centre increases as shown, decreasing the pressure coefficient. On the other hand, it is shown that at lower height in Figure 13c the flow near the end plate is slowed down resulting from the vortical flow generated from the main element lower surface edge.
The flow on the main element and the flap exhibits unique three-dimensional properties for a range of ride heights as the ground is approached, as indicated in the spanwise pressures. As shown in Figure 9, when height is reduced, the suction pressure on the main element increases across the span due to enhancement of the ground effect, whereas the pressures on the upper surface remain constant. A similar feature can be found at higher heights across the span on the flap. However, at small heights the suction pressure is reduced with the decrease in the height. As briefly mentioned previously, the suction loading on the flap has a strong relationship with the vortex generated. For the low ride height, the vortex is likely to break down or even burst, caused by the unfavourable pressure gradient. When this happens, the axial velocity of the vortex suddenly drops, resulting in reduction in the vortex strength and induced velocities. Therefore, the suction on the flap is reduced due to the weak and diffused vortex, and the influence of the vortex becomes stronger with lower heights. The FSI simulations compared to the experiment show less suction pressure on the lower surfaces of both the main element and flap, resulting from decreasing the effective incidence. The wing is constructed with the composite material which includes the elastic characteristics. When the aerodynamic loading is applied to the main element or flap, the wing is tilted backwards, resembling a wash-in effect.

3.3.3. Aerodynamic Forces

Figure 14 shows the predicted aerodynamic forces created by the double-element composite wing in close proximity to the ground. The experimental forces measured by integration of the surface pressures are provided together as a reference [9]. The overall characteristics of downforce with variation of ride heights shown in Figure 14a are correctly calculated. As the height is lowered, the computational downforce grows until it reaches its maximum value, followed by a sudden drop of downforce further down. However, compared to the experimental results showing that the peak occurs at a height of h/c = 0.066, corresponding to C L = 2.579 , the maximum value obtained by the FSI simulation is reached at a higher height of h/c = 0.079 with lower downforce corresponding to C L = 2.499 . In addition, the downforce reduction below the peak height happens to a greater extent with the elastic composite wing. Figure 14b shows the variation of drag coefficient with various ride heights in comparison with the experiment. The overall trend of drag increase with increasing ground proximity is accurately predicted with a smooth and gradual gradient. However, with the numerical solution including the aeroelastic effect, a greater amount of drag coefficient is obtained at all ride heights, and lower gradient at low heights is observed.
As the wing including the main element is deflected under the aerodynamic loading, the distance between the lowest point of the wing and the ground is temporarily reduced compared to the geometrical position. The flow field very close to the ground may be sensitive to even a small perturbation. Consequently, as the wing is deflected at low height due to its structural characteristics under aerodynamic loading conditions, the maximum downforce can be achieved at the higher height than the experiment. The shortened distance from the ground may cause a strong adverse pressure gradient to be brought forward in a streamwise direction resulting in early vortex breakdown or burst. This effect could impede the vortex generation and build up. For the aerodynamic analysis of the double-element aerofoil, Mahon [58] mentioned that the drag is mainly generated by the flap, and the majority of it is attributed to the wake-induced drag. With the three-dimensional wing used in this study, the drag can also result from the induced drag which is a by-product of the wing tip vortices. Stronger wing tip vortices induced by enhanced flow entrainment at the lower ride height as a result of the wing deflection are created, and consequently more induced drag is generated.

3.3.4. Wake Flow Field

For further investigation into the flow field rising from the double-element composite wing, the wake survey was acquired at the x/c = 1.066 location in terms of various ride heights in the same way that the laser doppler anemometry (LDA) testing produced experimental findings [53]. The general feature of the wake profile with variation of the ride height is correctly captured in comparison with the experiment and does not represent distinct aeroelastic effect as those results were tested at the centre of the wing.
The wake profile with different ride heights at x/c = 1.066 and its streamwise position are illustrated at Figure 15, and detailed information is listed in Table 6. For the sake of clarity, three ride heights were selected. The general trend between the experiment and numerical results is in agreement with a few exceptions. First, the boundary layer thickness growth close to the ground was captured; however, underprediction of the minimum velocity within the ground boundary layer was observed. A region of accelerated flow between the wing and the ground and associated velocities was accurately calculated for all heights, but lower boundary of the lower wake was underpredicted for h/c = 0.395 and 0.105. In addition, the increase in the jetted flow with the decrease in height can be clearly observed. The lower wake boundary was underpredicted for all heights. As a result, the wake thickness increased with the increase in ground proximity due to the change in vertical position of the wake boundary. The gradient of velocity recovery was correctly captured. The velocity deficit within the lower wake was accurately captured except for the height of h/c = 0.105, which provides overprediction of minimum velocity compared to the experiment.
The analysis of the wake flow field at the centre of the double-element composite wing was numerically carried out and compared with the LDA testing results. As the wing is approached, the wake thickens and the velocity deficit within the wake increases which mainly resulted from influence of the main element. Mahon [10] concluded that a region of recirculation created behind the trailing edge of the primary element is greatly attributed to the lower wake, and a shape of the trailing edge of the main element could impact the main element wake and further aerodynamic performance. On the other hand, the surface pressures can be used to account for this phenomenon. As discussed earlier, the suction surface pressure of the main element considerably changes, and when the height is reduced, the pressure recovery increases. However, there is little perturbation of pressure found on the surface of the flap concerning variation of ride height, which means that the flap is less sensitive to ground proximity due to distance from the ground. Consequently, decreasing the wing height causes the adverse pressure gradient on the main element to increase, which can result in flow separation and increasing the wake. In comparison with the LDA testing results, the computational wake profile shows a generally similar overall feature but not distinctive as it is taken at the centre of the wing where the aeroelastic characteristics are less effective.

4. Conclusions

In the present work, a modified two-way coupling method was employed for the purpose of investigation into the fluid flow field around the composite-material multi-element wing to assess the aerodynamic performance of the wing induced by the aeroelastic effect. Our computational approach focused on a novel coupling of the aerodynamic and structural behaviour of the double-element composite front wing of an F1 vehicle in the context of high performance computing (HPC) to simulate a steady-state fluid-structure interaction (FSI) configuration using the ANSYS software package. The objective of these investigations was to understand the suitability of computational techniques for FSI modelling and to quantify the influence of aeroelastic behaviour of the composite wing on the aerodynamic performance in ground effect.
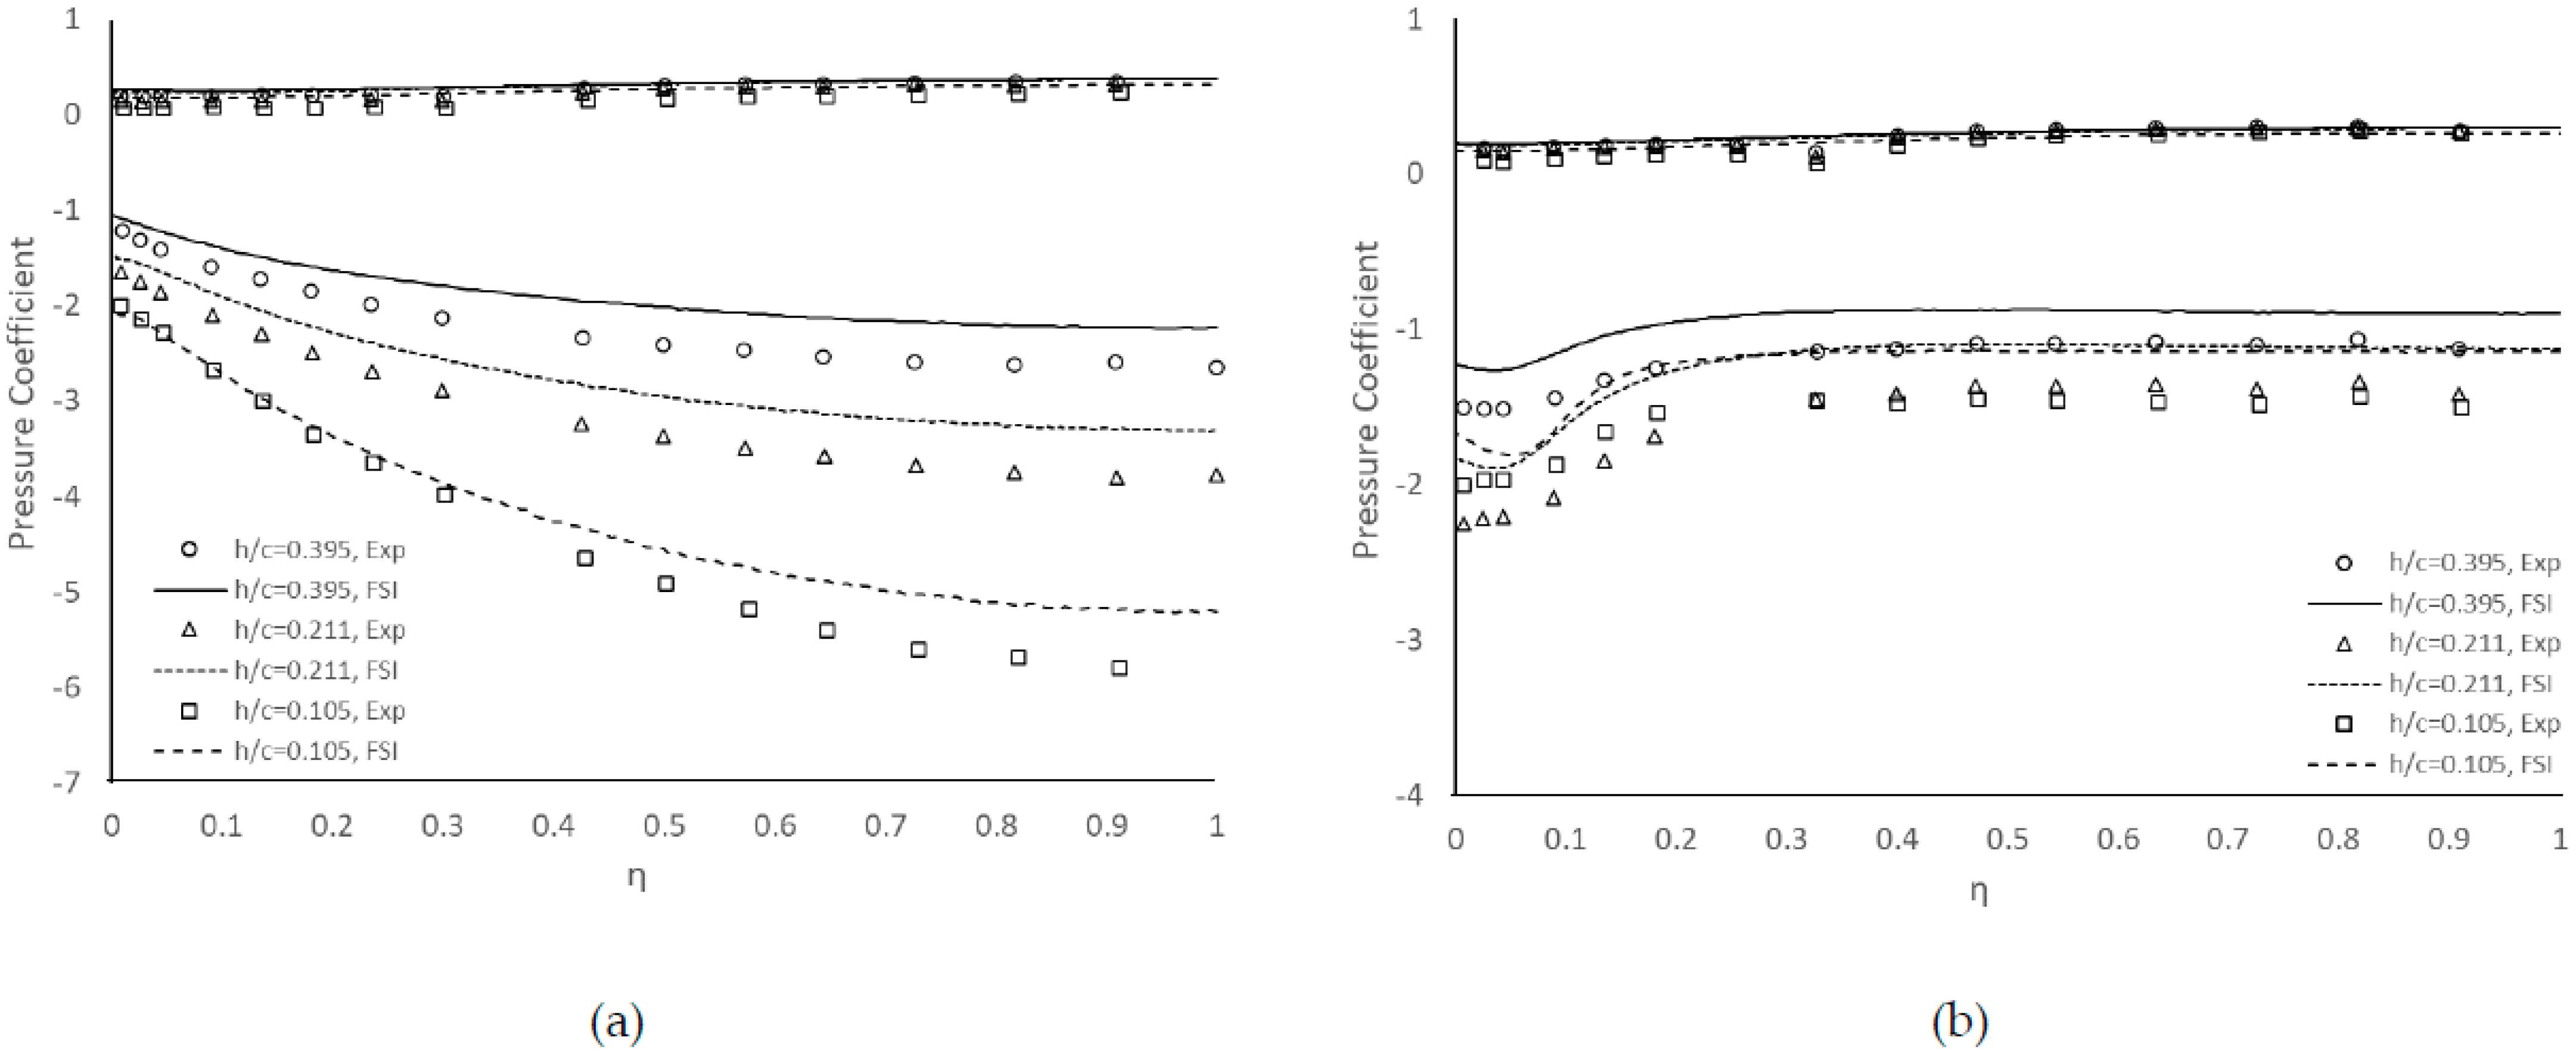
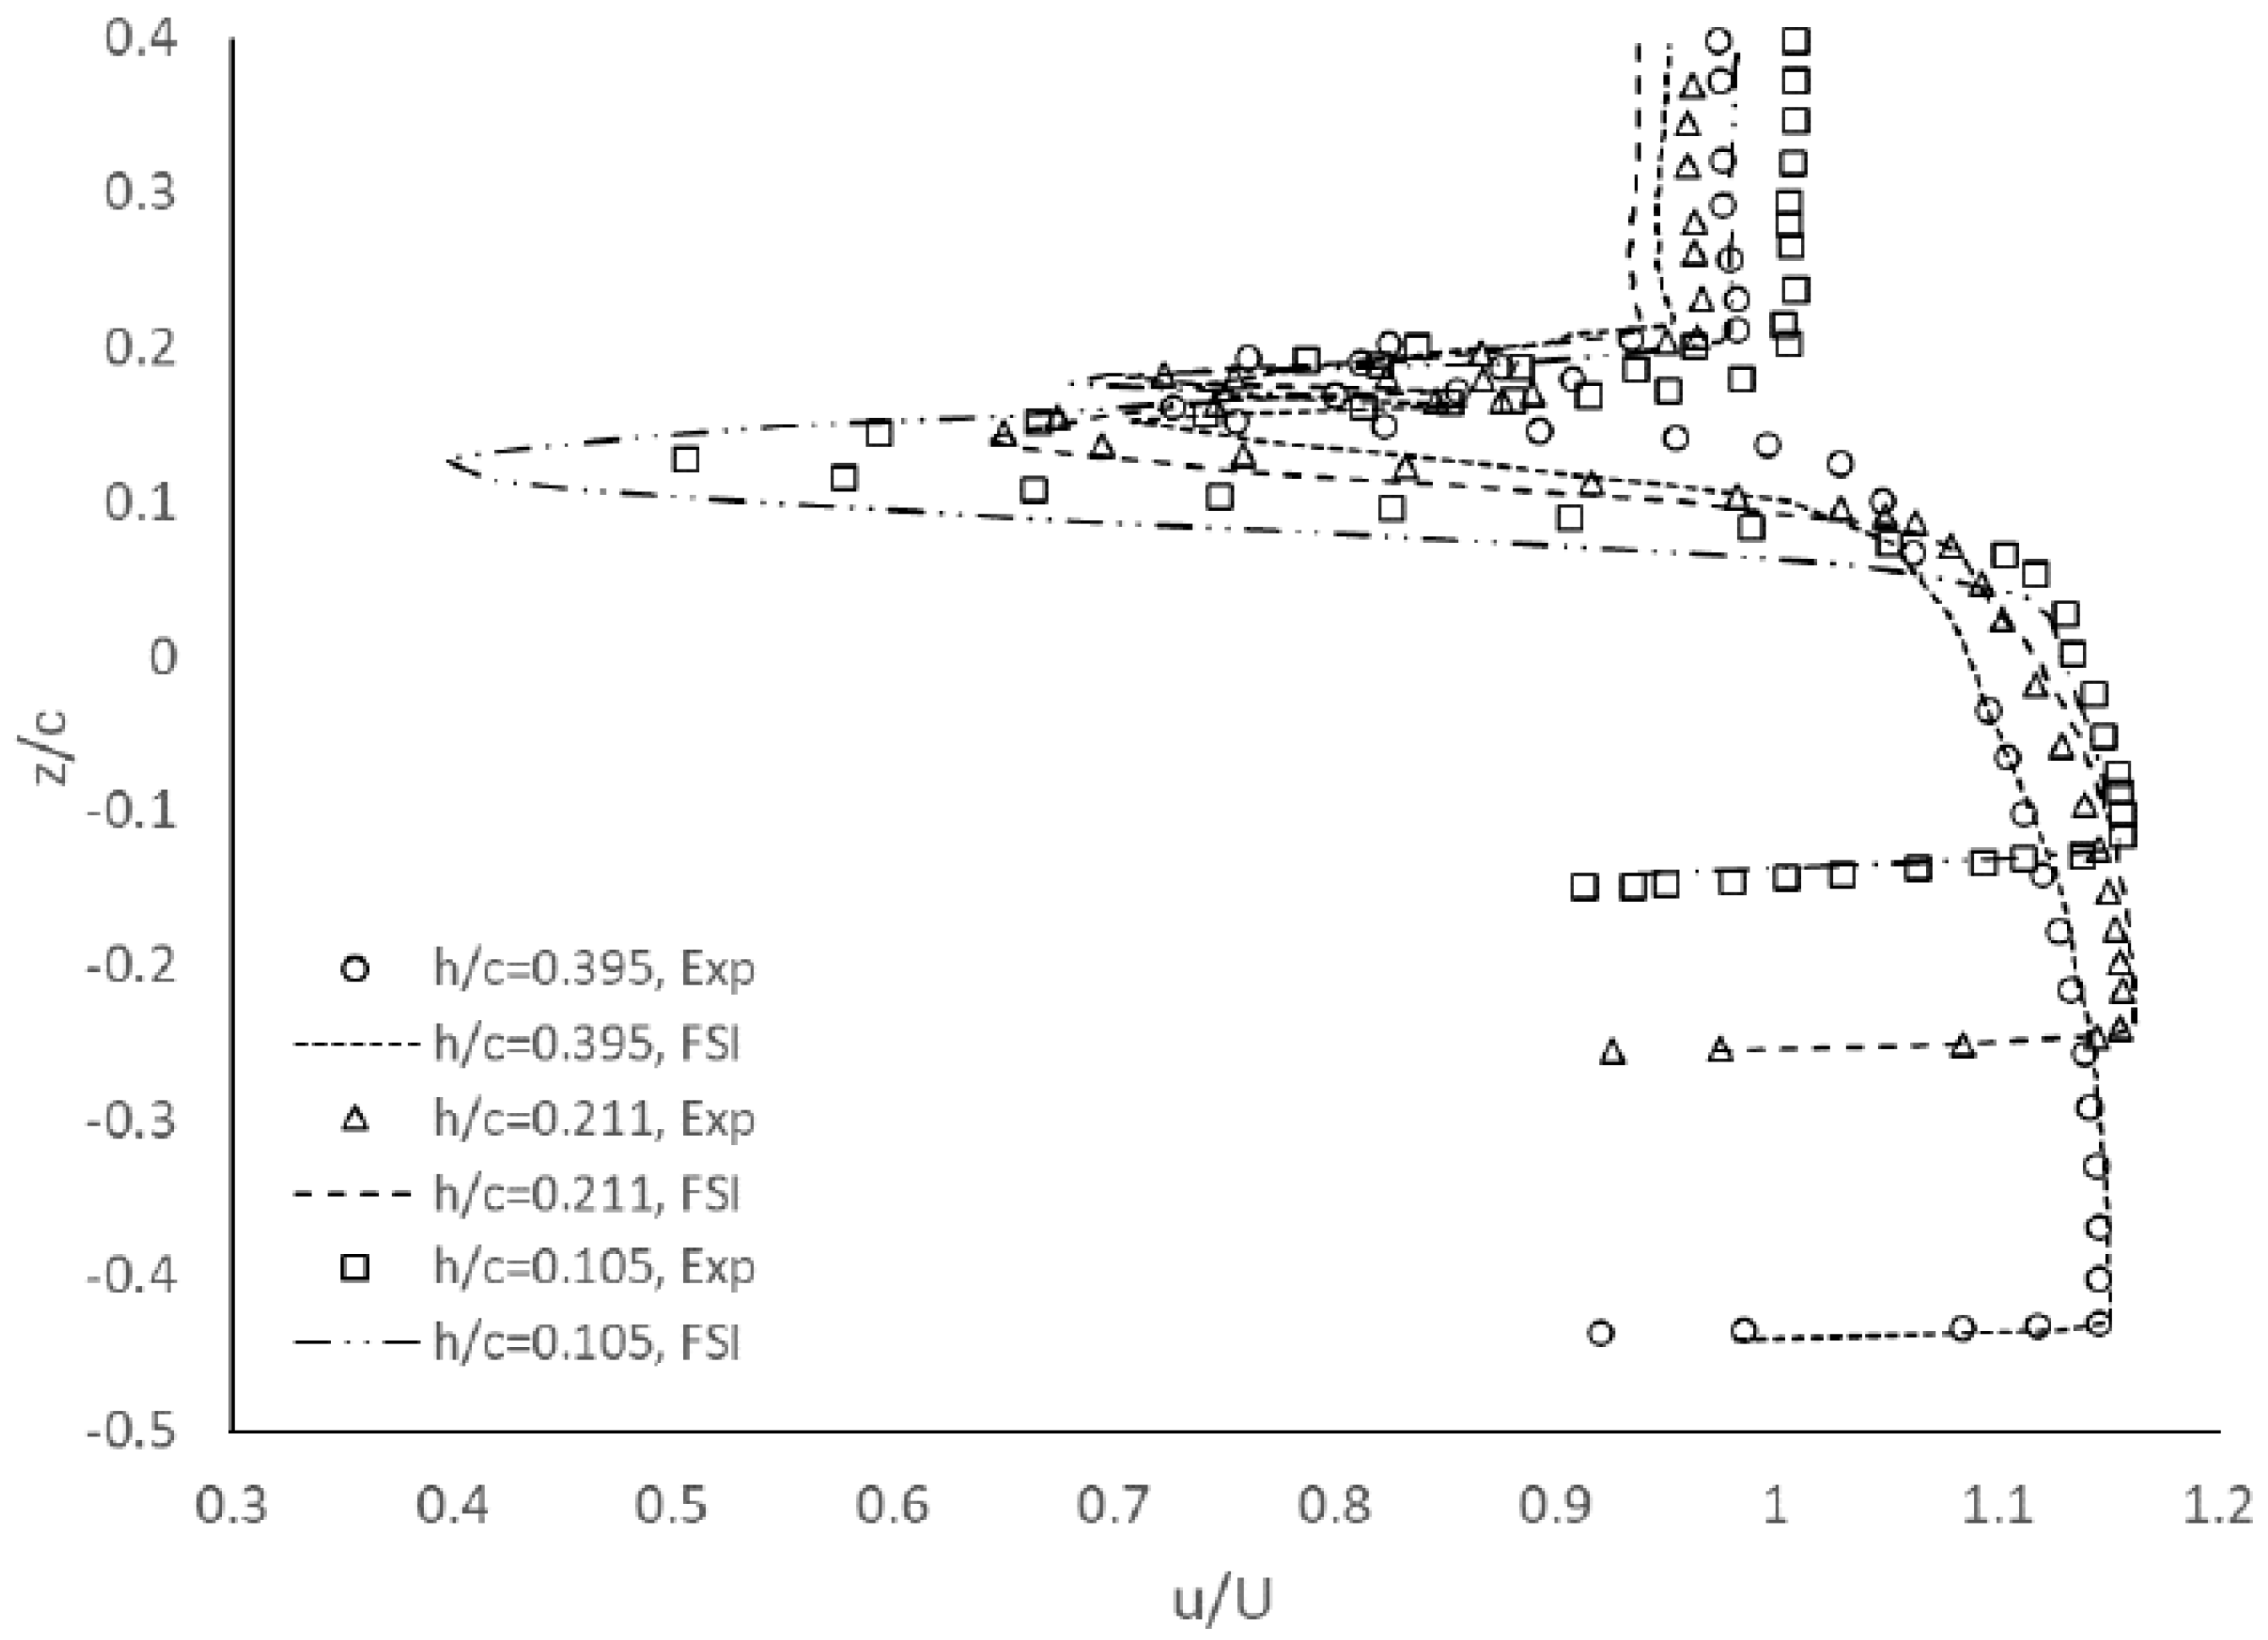
It was found that when the wing approaches the ground, substantial suction loading is created on the bottom surface of the main element, whereas the pressure around the flap remains relatively unaffected by the ride height variation as it is far above the ground. For the spanwise pressure around the wing due to the aeroelastic effect, a smaller amount of the suction pressure is obtained through simulations on both main elements and the flap across the span compared to experimental data. The largest numerically predicted downforce occurs at a higher ride height, followed by a larger drop in downforce at the lowest height as shown in comparison with experimental data. The FSI simulation generates additional drag compared to the experiments by a broadly constant value across the ride heights. As the height of the primary element is lowered, the velocity deficit inside the wakes grows, owing to an increase in the unfavourable pressure gradient underneath it.
It is important to note that the practical contribution of our investigation was to quantify the coupled effect on the aerodynamic and structural performance of the wing because the quantification of these physical processes is in the mainstream research focus. Overall, we focused on the development of an accurate FSI numerical modelling framework in conjunction with computational fluid dynamics (CFD) techniques and structural finite element analysis (FEA) for an F1 application. In future work, a more realistic F1 front wing could be investigated through computational methods in addition to wind tunnel testing of the ground effect to improve the applicability of current models.

Author Contributions

Conceptualization, C.S.B. and Z.A.R.; methodology, C.S.B.; software, C.S.B.; validation, C.S.B. and Z.A.R.; formal analysis, C.S.B.; investigation, C.S.B.; writing—original draft preparation, C.S.B.; writing—review and editing, L.K.; visualization, C.S.B.; supervision, L.K. and V.M.R.; project administration, C.T. All authors have read and agreed to the published version of the manuscript.

Funding

This research received no external funding.

Institutional Review Board Statement

Not applicable.

Informed Consent Statement

Not applicable.

Data Availability Statement

Not applicable.

Acknowledgments

The numerical solution was performed with the help of the Cranfield High Performance Computing (HPC) facility. We acknowledge the technical support from the Cranfield HPC team during the research.

Conflicts of Interest

The authors declare no conflict of interest.

References

  1. Agathangelou, B.; Gascoyne, M. Aerodynamic Design Considerations of a Formula 1 Racing Car; SAE International: Warrendale, PA, USA, 1998. [Google Scholar] [CrossRef]
  2. Somerfield, M. Available online: https://www.motorsport.com/f1/news/analysis-is-f1-set-for-another-flexi-wing-war-777139/777139/ (accessed on 16 June 2016).
  3. Katz, J. Calculation of the Aerodynamic Forces on Automotive Lifting Surfaces. ASME J. Fluids Eng. 1985, 107, 438–443. [Google Scholar] [CrossRef]
  4. Ranzenbach, R.; Barlow, J. Cambered Airfoil in Ground Effect—An Experimental and Computational Study; SAE International: Warrendale, PA, USA, 1996. [Google Scholar] [CrossRef]
  5. Knowles, K.; Donahue, D.; Finnis, M. A study of wings in ground effect. In Proceedings of the Loughborough University Conference on Vehicle Aerodynamics, Loughborough, UK, 18–19 July 1994; Volume 22, pp. 1–13. [Google Scholar]
  6. Zerihan, J.; Zhang, X. Aerodynamics of a single element wing in ground effect. AIAA J. 2000, 37, 1058–1064. [Google Scholar] [CrossRef]
  7. Ranzenbach, R.; Barlow, J.B.; Diaz, R.H. Multi-element airfoil in ground effect-an experimental and computational study. In Proceedings of the 15th Applied Aerodynamics Conference, Atlanta, GA, USA, 23–25 June 1997; p. 2238. [Google Scholar] [CrossRef]
  8. Jasinski, W.J.; Selig, M.S. Experimental study of open-wheel race-car front wings. SAE Trans. 1998, 2549–2557. [Google Scholar] [CrossRef] [Green Version]
  9. Zhang, X.; Zerihan, J. Aerodynamics of a double-element wing in ground effect. AIAA J. 2003, 41, 1007–1016. [Google Scholar] [CrossRef] [Green Version]
  10. Mahon, S. The Aerodynamics of Multi-Element Wings in Ground Effect. Ph.D. Thesis, University of Southampton, Southampton, UK, 2005. [Google Scholar]
  11. Van Den Berg, M.A.; Zhang, X. The aerodynamic interaction between an inverted wing and a rotating wheel. J. Fluids Eng. Trans. ASME 2009, 131, 101104. [Google Scholar] [CrossRef]
  12. Ranzenbach, R.; Barlow, J.B.; Diaz, R.H. Two-Dimensional Airfoil in Ground Effect, An Experimental and Computational Study; SAE International: Warrendale, PA, USA, 1994. [Google Scholar] [CrossRef]
  13. Mahon, S.; Zhang, X. Computational analysis of pressure and wake characteristics of an aerofoil in ground effect. J. Fluids Eng. Trans. ASME 2005, 127, 290–298. [Google Scholar] [CrossRef]
  14. Van Den Berg, M.A. Aerodynamic Interaction of an Inverted Wing with a Rotating Wheel. Ph.D. Thesis, University of Southampton, Southampton, UK, 2007. [Google Scholar]
  15. Heyder-Bruckner, J. The Aerodynamics of an Inverted Wing and a Rotating Wheel in Ground Effect. Ph.D. Thesis, University of Southampton, Southampton, UK, 2011. [Google Scholar]
  16. Arrondeau, B.; Rana, Z.A. Computational Aerodynamics Analysis of Non-Symmetric Multi-Element Wing in Ground Effect with Humpback Whale Flipper Tubercles. Fluids 2020, 5, 247. [Google Scholar] [CrossRef]
  17. Yurkovich, R. Status of unsteady aerodynamic prediction for flutter of high performance aircraft. J. Aircr. 2003, 40, 832–842. [Google Scholar] [CrossRef]
  18. Sangeetha, C. Fluid structure interaction on AGARD 445.6 wing at transonic speeds. J. Aircr. 2015, 2, 28–34. [Google Scholar]
  19. Chen, X. Numerical simulation of 3D wing flutter with fully coupled fluid structural interaction. J. Aircr. 2007, 36, 856–867. [Google Scholar]
  20. Zeng, Y.; Yao, Z.; Gao, J.; Hong, Y.; Wang, F.; Zhang, F. Numerical Investigation of Added Mass and Hydrodynamic Damping on a Blunt Trailing Edge Hydrofoil. J. Fluids Eng. 2019, 141, 081108. [Google Scholar] [CrossRef]
  21. Zeng, Y.; Yao, Z.; Zhang, S.; Wang, F.; Xiao, R. Influence of Tip Clearance On the Hydrodynamic Damping Characteristics of a Hydrofoil. J. Fluids Eng. 2021, 143, 061202. [Google Scholar] [CrossRef]
  22. Smith, S.M.; Venning, J.A.; Giosio, D.R.; Brandner, P.A.; Pearce, B.W.; Young, Y.L. Cloud Cavitation Behavior on a Hydrofoil Due to Fluid-Structure Interaction. J. Fluids Eng. 2019, 141, 041105. [Google Scholar] [CrossRef] [Green Version]
  23. Dinçer, A.E.; Demir, A.; Bozkuş, Z.; Tijsseling, A.S. Fully Coupled Smoothed Particle Hydrodynamics-Finite Element Method Approach for Fluid–Structure Interaction Problems With Large Deflections. J. Fluids Eng. 2019, 141, 081402. [Google Scholar] [CrossRef]
  24. Pedrol, E.; Massons, J.; Díaz, F.; Aguiló, M. Two-way coupling fluid-structure interaction (FSI) approach to inertial focusing dynamics under dean flow patterns in asymmetric serpentines. Fluids 2018, 3, 62. [Google Scholar] [CrossRef] [Green Version]
  25. Nonino, M.; Ballarin, F.; Rozza, G. A Monolithic and a Partitioned, Reduced Basis Method for Fluid–Structure Interaction Problems. Fluids 2021, 6, 229. [Google Scholar] [CrossRef]
  26. Lassila, T.; Quarteroni, A.; Rozza, G. A reduced basis model with parametric coupling for fluid-structure interaction problems. SIAM J. Sci. Comput. 2012, 34, A1187–A1213. [Google Scholar] [CrossRef] [Green Version]
  27. Kallekar, L.; Viswanath, C.; Anand, M. Effect of wall flexibility on the deformation during flow in a stenosed coronary artery. Fluids 2017, 2, 16. [Google Scholar] [CrossRef] [Green Version]
  28. Gilmanov, A.; Barker, A.; Stolarski, H.; Sotiropoulos, F. Image-guided fluid-structure interaction simulation of transvalvular hemodynamics: Quantifying the effects of varying aortic valve leaflet thickness. Fluids 2019, 4, 119. [Google Scholar] [CrossRef] [Green Version]
  29. Stergiou, Y.G.; Kanaris, A.G.; Mouza, A.A.; Paras, S.V. Fluid-structure interaction in abdominal aortic aneurysms: Effect of haematocrit. Fluids 2019, 4, 11. [Google Scholar] [CrossRef] [Green Version]
  30. Salman, H.E.; Saltik, L.; Yalcin, H.C. Computational analysis of wall shear stress patterns on calcified and bicuspid aortic valves: Focus on radial and coaptation patterns. Fluids 2021, 6, 287. [Google Scholar] [CrossRef]
  31. Gaylard, A.; Beckett, M.; Gargoloff, J.; Duncan, B. CFD-based Modelling of Flow Conditions Capable of Inducing Hood Flutter. SAE Int. J. Passeng. Cars Mech. Syst. 2010, 3, 675–694. [Google Scholar] [CrossRef]
  32. Ratzel, M.; Dias, W. Fluid-Structure Interaction Analysis and Optimization of an Automotive Component; SAE International: Warrendale, PA, USA, 2014. [Google Scholar] [CrossRef]
  33. Patil, S.; Lietz, R.; Woodiga, S.; Ahn, H.; Larson, L.; Gin, R.; Elmore, M.; Simpson, A. Fluid Structure Interaction Simulations Applied to Automotive Aerodynamics; SAE International: Warrendale, PA, USA, 2015. [Google Scholar] [CrossRef]
  34. Nazari, A.; Chen, L.; Battaglia, F.; Ferris, J.B.; Flintsch, G.; Taheri, S. Prediction of Hydroplaning Potential Using Fully Coupled Finite Element-Computational Fluid Dynamics Tire Models. J. Fluids Eng. 2020, 142, 101202. [Google Scholar] [CrossRef]
  35. Andreassi, L.; Mulone, V.; Valentini, P.P.; Vita, L. A CFD-FEM Approach to Study Wing Aerodynamics under Deformation; SAE International: Warrendale, PA, USA, 2004. [Google Scholar] [CrossRef] [Green Version]
  36. Castro, X.; Rana, Z.A. Aerodynamic and Structural Design of a 2022 Formula One Front Wing Assembly. Fluids 2020, 5, 237. [Google Scholar] [CrossRef]
  37. Bang, C.S.; Rana, Z.A.; Konozsy, L.; Rodriguez, V.M.; Temple, C. Aeroelastic Analysis of a Single Element Composite Wing in Ground Effect Using Fluid Structure Interaction. J. Fluids Eng. 2021, 144, 041202. [Google Scholar] [CrossRef]
  38. Bungartz, H.J.; Schäfer, M. (Eds.) Fluid-Structure Interaction: Modelling, Simulation, Optimization; Springer: Berlin/Heidelberg, Germany, 2006; ISBN 978-3-540-34595-4. [Google Scholar]
  39. Sigrist, J.F. Fluid-Structure Interaction: An Introduction to Finite Element Coupling; Wiley: Hoboken, NJ, USA, 2015; ISBN 978-1-119-95227-5. [Google Scholar]
  40. Ryzhakov, P.B.; Rossi, R.; Idelsohn SR Onate, E. A monolithic Lagrangian approach for fluid-structure interaction problems. Comput. Mech. 2010, 46, 883–899. [Google Scholar] [CrossRef]
  41. Michler, C.; Hulshoff, S.; van Brummelen, E.; de Borst, R. A monolithic approach to fluid-structure interaction. Comput. Fluids 2004, 33, 839–848. [Google Scholar] [CrossRef]
  42. Piperno, S.; Farhat, C.; Larrouturou, B. Partitioned procedures for the transient solution of coupled aeroelastic problems, part I: Model problem, theory and two-dimensional application. Comput. Methods Appl. Mech. Eng. 1995, 124, 79–112. [Google Scholar] [CrossRef]
  43. Zhang, X.; Zerihan, J. Edge vortices of a double element wing in ground effect. In Proceedings of the 40th AIAA Aerospace Sciences Meeting Exhibit, Reno, NV, USA, 14–17 January 2002; pp. 1–15. [Google Scholar] [CrossRef] [Green Version]
  44. Spalart, P.R.; Allmaras, S.R. A One-Equation Turbulence Model for Aerodynamic Flows. In Proceedings of the 30th Aerospace Sciences Meeting and Exhibit, Reno, NV, USA, 6–9 January 1992; p. 439. [Google Scholar]
  45. Launder, B.E.; Spalding, D.B. The Numerical Computation of Turbulent Flows. Comput. Methods Appl. Mech. Eng. 1974, 3, 269–289. [Google Scholar] [CrossRef]
  46. Wilcox, D.C. Multiscale Models for Turbulent Flows. AIAA J. 1988, 26, 1311–1320. [Google Scholar] [CrossRef]
  47. Menter, F.R. Two-Equation Eddy-Viscosity Turbulence Models for Engineering Applications. AIAA J. 1994, 32, 1598–1605. [Google Scholar] [CrossRef] [Green Version]
  48. Yakhot, A.; Orszag, S. Renormalisation Group Analysis of Turbulence: I Basic Theory. J. Sci. Comput. 1986, 1, 3–51. [Google Scholar] [CrossRef]
  49. Shih, T.-H.; Liou, W.W.; Shabbir, A.; Yang, Z.; Zhu, J. A New k-ε Eddy Viscosity Model for High Reynolds Number Turbulent Flows. Comput. Fluids 1995, 24, 227–238. [Google Scholar] [CrossRef]
  50. ANSYS. ANSYS System Coupling User’s Guide. 2020. Available online: https://d.shikey.com/down/Ansys.Products.2020.R1.x64/install_docs/Ansys.Products.PDF.Docs.2020R1/readme.html (accessed on 7 November 2021).
  51. Roache, P.J. Verification and Validation in Computational Science and Engineering; Hermosa Publishers: Albuquerque, NM, USA, 1998; ISBN 978-0913478080. [Google Scholar]
  52. Roache, P.J.; Ghia, K.N.; White, F.M. Editorial Policy Statement on Control of Numerical Accuracy. J. Fluids Eng. Trans. ASME 1986, 108, 2. [Google Scholar] [CrossRef] [Green Version]
  53. Zerihan, J. An Investigation into the Aerodynamics of Wings in Ground Effect. Ph.D. Thesis, University of Southampton, Southampton, UK, 2001. [Google Scholar]
  54. Bushnell, D.M. Aircraft drag reduction—A review. Proc. I Mech. E Part G J. Aerosp. Eng. 2003, 217, 1–18. [Google Scholar] [CrossRef]
  55. Bushnell, D.M. Supersonic aircraft drag reduction. In Proceedings of the 21st Fluid Dynamics, Plasma Dynamics and Lasers Conference, Seattle, WA, USA, 18–20 June 1990; p. 1596. [Google Scholar] [CrossRef]
  56. Neittaanmaki, P.; Rossi, T.; Korotov, S.; Onate, E.; Periaux, J.; Knorzer, D. Overview on drag reduction technologies for civil transport aircraft. In Proceedings of the European Congress on Computational Methods in Applied Sciences and Engineering (ECCOMAS), Jyväskylä, Finland, 24–28 July 2004; pp. 24–28. [Google Scholar]
  57. Zhang, X.; Toet, W.; Zerihan, J. Ground effect aerodynamics of race cars. Appl. Mech. Rev. 2006, 59, 33–48. [Google Scholar] [CrossRef] [Green Version]
  58. Mahon, S.; Zhang, X. Computational analysis of a inverted double-element airfoil in ground effect. J. Fluids Eng. Trans. ASME 2006, 128, 1172–1180. [Google Scholar] [CrossRef]
  59. Smith, A.M.O. High-Lift Aerodynamics. J. Aircr. 1975, 12, 501–530. [Google Scholar] [CrossRef] [Green Version]
Figure 1. FSI coupling methods: (a) one-way, (b) two-way.
Fluids 07 00085 g001
Figure 2. A double-element wing in ground effect: (a) schematic, (b) computational grid using the ICEM-CFD software.
Fluids 07 00085 g002
Figure 3. Three-dimensional schematic computational domain.
Fluids 07 00085 g003
Figure 4. Grid sensitivity effect: (a) surface pressure distribution, (b) wake profile at x/c = 1.066.
Fluids 07 00085 g004
Figure 5. Turbulence model effect: (a) surface pressure at h/c = 0.211, (b) wake profile at x/c = 1.066 for h/c = 0.211, (c) surface pressure at h/c = 0.079, and (d) wake profile at x/c = 1.066 for h/c = 0.079.
Fluids 07 00085 g005
Figure 6. Chordwise surface pressure at wing centre: (a) high ride heights, (b) low ride heights.
Fluids 07 00085 g006
Figure 7. Chordwise surface pressure at wing centre and wing tip: (a) h/c = 0.395, (b) h/c = 0.105.
Fluids 07 00085 g007
Figure 8. Velocity contours at wing centre and wing tip at different heights (a) h/c = 0.395, centre; (b) h/c = 0.395, tip; (c) h/c = 0.105, centre; (d) h/c = 0.105, tip.
Fluids 07 00085 g008
Figure 9. Spanwise surface pressure on main element: (a) large heights, (b) small heights.
Fluids 07 00085 g009
Figure 10. Spanwise surface pressure on flap: (a) large heights, (b) small heights.
Fluids 07 00085 g010
Figure 11. Spanwise surface pressure at various heights: (a) main element, (b) flap.
Fluids 07 00085 g011
Figure 12. Deflection of double-element wing at various ride heights: (a) non-dimensional maximum deflection, (b) maximum twist angle.
Fluids 07 00085 g012
Figure 13. Velocity streamline around the wing and surface pressure coefficient at different ride heights (a) h/c = 0.395, (b) h/c = 0.211, (c) h/c = 0.105.
Fluids 07 00085 g013
Figure 14. Aerodynamic forces of double-element wing in ground proximity with various heights: (a) lift coefficient, (b) drag coefficient.
Fluids 07 00085 g014
Figure 15. Wake profiles at various ride heights at x/c = 1.066.
Fluids 07 00085 g015
Table 1. Dimensions of a double-element wing.
Main Element Chord223.4 mmTotal Chord380.0 mm
Flap Element Chord165.7 mmSpan1100 mm
Main Element Angle of AttackWing Planform 0.418   m 2
Flap Element Angle of Attack5.6°Aspect Ratio AR2.89
Main TE Thickness1.65 mmFlap Overlap9 mm
Flap TE Thickness1 mmFlap Gap12 mm
Endplate Size 400 × 170 × 4 mm
Table 2. Mechanical properties of composite materials.
Mechanical PropertyEpoxy Carbon UD (230 GPa)Epoxy Carbon Woven (230 GPa)Epoxy Carbon Woven (395 GPa)
Young’s modulus (MPa)1.21 × 10561,34091,820
Shear modulus (MPa)470019,50019,500
Poisson’s ratio0.270.040.05
Density   ( kg / m 3 )1490 14201480
Table 3. Summary of GCI study.
VariableCoarseMediumFine
N1.3M3.1M6.3M
Cd0.163020.162830.16253
r e f f e c t i v e , 12 0.736
r e f f e c t i v e , 23 0.795
P0.701
G C I 12 [%]0.227
G C I 23 [%]0.370
GCI ratio1.001
Table 4. Information on surface pressures for several turbulence models, h/c = 0.211.
2D [58]3D [53]
  C P s u c x / c   a t   C P s u c   C P s u c x / c   a t   C P s u c
Experimental−4.480.08−4.460.08
Turbulence model2D CFD [58]3D FSI
  C P s u c x / c   a t   C P s u c   C P s u c x / c   a t   C P s u c
Spalart–Allmaras−4.960.11−4.180.095
Standard k-ε−4.950.11−4.020.095
k-ε RNG−4.930.11−3.880.095
Realizable k-ε−4.940.11−4.130.095
Standard k-ω−4.910.11−4.200.095
k-ω SST−4.930.11−4.180.095
Table 5. Information on wake profiles for several turbulence models at x/c = 1.066 for h/c = 0.211.
Turbulence Model u m i n / U y / c   a t   u m i n / U y / c   a t   δ δ 99 / c
LowTopLowTopLowTopLowTop
Experimental [9]0.650.720.1500.2000.1040.2050.0670.034
Spalart–Allmaras0.640.710.1410.1820.0930.2060.0780.035
Standard k-ε0.640.650.1400.1780.0800.2110.0850.046
k-ε RNG0.640.680.1400.1800.0950.2110.0770.039
Realizable k-ε0.620.680.1400.1800.0940.2120.0780.040
Standard k-ω0.670.700.1440.1820.0920.2070.0770.038
k-ω SST0.640.700.1440.1820.0920.2070.0770.038
Table 6. Information on wake profiles for various ride heights at x/c = 1.066.
h/cExp/FSI u m i n / U y / c   a t   u m i n / U y / c   a t   δ δ 99 / c
LowTopLowTopLowTopLowTop
0.395Experiment0.720.740.1640.2030.1360.2170.0540.027
FSI0.710.740.1520.1740.1120.2140.0510.051
0.211Experiment0.660.760.1500.2000.1240.2070.0600.023
FSI0.640.710.1410.1820.1050.2070.0660.036
0.105Experiment0.580.800.1340.1920.1020.1980.0780.013
FSI0.400.680.1280.1760.0700.1970.0990.028
Publisher’s Note: MDPI stays neutral with regard to jurisdictional claims in published maps and institutional affiliations.

