1. Introduction
The human race is on the verge of a climate crisis, announced and proved through measurements and predictions of the planet average temperature, which has increased at an accelerated rate over the last 50 years [
1]. Actions to expand the energy sector with renewable sources distributed according to local potential are essential to reduce the impact of human activities on the planet. Distributed energy generation is an alternative, as it minimizes transmission losses in the electricity sector, generates local jobs, and encourages the qualification of the local workforce, which has a positive impact on the three pillars of sustainable development: environmental, social, and economic [
2]. In this scenario, energy from the oceans can be harnessed as an alternative and renewable energy source.
The ocean can be compared to a reservoir with unharvested energy. Several devices have been designed and tested, with different physical operating principles and potential for harnessing the different forms of ocean energy: wave energy, tidal energy, temperature and salinity gradients, as well as energy from marine currents [
3].
The irregular warming of Earth’s surface, mostly covered by water, caused by the inclination of the Earth’s rotation axis, is the main source of the winds. The interaction of air masses with the ocean surface creates waves, which can vary according to the intensity of the generation event [
4,
5]. Beyond that, oceanic topography influences wave behavior in shallow regions [
6]. A wave is a phenomenon where an energy perturbation propagates. At the sea, mechanical waves are observed, which need a physical means to propagate, in this case, the water–air interface [
7].
Estimates indicate that the energy contained in ocean waves has a magnitude around 10 TW [
8]. According to Falcão [
9], there are three main physical principles regarding the conversion of wave energy into electrical energy: oscillating water column; oscillating bodies, which can be point absorbers or surging devices; and overtopping devices. However, this classification does not cover all the studied devices, which is the case of the submerged horizontal plate device [
10,
11,
12,
13].
Considering an overtopping wave energy converter (WEC), the goal of the present study is to use computational modeling to assess the energy potential contained in ocean waves in the coastal region of the municipality of Tramandaí, located on the northern coast of the state of Rio Grande do Sul, Brazil. To this end, firstly, realistic irregular waves and representative regular waves, concerning the sea state in this region, were numerically studied. The analysis assessed the ocean state for the date of 7 April 2019 from 12:30 p.m. to 01:30 p.m. Next, a numerical simulation of the physical operating principle of the overtopping WEC was carried out, in order to evaluate its performance when subjected to realistic irregular waves. Finally, the theoretical power obtained by the overtopping WEC was compared to real energy consumption data from a school located in the city of Tramandaí.
The present study is accomplished through computational modeling, which allows the numerical simulation of operation principles of an overtopping WEC. Numerical simulation can be defined as the process of projecting a real system into a computational model, generating analyses that can facilitate the understanding of the system behavior, allowing to evaluate operation strategies and optimize geometries [
14,
15].
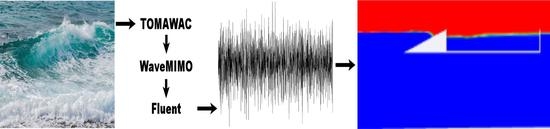
To obtain the data used in the generation of representative regular and realistic irregular waves, the WaveMIMO methodology, presented by Machado et al. [
16] and validated by Maciel et al. [
17], was employed. This methodology is based on the imposition of transient discrete data as prescribed velocity, obtained in this case by means of the spectral wave model TOMAWAC (part of the Open TELEMAC-Mascaret modeling system—
www.opentelemac.org, accessed on 18 August 2022). From TOMAWAC, the wave spectrum is converted into a series of free surface elevations treated and processed as wave propagation velocities in horizontal and vertical directions [
16,
18]. The transient discrete data, then processed as wave propagation velocity, are imposed as boundary conditions on a wave channel in Fluent. In the first stage of the study, the verification of the generation of representative regular waves was performed; in the second stage, the generation of realistic irregular waves was verified, which occurs by imposing discrete transient data of orbital velocities of wave propagation as input boundary condition; in the third and last stage, the overtopping WEC was inserted into the wave channel, where its energy potential was evaluated.
It is important to mention that numerical studies of overtopping devices considering the sea state present in the municipality of Tramandaí were not found in the literature. Despite that, numerical studies of overtopping WECs subjected to regular waves have often been developed. For example, a simulation was performed of an overtopping device against seawalls armored with artificial units [
19]; a geometric evaluation was performed using Constructal Design, to investigate the effects of the relation between height and length of an overtopping device ramp and the device depth [
20]; the geometry of an overtopping WEC was evaluated by means of Constructal Design when subjected to different relative depths [
21]; a geometric evaluation of a three-dimensional overtopping device was performed using Constructal Design [
22]; and a simulation of a multi-level overtopping device was studied [
23].
As for numerical studies of overtopping WECs subjected to irregular waves, the incidence of a monochromatic wave and a wave spectrum for an overtopping device were compared [
24]; the power produced by a Wave Dragon-type overtopping device subjected to irregular waves was evaluated [
25]; the fluid dynamic behavior of an overtopping device subjected to regular and irregular waves was compared, finding results that indicate a larger amount of accumulated water inside the reservoir for irregular waves [
26]; and the geometry of an overtopping WEC, containing either one or two ramps, was evaluated by means of Constructal Design [
27]. Finally, regarding the study of the generation of irregular numerical waves, the use of OpenFoam software for fluid dynamics simulation of irregular waves was studied [
28,
29] and several parameters of the propagation of irregular waves in wave channels was simulated [
30]. Finally, the numerical generation of long-crest irregular waves and irregular breaking waves was performed [
31,
32]. Despite several important works performed in the literature, little has been seen about the simulation of the realistic sea state of a particular location over an overtopping device, as done in the present work.
2. Methodology
Waves generated in fluid bodies, such as oceans, can originate from different sources. Surface waves are one of the forms of energy available in the ocean, formed mainly by the interaction between the wind and the water surface. Gravity and surface tension forces act in a restorative manner, maintaining a free surface level of the fluid and generating different shapes and types of waves, in addition to enabling their propagation [
6].
To understand and model the behavior of waves, some models and theories have been developed. The modeling can be categorized as theories of regular and irregular waves, also known as deterministic and random, respectively [
6]. The theory of regular waves presents waves with well-defined and constant behavior in time and space, unlike what happens with irregular waves. The main characteristics of a wave are shown in
Figure 1.
In
Figure 1, MWL is the mean water level, i.e., the free surface of the fluid at rest (m); crest is the highest point reached by the wave above the MWL; trough is the lowest point reached by the wave below the MWL; depth (
h) is the distance between sea bottom and the MWL (m); period (
T) is the time the wave takes to complete one cycle (s); amplitude (
a) is the vertical distance between the crest (or trough) and the MWL (m); height (
H) is the vertical distance from crest to trough (m); and, finally, wavelength (
L) is the horizontal distance between two consecutive crests or troughs (m).
The elementary analytical approach to the theory of surface gravity waves is the linear wave theory or Airy theory, which can be applied to specific wave conditions that are not found in nature [
33]; however, being useful for the understanding and developing of several ocean engineering investigations. In this theory, several simplifications are assumed, where the main ones are: the fluid is considered incompressible; wave generation occurs in a constant water depth; wave amplitude is very small compared to its wavelength; turbulence, viscosity, and surface tension are disregarded; and a two-dimensional and irrotational flow is assumed.
The theory solution focuses on finding the results for the free surface elevation, obtained from the following equation [
6]:
where
x is the horizontal coordinate (m) and
t is time (s). In addition, the parameters wave number (
k) and wave frequency (
) are obtained from the following relationships:
The use of wave theory when modeling the problem in Fluent is given through the imposition, as boundary conditions, of the wave propagation orbital velocities in the horizontal and vertical directions. Thus, the wave propagation velocity equations, when considering the linear theory are [
6]:
where
u is the horizontal component of velocity (m/s),
w is the vertical component of velocity (m/s),
g is the gravitational acceleration (m/s
), and
z is the vertical coordinate (m). It is worth highlighting that, as mentioned, there are several wave theories; however, in this work, only the linear wave theory is presented and employed.
Other boundary conditions are imposed on the domain boundaries, which are water free surface, atmospheric pressure, and the bottom. The kinematic bottom boundary condition, considering the bottom to be stationary and impermeable, is [
6]:
where
is the velocity potential function. A kinematic boundary condition is also applied to the free surface of the fluid [
6]:
The dynamic free surface boundary condition is [
6]:
where
represents the surface pressure. The Bernoulli equation at the surface
is given by:
Lastly, the pressure outlet boundary condition was set to an atmospheric pressure value of 101,325 Pa.
2.1. Mathematical Model
The volume of fluid (VOF) method [
34] is used to solve multiphase flow systems considering immiscible fluids and its main contribution was the introduction of the volumetric fraction in momentum equations. Subsequently, the method was improved and has been adopted for numerous wave energy investigations, not only for overtopping devices, but also for other types such as oscillating water column (OWC) and submerged plate [
11,
17,
20,
26,
27,
35].
The volumetric fraction (
) identifies the fluid present in each mesh cell, to evaluate the free surface of the flow. In this study, two phases were considered, i.e., air and water. Therefore, when
= 0, the control volume contains only air; when
= 1, the control volume contains only water; and when 0
1, there is a mixture of air and water in the control volume. This occurs because the sum of the volumetric fraction within a control volume is unitary [
10].
The method consists of solving continuity and momentum equations for the mixture, and an additional transport equation for each phase. The VOF model equations are described below. The continuity equation for the mixture of air and water is given by [
36]:
where
is the density of the fluid (kg/m
) and
is the flow velocity vector (m/s). The momentum equation for the mixture is given by [
36]:
where
p is the static pressure (Pa),
is the strain rate tensor (N/m
),
is the dynamic viscosity (kg/ms),
is the buoyancy force (N/m
), and
S is the source term representing the energy dissipation when a numerical beach is implemented. Finally, the transport equation for each of the phases is defined by [
34,
37]:
It is noteworthy that continuity and momentum equations are solved for the mixture, therefore, the viscosity and density for the mixture can be described as [
34,
37]:
The following operating conditions were considered: gravitational acceleration of 9.81 m/s, atmospheric pressure of 1 atm, density of air of 1.225 kg/m, and density of water 998.2 kg/m.
2.2. Numerical Model
The computational modeling used in the present study makes possible the numerical simulation of the main operating principle of an overtopping WEC, also allowing the prediction of behaviors and optimization of geometries, among other applications. Nowadays, advances in the processing and storage capacity of computers allow large-scale application of numerical techniques to solve engineering problems [
15]. It is worth mentioning that the use of numerical simulation does not replace experimental research, but rather helps in predicting results and reduces the development time of systems and products.
The code that performs the steps for solving a computational fluid dynamics (CFD) problem strictly follows the conservation laws of physics. As previously mentioned, Fluent software was used in this work. Fluent is capable of performing a variety of simulations, involving flows, turbulence, heat transfer, and chemical reactions, with possibilities for academic and industrial use [
38]. Based on the finite volume method (FVM), Fluent uses structured and unstructured meshes to solve the most diverse types of CFD applications.
FVM, in turn, is a way to obtain a discrete version of a partial differential equation (PDE). Its development is intrinsically linked to the concept of flow between adjacent regions or volumes, where the flow of a given quantity, such as mass or energy, is the amount of that quantity that crosses the area of a boundary. The net amount of this quantity that crosses a control volume, per unit of time, is calculated by integrating, over these boundaries, the difference between the flows that enter and exit this volume [
15].
To perform the numerical simulations using Fluent, a transient problem was considered, employing a pressure-based solver as numerical method, with the first order upwind advection scheme for the treatment of advective terms. Spatial discretization for pressure was performed using the Pressure Staggering Option method (PRESTO), a method that uses the discrete balance of continuity for an inertial control volume over the face to compute the pressure [
39]. For the treatment of the volumetric fraction, the GEO-RECONSTRUCTION method was used [
20,
39]. The pressure–velocity coupling was solved using the Pressure-Implicit with the splitting of operators method (PISO) [
40]. In addition, under-relaxation factors of 0.3 and 0.7 were imposed for continuity and momentum equations, respectively. The solutions obtained in this study were considered converged when the residuals of continuity and momentum equations in the
x and
z directions were lower than 10
. A verification of the numerical methods employed in this study was previously performed by Martins et al. [
27], who compared results with the solution of the empirical model proposed by EurOtop [
41].
2.3. Representative Regular Waves and Realistic Irregular Waves
As mentioned, the objective of this study is to evaluate, using an overtopping WEC, the energy potential that can be harnessed in the sea waves in the coastal region of the municipality of Tramandaí, located on the North Coast of the State of Rio Grande do Sul, Brazil. For this, the WaveMIMO methodology [
16] was used to obtain data from the coast of Tramandaí at the point of longitude 50°6
6.86
W and latitude 29°59
53.38
S (see point P in
Figure 2), which has a depth of 12.97 m and is located 2391.98 m from the coast.
Here, the WaveMIMO methodology was applied to a wave spectrum obtained from the spectral wave model TOMAWAC, which was transformed into a time series of free surface elevations [
16,
18]. TOMAWAC is an open source software capable of accurately simulating sea states of a given region. This software uses the finite element method (FEM) and considers waves generated by wind, bottom refraction, and refraction generated by currents and wave breaking dissipation, being able to calculate several parameters of interest that allow a complete description of a realistic sea state [
42]. However, in TOMAWAC, it is not possible to carry out simulations of wave energy converter devices.
Figure 3 presents a summary of the WaveMIMO methodology application to obtain realistic irregular waves.
The database obtained from TOMAWAC corresponds to the coast of the state of Rio Grande do Sul and part of the coast of the state of Santa Catarina, comprising the period between 1 January 2018 and 31 May 2019 [
43]. Time series of significant wave height and mean wave period were extracted from the point illustrated in
Figure 2 and called “Tramandaí buoy”. The study was carried out in this location due to the existence of a wave motion sensor (
https://www.marinha.mil.br/chm/dados-dos-ondografos/ondografos-lista, accessed on 5 September 2019) in these geographic coordinates.
For the study to have maximum representativeness and due to the fact that wave modeling requires high computational effort, it is necessary to determine a short time interval for analysis, to guarantee that it adequately represents the characteristics of the sea state in the region [
44]. In this way, a statistical analysis was carried out to estimate the most frequent sea state in the study region. For this, a bivariate histogram was prepared to determine the most frequent combination of significant wave height (
) and mean wave period (
). Thus,
Figure 4 shows the recurrence of sea states over the years 2018 and 2019, where it can be observed, about 2700 times, the occurrence of the sea state with
0.42 m and
3.90 s.
Next, the variance spectra within the pre-selected range were observed and then a spectrum with a unimodal characteristic was chosen, represented in
Figure 5, occurring on 7 April 2019, at 12:30 p.m. It is worth noting that this spectrum was used to determine the characteristics of the representative regular waves, presented in
Table 1.
Then, the sea state spectrum is transformed into free surface elevation series, applying the inverse Fourier transform to the sea state spectrum [
45]. More details about this methodology can be found in Oleinik et al. [
18] and Machado et al. [
16]. In
Figure 6, it is possible to visualize the first 100 s of the free surface elevation time series of the representative regular waves (obtained through Equation (
1)) and realistic irregular waves (obtained from TOMAWAC) of the adopted sea state (see
Figure 4 and
Figure 5). As expected, representative regular waves show a stable cyclic behavior, being a simplification of the real phenomenon; while realistic irregular waves show an unstable behavior, representing more faithfully the sea state that occurs in nature. It was observed that, in general, when compared to representative regular waves, realistic irregular waves present considerable differences regarding the elevation of crests and troughs. It can also be observed that some crests and troughs of realistic irregular waves have approximately twice the amplitude of crests and troughs of representative regular waves. Finally, it is noteworthy that the waves were obtained from the unimodal variance spectrum, which occurred in the municipality of Tramandaí, Brazil, on April 7, 2019 (see
Figure 4 and
Figure 5).
To replicate a sea state in Fluent it was necessary to convert free surface elevation series into profiles of orbital velocities of wave propagation in vertical and horizontal directions. These orbital velocities of water particles are obtained by applying the dispersion relation equation and are imposed as boundary condition in Fluent software for the generation of realistic irregular waves [
16].
2.4. Numerical Model Calibration and Case Study
Before numerically analyzing the overtopping WEC, it was necessary to identify the current wave climate in the study region so that the results have the greatest possible fidelity. To this end, this study was subdivided into three parts: in the first, the study of representative regular waves (see
Table 1) was carried out, where the quality of the mesh and the time step were evaluated. It is worth mentioning that, in this case, the verification takes place through the comparison of the waves obtained numerically with the analytical expression of the linear theory (Equation (
1)) for the free surface elevation; in the second part, the generation of realistic irregular waves that represent the sea state found in the coastal region of the Tramandaí was verified. In this case, the verification takes place by comparing, in the wave imposition region, free surface elevation obtained in Fluent with the elevation obtained from TOMAWAC; finally, in the third part, the operational physical principle of a sea wave energy converter device was tested. As mentioned, the device chosen was an overtopping WEC, for which the theoretical power available was determined.
2.4.1. Verification Study of the Representative Regular Waves
In this study, a two-dimensional numerical model of a real-scale wave channel was used, with dimensions following recommendations from the literature [
35]. Thus, the wave channel has a length
5
L and a depth of
12.967 m, which is found in the coastal region of Tramandaí (see
Figure 2), and an approximate total height,
15.39 m.
Figure 7 illustrates the computational domain used to generate the representative regular waves.
Regarding the initial conditions, it was considered that the fluid is at rest and that the water free surface has depth
h. As for the boundary conditions shown in
Figure 7, on the left side of the channel (red line), a velocity inlet boundary condition was assigned, generated by the imposition of a velocity field given through Equations (
4) and (
5). In the upper region of the left wall of the channel, as well as on its upper surface (blue line), the pressure outlet boundary condition was assigned; on the bottom, the velocities are prescribed as zero, i.e., the non-slip and impermeability boundary conditions were adopted. Finally, on the right side (green line), the hydrostatic profile condition (pressure outlet) was imposed; this boundary condition receives a distinct nomenclature because it will act as the numerical beach (orange hatching).
The numerical beach was used by inserting a damping sink term in the momentum equation (Equation (
11)) for the cell zone in the vicinity of the pressure outlet boundary, shown as the hatched region in
Figure 7. This aims to reproduce damping and dissipation effects that occur on beaches when waves approach the coast and interact with the bottom [
46]. Regarding wave channel simulation, a numerical beach avoids reflection of the waves that arrive at the end of the channel, minimizing errors due to the wave channel right end wave reflection and allowing to perform longer simulations.
The source term is represented by [
46]:
where
is the linear damping coefficient (s
),
is the quadratic damping coefficient (m
),
V is the fluid velocity at a given point (m/s), and
,
,
, and
are the free surface, bottom, starting, and ending points of the numerical beach domain (m), respectively. It is noteworthy that recommendations from the literature were adopted [
46], regarding coefficients
= 20 s
and
= 0, as well as the numerical beach length, which was defined as 2
L.
Regarding the spatial discretization, following recommendations from the literature [
47,
48], a stretched mesh was used, which applies a greater refinement in the free surface region. Thus, the computational domain was divided vertically into three regions and horizontally into one region. As for vertical discretization, the region above the free surface, which contains only air, was subdivided into 20 mesh volumes; the free surface region, which contains the air-water interface, was subdivided into 20 volumes per wave height (
/20, see
Table 1); and the region below the free surface, which contains only water, was subdivided into 60 volumes. With respect to the horizontal discretization, a parameter of 50 volumes per wavelength was adopted (
L/50, see
Table 1). The discretization of the computational domain is shown in
Figure 8.
Since this is a transient problem, aiming to obtain greater precision with the results, tests were carried out to evaluate the quality of the time step. To evaluate time step quality, the following parameters were tested:
T/39,
T/49,
T/78,
T/390, and
T/500, where the last parameter is indicated for studies regarding regular wave generation [
35].
2.4.2. Verification Study of the Realistic Irregular Waves
The study to verify the generation of realistic irregular waves also uses a two-dimensional numerical model of a real-scale wave channel. However, in this case, the bathymetry found in the region was taken into account at the bottom of the channel (see
Figure 9). Furthermore, the WaveMIMO methodology [
16] presents the need to discretize the inlet region (see
Figure 9, with red velocity vectors), thus enabling discrete transient data of orbital velocities of wave propagation to be imposed as boundary conditions.
It is worth noting that, in this study, the region of wave velocity imposition (red line in
Figure 9) was subdivided into 20 subregions of 0.64 m each, which represents the highest free surface elevation found in the time series of realistic irregular waves. According to the recommendation for stretched meshes [
47,
48], it is important that the mesh in the region of free surface elevation should be refined, which corresponded to a wave height above (
) and one below (
) the MWL. As for the boundary conditions, it should be mentioned that they are similar to those presented in
Section 2.4.1.
Regarding the other characteristics of the wave channel (
Figure 9), the dimensions adopted in the numerical model previously presented were maintained. As informed, for this study, site bathymetry was considered, which presents a difference of 0.79 m between the initial depth and the final depth of the channel. As for the spatial discretization, a stretched mesh was also used, as in the previous domain (see
Figure 7 and
Figure 8). For this, the vertical discretization in the free surface region was based on the wave height of the representative regular waves, i.e., 20 mesh volumes every 0.42 m.
2.4.3. Theoretical Power Obtained by an Overtopping WEC
This study aims to evaluate the available power obtained by an overtopping WEC (see
Figure 10) when subjected to a realistic sea state presented in the coastal region of Tramandaí. In this device, whose working principle is based on a reservoir raised in relation to the MWL, waves hit and climb a ramp, due to their energy, transporting volumes of water to the reservoir. The accumulated water mass, when returned to the sea, drives low head hydraulic turbines coupled to electric generators. Thus, the device converts kinetic energy from the waves into electrical energy [
49].
The determination of the theoretical power available in the overtopping WEC can be obtained from [
20]:
where
is the available power (W),
m is the mass of water in the reservoir (kg), obtained from the relationship between water density and the volume of water inside the reservoir,
is the water depth in the reservoir (m), and
is the study time interval (s). The theoretical energy, on the other hand, generated through this device can be determined from the following equation [
50]:
where
E is the theoretical energy generated (kWh) and
is the analyzed time period (s).
Similarly to the one described in
Section 2.4.2, the computational domain consisted of a two-dimensional wave channel, with a total length
= 5
L, a height
= 18.39 m (the height of the channel was increased for the insertion of the device) and water depth
h = 12.967 m. At the beginning of the channel, the velocity inlet boundary condition region was discretized as in the irregular wave generation study, the numerical beach condition was employed at the end of the channel, and the bathymetry of the ocean was considered (see
Figure 9). The device geometry was adapted from the results obtained in the previous study conducted by Martins et al. [
20], where the optimal ratio between the height of the reservoir (
) and the base of the ramp (
) is
/
= 0.34. Keeping this ratio as a parameter for adapting dimensions of the overtopping device, a proportionality relation was applied and the chosen parameter was the wave height. In the study performed by Martins et al. [
20], wave height was
H = 1 m. Therefore, the ratio of wave heights is 2.38.
Thus, the dimensions proposed by Martins et al. [
20] for the overtopping WEC were reduced by 2.38 times, which enabled the construction of the geometry based on the optimized
/
ratio. Hence, the dimensions of the simulated overtopping device in this study were
= 9.1147 m,
= 20 m, and
= 3.098 m. In addition, it is worth noting that the device is located in the channel so that, right after its reservoir, the 2
L numerical beach begins. Regarding the boundary conditions, the same conditions as the ones employed in the generation of realistic irregular waves were imposed (see
Figure 9), in addition to the non-slip and impermeability condition imposed to the walls of the overtopping device. In
Figure 11, it is possible to visualize the adopted computational domain, containing the overtopping WEC.
It is important to emphasize that two-dimensional studies regarding overtopping WECs have been previously performed [
20,
27,
51,
52,
53,
54,
55]. This simplification is reasonable since the physical phenomenon that occurred due to the incidence of waves can be adequately approximated as an in-plane problem [
26]. In addition, a two-dimensional approach can also be justified by the processing time required for the numerical simulation.
4. Conclusions
In the present work, numerical studies were performed to evaluate the main operating principle of an overtopping WEC submitted to the sea state in the coastal region of the municipality of Tramandaí, in the state of Rio Grande do Sul, Brazil. Firstly, the computational model verification regarding the generation of regular waves representative of the sea state was performed. For this, the evaluation of time step quality was carried out. It was concluded that the evaluated time step values did not significantly influence the accuracy of the results, presenting, between the highest and the lowest time step values, MAE of 0.0037 m and RMSE of 0.0042 m; however, an augmentation of around 53 h in the processing time occurred.
In the second analysis, the computational model verification for generating realistic irregular waves was carried out. It was possible to conclude that the numerical simulation of the irregular free surface elevation series performed in Fluent, using the WaveMIMO methodology, represents adequately the time series obtained from the spectral wave model TOMAWAC. It should be noted that, qualitatively, crests and troughs presented in the simulated realistic irregular waves were adequately represented. Quantitatively, MAE and RMSE values of 0.0534 m and 0.0675 m, respectively, were found.
For the final analysis, the overtopping WEC was inserted into the wave channel and subjected to realistic irregular waves. The observation of the transient behavior demonstrated that the device behaves properly. The incident waves performed the overtopping process intermittently, allowing water accumulation in the reservoir. It was possible to conclude that the overtopping WEC analyzed in the present study obtained an available theoretical power of 471.28 W, which, based on average monthly electricity consumption and assuming a constant generation under these conditions, would supply the electricity needs of the Cândido Osório da Rosa Municipal School throughout the year 2018, which exemplifies the applicability of the present methodology for reproducing overtopping devices under real sea state conditions.
In general, the results of this work are promising and encourage further studies in the area. Among these, it can be suggested: comparing the theoretical power obtained by an overtopping WEC subjected to representative regular waves to the results of this study; comparing realistic irregular waves with sea state data obtained from a wave motion sensor; to perform a geometric optimization study of an overtopping device considering a realistic sea state; and to evaluate the theoretical power obtained by other WEC type, for instance, an OWC subjected to the incidence of realistic irregular waves.

 ,
, 


