
Dynamics of Laser-Induced Shock Waves in Supercritical CO2

Institute of Photon Technologies, Federal Scientific Research Centre “Crystallography and Photonics”, Russian Academy of Sciences, Pionerskaya 2, Troitsk, 108840 Moscow, Russia
*
Author to whom correspondence should be addressed.
Fluids 2022, 7(11), 350; https://doi.org/10.3390/fluids7110350
Submission received: 14 October 2022
/
Revised: 28 October 2022
/
Accepted: 6 November 2022
/
Published: 10 November 2022
(This article belongs to the Special Issue Frontiers in Supercritical Fluids)
Abstract
:We studied the dynamics of laser-induced shock waves in supercritical CO2 (scCO2) for different pressures and temperatures under nanosecond optical breakdown. We estimated the shock wave pressure and energy, including their evolution during shock wave propagation. The maximal shock wave pressure ~0.5 GPa was obtained in liquid-like scCO2 (155 bar 55 °C), where the fluid density is greater. However, the maximal shock wave energy ~25 μJ was achieved in sub-critical conditions (67 bar, 55 °C) due to a more homogeneous microstructure of fluid in comparison with supercritical fluid. The minimal pressure and energy of the shock wave are observed in the Widom delta (a delta-like region in the vicinity of the critical point) due to the clusterization of scCO2, which strongly affects the energy transfer from the nanosecond laser pulse to the shock wave.
1. Introduction
Nowadays, an investigation of various properties of supercritical fluids (SCF) is one of the most promising and interesting directions both in science and technology [1]. A supercritical fluid is defined as the state of matter in which the thermodynamic parameters of a substance are higher than its critical pressure and temperature [1]. Supercritical fluids are widely used in fundamental and practical applications as solvents and extractants in diverse areas of science such as pharmaceuticals, chemistry, biotechnology, etc. [2]. SCF are characterized by high-density fluctuations, tuneable density, high diffusivity, and anomalous behavior of their chemical and physical properties in the vicinity of critical points [3,4,5]. However, the physical and chemical properties of SCF are non-monotonic; the greatest changes of such properties (for example, sound speed, specific heat capacities, etc.) occur in the vicinity of the critical point. In [6], it was proposed that the locations of different quantities maxima lie not near each other in the (ρ,T) plane or the (P,T) plane. The line where these maxima are located was named a Widom line [6]. More recently, it was demonstrated that it may be more correct to define the region where these maxima are located as a Widom delta [7,8,9]. This region is characterized by maximal cluster formation, nonlinearity, and thermodynamic properties extremum [10,11]. From a microscopic point of view, the structure of SCF in the Widom delta can be conceptualized as conglomerates of molecules (or atoms) separated by a relatively empty space [12]. For higher pressures and lower temperatures, the microstructure of SCFs is closer to liquids, and such kinds of SCF are called liquid-like. Otherwise (for higher temperatures and lower pressures), the microstructure is closer to gases, and such kinds of SCFs are called gas-like [12]. In the intermediate case, where the clusterization is maximal, the anomalous macroscopic properties in the vicinity of the critical point are obtained [7,12]. The crossover between liquid-like and gas-like SCFs are also characterized by the change in phonon spectrum [13,14] and the dynamics of the electron plasma [15]. The extremum in the electron plasma dynamics in the Widom delta is caused by the different free paths of electrons generated in the centre of the cluster and its boundary [15]. Such an extraordinary behaviour of SCF in the Widom delta finds application not only for the stationary case (for fixed p and T) but also for highly non-equilibrium processes such as laser ablation, nanoparticle generation, etc. [16,17,18]. However, most aspects of these complex physical and chemical processes in SCF remain open. One of the most common ways to initiate a highly non-equilibrium state is to irradiate the sample with an intense laser field [19,20]. The impact of intense laser impulses (I > 1011 W/cm2) on dielectric material leads to the generation of electron plasma with high temperatures ~103–105 K and pressures (100 MPa–10 TPa) [21]. Under nanosecond laser pulses impact, an electronic plasma is generated; then the energy from “hot” electrons is transmitted to “cold” molecules that lead to the shock wave generation and cavitation bubble formation [22]. In liquids on a nanosecond timescale, it leads to the formation of cavitation bubbles and shock wave generation [23]. The shock wave initially travels with supersonic velocities with high Mach numbers (the ratio of flow velocity to the local speed of sound) [24]. The development of experimental methods makes it possible to obtain dynamics of ultrafast processes induced by laser pulses with a femtosecond resolution. For example, the dynamics of laser-induced breakdown in water and its mechanical post-effects has been completely characterised on timescales from femtoseconds to microseconds [25,26,27]. However, the dominant part of the experiments describing laser-induced post effect were performed in liquids or gases far from the critical point. Moreover, there is lack of information how the clustering could affect on the dynamics of optical breakdown.
In the current manuscript, we concentrated on the dynamics of shock waves generated by nanosecond laser pulses in SCF. We varied the temperature and pressure of supercritical CO2 (scCO2) that changes the microstructure of the medium, including cluster configuration [11]. We demonstrated where the energy conversion from the laser pulse to the shock wave has maximal and minimal values and how it changes with pressure and temperature.
2. Methods
2.1. Experimental Setup
For time-resolved diagnostics of laser-induced shock waves, we applied the shadow photography technique; the experimental setup is presented in Figure 1 [28]. In the framework of time-resolved shadow photography, we used two impulses: pump (IR) and probe (visible). The first pump pulse (1053 nm, 6 ns; LaserExport, Russia, Moscow) was tightly focused into CO2 through a SiO2 window (thickness 5 mm) by a microscopic objective with NA = 0.45 (OptoSigma, Tokyo, Japan). The second probe pulse (527 nm, 6 ns; LaserExport, Russia) was used to obtain changes in the scCO2 media caused by the first pulse: optical breakdown, shock waves, and cavitation. The probe pulse was transmitted through the diffuser plate to achieve uniform illumination of the focal plane. The laser-induced shock waves change the refractive index on their front that leads to the refraction of the probe impulse. As a result, the shock waves can be obtained as dark circles in the shadow photographs registered by a CCD camera (MindVision, Shenzhen, China). The spatial resolution of the scheme was about 1.25 μm/pixel. The time delay between pump and probe pulses was electronically varied with a time step of 125 ps. The time delay generator system is described in our previous article [28]. The energy was set to 400 μJ for the pump pulse and 275 µJ for the probe pulse. We used a supercritical cell for experiments; the pressure and temperature of CO2 could be varied in the range of 1–200 bar (±0.1 bar) and 25–80 °C (±0.1 °C), respectively. The critical point of CO2 is 73.8 bar, 31.1 °C. In the manuscript, we concentrated on the role of scCO2 microstructure and did not vary the energy of the laser pulse. For the chosen energy, the optical breakdown occurs with ~100% possibility. For higher energies the shape of the bubble and shock wave starts to deviate from spherical [25], that could possibly violate the shock wave dynamics.
2.2. Pressure and Energy Retrieving Methodology
From the shadow photographs, we could obtain the shock wave radius. To retrieve the energy (E) and pressure (p) of the shock wave, one has to perform some maths described further in this section. Pressure and energy dependences on the velocity at the shock wave front are related by the following equations [29]:
where us—shock-wave velocity, u—particle velocity, p, and are pressure at the shock wave front and hydrostatic pressure, E and E0 are the initial and final energies, and and are the density at the shock wave front and undisturbed fluid. Particle velocity depends on CO2 density and shock wave velocity as [30]:
where α = 2.61 km/s*cm3/g, s = 1.39, c0 = 1.33 km/s (for CO2 up to 500 bar pressure).
We assume an exponential decrease in shock wave velocity [29]:
Hence, if we know the velocity at the shock wave front us, we can retrieve energy deposited in the shock wave and density profile.
3. Results and Discussion
In our experiments, we used time-resolved shadow photography, as described in the Methods section. Figure 2 demonstrates the typical evolution of the laser-induced shock wave. Initially, the shock wave propagates with the cavitation bubble wall and separates from the wall ~100 ns after laser impact (see Figure 2a). Then the velocity of the bubble wall rapidly drops due to the decrease of pressure inside the bubble [24,32], however, the shock wave velocity reduction on such a timescale is insignificant. We determined the shock wave diameter for each time delay between the pump and the probe pulses after the shock wave was separated from the cavitation bubble and fitted the data assuming the exponential decay of the shock wave velocity [29], see Equation (4).
The applied approximation for different pressures and temperatures gives estimates for the sound velocity, shock wave velocity, and decay constant α. The observed sound velocity is in a good coincidence (within a range of experimental errors ~ 5–15%) with the tabular data [33]. The minimal sound velocity is observed in the Widom delta, which is a result of sound propagation in the highly clustered medium (clusterization is maximal in the Widom delta) [11]. The dependence of the shock wave velocity on pressure also has extremum in the Widom delta vicinity (see Figure 3a,b, marked as the magenta dash–dot line). This could be caused by a rapid increase in the adiabatic index (see Figure 3c), which is one of the main parameters in the Hugionot specific for the material [34,35].
From the microscopic point of view, the extremum in the dependence on shock wave velocity can be explained by the clustered structure of SCF [3]. In the Widom delta, a significant amount of SCF consists of medium-sized clusters separated by a relatively “empty” space [12,36]. After laser impact, a pressure wave starts propagation radially from the center. In liquids and liquid-like SCFs the molecules are close-packed, thereby, the impulse from one molecule to another transmits rapidly. Besides, in a general case the increase in density will lead to higher shock wave velocities due to the decrease in interatomic distances.
In gases, the separated molecules relatively rarely interact with each other, leading to the slower decay of the shock waves, but the shock wave (and sound) velocities would be lower than in liquids (and liquid-like SCFs). In the intermediate case of clusterized media, its density is comparable with liquids; however, molecules that are concentrated in clusters, which are relatively rare, interact with each other. In such a structure, the shock wave will propagate slower than in liquids due to the higher “effective mass” of each particle. Thereby the shock wave propagates slowly in the Widom delta, where clusterization is maximal [9].
As we described in the Methods Section, it is possible to retrieve the initial shock wave pressure and the energy conserved in the shock wave. The dependences of these values on pressure are presented in Figure 4. The highest pressure ~0.55 GPa was obtained at p = 155 bar and T = 55 °C. The maximal shock wave energy was obtained under sub-critical conditions due to the more homogeneous microstructure of fluid in comparison with supercritical fluid; the number of clusters is lower in the sub-critical region [11]. The increase of the shock wave pressure and energy for higher CO2 pressures was caused by the rise of medium density, see Equation (1). The minimum in the dependence of the shock wave pressure on the pressure of CO2 was a result of the clusterization in the Widom delta, as was discussed above. In the high-density range of pressures (p > 110 bar), the dependence of the shock wave energy on pressure was similar to the dependence on the shock wave speed. In this region of the p-T diagram, all thermodynamic parameters (such as specific heat capacities, sound velocity, etc.) have a monotonic dependence on pressure and temperature (see Figure 3c) [33].
Moreover, the density increase leads to the growth of electron concentration, thereby, during the optical breakdown, the electron plasma would be denser, and a higher amount of laser energy would be transmitted to the electronic subsystem. That would lead to higher temperatures in the atomic (molecular) subsystem due to energy transport through the electron–ion interaction. Following the framework of the two-temperature model (“hot” electrons and “cold” ions) [37], the temperature of atoms would be greater for higher temperatures and densities of electron plasma gas. However, this approach would not work in the vicinity of the critical point or Widom delta. As was demonstrated in [15,38], when electron plasma is generated in a clusterized medium, the free pass of electrons is significantly different for electrons induced in the “middle” of the cluster and electrons generated at the boundary of the cluster [39]. The electrons generated at the boundary of the cluster could not efficiently transmit energy to molecules because there is a huge “empty” space between clusters. When the number of clusters is decreased outside the Widom delta, the energy of the shock wave returns to the values ~20–30 μJ. The conversion of the laser pulse energy to the shock wave is about 5–7%, which is close to values obtained for the optical breakdown in water [29,31].
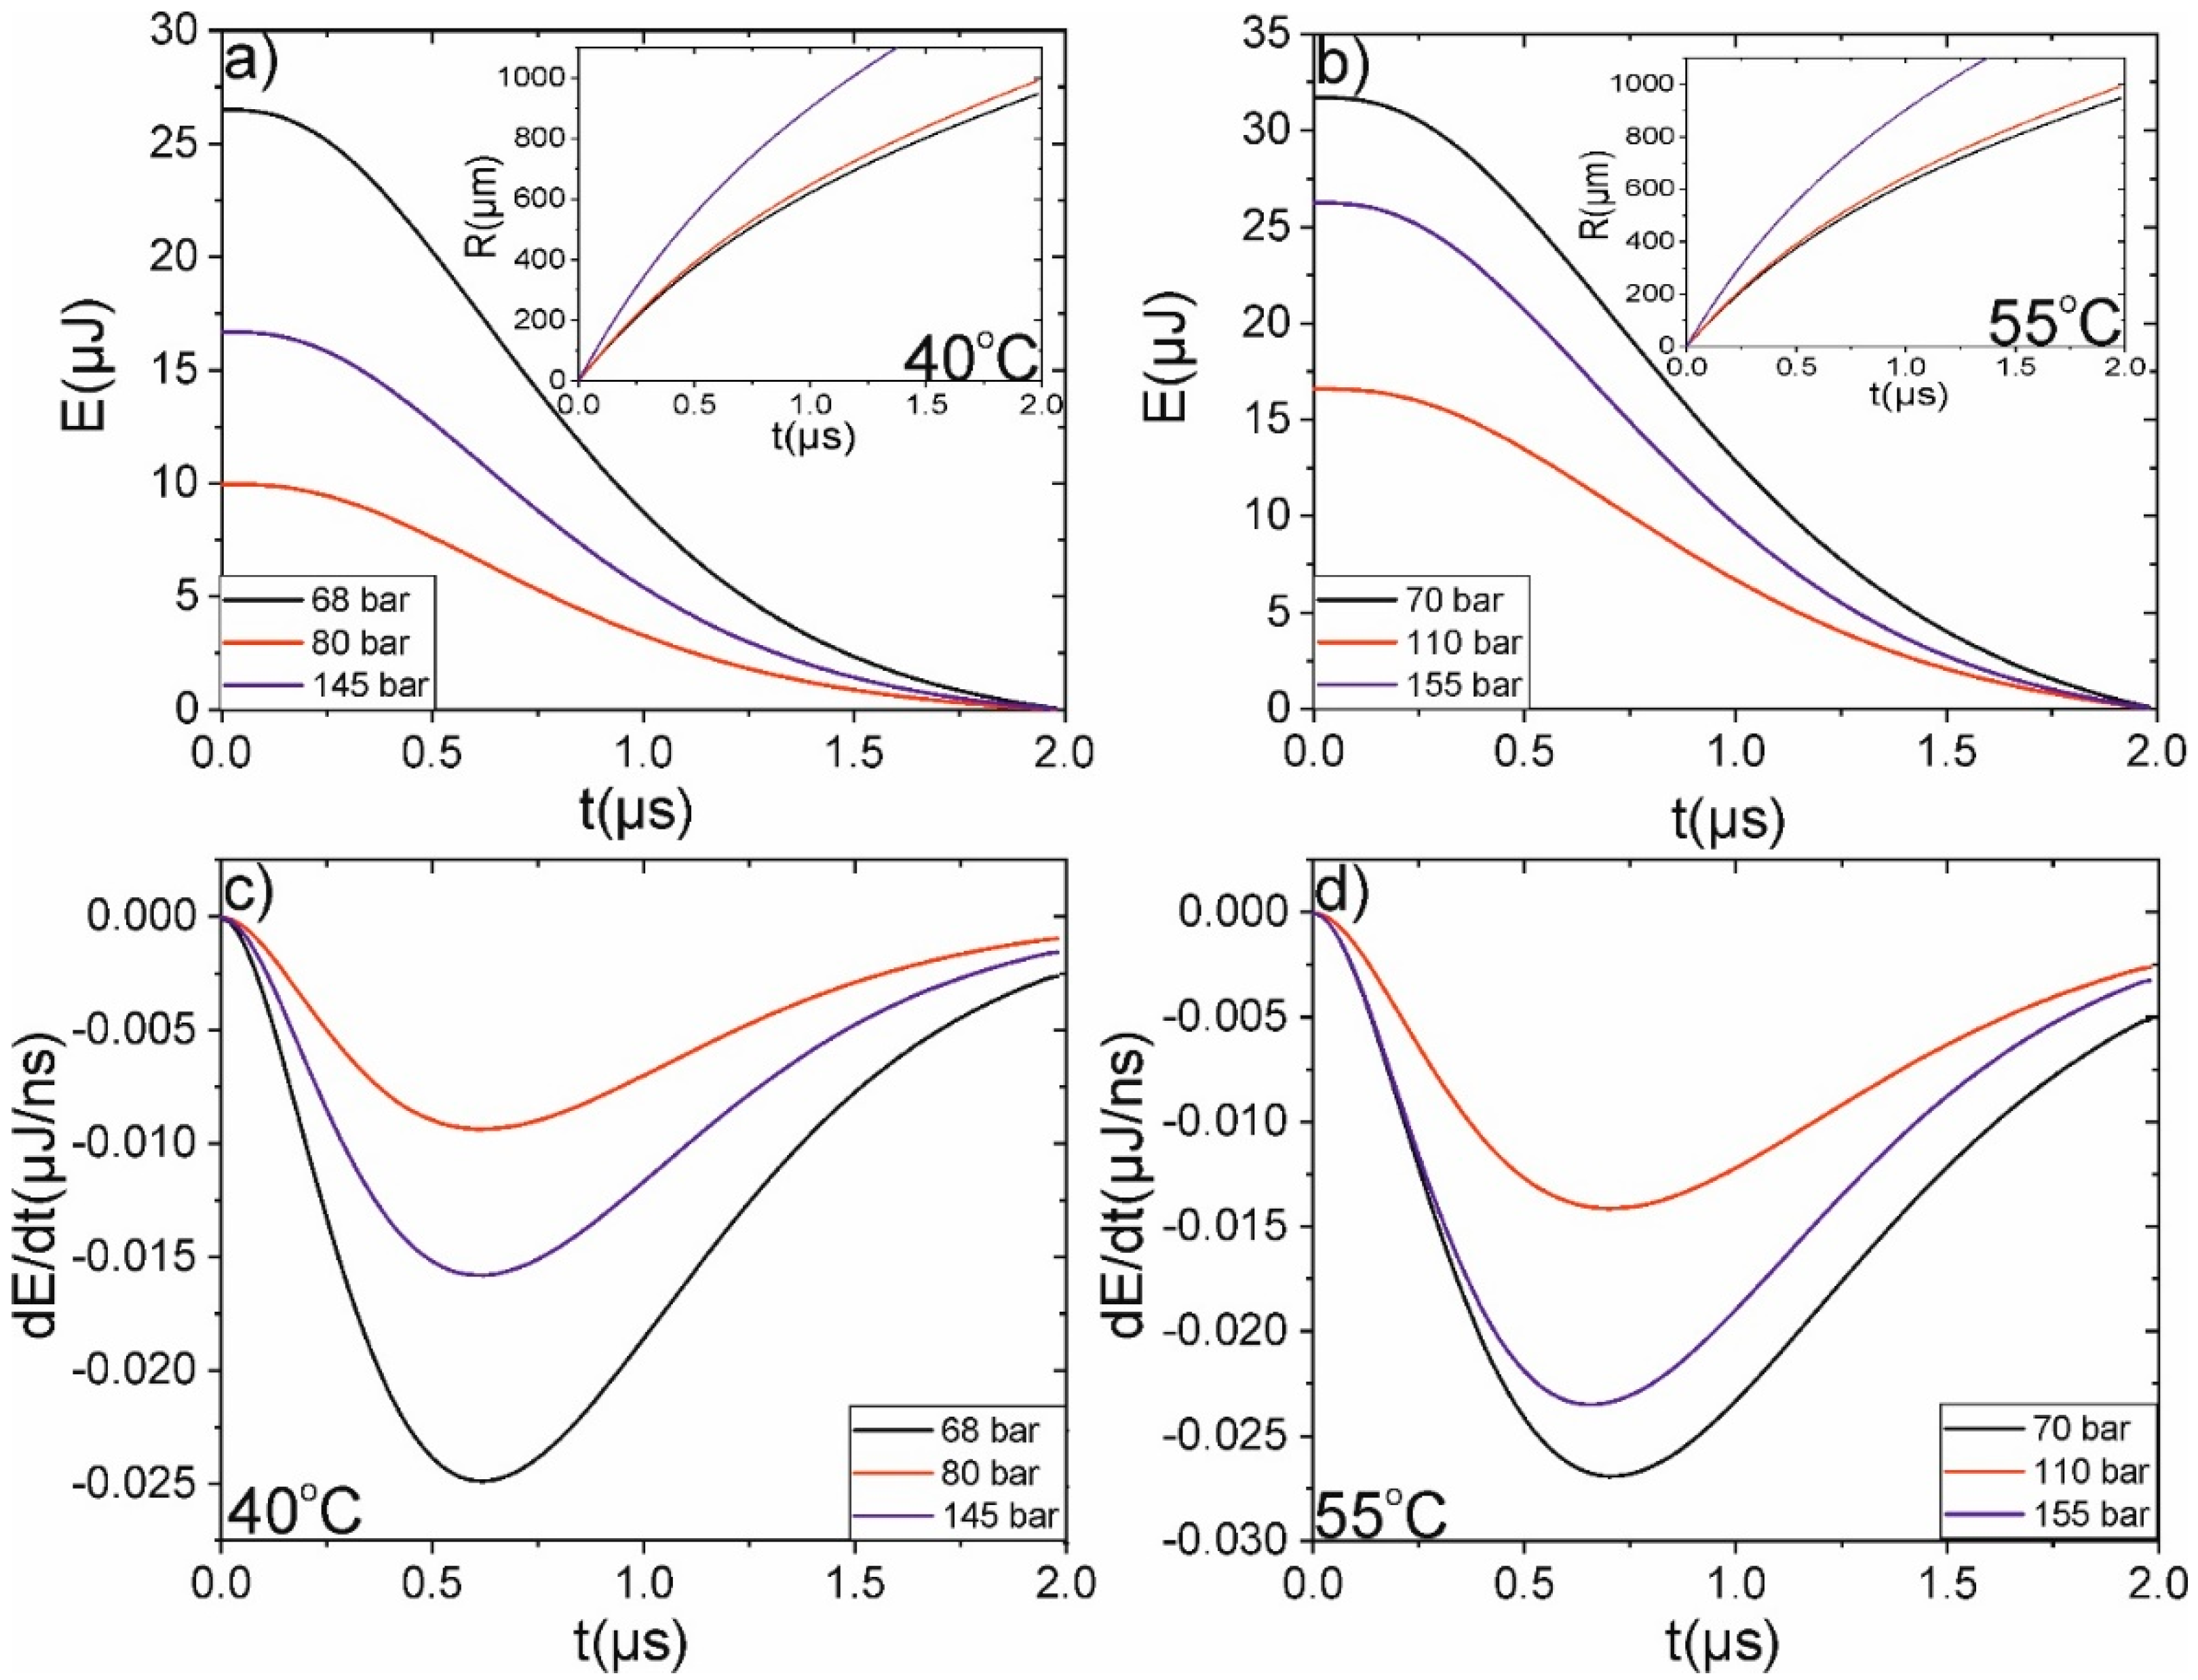
The applied approach for the retrieving of shock wave energy gives the opportunity to obtain the dynamics of the energy dissipation during propagation (see Figure 5). The energy dissipation is maximal in sub-critical CO2, and most parts of the shock wave energy are dissipated during the first 0.7 microseconds after laser impact, where the shock wave velocity is much higher than the sound velocity (M~3–4). Nevertheless, the radius of the shock wave rapidly grows, and the energy density in each point drops. At time delays greater than 1 μs, the shock wave velocity is close to the sound velocity and becomes equal to it after 2 μs, which leads to a decrease in energy losses. As a result, there is a minimum in Figure 5c,d. It also leads to the fact that the lower energy shock waves (for higher CO2 pressures) could travel a longer distance due to higher sound speed.
Comparing the dynamics of laser-induced mechanical post-effects in water and scCO2, we distinguished the following main differences. The shock wave pressure and energy in scCO2 are about one order lower than in water (for similar laser energies and durations [27]); in water, the shock wave is generated at delays two orders of magnitude less than in scCO2; in water, the shock waves decays faster and travels shorter distances than in scCO2. Higher pressures and energies in water are caused by its greater density; moreover, water can be considered an incompressible liquid. This fact also leads to a shock wave decay rate. The difference in the shock wave generation time is a result of the slower decay time of bubble wall velocity; as a result, the shock wave in CO2 travels with a bubble wall greater period of time (~100 ns in scCO2 and ~1 ns in water).
4. Conclusions
To sum up, we studied the dynamics of shock waves induced by the nanosecond laser pulses in supercritical CO2. The microstructure of supercritical CO2, namely medium-sized clusters separated by the “empty” space, leads to the drop of laser energy conversion to the shock wave and a local minimum in the dependence of shock wave speed, pressure, and energy. The effect is less pronounced for high temperatures, where clusterization is smaller. The shock wave pressure can reach 0.55 GPa for 155 bar and 55 °C; it would be greater for higher densities of scCO2.
Author Contributions
Conceptualization, E.M.; methodology, E.M.; software, E.M.; validation, N.A.; formal analysis, E.M.; investigation, E.M. and N.A.; resources, E.M.; data curation, E.M.; writing—original draft preparation, E.M. and N.A.; writing—review and editing, E.M. and N.A.; visualization, E.M.; supervision, E.M.; project administration, E.M.; funding acquisition, E.M. All authors have read and agreed to the published version of the manuscript.
Funding
This research was funded by RFBR grant 19-32-60072. The work was supported by the Ministry of Science and Higher Education as part of the work under the state task of the Federal Research Center “Crystallography and Photonics” of the Russian Academy of Sciences in terms of using the equipment of the Center for Collective Use “Structural Diagnostics of Materials” when using shadow photography.
Data Availability Statement
The data presented in this study are available on request from the corresponding author. The data are not publicly available due to privacy.
Conflicts of Interest
The authors declare no conflict of interest.
References
- Alekseev, E.S.; Alentiev, A.Y.; Belova, A.S.; Bogdan, V.I.; Bogdan, T.V.; Bystrova, A.V.; Gafarova, E.R.; Golubeva, E.N.; Grebenik, E.A.; Gromov, O.I.; et al. Supercritical Fluids in Chemistry. Russ. Chem. Rev. 2020, 89, 1337–1427. [Google Scholar] [CrossRef]
- Gutiérrez Ortiz, F.J.; Kruse, A. The Use of Process Simulation in Supercritical Fluids Applications. React. Chem. Eng. 2020, 5, 424–451. [Google Scholar] [CrossRef]
- Mareev, E.; Semenov, T.; Lazarev, A.; Minaev, N.; Sviridov, A.; Potemkin, F.; Gordienko, V. Optical Diagnostics of Supercritical CO2 and CO2-Ethanol Mixture in the Widom Delta. Molecules 2020, 25, 5424. [Google Scholar] [CrossRef] [PubMed]
- Bolmatov, D.; Zav’Yalov, D.; Gao, M.; Zhernenkov, M. Structural Evolution of Supercritical CO2 across the Frenkel Line. J. Phys. Chem. Lett. 2014, 5, 2785–2790. [Google Scholar] [CrossRef] [Green Version]
- Yang, C.; Brazhkin, V.V.; Dove, M.T.; Trachenko, K. Frenkel Line and Solubility Maximum in Supercritical Fluids. Phys. Rev. E-Stat. Nonlinear Soft Matter Phys. 2015, 91, 012112. [Google Scholar] [CrossRef] [Green Version]
- Xu, L.; Kumar, P.; Buldyrev, S.V.; Chen, S.H.; Poole, P.H.; Sciortino, F.; Stanley, H.E. Relation between the Widom Line and the Dynamic Crossover in Systems with a Liquid-Liquid Phase Transition. Proc. Natl. Acad. Sci. USA 2005, 102, 16558–16562. [Google Scholar] [CrossRef] [Green Version]
- Ha, M.Y.; Yoon, T.J.; Tlusty, T.; Jho, Y.; Lee, W.B. Widom Delta of Supercritical Gas-Liquid Coexistence. J. Phys. Chem. Lett. 2018, 9, 1734–1738. [Google Scholar] [CrossRef] [Green Version]
- Yoon, T.J.; Ha, M.Y.; Lee, W.B.; Lee, Y.W. A Corresponding-State Framework for the Structural Transition of Supercritical Fluids across the Widom Delta. J. Chem. Phys. 2019, 150, 154503. [Google Scholar] [CrossRef]
- Mareev, E.I.; Sviridov, A.P.; Gordienko, V.M. The Anomalous Behavior of Thermodynamic Parameters in the Three Widom Deltas of Carbon Dioxide-Ethanol Mixture. Int. J. Mol. Sci. 2021, 22, 9813. [Google Scholar] [CrossRef]
- Fomin, Y.D.; Ryzhov, V.N.; Tsiok, E.N.; Brazhkin, V.V. Thermodynamic Properties of Supercritical Carbon Dioxide: Widom and Frenkel Lines. Phys. Rev. E-Stat. Nonlinear Soft Matter Phys. 2015, 91, 022111. [Google Scholar] [CrossRef]
- Mareev, E.I.; Aleshkevich, V.A.; Potemkin, F.V.; Minaev, N.V.; Gordienko, V.M. Molecular Refraction and Nonlinear Refractive Index of Supercritical Carbon Dioxide under Clustering Conditions. Russ. J. Phys. Chem. B 2019, 13, 1214–1219. [Google Scholar] [CrossRef]
- Sedunov, B. The Analysis of the Equilibrium Cluster Structure in Supercritical Carbon Dioxide. Am. J. Anal. Chem. 2012, 3, 899–904. [Google Scholar] [CrossRef] [Green Version]
- Bolmatov, D.; Brazhkin, V.V.; Trachenko, K. Thermodynamic Behaviour of Supercritical Matter. Nat. Commun. 2013, 4, 1–7. [Google Scholar] [CrossRef] [PubMed] [Green Version]
- Bolmatov, D. The Phonon Theory of Liquids and Biological Fluids: Developments and Applications. J. Phys. Chem. Lett. 2022, 13, 7121–7129. [Google Scholar] [CrossRef] [PubMed]
- Stauss, S.; Muneoka, H.; Terashima, K. Review on Plasmas in Extraordinary Media: Plasmas in Cryogenic Conditions and Plasmas in Supercritical Fl Uids. Plasma Sources Sci. Technol. 2018, 27, 023003. [Google Scholar] [CrossRef]
- Muneoka, H.; Himeno, S.; Urabe, K.; Stauss, S.; Suemoto, T.; Terashima, K. Dynamics of Cavitation Bubbles Formed by Pulsed-Laser Ablation Plasmas near the Critical Point of CO2. J. Phys. D Appl. Phys. 2019, 52, 025201. [Google Scholar] [CrossRef]
- Urabe, K.; Kato, T.; Stauss, S.; Himeno, S.; Kato, S.; Muneoka, H.; Baba, M.; Suemoto, T.; Terashima, K. Dynamics of Pulsed Laser Ablation in High-Density Carbon Dioxide Including Supercritical Fluid State. J. Appl. Phys. 2013, 114, 143303. [Google Scholar] [CrossRef]
- Wang, J.S.; Wai, C.M.; Brown, G.J.; Apt, S.D. Two-Dimensional Nanoparticle Cluster Formation in Supercritical Fluid CO2. Langmuir 2016, 32, 4635–4642. [Google Scholar] [CrossRef]
- Sokolowski-Tinten, K.; Von Der Linde, D. Ultrafast Phase Transitions and Lattice Dynamics Probed Using Laser-Produced X-ray Pulses. J. Phys. Condens. Matter 2004, 16, R1517. [Google Scholar] [CrossRef]
- Winter, J.; Rapp, S.; Mcdonnell, C.; Spellauge, M. Time-Resolved Pump-Probe Microscopy of Ultrashort Laser Pulse Irradiated Bulk Aluminum and Stainless Steel. In Proceedings of the Lasers in Manufacturing Conference 2019, Munich, Germany, 24–27 June 2019; pp. 1–7. [Google Scholar]
- Lenzner, M.; Krüger, J.; Sartania, S.; Cheng, Z.; Spielmann, C.; Mourou, G.; Kautek, W.; Krausz, F. Femtosecond Optical Breakdown in Dielectrics. Phys. Rev. Lett. 1998, 80, 4076–4079. [Google Scholar] [CrossRef]
- Schaffer, C.; Nishimura, N.; Glezer, E.; Kim, A.; Mazur, E. Dynamics of Femtosecond Laser-Induced Breakdown in Water from Femtoseconds to Microseconds. Opt. Express 2002, 10, 196–203. [Google Scholar] [CrossRef] [PubMed]
- Vogel, A.; Busch, S.; Parlitz, U. Shock Wave Emission and Cavitation Bubble Generation by Picosecond and Nanosecond Optical Breakdown in Water. J. Acoust. Soc. Am. 1996, 100, 148–165. [Google Scholar] [CrossRef]
- Noack, J.; Hammer, D.X.; Noojin, G.D.; Rockwell, B.A.; Vogel, A. Influence of Pulse Duration on Mechanical Effects after Laser-Induced Breakdown. J. Appl. Phys. 1998, 83, 7488–7495. [Google Scholar] [CrossRef]
- Vogel, A.; Noack, J. Shock wave energy and acoustic energy dissipation after laser-induced breakdown. Proc. SPIE 1998, 3254, 180–189. [Google Scholar]
- Linz, N.; Freidank, S.; Liang, X.X.; Vogel, A. Wavelength Dependence of Femtosecond Laser-Induced Breakdown in Water and Implications for Laser Surgery. Phys. Rev. B-Condens. Matter Mater. Phys. 2016, 94, 024113. [Google Scholar] [CrossRef] [Green Version]
- Lauterborn, W.; Vogel, A. Bubble Dynamics and Shock Waves; Delale, C.F., Ed.; Springer: Berlin/Heidelberg, Germany, 2013; ISBN 978-3-642-34296-7. [Google Scholar]
- Mareev, E.; Minaev, N.; Epifanov, E.; Tsymbalov, I.; Sviridov, A.; Gordienko, V. Time-Resolved Optical Probing of the Non-Equilibrium Supercritical State in Molecular Media under Ns Laser-Plasma Impact. Opt. Express 2021, 29, 33592. [Google Scholar] [CrossRef]
- Noack, J.; Vogel, A. Single-Shot Spatially Resolved Characterization of Laser-Induced Shock Waves in Water. Appl. Opt. 1998, 37, 4092–4099. [Google Scholar] [CrossRef] [Green Version]
- Mareev, E.I.; Rumiantsev, B.V.; Potemkin, F.V. Study of the Parameters of Laser-Induced Shock Waves for Laser Shock Peening of Silicon. JETP Lett. 2020, 112, 739–744. [Google Scholar] [CrossRef]
- Crandall, L.E.; Rygg, J.R.; Spaulding, D.K.; Boehly, T.R.; Brygoo, S.; Celliers, P.M.; Eggert, J.H.; Fratanduono, D.E.; Henderson, B.J.; Huff, M.F.; et al. Equation of State of CO2 Shock Compressed to 1 TPa. Phys. Rev. Lett. 2020, 125, 165701. [Google Scholar] [CrossRef]
- Vogel, A.; Noack, J.; Nahen, K.; Theisen, D.; Busch, S.; Parlitz, U.; Hammer, D.X.; Noojin, G.D.; Rockwell, B.A. Energy Balance of Optical Breakdown in Water at Nanosecond to Femtosecond Time Scales. Appl. Phys. B 1999, 68, 271–280. [Google Scholar] [CrossRef]
- Potemkin, F.V.; Mareev, E.I. Dynamics of Multiple Bubbles, Excited by a Femtosecond Filament in Water. Laser Phys. Lett. 2015, 12, 015405. [Google Scholar] [CrossRef]
- NIST Database. Available online: http://webbook.nist.gov/ (accessed on 25 October 2022).
- Surov, V.S. Shock Adiabat of a Multivelocity Heterogeneous Medium. J. Eng. Phys. Thermophys. 2012, 85, 302–305. [Google Scholar] [CrossRef]
- Nigmatulin, R.I.; Bolotnova, R.K. Wide-Range Equation of State for Water and Steam: Method of Construction. High Temp. 2008, 46, 182–193. [Google Scholar] [CrossRef]
- Cockrell, C.J.; Dicks, O.; Wang, L.; Trachenko, K.; Soper, A.K.; Brazhkin, V.V.; Marinakis, S. Experimental and modeling evidence for structural crossover in supercritical CO2. Phys. Rev. E 2020, 101, 1–6. [Google Scholar] [CrossRef]
- Jiang, L.; Tsai, H.L. A Plasma Model Combined with an Improved Two-Temperature Equation for Ultrafast Laser Ablation of Dielectrics. J. Appl. Phys. 2008, 104, 093101. [Google Scholar] [CrossRef]
- Kato, T.; Stauss, S.; Kato, S.; Urabe, K.; Baba, M.; Suemoto, T.; Terashima, K. Pulsed Laser Ablation Plasmas Generated in CO2 under High-Pressure Conditions up to Supercritical Fluid. Appl. Phys. Lett. 2012, 101, 2–7. [Google Scholar] [CrossRef]
Figure 1.
Experimental setup. The energy of the pump pulse is 400 μJ, the wavelength is 1053 nm, the time duration is 6 ns, and the repetition frequency is 10 Hz. The pump pulse focused into the supercritical cell. The pressure and temperature in the cell are varied from 1 bar up to 160 bar (measurement error ~0.1 bar) and from 20 °C up to 60 °C (measurement error ~0.1 °C). In CO2 (99.99% purity) shock waves and cavitation bubbles were generated. The probe pulse is scattered on the diffusion plate and collected by the lens on the CCD camera.

Figure 2.
(a–f) Shadow photographs of the laser-induced shock waves and the cavitation bubbles for various time delays between the pump and the probe pulses in scCO2, p = 75 bar, T = 40 °C. (g) The evolution of the shock wave diameter in scCO2, p = 75 bar, T = 40 °C, and the laser pulse energy is 400 μJ. The fitting is performed with the assumption that the shock wave velocity changes following Equation (4).

Figure 3.
(a,b) Dependence of the sound velocity (black line), shock wave velocity (red line) and the Mach number—the ratio of flow velocity to the local speed of sound (blue dots) on the pressure inside the cell for different temperatures. Dash–dot line indicates the Widom line (the minimum sound speed). (c) Dependence of the adiabatic index on pressure for different temperatures based on the data from [33]. The maxima in (c) correspond to the Widom line.

Figure 4.
(a,b) Dependence of the shock wave energy (black line) and shock wave pressure (red bar) on the pressure inside the supercritical cell for different temperatures. Dash–dot line indicates the Widom line (the minimum sound speed).
Figure 4.
(a,b) Dependence of the shock wave energy (black line) and shock wave pressure (red bar) on the pressure inside the supercritical cell for different temperatures. Dash–dot line indicates the Widom line (the minimum sound speed).

Figure 5.
(a,b) Dependences of the shock wave energy and shock wave radius (see insets) on time delay for different pressures and temperatures. The insets show the evolution of the shock wave radius for different pressures. (c,d) Dependence of the energy decrease rates on time delay for different pressures and temperatures. The presented dependences are obtained from the numeric simulation based on the experimentally observed values of shock wave velocities and decay rates, using Equations (3)–(6).

Publisher’s Note: MDPI stays neutral with regard to jurisdictional claims in published maps and institutional affiliations. |
© 2022 by the authors. Licensee MDPI, Basel, Switzerland. This article is an open access article distributed under the terms and conditions of the Creative Commons Attribution (CC BY) license (https://creativecommons.org/licenses/by/4.0/).
Share and Cite
MDPI and ACS Style
Asharchuk, N.; Mareev, E. Dynamics of Laser-Induced Shock Waves in Supercritical CO2. Fluids 2022, 7, 350. https://doi.org/10.3390/fluids7110350
AMA Style
Asharchuk N, Mareev E. Dynamics of Laser-Induced Shock Waves in Supercritical CO2. Fluids. 2022; 7(11):350. https://doi.org/10.3390/fluids7110350
Chicago/Turabian StyleAsharchuk, Nika, and Evgenii Mareev. 2022. "Dynamics of Laser-Induced Shock Waves in Supercritical CO2" Fluids 7, no. 11: 350. https://doi.org/10.3390/fluids7110350