Article

Numerical Study of Bamboo Breakwater for Wave Reduction

Ocean Engineering Department, Faculty of Marine Technology, Institut Teknologi Sepuluh Nopember, Surabaya 60111, Indonesia
*
Author to whom correspondence should be addressed.
Fluids 2022, 7(1), 14; https://doi.org/10.3390/fluids7010014
Submission received: 20 October 2021 / Revised: 20 December 2021 / Accepted: 21 December 2021 / Published: 30 December 2021
(This article belongs to the Special Issue Hydrodynamics and Its Interaction with Structures)

Abstract

:
Flood inundation and shoreline erosion have long occurred in Sayung, Demak area, the northern coast of Central Java Province, Indonesia. The people of Sayung planted mangroves to reduce the flood inundation and shoreline erosion in that area. They built the bamboo array to protect the juvenile mangroves from incoming waves. The bamboo acts as a breakwater and is considered an environmentally friendly permeable structure to reduce wave energy and stimulate sedimentation. This paper discusses three bamboo arrays’ effectiveness in wave reduction using Numerical Wave Tank (NWT). The interaction of regular waves with a permeable structure comprising a single row of vertical circular poles was conducted based on the Smoothed Particle Hydrodynamics (SPH) method. The effect of different waves and structural dimensions on the permeable structure was investigated based on the structure’s transmission coefficient (Kt) performance. The investigations have revealed that structures with the combination of Vertical-Horizontal formation (VH) attenuate more wave energy than Vertical Only (VO) and the combination of Vertical-Diagonal formation (VD). As the wave steepness increases, the transmission coefficient decreases. Likewise, the transmission coefficient (Kt) is decreasing when the wave height is increasing. On the other hand, the transmission coefficient (Kt) increases as the wave period increases. As the structure spacing ratio between end-to-end and center-to-center spacing (e/S) rises, the transmission coefficient (Kt) also increases. The diameter (D) has a slight effect on the transmission coefficient (Kt). However, the center-to-center spacing (S) has a more significant impact than the diameter on the transmission coefficient, affecting an inclination on the transmission coefficient (Kt) when center-to-center spacing (S) goes up.

Graphical Abstract

1. Introduction

The high intensity and frequency of destructive flood events in the coastal area, one of the devastating disasters for the inhabitants, has been increasing due to major urbanization events for several decades [1]. Sea level rise (SLR), without a doubt, also aggravates the damage and causes the coastal area to be prone to inundation, erosion, and seawater intrusion [2].
Global sea levels have been significantly rising over the past three decades. The assessment was carried out, and it was determined by the points specified in the Intergovernmental Panel on Climate Change (IPCC) report that the mean water level increased from 1993 by 16–21 cm [3]. It was also noted in the study that the global mean sea level is predicted to drastically rise by 26–77 cm by the end of this century. Consequently, the coastal region is vulnerable to drowning, and 187 million inhabitants are expected to lose their homes by the time [4]. This condition has been experienced by the people of Sayung, Demak, a coastal city in the northern part of Central Java Province [5].
The development of coastal structure by integrating the different components approaches can be a suitable holistic solution, for example, by building the structure in the sedimentation area by merging the mangroves plantation and the dike structure. Wetlands International’s initiative combines ecosystem benefits such as mangroves into water infrastructure practice. It has shown to be a successful participatory strategy for coastal, river, lake, and delta management, combining ecological restoration and engineered solutions in the most effective way possible. The initiative is currently being implemented in several nations around the world, ranging from Southeast Asia to Capital Africa [6]. The idea is not only effective to be applied, but it will also have a solid environmental advantage as the mangroves become a part of the solution [7]. Some constructions around the world have been established using this hybrid technology. For example, the Wadden Sea Coast of the Netherlands and Germany is protected by the Wide Green Dikes, a hybrid of dikes. The structure was designed in response to gradually sloping grass-covered dikes that blend seamlessly into the surrounding salt marshes. Wide green dikes covered the construction with clay and grass rather than asphalt or stone. The construction is primarily made of sand, and the dikes are almost entirely made of green materials. The dikes, like traditional dikes, have already met the required safety standards. Furthermore, it cost 0.8 million euros per kilometer, less expensive than conventional dikes [8]. In short, it has shown that environmental flood management is much more sustainable and effective, even in terms of expenditure, compared with other conventional solutions [9].
Mangroves grow along sheltered tropical and subtropical coastlines. They cannot grow naturally in areas with strong erosion. Instead, the wave energy has to be reduced; therefore, sedimentation can be stimulated before the mangrove rehabilitation is implemented in sites where erosion has destroyed them [10]. Restoration of morphodynamic conditions, such as the fine sediment balance, is essential for mangrove rehabilitation in erosion sites [6]. Regarding this type of coastal management, the permeable structure made of a bamboo array is generally constructed to ensure that the prerequisites are met. The protection system is selected to minimize wave energy while sedimentation can still be created.
This study is developed following the previous similar experiments for Demak, Central Java Province, where the investigations were carried out using the physical model and utilizing different variables [11]. In this paper, we consider the effect of hydrodynamic behavior and structure characteristics in transmitting the waves. The study investigates how regular waves interact with various arrangements of the bamboo breakwater, particularly how diameter, distance, and bamboo placement affect wave transmission. The outcome helps specify the necessary setup for the arrangement and design of the bamboo breakwater for mangrove protection.

1.1. Permeable Structures

Many research studies have been carried out using numerical or physical models to study the interaction with permeable structures. Because of the interaction with the structure face, the initial waves seaward of a porous structure are composed of the incident and reflected waves. A small amount of wave energy will be lost inside the structure due to breaking and dissipation, but the remaining energy will be transmitted outside the porous structures [12]. Previous research on the porosity structure has found that width and porosity influence wave reflection and transmitted wave height [13]. Meanwhile, their research was not focused on how the diameter of the poles and the distance between them affect wave transmission.
Hydrodynamic parameters such as wave height and water elevation may influence wave energy reduction. Schmitt and Albers [7] conducted a physical investigation in a flume tank. On a scale of 1:20, they built a bamboo breakwater with two rows of bamboo with brushwood filling the gap between them. The water surface was set above the fence’s crest and below the fence’s crest. When the water level is above the crest of the bamboo fence, the transmission coefficient calculated from field measurements is roughly 0.75, resulting in a 25% drop in the initial wave height. On the other hand, the transmission coefficient is between 0.60 and 0.20 when the water level falls below the crest of the bamboo barrier. The water elevation in our study is placed below the crest of the fence. Furthermore, the water level condition changes following the current scenario in Sayung, Demak.
Dao, Stive, and Hofland [14] plotted the effect of wooden fences’ parameters on the wave damping. They adjusted the thickness of the wooden fences and the spatial density of the wooden components used in the fences. They use SWAN to model the wooden fences. The result stated that the increased Ursell number and relative fence thickness Bf/Lp reduced the transmitted wave height (Kt). Bf is the fence thickness, and Lp is the peak wavelength. The wave transmission coefficient varies from 0.95 to 0.90 for the range of Bf/Lp from 0.15 to 0.20 for submerged instances when the Ursell number is less than 16. Kt varies from 0.85 to 0.70 for the emergent cases, with Ursell numbers from 16 to 30. In short, with increasing fence thickness and spatial density, wave damping rises. The wave damping increases along with the thickness of the wooden fences.
Although the porosity of the wooden fences placed among the bamboos is not investigated in this paper, this variable can indicate a suitable solution to propose., Quang and Trong [15] are concerned with the transmission wave at bamboo fences. The experiment used a numerical flume tank and set the variation of width and height of bamboo along with the porosity of the brushwood. They develop the following formula to help to design the bamboo fences according to the desired wave transmission:
K t = 0.06 R c H s + 0.60 ( P f · B d ) 0.20 [ 1 e x p ( 0.30 S 0 p ) ]
where Hs represents the incoming significant wave height before the fences, Rc is the fence crest freeboard relative to the still water level (Rc > 0 for emerged fences, Rc < 0 for submerged fences). Rc/Hs is the ratio of the fence freeboard above the still water level Rc to the incident wave height Hs. B is the fence width, Pf is a fence porosity factor, S0p is the fictitious wave steepness, and d is the local water depth at the fence section. For example, suppose the observation site’s typical high monsoon wave forcing (Rc = 0.30 m, d = 1.20 m, Hsi = 0.60 m, Tp = 6.0 s) and the allowable wave height behind the fence is assumed to be less than 0.30 m. In that case, several design alternatives meet the criteria, such as using B = 0.80 m with n = 0.50, B = 2.30 m with n = 0.60, or B = 6.4 m with n = 0.70. The study states that porosity has a massive influence.
Rao, Rao, and Sathyanarayana [16] conducted a similar experiment using piles. The main difference between this experiment and the one described in this study is that they employed perforated hollow piles rather than unperforated piles. The experiments were carried out in a two-dimensional wave flume with single and double wall pile walls. They looked at how wave transmission is affected by water depth (h), incident wave steepness, the clear width between piles (B), and pile row spacing (b). In the end, they concluded that (1) at increased wave steepness, water depth has little effect on Kt for both nonperforated and perforated pile groups, (2) for both nonperforated and perforated piles, transmission coefficient falls as incident wave steepness rises, (3) for nonperforated piles, when the clear relative distance between the piles b/D decreases, the transmission coefficient Kt drops for waves of higher steepness, whereas the influence of b/D on Kt is unclear for waves of lower steepness. As b/D declines, Kt falls for all wave steepnesses examined for perforated piles, (4) two rows of nonperforated piles attenuate wave energy far better than a single row of nonperforated piles, especially at increasing wave steepness. However, wave attenuation by two rows improves marginally over a single row with perforated piles, (5) Kt first drops when the clear relative distance between the pile rows B/D increases until B/D is near 1, but then starts to climb for both nonperforated and perforated piles, and (6) the transmission coefficient Kt is not affected by the wave period alone.

1.2. Introduction of the SPH Method

The SPH method was first proposed by Gingold and Monaghan [17] and Lucy [18] for solving astrophysics issues in three-dimensional open space. Presently, the method is widely applied in free water surface studies due to its advantages. The method uses a mesh-free Langrangian approach suitable for complex flows with interfaces such as breaking waves and multiple phases of fluids [19]. In this method, the system is discretized using a considerable number of particles. In the traditional mesh form, each particle represents a medium group, and there are no direct connections between them, thereby eliminating grid distortion [20].
The SPH method in this experiment is applied in a computing software called DualSPHysics based on a weakly compressible SPH code, SPHysics (Smoothed Particle Hydrodynamics) model (www.sphysics.org, accessed on 20 October 2021). In this paper, the DualSPHysics® from Crespo [21] was used and developed from the SPHysics® model by Gomez-Gesteria [22]. The code (GNU Lesser General Public License) was created to investigate free-surface flow phenomena where Eulerian methods are difficult to use. DualSPHysics is a collection of C++ and CUDA (Compute Unified Device Architecture) routines for solving free water surfaces in real-world engineering challenges. CUDA is a parallel computing platform developed by NVIDIA® (Santa Clara, CA, US) enabling DualSPHysics to perform calculations using the CPU and GPU simultaneously. This ability lets the model simulate faster despite the limitation of computers, allowing the user to simulate a large number of particles in a short amount of time [23].
A set of material points or particles is used to discretize a continuum. The discretized Navier-Stokes equations are locally integrated at the site of each of these particles, according to the physical parameters of surrounding particles, when utilized for fluid dynamics simulation. A distance-based function, either circular (two-dimensional) or spherical (three-dimensional), determines the collection of neighboring particles with an associated characteristic length or smoothing length, generally abbreviated as h. New physical quantities are calculated for each particle at each time step, and they then move after the updated values. In the SPH method, the fluid is depicted as a set of particles or nodal points [24]. Physical quantities of each particle, such as position, velocity, density, and pressure, are computed as an interpolation of the values of the surrounding particles.
The discrete SPH method implements the Langrangian system of governing equations of weakly compressible flow. The momentum equations refer to the Monaghan equation to determine the acceleration of particle a as the result of the particle interaction with its neighbors (particles b) [25]:
d V a d t = b m b ( P b ρ b 2 + P a ρ a 2 + Π a b ) a W a b + g
Given t time, V velocity, P pressure, ρ density, m mass, g the gravitational acceleration (9.81 m × s−2), W a b is the kernel function that depends on the distance between particle a dan b, Π q b the viscous term. Further explanation regarding the equations can be found in [21,25] and the application of DualSPHysics for wave structures interaction can be read in [21,24,26,27].

2. Material and Methods

It is essential to evaluate the configurations and structural characteristics of the bamboo array to implement the solution. Therefore, a numerical-based experiment using Smoothed Particle Hydrodynamics (SPH) applied in DualSPHysics [21] is used to see the interaction of the waves and the structure. Subsequently, the most effective configurations and features can be chosen.
The SPH method is a Langrangian mesh-less method, which is increasingly used in Computational Fluid Dynamics (CFD) for a wide range of applications [22]. This approach is generally used to model the fluid dynamics, where the discretized Navier-Stokes are locally combined according to the physical properties of surrounding particles at the position of each particle [21].
A single row of bamboo poles breakwater was studied to assess the structural efficiency after interacting with the regular waves. The SPH method is used in this experiment since it is highly applied and validated for various problems of waves generation and waves breaking problems [28], dam-break behavior [29], waves-structures interaction [30], and breakwater movement [31]

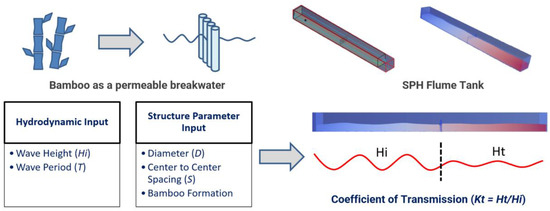
2.1. Experimental Setup

The experiment follows the study conducted by Johnson [11], whereas the data was obtained from the building with nature project in Sayung, Demak area, the northern coast of Central Java. The first step of the whole project was building the bamboo breakwater as one of the permeable breakwaters to stimulate sedimentation and reduce wave energy; thus, the mangrove can grow in a better coastal condition. The initial data from Sayung, Demak were stated that the high waves range from 0.08 m to 0.2 m and with the period around 5.5 s.
Johnson’s experiment used the ranging of wave height from 0.12 m to 0.4 m, whereas this paper uses 0.08 m, 0.09 m, 0.1 m, and 0.2 m for the wave height input. The experimental setup used in this experiment can be seen in Figure 1 which the top figure shows the x–y plane of the model, and the x–z plane is seen in the bottom figure. The investigation was conducted in the 11 m long, 1 m wide, and 1 m high Numerical Wave Tank (NWT) prepared in DualSPHysics. The NWT is equipped with a piston-type wavemaker that generates regular waves. The piston is located on the left side of the NWT, precisely at x = 0. The damping zone is prepared on the right, so the wave reflection will not interfere with the calculations.
Water elevation in NWT remains the same for every case, 0.4 m. The fixed value of 0.6 m was selected as the bamboo height, higher than the water. Therefore, the overtopping incidents will not take account of this experiment. The structure has been considered to remain stable, or it will not move when the waves hit the structure.
This study aims to evaluate the interaction between the waves and the bamboo breakwater. The observation will be made by assessing the transmission of the waves. Various variables were chosen to examine the effect of the structure on the wave transmission (see Table 1), including the wave height (Hi) 0.08 m to 0.2 m and the wave period (T) of 1.2 s and 1.6 s. The nondimensional variables (Hi/gT2) will be determined through these hydrodynamic variables.
The structural parameters of this model were also determined. It was set that the bamboo height is 0.6 m. There are two sizes of the diameter of the bamboo (D); 0.048 m and 0.06 m. The center-to-center spacing of bamboo (S) would be 0.12 m and 0.16 m. Besides those variables, there would be a nondimensional variable (e/S), which is the ratio between end-to-end spacing (e) and center-to-center spacing (S), as shown in Figure 1. NWT dimension and the wave gauge placement. (Top): x–y plane, (Bottom): x–z plane. The left side is the wave generation zone, and the right side is the wave damping zone
Apart from the variables above, the bamboo formation is also modified to see any impact on the wave transmission. Figure 2 presents three formations used in this article. Those three formations are the vertical only formation (VO), the combination of vertical poles and horizontal poles (VH), and the combination of vertical poles and diagonal poles (VD).
The NWT is also equipped with wave gauges (WG). The WGs were positioned in two separate locations to measure the wave height before and after the interaction with the structure. These WGs will record the wave height, which will later be processed to obtain the wave transmission. The wave gauges are located at x = 4.3 m for WG 1 and x = 6.5 m for WG 2.
The measure used to determine the efficiency of the structure were calculated using the wave attenuation assessment. In this case, the wave transmission will be the key indicator to assess the wave attenuation. The wave transmission can be evaluated by finding the coefficient of transmission (Kt), which will be calculated through the following equation:
K t = H t H i
where Ht is the transmitted wave height (recorded at WG 2). On the other hand, Hi is the incident wave height (recorded at WG 1). The records at WG 1 and WG 2 are evaluated using the Wavan module developed by Kamphuis [32] Following this step, the average wave height will be obtained from each wave gauge. These average wave heights are the input values for equation 3 above.

2.2. Validation

The NWT used in this experiment follows the physical model study conducted by Johnson [11]. Calibration and validation for the NWT were subsequently carried out to verify whether the NWT was in the ideal state. In this study, the calibration and validation process were completed by comparing the result from the numerical simulation and the analytical result from the 2nd wave order equation.
The SPH method used in DualSPHysics works in the depiction of a set of particles, which means that the distance of particles (dp) can be altered to achieve the desired outcome. The smaller the dp value helps the model to be more precise. In this case, the authors chose dp = 0.02 m considering the performance of the laboratory’s computer. Each simulation was run for 20 s using the wave gauge placed at x = 2.5 m from the model.
The calibration and validation show the result that can be seen in Figure 3. Following the figure, the graph shows the satisfying outcome of the calibration and validation which later the cases can be run in this NWT. The error/deviation between the simulation and the analytical theory based on Root Mean Squared Error (RMSE) evaluation is about 0.015.

3. Result and Discussion

The study result was represented in graphs that show the correlation between the non-dimensional variables versus Kt. Both types of variables determine the assessment of wave transmission. In total, 75 cases are running in this experiment. 45 cases of them are the main cases for the variables shown in Table 1, while the remaining cases are used to determine the upper and lower limits of the Kt.

3.1. Wave Steepness

The wave steepness used in this study covers the value of 0.032, 0.036, 0.064, 0.071, and 0.142. The outcome of the calculation of the wave steepness is shown in Figure 4. In the graph, it can be seen that Kt decreases as the steepness of the wave increases. As the wave steepness increases, this pattern of reduction in Kt is triggered by considering the wave-particle motion. The water particle velocity and acceleration increase as the wave steepness increases. The water particle velocity and acceleration suddenly change in the motion of water particles when a wave comes through the pile breakwater. Therefore, the steeper the wave, the more is turbulence. The interpretation is further clarified in Rao’s study [16].

3.2. Wave Height

The wave height Hi used in this study were 0.08 m, 0.09 m, 0.1 m, and 0.2 m. Figure 5 demonstrates the influences of wave height on wave transmission (Kt). The x-axis represents the variation of e/S, and the y-axis shows the corresponding value of Kt. The effect [14] of wave height and gap ratio on the transmission coefficient is shown in Figure 5a. The trend in every graph shows almost the same pattern. Hi increases, then Kt will decrease. The reduction trend of Kt as the increment of wave height does not always mean that the structure will perform better in the higher wave height. The shown results generally indicate that the wave–particle motion mostly reduces the Kt patterns (as discussed in Section 3.1). In general, the greater the wave height, the more unstable the structure. However, the bamboo structure is assumed to remain stable for all cases in this experiment.

3.3. Wave Period

The provided graphs in Figure 5 illustrate two different wave periods, 1.2 s and 1.6 s. The difference between both wave periods can be seen by plotting the correlation between the e/S ratio and Kt. Figure 5b shows that as the wave periods increase, the value of Kt decreases except at a higher e/S ratio on VO formation. The 1.2 s wave period appears to have a lower value of Kt than the 1.6 s wave period. The patterns suggest that the 1.2 s wave period tends to be more effective at attenuating waves. However, specific experiments stated that the wave period alone does not directly influence the phenomenon of wave attenuation, but it is the combination of other parameters along with the wave period [14].

3.4. Ratio of e/S

The e/S ratio is the comparison of end-to-end spacing and center-to-center spacing. In this study, the e/S ratio of 0, 0.5, 0.6, and 0.7 are used. The e/S = 0 means there is no gaps in the bamboo rows, while the gap of one bamboo diameter has e/S = 0.5. The value of 0 and 0.7 are applied to define the upper and lower limits in the Kt value. The outcome of the Kt measurement can be observed in Figure 4 and Figure 5. The trends of the given graph show that the increase of e/S influences the rise in the value of Kt. It can be seen that the 0.7 ratio has a greater wave transmission than the other e/S. However, the value of Kt gradually drops as the e/S decreases. The smaller value of e/S provides better attenuating wave performance as the surface area of the structure directly struck by the wave is broader than that of the greater values. Therefore, the wave-particle motion suddenly changes and generates turbulence (see Section 3.1). The values of 0.5 and 0.6, in Figure 4, show nearly precise trends. It shows no significant difference between e/S = 0.5 to e/S = 0.6. The effect of diameter (D) and center-to-center spacing (S) will be further addressed for further investigations.

3.5. Bamboo Diameter (D)

The influence of 0.048 m and 0.06 m bamboo diameters was investigated. The diameter of the bamboo is based on various sizes of bamboo prototypes used in the building with nature project in Sayung, Demak. The size of the bamboo prototype is in the range of 12 and 15 cm, which corresponds to 0.048 m and 0.06 m in this model. The center-to-center spacing for every case is the same, 0.12 m. The result of this analysis is demonstrated in Figure 6a. It can be seen that the 0.048 m and 0.06 m show nearly the same results. There is almost no distinction between the two graphs. Nevertheless, the difference is not significantly seen. The diameter of the bamboo piles seems insignificant in wave reduction.

3.6. Center-to-Center Spacing (S)

The center-to-center spacing (S) ranges from 0.12 m to 0.16 m. The bamboo diameter remains the same, with a value of 0.048 m. The outcome of the calculation can be seen in Figure 6b. The graph shows a different effect than the bamboo diameter graphs. The S values appear to have a significant impact on Kt. Kt would rise as the S increases, implying that if the distance between the bamboos is wider, the structure performance in attenuating waves was reduced. In this case, the 0.012 m S gives a better value of Kt.

3.7. Formation of Bamboo Poles

The arrangement of bamboo poles breakwater consists of three formations, VO, VH, and VD (see Figure 2). The influences of the formations on the wave transmission will be evaluated by the same values of e/S. As shown in Figure 7, all formations have similar wave transmission for the bamboo formation without gaps (e/S = 0). However, the VH structure appears to be the best formation to attenuate the wave by presenting the lowest value of Kt. The VH and VD formations would have better performance than VO. On the other hand, as seen in the graph, VH formation slightly outperforms VD formation.

4. Conclusions

A series of simulations have been performed to analyze the reduction of the regular waves on a single-row bamboo poles breakwater. The NWT was created in DualSPHysics software and consists of 75 cases. The developed numerical model was first validated using the analytical theory and showed good agreement against theoretical and numerical data. The effects of wave height, wave period, and structure characteristics, such as the diameter, center-to-center spacing, and the formation of the bamboo breakwater, were presented and discussed.
Hydrodynamic behavior was analyzed in several dimensional and nondimensional variables that affect the wave attenuation phenomenon. The results showed that the Kt decrease when wave steepness (Hi/gT2) increases, wave height (Hi) increases, and wave period (T) decreases. As the wave steepness increases, this pattern of reduction in Kt is triggered by considering the wave-particle motion. The water particle velocity and acceleration increase as the wave steepness increases. The water particle velocity and acceleration suddenly change in the motion of water particles when a wave comes through the pile breakwater. Therefore, the steeper the waves, the more is turbulence. However, the wave period in some experiments was considered not to influence wave attenuation unless it combined other parameters along with the wave period.
The dimensional and nondimensional variables were also analyzed and discussed regarding the bamboo characteristics. The results came up with a statement that the Kt would be in the better (has lower values) when e/S decreases, D increases, and S decreases. In the structural characteristics, the broader surface area struck by the waves will increase the performance in attenuating the wave. The surface area determines the wave–particle motion. It is known that S has a more significant effect in attenuating waves than D since the distance between the bamboos quickly affects the surface area.
The VH and VD formations had far better performance than VO since both formations combined two configurations of poles and broadened the impacted surface area. However, despite the slight difference between VH and VD, VH formation outperforms VD formation in attenuating waves.

Author Contributions

Conceptualization, H.D.A., B.H.B. and S. (Sholihin); methodology, H.D.A., S. (Sujantoko), S. (Sholihin) and B.H.B.; software, H.D.A., S. (Sujantoko) and B.H.B.; validation, H.D.A., S. (Sujantoko) and B.H.B.; formal analysis, H.D.A., S. (Sujantoko) and B.H.B.; investigation, H.D.A. and B.H.B.; resources, B.H.B.; data curation, H.D.A. and B.H.B.; writing—original draft preparation, B.H.B.; writing—review and editing, H.D.A. and B.H.B.; visualization, H.D.A. and B.H.B.; supervision, H.D.A. and S. (Sholihin); project administration, H.D.A. and S. (Sujantoko); funding acquisition, H.D.A. All authors have read and agreed to the published version of the manuscript.

Funding

Funding for publication was obtained from Directorate Research and Community Service, Institut Teknologi Sepuluh Nopember, Surabaya, Indonesia.

Acknowledgments

This experimental investigation was conducted in Hydro-informatics Lab at the Ocean Engineering Departments, Institut Teknologi Sepuluh Nopember, Indonesia. This work is a part of a thesis submitted by the second author to the Institut Teknologi Sepuluh Nopember to fulfill his degree program. Support funding for publication from Directorate Research and Community Service, Institut Teknologi Sepuluh Nopember was gratefully acknowledged.

Conflicts of Interest

The authors declare no conflict of interest.

References

  1. Buchori, I.; Sugiri, A.; Mussadun, M.; Wadley, D.; Liu, Y.; Pramitassari, A.; Pamungkas, I.T.D. A predictive model to assess spatial planning in addressing hydro-meteorological hazards: A case study of Semarang City, Indonesia. Int. J. Disaster Risk Reduct. 2017, 27, 415–426. [Google Scholar] [CrossRef]
  2. Bilskie, M.V.; Hagen, S.C.; Medeiros, S.C.; and Passeri, D.L. Dynamics of sea level rise and coastal flooding on a changing landscape. Geophys. Res. Lett. 2014, 41, 927–934. [Google Scholar] [CrossRef]
  3. Intergovernmental Panel on Climate Change. Sea Level Change. In Climate Change 2013: The Physical Science Basis. Contribution of Working Group I to the Fifth Assessment Report of the Intergovernmental Panel on Climate Change; Cambridge University Press: Cambridge, UK; New York, NY, USA, 2013; pp. 1137–1216. [Google Scholar] [CrossRef]
  4. Djalante, R. Key assessments from the IPCC special report on global warming of 1.5 °C and the implications for the Sendai framework for disaster risk reduction. Prog. Disaster Sci. 2019, 1, 100001. [Google Scholar] [CrossRef]
  5. Muskananfola, M.R.; Supriharyono, S.; Febrianto, S. Spatio-temporal analysis of shoreline change along the coast of Sayung Demak, Indonesia using Digital Shoreline Analysis System. Reg. Stud. Mar. Sci. 2020, 34, 1–9. [Google Scholar] [CrossRef]
  6. Winterwerp, J.C.; Erftemeijer, P.L.A.; Suryadiputra, N.; van Eijk, P.; Zhang, L. Defining Eco-Morphodynamic Requirements for Rehabilitating Eroding Mangrove-Mud Coasts. Wetlands 2013, 33, 515–526. [Google Scholar] [CrossRef]
  7. Schmitt, K.; Albers, Y. Area Coastal Protection and the Use of Bamboo Breakwaters in the Mekong Delta. In Coastal Disasters and Climate Change in Vietnam: Engineering and Planning Perspectives; Thao, N.D., Takagi, H., Esteban, M., Eds.; Elsevier Inc.: London, UK, 2014; pp. 107–132. [Google Scholar]
  8. van Loon-Steensma, J.M.; Schelfhout, H.A. Wide Green Dikes: A sustainable adaptation option with benefits for both nature and landscape values? Land Use Policy 2017, 63, 528–538. [Google Scholar] [CrossRef]
  9. Temmerman, S.; Meire, P.; Bouma, T.J.; Herman, P.M.J.; Ysebaert, T.; De Vriend, H.J. Ecosystem-based coastal defence in the face of global change. Nature 2013, 504, 79–83. [Google Scholar] [CrossRef]
  10. Salem, M.E.; Mercer, D.E. The Economic Value of Mangroves: A Meta-Analysis. Sustainability 2012, 4, 359–383. [Google Scholar] [CrossRef] [Green Version]
  11. Johnson, M. Coastline Stability Restoration: Bamboo Poles and Fences’ Wave Attenuation Efficiency Analysis. Bachelor’s Thesis, Civil Engineering, HZ University, Vlissingen, The Netherlands, 2018. [Google Scholar]
  12. Sollitt, C.K.; Cross, R.H. Wave Transmission through Permeable Breakwaters. In Proceedings of the 13th Coastal Engineering Conference, Vancouver, Canada, 10–14 July 1972; Morrough, P.O., Ed.; ASCE: Reston, VA, USA, 1973; Volume 103, pp. 1827–1846. [Google Scholar] [CrossRef]
  13. Karim, M.F.; Tanimoto, K.; Hieu, P.D. Simulation of wave transformation in vertical permeable structure. Int. J. Offshore Polar Eng. 2004, 14, 89–96. [Google Scholar]
  14. Dao, T.; Stive, M.J.F.; Hofland, B.; Mai, T. Wave Damping due to Wooden Fences along Mangrove Coasts. J. Coast. Res. 2018, 34, 1317–1327. [Google Scholar] [CrossRef]
  15. Quang, T.T.; Trong, L.M. Monsoon wave transmission at bamboo fences protecting mangroves in the lower mekong delta. Appl. Ocean Res. 2020, 101, 102259. [Google Scholar] [CrossRef]
  16. Rao, S.; Rao, N.B.S.; Sathyanarayana, V.S. Laboratory investigation on wave transmission through two rows of perforated hollow piles. Ocean Eng. 1999, 26, 675–699. [Google Scholar] [CrossRef]
  17. Gingold, R.A.; Monaghan, J.J. Smoothed particle hydrodynamics: Theory and application to non-spherical stars. Mon. Not. R. Astron. Soc. 1977, 181, 375–389. [Google Scholar] [CrossRef]
  18. Lucy, L.B. A numerical approach to the testing of the fission hypothesis. Astron. J. 1977, 82, 1013–1024. [Google Scholar] [CrossRef]
  19. Lind, S.J.; Rogers, B.D.; Stansby, P.K. Review of smoothed particle hydrodynamics: Towards converged Lagrangian flow modelling. Proc. R. Soc. A Math. Phys. Eng. Sci. 2020, 476, 20190801. [Google Scholar] [CrossRef] [PubMed]
  20. Ni, X.; Feng, W.; Huang, S.; Zhang, Y.; Feng, X. A SPH numerical wave flume with non-reflective open boundary conditions. Ocean Eng. 2018, 163, 483–501. [Google Scholar] [CrossRef]
  21. Crespo, A.J.C.; Domínguez, J.M.; Rogers, B.D.; Gómez-Gesteira, M.; Longshaw, S.; Canelas, R.; Vacondio, R.; Barreiro, A.; García-Feal, O. DualSPHysics: Open-source parallel CFD solver based on Smoothed Particle Hydrodynamics (SPH). Comput. Phys. Commun. 2015, 187, 204–216. [Google Scholar] [CrossRef]
  22. Gomez-Gesteira, M.; Rogers, B.D.; Dalrymple, R.A.; Crespo, A.J.C. State-of-the-art of classical SPH for free-surface flows. J. Hydraul. Res. 2010, 48 (Suppl. S1), 6–27. [Google Scholar] [CrossRef]
  23. Neves, D.R.C.B.; Pires-Silva, A.A.; Fortes, C.J.E.M.; Matos, J.J.G. A comparison of wave breaking with RANS and SPH numerical models. In Proceedings of the 26th International Ocean and Polar Engineering Conference, Rhodes, Greece, 26 June–2 July 2016; pp. 1182–1189. [Google Scholar]
  24. Altomare, C.; Domínguez, J.M.; Crespo, A.J.C.; González-Cao, J.; Suzuki, T.; Gómez-Gesteira, M.; Troch, P. Long-crested wave generation and absorption for SPH-based DualSPHysics model”. Coast. Eng. 2017, 127, 37–54. [Google Scholar] [CrossRef]
  25. Monaghan, J.J. Smoothed Particle Hydrodynamics. Rep. Progess Phys. 2005, 68, 1703–1759. [Google Scholar] [CrossRef]
  26. Altomare, C.; Crespo, A.J.C.; Rogers, B.D.; Domínguez, J.M.; Gironella, X.; Gómez-Gesteira, M. Numerical modelling of armour block sea breakwater with smoothed particle hydrodynamics. Comput. Struct. 2014, 130, 34–45. [Google Scholar] [CrossRef]
  27. Domínguez, J.M.; Crespo, A.J.C.; Gómez-Gesteira, M. Optimization strategies for CPU and GPU implementations of a smoothed particle hydrodynamics method. Comput. Phys. Commun. 2013, 184, 617–627. [Google Scholar] [CrossRef]
  28. Dalrymple, R.A.; Rogers, B.D. Numerical modeling of water waves with the SPH method. Coast. Eng. 2006, 53, 141–147. [Google Scholar] [CrossRef]
  29. Crespo, A.J.; Gómez-Gesteira, M.; Dalrymple, R.A. Modeling Dam Break Behavior over a Wet Bed by a SPH Technique. J. Waterw. Port Coast. Ocean Eng. 2008, 134, 313–320. [Google Scholar] [CrossRef]
  30. Gómez-Gesteira, M.; Dalrymple, R.A. Using a Three-Dimensional Smoothed Particle Hydrodynamics Method for Wave Impact on a Tall Structure. J. Waterw. Port Coast. Ocean Eng. 2004, 130, 63–69. [Google Scholar] [CrossRef]
  31. Rogers, B.D.; Dalrymple, R.A.; Stansby, P.K. Simulation of caisson breakwater movement using 2-D SPH. J. Hydraul. Res. 2009, 48, 135–141. [Google Scholar] [CrossRef]
  32. Kamphuis, J.W. Introduction to Coastal Engineering and Management, 2nd ed.; World Scientific: Singapore, 2010; p. 67. [Google Scholar] [CrossRef]
Figure 1. NWT dimension and the wave gauge placement. (Top): x–y plane, (Bottom): x–z plane. The left side is the wave generation zone, and the right side is the wave damping zone.
Fluids 07 00014 g001
Figure 2. The formation in placing bamboo pile breakwater. (a) Vertical only formation (VO), (b) the combination between vertical poles and horizontal poles, and (c) the combination between vertical poles and diagonal poles.
Fluids 07 00014 g002
Figure 3. DualSPHysics model validation using analytical theory. The distance of particles is 0.02 m, and the simulation duration is 20 s. The black line shows the measurement of the numerical simulations, while the dotted line illustrates the analytical theory.
Fluids 07 00014 g003
Figure 4. The influences of wave steepness to the wave transmission for (a) VO formation (b) VH formation, and (c) VD formation differentiate by e/S.
Fluids 07 00014 g004aFluids 07 00014 g004b
Figure 5. The influence of the e/S ratio on the transmission coefficient is distinguished by (a) the wave height and (b) the wave period for three bamboo formations.
Fluids 07 00014 g005
Figure 6. The influence of wave steepness on the transmission coefficient is distinguished by (a) the bamboo diameter and (b) the center-to-center spacing of bamboo formations.
Fluids 07 00014 g006
Figure 7. The influences of three bamboo formations are plotted along wave steepness for different e/S (the ratio between end-to-end spacing (e) and center-to-center spacing (S)): (a) e/S = 0 or no gap; (b) e/S = 0.5; (c) e/S = 0.6 ; (d) e/S = 0.7.
Fluids 07 00014 g007
Table 1. Input parameters.
Diameter D (m)Wave Height Hi (m)
0.0480.0600.080.090.10.2
Center to Center Spacing S (m)Wave Period T (m)
0.120.161.21.6
Publisher’s Note: MDPI stays neutral with regard to jurisdictional claims in published maps and institutional affiliations.

