Article

Electrical Capacitance Volume Tomography (ECVT) for Characterization of Additively Manufactured Lattice Structures (AMLS) in Gas-Liquid Systems

1
Institute of Multiphase Flows, Hamburg University of Technology, Eißendorfer Str. 38, 21073 Hamburg, Germany
2
Tech4Imaging, 1910 Crown Park Ct., Columbus, OH 43235, USA
*
Author to whom correspondence should be addressed.
Fluids 2021, 6(9), 321; https://doi.org/10.3390/fluids6090321
Submission received: 13 July 2021 / Revised: 13 August 2021 / Accepted: 2 September 2021 / Published: 8 September 2021
(This article belongs to the Collection Advances in Flow of Multiphase Fluids and Granular Materials)

Abstract

:
Against the background of current and future global challenges, such as climate change, process engineering requires increasingly specific solutions adapted to the respective problem or application, especially in gas–liquid contact apparatuses. One possibility to adjust the conditions in this kind of apparatuses is an intelligent and customized structuring, which leads to consistent fluid properties and flow characteristics within the reactor. In the course of this, the interfacial area for mass transfer, as well as residence times, have to be adjusted and optimized specifically for the respective application. In order to better understand and advance the research on intelligent customized additively manufactured lattice structures (AMLS), the phase distributions and local gas holdups that are essential for mass transfer are investigated for different structures and flow conditions. For the first time a tomographic measurement technique is used, the Electrical Capacitance Volume Tomography (ECVT), and validated with the volume expansion method and a fiber optical needle probe (A2PS-B-POP) for an air-water system for different modes of operation (with or without co-current liquid flow in empty or packed state). The ECVT proved to be particularly useful for both in the empty tube and the packed state and provided new insights into the phase distributions occurring within structured packings, which would have led to significantly underestimated results based on the visual reference measurements, especially for a densely packed additively manufactured lattice structure (5 mm cubic on the tip). Particularly for the modified structures, which were supposed to show local targeted differences, the ECVT was able to resolve the changes locally. The additional use of a pump for co-current flow operation resulted in slightly higher fluctuations within the ECVT data, although local events could still be resolved sufficiently. The final comparison of the empty tube at rest data with a fiber optical needle probe showed that the results were in good agreement and that the local deviations were due to general differences in the respective measurement techniques.

1. Introduction

In process engineering, heterogeneous flow conditions frequently occur in multiphase contact apparatuses, which can lead to inhomogeneous reaction conditions radially across the reactor cross-section and the reactor height. The consequences include so-called “channeling”, e.g., by large bubbles or droplets in the course of occurring coalescence [1], as well as non-uniform catalyst utilization in heterogeneously catalyzed, packed bubble column reactors [2]. There have been different approaches to address these problems in the past using conventional fabrication methods, such as the use of monoliths [3], screen or perforated trays [4,5], packed beds [6,7,8], or structured packings [9,10,11,12,13], each with different advantages and disadvantages. Since the rapid rise of additive manufacturing in the last decade and the steady influx of new technical manufacturing possibilities of this innovative technology, it is also gaining increasing acceptance in chemical process engineering [14,15,16,17,18,19,20,21,22]. As a result of the newly gained degrees of freedom in the design and layout of reactors, new concepts for the development of customized reactor solutions are on the way [23,24,25,26,27]. One current research area is the development of Additively Manufactured Lattice Structures (AMLS) for tailor-made adjustment of fluid properties for gas-liquid contact apparatuses. AMLS represents a generic term here, which also includes Periodic Open-Cell Structures (POCS). POCS consist of a unit cell geometry that repeats in a periodically scaled manner, while AMLS can also be designed to be aperiodic, fractal, or otherwise. Recently, several groups have been involved in the research of periodic open-cell structures. The groups led by Freund and Schwieger have carried out studies on process intensification and, for example, improvement of liquid distribution in trickle-bed reactors [20,21], as well as reaction engineering design, use, and evaluation of these structures [15,16,17,22]. AMLS and, in particular, POCS are characterized by several advantages: Their use increases mass transfer while maintaining a comparatively small pressure drop (high energy efficiency) [28,29,30] and they also act as a static mixer [31]. Furthermore, POCS have a high surface-to-volume ratio and thus additionally enable a targeted use of heterogeneous catalysts or, in the case of a biochemical reaction, act as a carrier for immobilized enzymes [25]. Additional degrees of freedom in operation can be achieved by the use of interwoven structures, so-called “interPOCS” [18], or by the choice of advanced structural materials (smart materials), e.g., autonomous modes of operation can be achieved using special hydrogels [24].
In preliminary work, by using a fiber optical needle probe (A2PS B-POP) it was demonstrated that patterning with POCS (cubic on the tip, 6 mm) homogenizes the local gas holdup ε l o c a l (measured radially, above the structure) with an increasing height H to diameter D ratio and also adjusts the mean bubble diameter (Sauter mean diameter d 32 ) uniformly across the cross-section. In addition, the influence on the bubble velocity u b in the course of patterning was investigated [23].
However, it has not yet been possible to measure non-invasively within the structure to resolve the flow phenomenology inside the structures. To our knowledge to date, tomographic studies of POCS have been performed at the Helmholtz Zentrum Dresden Rossendorf (HZDR). Wagner et al. [32] investigated POCS by X-ray computer tomography in a co-current setup (system: air-water) of a 30 × 30 mm rectangular channel concerning gas holdup and mean bubble size, but this is relatively laborious due to its high costs and safety standards. Therefore, in this study, experiments were carried out for the first time using another non-invasive tomographic measurement technique, Electrical Capacitance Volume Tomography (ECVT). In four different cases with increasing complexity, the measurement technique is characterized in a 110 mm cylindrical flow tube and compared to results from the visual reference (global gas holdup by volume expansion method), as well as in the empty tube from using an optical needle probe (A2PS-B-POP [33]). In 2001, Fransolet et al. [34] showed a study regarding a different measurement technique, the Electrical Resistance Tomography (ERT). There, measurements of gas holdup were obtained by using pressure transducers as well as an optical probe and compared with those obtained by an electrical resistance tomography method, showing good agreement in an unpacked bubble column of 240 mm diameter. ECVT has been previously applied to a wide range of two and three phase applications including air-water phase separators [35], bubble columns [36], trickled beds [37], and slurry bubble columns [38].
Measurements in packed bed systems using additively manufactured lattice structures are still lacking and will be performed in this work for the first time.

2. Experimental Procedures

In the following, the measurement principle of the ECVT is given. Subsequently, the experimental setup, as well as the design and conduction of the experiments, are explained.

2.1. Measuring Technique

ECVT is a volumetric extension of Electrical Capacitance Tomography (ECT). ECT is a soft field tomography technique that uses low frequency (~50 kHz to 10 MHz), low voltage (~10–20 V) electric fields to interrogate a region of interest. The ECT sensor is made of a single layer of capacitance plate electrodes set around the circumference of the region of interest. The basic principle of an ECT is that of a capacitor, which consists of two conductive plates and a non-conducting material, termed as dielectric, separating the two conductive plates. If a voltage is applied to the conductive plates an electric field is generated in the dielectric material as shown in Figure 1. One of the key properties of the dielectric material is its ability to store energy. It is termed as its dielectric constant or commonly known as permittivity ε measured in [Fm−1], which indicates the permeability of the material for the electric field E. The dielectrics are electrically weak or non-conducting materials without any moving charges. The capacitance C depends on the plate size area A c , the plate spacing d c and the distance between the plates of the available dielectric. The capacitance C is calculated as:
C = ε 0 ε r A c d c
where:
  • ε 0 = permittivity of free space or vacuum
  • ε r = relative permittivity of dielectric material
The dielectric material permittivity during the polarization process is given by:
ε r = ε r + i · ε r
where:
  • ε r = the quantity of polarizability of the material (decisive for calculating the capacitance of a capacitor)
  • ε r = dielectric losses due to friction
The electric potential and permittivity distribution is described using the Poisson’s equation [39]:
ε ( r ) 2 ϕ ( r ) + ε ( r ) ϕ ( r ) = ρ ( r )
where:
  • r = position vector
  • ε ( r ) = dielectric constant (permittivity distribution)
  • ϕ ( r ) = potential distribution
  • ρ ( r ) = charge density
The capacitance C i j between two electrodes   i and j , where i is the excitation electrode and j is the grounded, i.e., detection electrode, can be found by integrating and applying divergence theorem to Equation (3), and given as
C i j = 1 V i j S j   ε ( r ) ϕ ( r ) d S
where V i j is the voltage difference between the pair of electrodes and S j is the area enclosing the flow domain and the detection electrode [40].
In ECVT, multiple layers of electrodes are utilized along the axis of the sensing region. There are two main types of excitation methods for capacitance tomography-charge-discharge and alternating-current (AC). The ECVT system used in this study uses the AC method. In the AC method, the electric field is created by exciting one of the capacitance electrode plates with an AC voltage, which then creates a reactionary AC voltage on all other plates. The AC signal on these detection plates is recorded and compared to the excitation signal amplitude and phase. Any changes in the amplitude and phase correspond to the permittivity distribution of the phases in the sensing region. The system steps through the measurement in sequence such that all plates have operated as an excitation plate. These measurements are then mapped into a 3D image using a sensitivity matrix S ˙ , the measuring vector λ and the intensity vector (voxel values)   g i by means of an image reconstruction technique.
λ = S · g i
To obtain the intensity vector g i , the inverse of S ˙ is needed. Due to the unequal number of column and row vectors of S , the inverse can only be calculated with sufficient accuracy using iterative inversion methods [41].
There are several approaches and algorithms for the approximation of the inverse of S, which are constantly being optimized. One simple method is the Linear Back Projection (LBP), stated as:
g i = S T · λ
Although many imaging algorithms are possible such as LBP or Landweber, in this study we used the 3D Neural Network Multi-criterion Optimization Image Reconstruction Technique (3D-NNMOIRT), which is well described in the work of Warsito et al. [42].
For a 24 plate sensor, there are 276 combinations to excite and detect plates. When mapping this data to an 8000-voxel (3D pixel) image, the image reconstruction problem is ill-conditioned and ill-posed, making the solution non-trivial. 3D-NNMOIRT was used because, unlike many other iterative techniques, this one does not diverge for increasing iterations. An additional parameter may be used to tune the sharpness of the images.
The ECVT system used in this study is a commercially available system by the company Tech4Imaging, which is composed of a passive clamp-on style 24 plate sensor with 4 layers of plates and 6 plates in each layer, a data acquisition system, and a software for data collection and post processing on a PC. The system requires calibration by taking reference measurements of the empty and full columns. Each state, empty (100% gas) and full (100% liquid), is calibrated before each measurement to calculate the phase composition in each voxel for every time step while/after measuring.

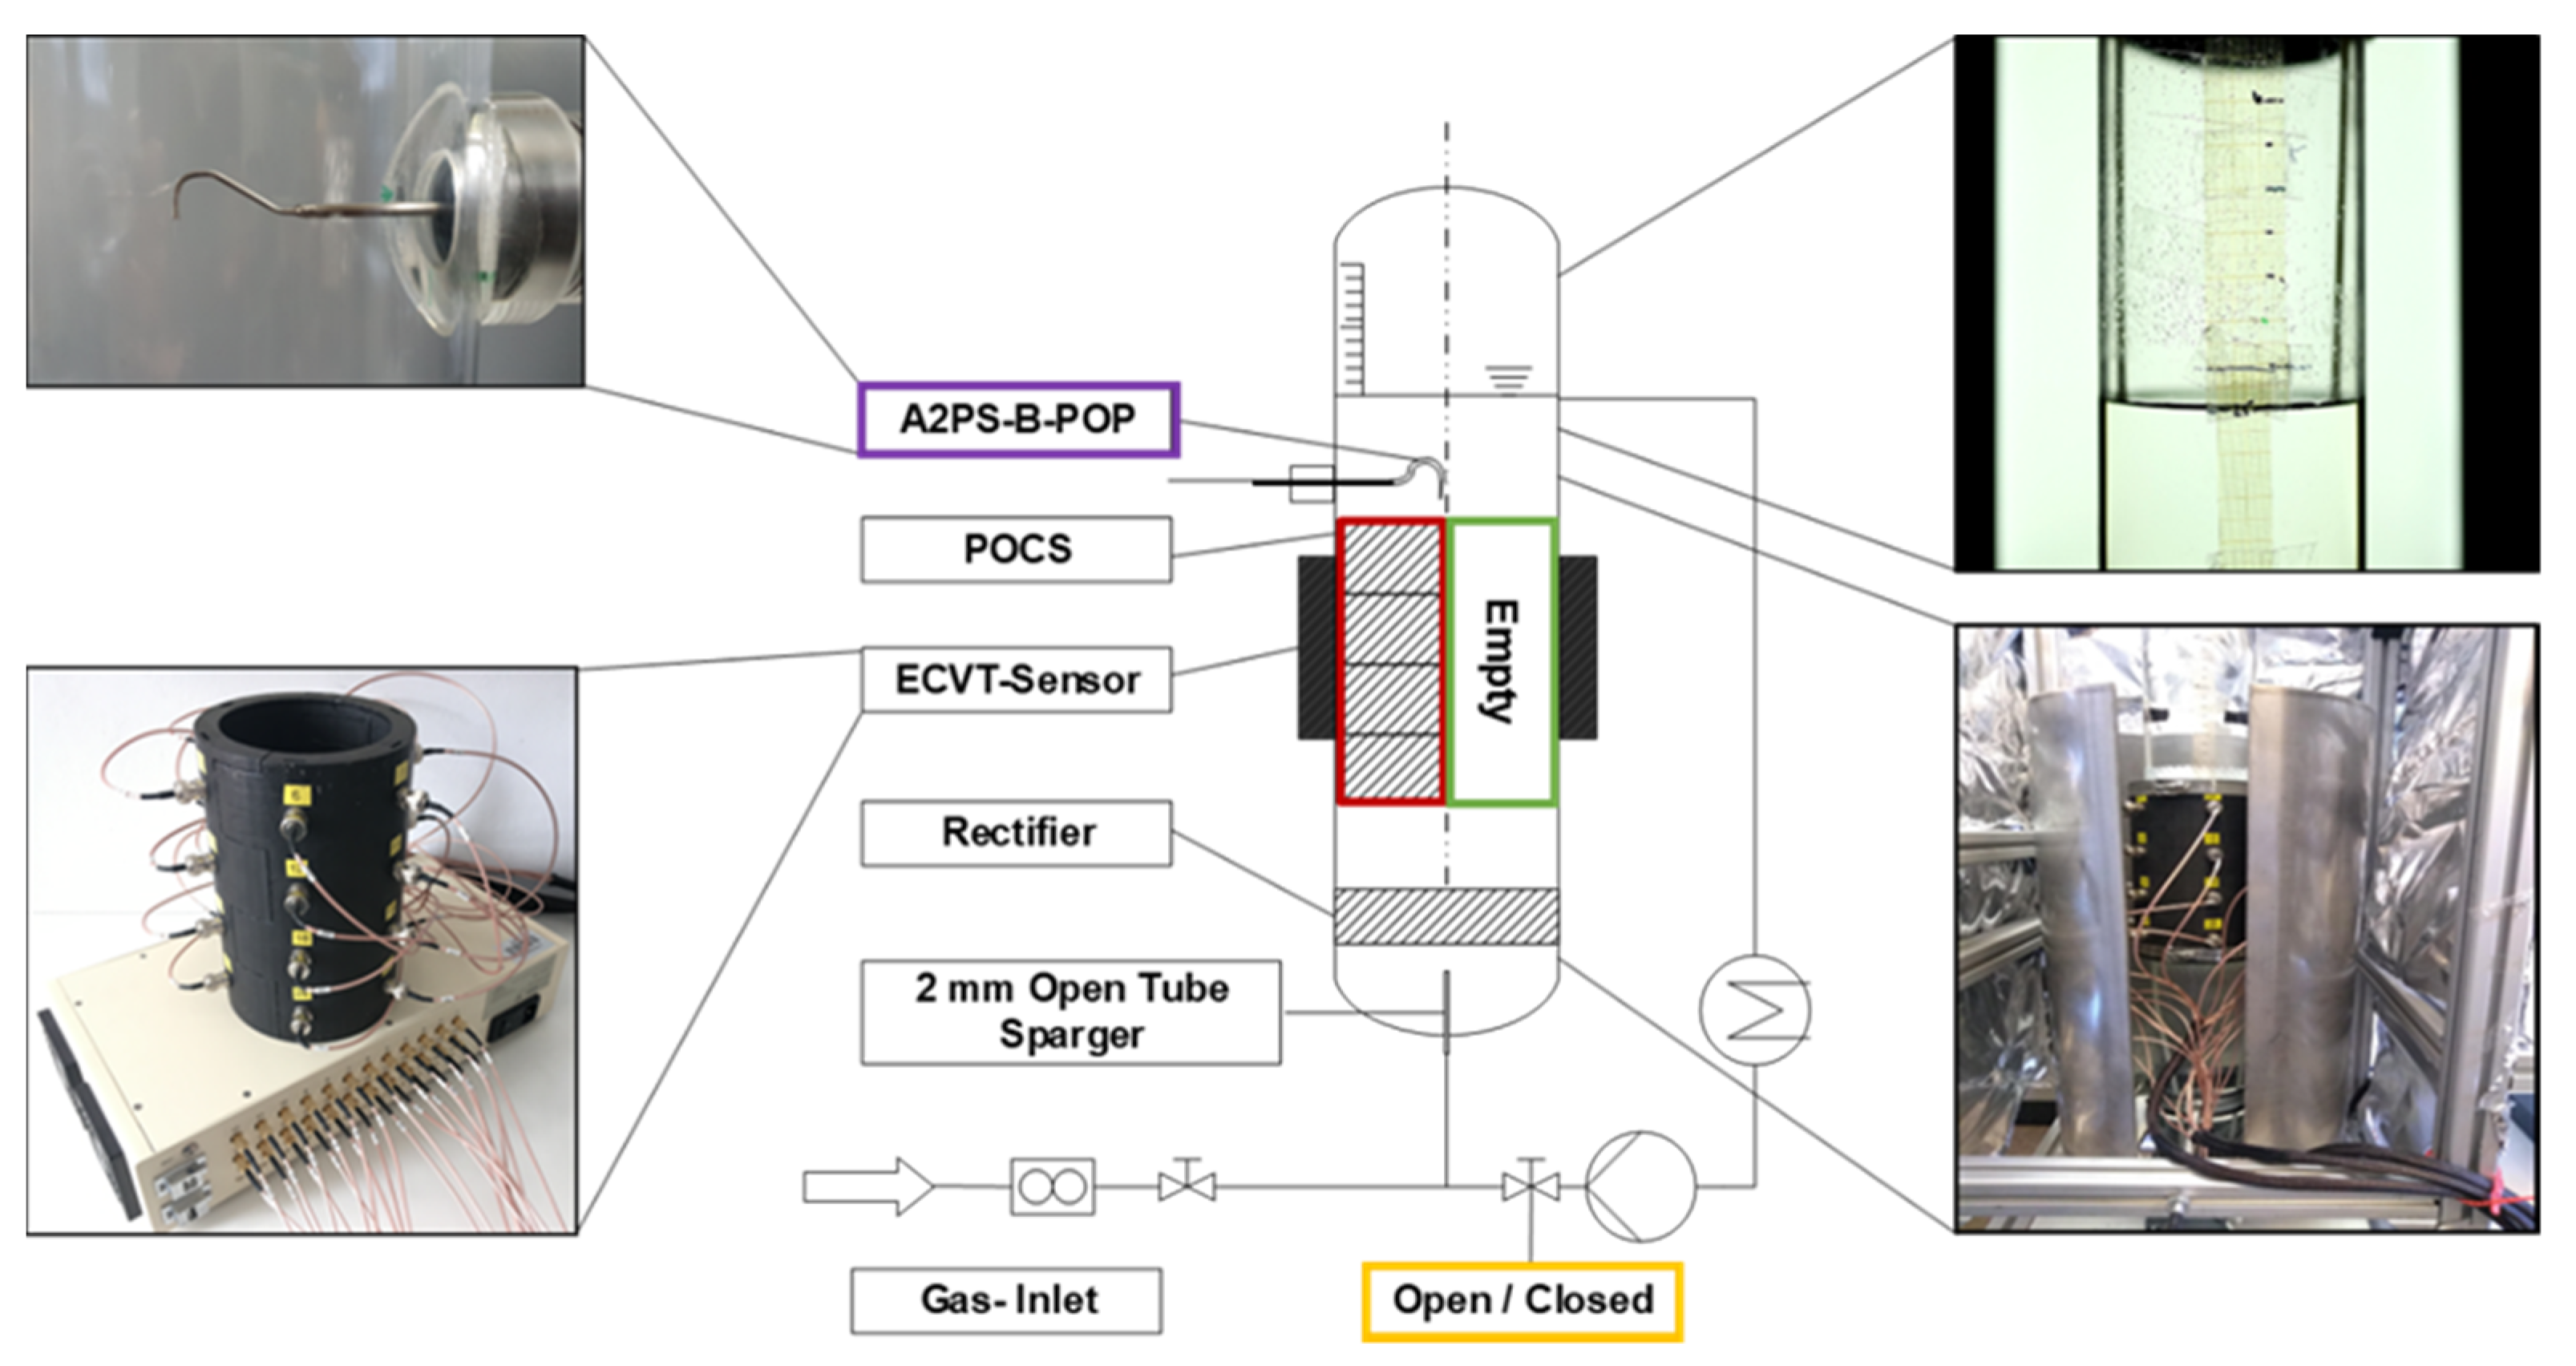
2.2. Experimental Setup

The measured data include time- and space-averaged gas holdup in the entire column and along the x, y, and z-axis for studying the phase distribution along the axes. Based on the mode of operation, the experimental setup is divided into two options (regarding liquid flow mode), namely with stagnant liquid and co-current gas-liquid circulation, which is shown in Figure 2.
The column used is made of acrylic glass with an inner diameter of D = 102 mm and height of H = 1000 mm. The sensor region is shielded with an electrically grounded metallic (aluminum) sheet to reduce the external disturbances affecting the sensitive measurements. The ECVT sensor is positioned such that there is 250 mm (10”) space on either side of the sensor to improve performance, according to the manufacturer. The fluids used are deionized water as liquid and air as a gas, and the tests are performed at ambient conditions (p = 1013 ± 30 hPa, T = 20 ± 1 °C). A predetermined level of liquid in the column is filled (up to 250 mm) above the ECVT sensor top position for stagnant liquid mode. For co-current liquid flow mode, the liquid is allowed to overflow the column through side nozzles fitted at 350 mm above the top of the sensor. The POCS are arranged such that they cover the whole sensor region within the column, which helps achieving the best results using the ECVT. Additionally, a cubic on the tip POCS of 6 mm unit cell size and a height of 100 mm (termed as Rectifier) is placed at the bottom of the column and is used to stabilize and homogenize the flow before reaching the sensor, especially in liquid circulation mode.
One of the most widely used validation methods for gas holdup measurements is the determination of the change of liquid level during the bubbling process. To facilitate this, a measuring tape is fixed on the column above the sensor region. The position of the gas sparger (nozzle tip of 2 mm opening) is fixed (40 mm from the bottom). For the mode with liquid co-current circulation, a centrifugal pump is used (Type: Rover Pompe BE–M 20 IP 55), and the tests are run for two different superficial liquid velocities namely, 8.8 × 10⁻³ ms−1 and 20 × 10−3 ms−1. The gas-phase superficial velocity is varied between 2.6 × 10⁻³ ms−1 and 15.5 × 10⁻³ ms−1 for each of the cases and controlled using a Bronkhorst M-14 mass flow controller.
An overview of the experimental conditions can be found in Table 1.
The structures needed for the experiments were stereo-lithographically manufactured from clear standard resin (V4) using a Form-3 3D printer by Formlabs Inc. The details of the tested structures can be seen in Figure 3:
Cubic regular: The structures shown in Figure 3A,D have a lower flow resistance due to their open geometric pattern compared to the cubic on the tip oriented structures (cf. Figure 3B,C). The uniform geometry is modified to have a combination of two different grid spaces (dissimilar) as shown in Figure 3D. Using such a modification, a difference in gas holdup over the cross section can be expected due to the difference in the tailored bubble sizes on each side. Larger bubbles will be stable in the larger cell size section (6 mm) compared to the (5 mm) cell size section resulting in bubbles having a higher rising velocity due to their bigger volume and lower flow resistance of the packing. The higher rising velocity should cause a lower gas holdup.
Cubic on the tip: Figure 3B,C shows the cubic on the tip structures of unit cell size of 5 mm and 6 mm, respectively, with a strut thickness of 1 mm. This type of structure has a higher drag to the two-phase flow compared to the regular cubic hexahedron structures. Here, the gas meanders through the structures rather than flowing unhindered. Moreover, considering that the free available cross sectional area is lower for the 5 mm than the 6 mm, we can expect some hindrance and therefore a higher gas holdup in the former than in the latter.
Each of the above-mentioned POCS was tested for the global and localized gas holdup for both modes of operation (with and without co-current flow). All ECVT measurements were conducted for 1000 frames and analyzed for all cases, which corresponds to 25 s of acquisition time at 40 frames per second.

2.3. Visual Reference Method

One common and simple method for determining the overall gas holdup in a bubble column is to investigate the change in the liquid level using a fixed measurement tape on the column. This method is commonly known as volume expansion method [43], also termed in this work as the visual reference method.
The gas holdup εG based on liquid height/level is given by Equation (7):
ε G = h R h 0 h R
where:
  • hR = liquid level during gas bubbling
  • h0 = initial liquid level without gas bubbling
At low superficial gas velocities, the method provides reliable values for the gas holdup, however, at higher superficial gas velocities due to fluctuation and excessive turbulence, the values need to be approximated. The image analysis tool Image J2 (Fiji) is used for getting the best approximation of the liquid level change, and hence the reference of the global gas holdup. The average arithmetic mean is used as reference value. Similarly, the minimum and maximum values corresponding to the minimum (lower) and maximum (upper) levels are observed during the entire duration of the experiment. One example of the fluctuation of the liquid level at uG = 5.2 × 10⁻³ ms−1 is shown in Figure 4, where the yellow line marks the initial liquid level before bubbling gas, and the red line indicates the change in liquid level during the gas bubbling. The basic reading error can be estimated at approximately 10%. For the circulating liquid (Cases 3 and 4), the gas holdups are determined by simultaneously closing the gas and liquid flow valves and measuring the change in the liquid level. In this case, the basic reading error can be estimated at approximately 5% of the measured gas holdup.
Table 2 summarizes the considered cases:

3. Results and Discussion

In the following, the results of the investigations and the validation of the ECVT by means of the volume expansion method are presented and discussed based on four cases (Table 2). In the Supporting Information (SI), Table S1 summarizes all measured average total gas holdup data as well as the mean deviation for all cases studied for comparison.

3.1. Case 1: Aerated System without Packing

In the first case, the empty pipe is investigated according to the experimental setup (Figure 2) by ECVT and results are validated with the global gas holdups of the volume expansion method. Figure 5 shows the data obtained by the two methods for different superficial gas velocities. The differences are due to the turbulence that develops in the course of the gas-liquid dynamics in the empty pipe, including backflow effects, vortex formations, and the formation of large bubbles [1]. In comparison, the values are matchiing well and the deviations cannot be assigned to the respective measurement methods. This is especially true for the highest superficial gas velocity considered, where the formation of large bubbles leads to stronger bulges in the visual reference measurement (volume expansion method). An exemplary evaluated video based on the evaluated ECVT data is attached to the SI (Video S1) as well as for Case 2c (Video S2), Case 3 (Video S3) and Case 4b (Video S4).

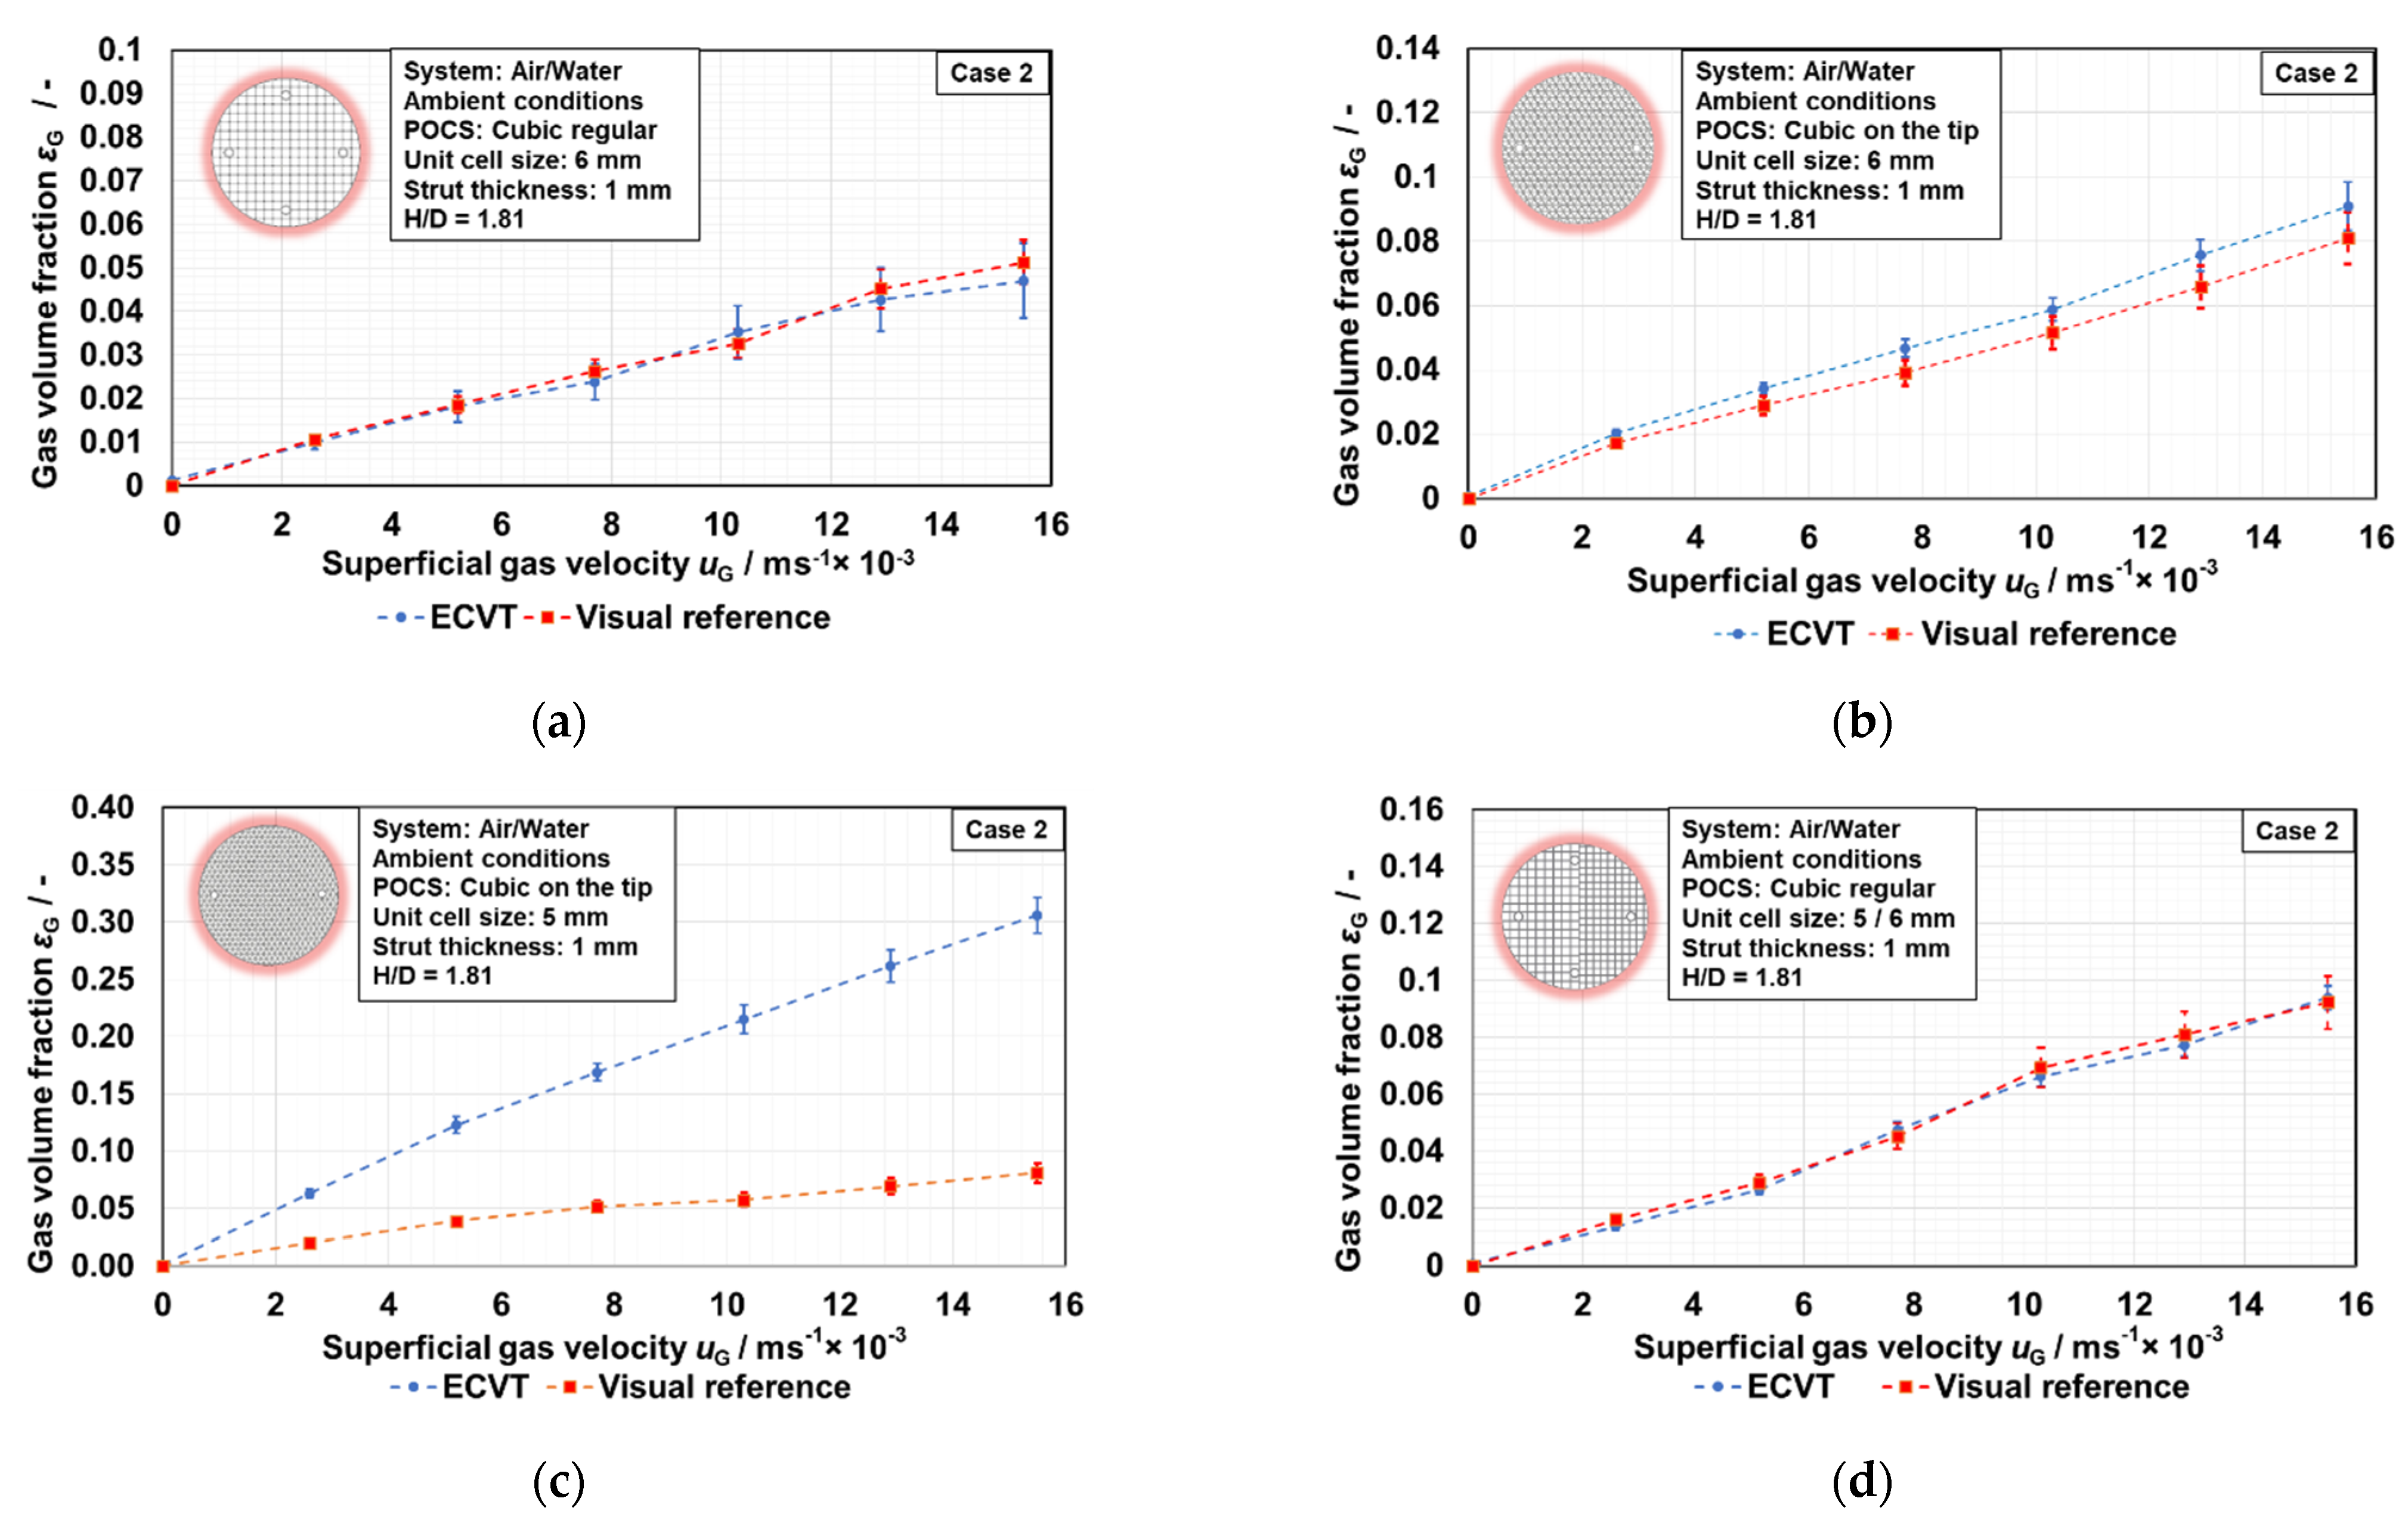
3.2. Case 2: Aerated System with Packing

In the second set of experiments (Case 2), the ECVT data of a bubble column packed with different structures according to Figure 3 are examined and compared with the volume expansion method.

3.2.1. Gas Holdup Distribution for 6 mm Cubic Regular

Due to the free and almost unhindered bubble rise made possible by the regular structure and the wide grid space, the ECVT data correspond almost perfectly to the data of the volume expansion method. Furthermore, the deviations are even smaller compared to the empty column (Figure 5), since the turbulence, as well as the effects described above, are significantly weakened in the course of the structuring, see Figure 6a).

3.2.2. Gas Holdup Distribution for 6 mm Cubic on the Tip

The structuring with a cubic periodic open-cell structure placed on the tip leads to the fact that the bubbles have to meander through the structure and thus stay longer inside the structure. This increases the local gas holdup inside the structures, which is why the ECVT data (locally) are slightly higher (+16% mean deviation) than the volume expansion measurements (see Figure 6b). Figure 7 shows the spatially resolved gas holdup for the aerated empty tube compared to the 6 mm cubic on the tip structure (Case 2). One can see that, for the empty column (Figure 7a–c), the gas mainly occurs in the middle at all investigated superficial gas velocities. Besides, in Figure 7d–f one can see the increased local gas holdup in the middle of the evaluated images, additionally tending to a better radial distribution especially in the Z = 10 plane.

3.2.3. Gas Holdup Distribution for 5 mm Cubic on the Tip

If the cell size is reduced, this has two major effects: First, the two-phase flow resistance of the structure increases, which reduces the bubble velocities. On the other hand, the rising bubbles are assumed to be tailored to smaller bubble diameters, so that the bubbles are also exposed to smaller buoyancy forces due to the smaller volume. Both effects increase the local gas holdup considerably, which can be seen from the ECVT data shown in Figure 6c). Here, the comparison with the volume expansion method comes to a far underestimated local gas holdup within the structure (+248%) and at the same time shows why the use of a local, non-invasive measurement technique is mandatory. The difference arises from the fact that the volume expansion method takes into account the entire volume between the gas sparger tip and the evaluated water meniscus, whereas the ECVT measures only the local volume of the packing within the sensor region.

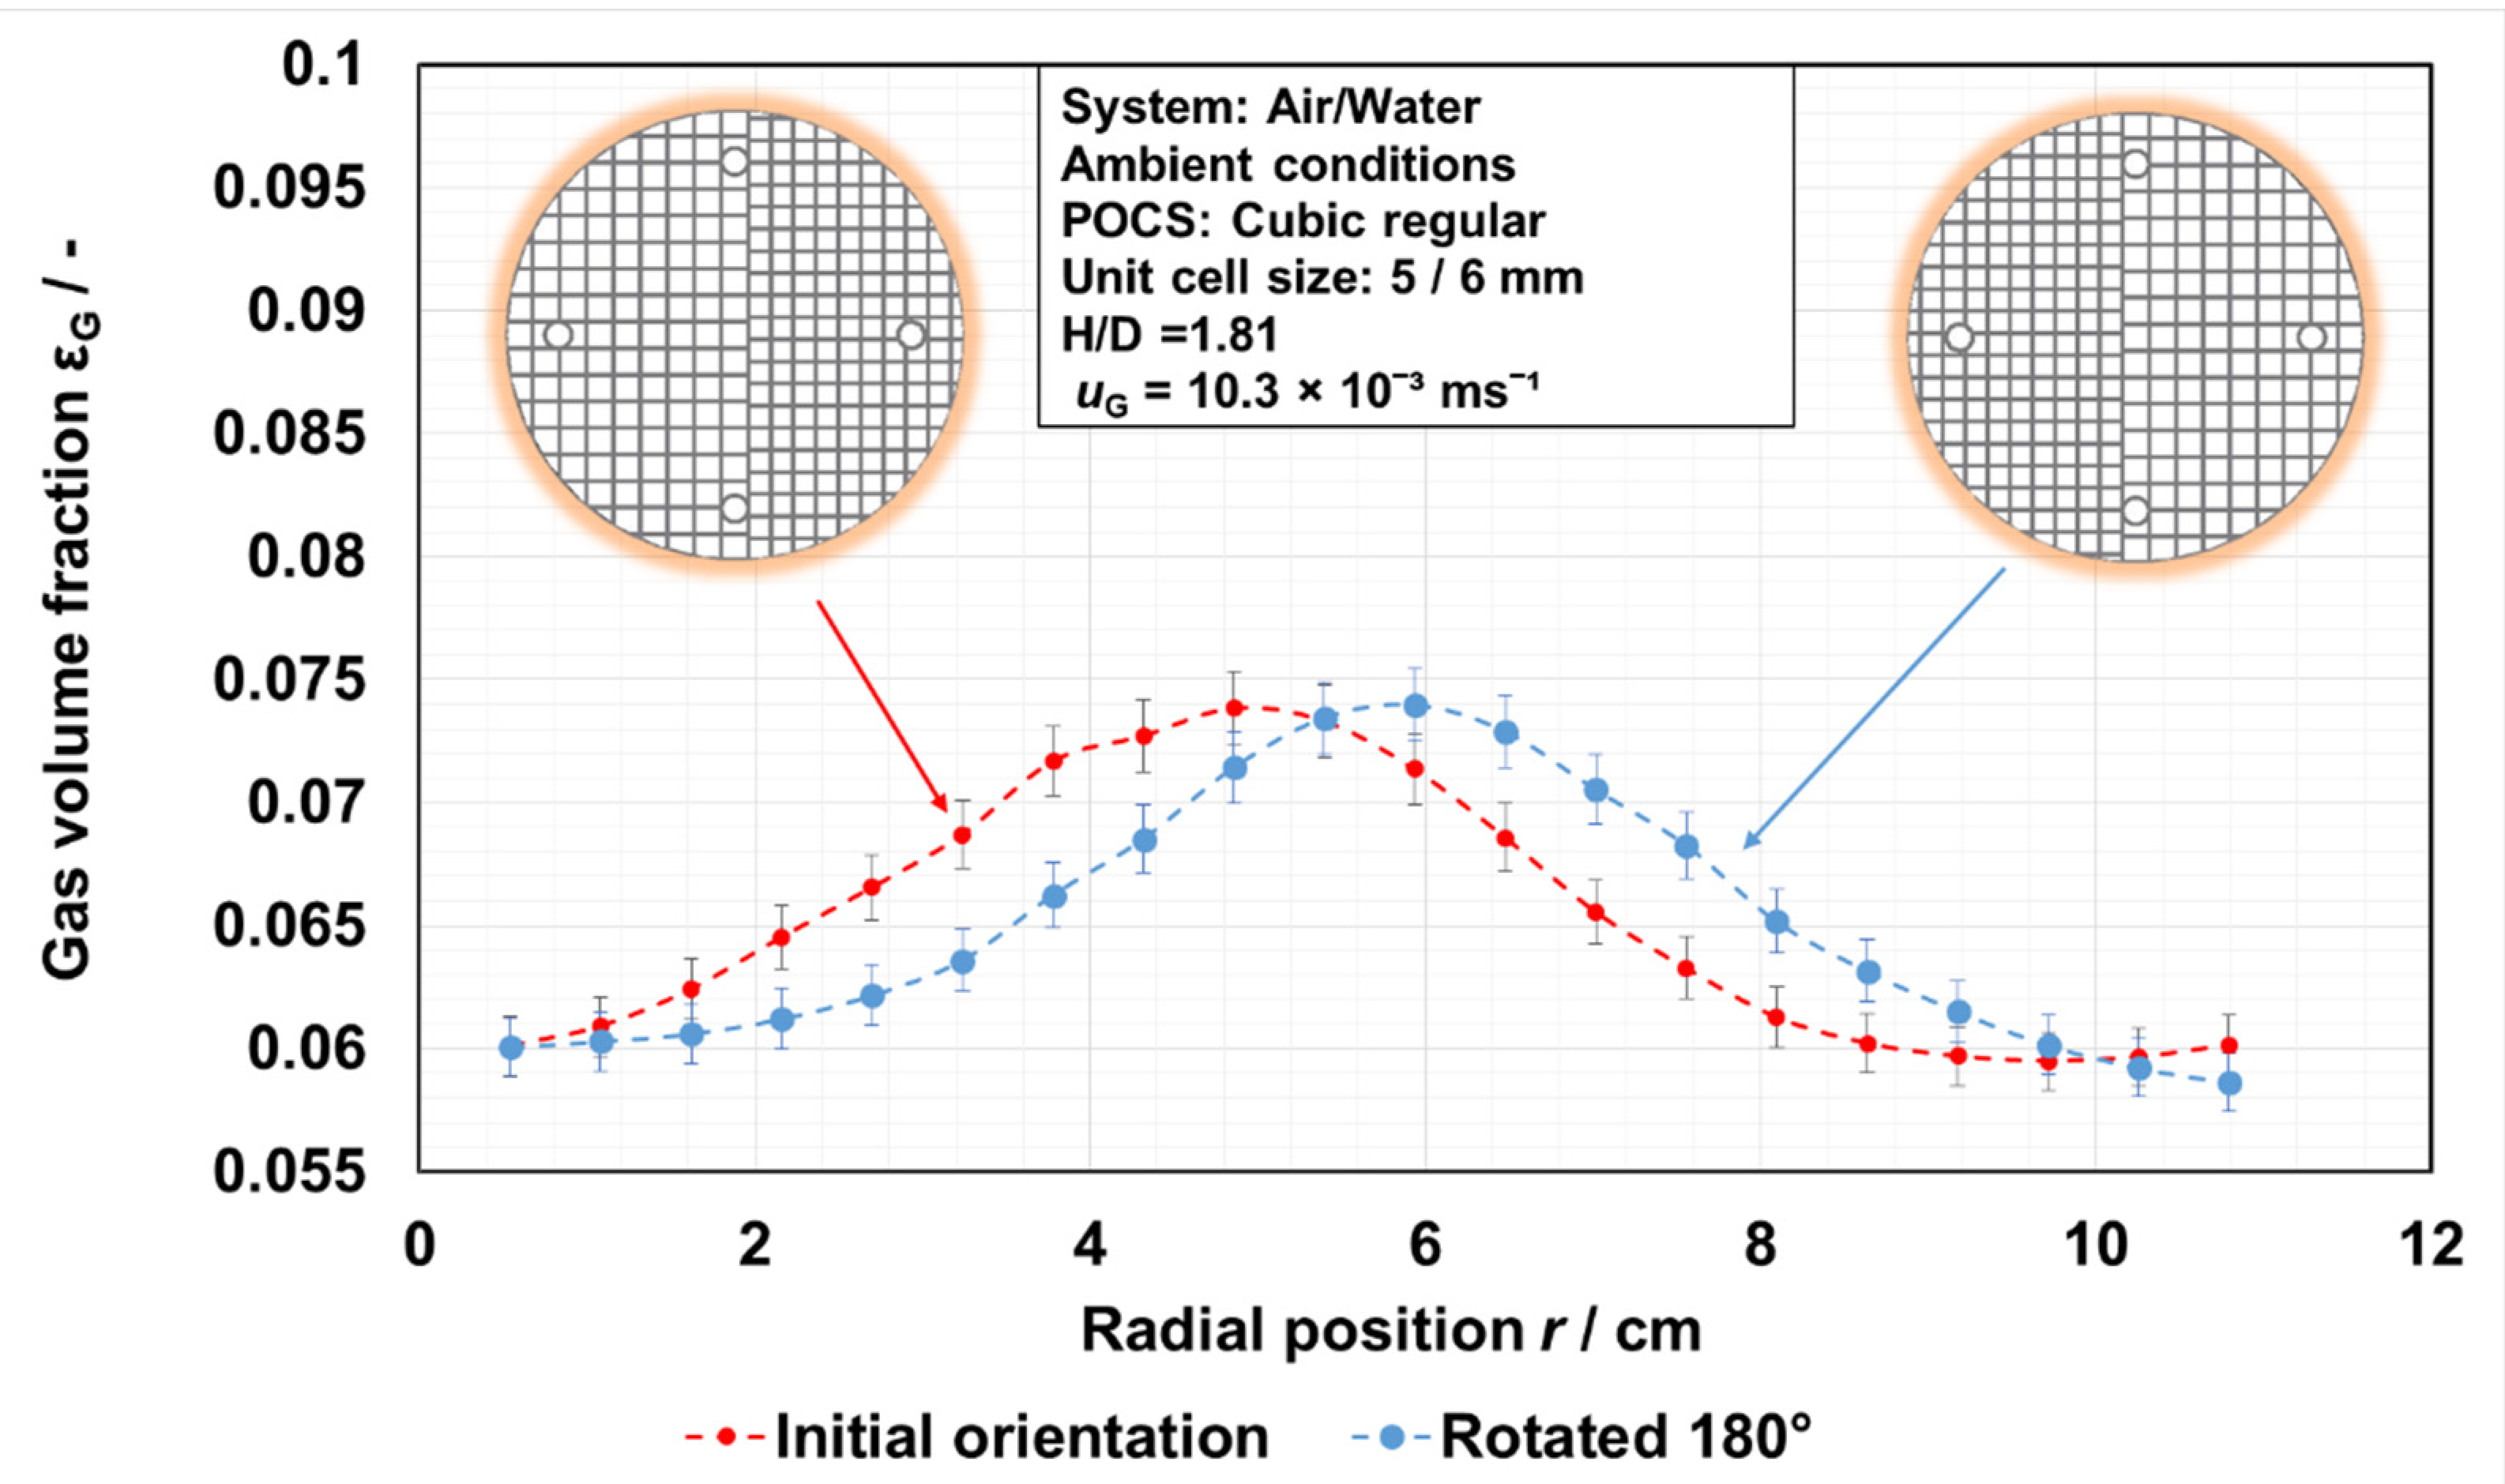
3.2.4. Gas Holdup Distribution for 5 mm/6 mm Modified Cubic Structure Regular

In the last structural geometry considered, the regular structure is provided with 5 mm cells in one half and 6 mm cells in the other. Here, the free bubble ascent is possible almost unhindered, as in the first structure examined (cubic regular). This is also reflected in the comparative data (see Figure 6d). The special feature here, however, is the specific influence of the modification on the radial distribution of the gas holdup within the structure. To illustrate this, the radially averaged gas holdup profiles are plotted in Figure 8. In fact, the ECVT data reflect the expected results. One can see the shift of the two peaks by changing the flow resistance from the initial state (red), where less flow resistance occurs on the left side due to the bigger and more open cells, to the rotated one (blue). For both cases (initial and rotated orientation) the videos are attached to the SI (Videos S5 and S6). In addition, Figure 9 shows exemplarily the high reproducibility of the ECVT measurement technique using a dissimilar POCS at three different trials.

3.3. Case 3: Aerated System with Co-Current Liquid Flow without Packing

In the following experiments (Case 3), the liquid phase is additionally pumped in co-current flow, so that the gas velocity is further increased, initially in the empty tube. In addition, the influence of the moving polar liquid (water) on the sensitive measuring system (ECVT) is to be investigated. Visual validation is also performed by volume expansion method, but in this case in a reverse way: when the gas and liquid volume flows stop simultaneously, the water level drops (instead of rising). As a result, the fluctuations of the water surface no longer occur and the measured values therefore no longer show error bars. Nevertheless, ±5% reading error can be assumed here. Figure 10a) shows that the standard deviations of the ECVT data increase with increasing superficial gas velocity and that there are considerable fluctuations in the measurement system compared to the fluid at rest. Furthermore, the gas holdup measured with the ECVT also seems to underestimate the global gas holdup on average (42% deviation on average). To exclude the type of pump used as the reason, the behavior has also been investigated for different pump types (gear pump versus centrifugal pump) and the corresponding data under the same operating conditions are attached to the SI (Figure S1), as well as an evaluated video showing the noise of the measurement when running in circulation. The flowing polar liquid seems to disturb the signal and enhances the deviation at all (cf. Video S3), since it’s not affected by the type of the pump.

3.4. Case 4: Aerated System with Co-Current Liquid Flow with Packing

In the fourth step (Case 4), the column is additionally packed with different additive manufactured lattice structures and operated in a co-current flow. Compared to the empty pipe measurement (Case 3), the standard deviations in the ECVT data are lower, analogous to the first two cases (Cases 1 & 2). In general, a slight decrease in gas holdup is evident in all cases considered (see Figure 10). This is consistent with expectations, as the gas velocity is increased and hence a shorter residence time in the column leads to a lower gas holdup.

3.4.1. Gas Holdup Distribution for 6 mm Cubic on the Tip

Comparing 6 mm cubic on the tip of Case 2 with Case 4 (Figure 6b and Figure 10b), it is noticeable that in this case the ECVT data deviates more from the volume expansion measurements (107% instead of 16%). From a look at the cross-sections of the top views of the respective structures (cf. Figure 5), it is suggested that the liquid bulk phase always has the opportunity to pass directly through the structure on unobstructed paths compared to the dispersed phase with a certain tailored bubble size. This leads to an increased retention of gas within the structure and thus the ECVT data locally within the structure deviates more from the globally determined data. In this case, the ECVT provides valuable information about the local gas-liquid dynamics, and validation of the ECVT data with those of the volume expansion measurements is insufficient.

3.4.2. Gas Holdup Distribution for 5 mm Cubic on the Tip

In Case 4, 5 mm cubic on the tip (Figure 10c), a smaller difference between ECVT data and visual reference measurements is evident compared to 2c (cf. Figure 6c). This is to be expected since the additional momentum forces push all gas out of the structure and equilibrium is reached without bubbles adhering within the structure anymore. However, as the superficial gas velocity increases, the curves drift further apart, because the associated increase in resistance is more severe for the bubbles than for the liquid, which can more easily pass through the structure as described above.

3.4.3. Gas Holdup Distribution for 5 mm/6 mm Modified Cubic Structure Regular

In Case 4, modified cubic structure regular (Figure 10d), a similar behavior as for the empty pipe measurements (Case 3) can be observed since the bubbles can nearly pass the modified structure unhindered due to the regular and open shape of the unit cells. The local ECVT data slightly underestimate the volume expansion measurements (higher noise in liquid circulation flow mode). In addition, the structuring also leads to smaller fluctuations here compared to the empty pipe.

3.5. Comparison with A2PS-B-POP

The local gas holdups data of the ECVT (blue) are compared with the volume expansion method (min and max in gray) and the radially recorded profile of an A2PS-B-POP fiber optical needle probe (black) at the same location as the ECVT measurements (see Figure 11). In addition, a correlation for the local gas holdup for bubble columns after Ueyama and Miyauchi [44] is used, as stated in Equation (8). Bothe [45] used this correlation before to model industrial two-phase flows in bubble column reactors. The local gas holdup   ε G   of the dimensionless radius ϕ is approximated by means of b as fitting parameter in the range of 1.8 to 2.3. Both cases (b = 1.8 and b = 2.3) are plotted as well in Figure 11.
ε G ( ϕ ) = ε G b + 2 b ( 1 ϕ b )
It can be seen that the profile of the fiber optical probe widely matches the expected profile in terms of shape. However, the probe slightly overestimates the local gas holdup compared to the maximum level values from the visual reference. The ECVT data, on the other hand, agree better with the visual reference measurement data, but the ECVT measurement technique significantly overestimates the values near the wall. This is due to the fact that the ECVT is a soft-field measurement technique, where the calculated and measured voxels always depend directly on the respective neighboring voxels. Therefore, peaks, or local outbursts, are not well captured. In addition, the entire profile is significantly smoother due to the averaging. Nevertheless, the agreement is good. The ECVT technique is reliable in stationary operating states but should-as of now-not be used for areas close to the wall or the determination of local peaks.

4. Conclusions

The use of Electrical Capacitance Volume Tomography (ECVT) to determine the local phase distributions was compared with the volume expansion measurements for different modes of operation (with or without co-current liquid flow in empty or packed state). The ECVT proved to be particularly useful for both in the empty tube and the packed column and provided new insights into the phase distributions occurring within structured packings, which would have led to significantly underestimated results based on the visual reference measurements, especially for a densely packed additively manufactured lattice structure (5 mm cubic on the tip). Particularly for the modified structures, which were supposed to show local targeted differences, the ECVT was able to resolve the changes locally. The additional use of a pump for co-current flow operation resulted in slightly higher fluctuations within the ECVT data, although local phenomena could still be resolved relatively well. The final comparison of the empty tube data at rest with a fiber optical needle probe (A2PS-B-POP) showed that the data to be validated were essentially the same and that the local deviations were due to general differences in the respective measurement techniques.
In future work, 3D velocimetry [40] which is also possible with the ECVT measurement technique and equipment, will be tested and used to resolve the phase velocities within the additively manufactured lattice structures and will also be tested and validated in successively more complex cases.

Supplementary Materials

The following are available online at https://www.mdpi.com/article/10.3390/fluids6090321/s1, Figure S1: ECVT using gear versus centrifugal pump, Table S1: Summary and comparison of the average overall gas holdup for Case1-4; ECVT data versus visual reference (VR), mean values and overall mean deviation. Supplementary videos can be found in https://zenodo.org/record/5195997#.YTcFW99CRPY, Video S1: Case 1, Video S2: Case 2c, Video S3: Case 3, Video S4: Case 4b, Video S5: Less dense packing to the left side, Video S6: Less dense packing to the right side.

Author Contributions

Conceptualization, C.S. and V.P.T.; methodology, C.S.; software, B.S.; validation, C.S., V.P.T. and B.S.; formal analysis, C.S., V.P.T. and B.S.; investigation, C.S. and V.P.T.; writing—original draft preparation, C.S.; V.P.T. and B.S.; writing—review and editing, M.J., M.H., B.S., Q.M. and M.S.; visualization, C.S.; supervision, M.J., M.H., Q.M. and M.S.; project administration, M.S.; funding acquisition, M.H. and M.S. Parts of this manuscript have already been presented as oral presentation by C.S. at the 2021 annual meeting of the ProcessNet Computational Fluid Dynamics and Multiphase Flow groups. All authors have read and agreed to the published version of the manuscript.

Funding

This research was funded by Hamburg Authority for Science, Research, and Equal Treatment (BWFG), grant number LFF-FV 43.

Institutional Review Board Statement

Not applicable.

Informed Consent Statement

Not applicable.

Data Availability Statement

The data presented in this study are available on request from the corresponding author.

Acknowledgments

The project is associated with the joint research project “New reactor technologies for chemical and biochemical synthesis processes” as well as the i3-Lab “Smart reactors” as the follow-up project. The authors gratefully acknowledge the financial support, which was given by Hamburg Authority for Science, Research, and Equal Treatment (BWFG) under grant number LFF-FV 43. We would also like to thank Josh Keller for his efforts in setting up and running the test apparatuses at Tech4Imaging. We acknowledge support for the Open Access fees by Hamburg University of Technology (TUHH) in the funding programme Open Access Publishing.

Conflicts of Interest

The authors declare no conflict of interest.

Glossary

Symbols
a(m−1)specific surface area
A c (m2)capacitor plate size area
C (F)capacitance
d32(mm)Sauter mean diameter
d(mm)column diameter
d c (mm)distance between the capacitor plates
h(mm)reactor height
g i (Fm−1)intensity vector
r(mm)radial position
r (-)position vector
R(-)normalized radial position
S(-)sensitivity matrix
ub(ms−1)mean bubble velocity
uG(ms−1)superficial gas velocity
uL(ms−1)superficial liquid velocity
V ˙ G (Lmin−1)gas flow rate
Greek symbols
εG(-)local gas holdup
ε 0 (Fm−1)permittivity of free space or vacuum
ε r (Fm−1)relative permittivity of dielectric material
ε ( r ) (Fm−1)dielectric constant (permittivity distribution)
ε r (Fm−1)the quantity of polarizability of the material
ε r (Fm−1)dielectric losses due to friction
λ (Fm−1)measuring vector
ϕ(-)dimensionless radius
ϕ ( r ) (-)potential distribution
ρ ( r ) (Cm−3)charge density
Sub- and Superscripts
locallocal
globalglobal
Abbreviations
ACAlternating-current
AMLSAdditively manufactured lattice structures
A2PS B-POPA2 Photonic Sensors B-POP optical needle probe
ECTElectrical capacitance tomography
ECVTElectrical capacitance volume tomography
ERTElectrical resistance tomography
HZDRHelmholtz Zentrum Dresden Rossendorf
POCSPeriodic open-cell structures
VRVisual reference

References

  1. Chen, R.C.; Reese, J.; Fan, L.-S. Flow structure in a three-dimensional bubble column and three-phase fluidized bed. AIChE J. 1994, 40, 1093–1104. [Google Scholar] [CrossRef]
  2. Deckwer, W.-D. (Ed.) Reaktionstechnik in Blasensäulen; 1. Aufl.; Salle: Frankfurt am Main, Germany, 1985; ISBN 9783794126064. [Google Scholar]
  3. Roy, S.; Bauer, T.; Al-Dahhan, M.; Lehner, P.; Turek, T. Monoliths as multiphase reactors: A review. AIChE J. 2004, 50, 2918–2938. [Google Scholar] [CrossRef]
  4. Blaß, E.; Koch, K.-H. Strömungstechnische untersuchungen an einem blasensäulen-kaskadenreaktor bei gleichstrom von gas und flüssigkeit. Chem. Ing. Tech. 1972, 44, 913–921. [Google Scholar] [CrossRef]
  5. Dreher, A.J.; Krishna, R. Liquid-phase backmixing in bubble columns, structured by introduction of partition plates. Catal. Today 2001, 69, 165–170. [Google Scholar] [CrossRef]
  6. Therning, P.; Rasmuson, A. Liquid dispersion and gas holdup in packed bubble columns at atmospheric pressure. Chem. Eng. J. 2001, 81, 69–81. [Google Scholar] [CrossRef]
  7. Carleton, A.J.; Flain, R.J.; Rennie, J.; Valentin, F.H.H. Some properties of a packed bubble column. Chem. Eng. Sci. 1967, 22, 1839–1845. [Google Scholar] [CrossRef]
  8. Hölemann, K.; Czapla, F.; Kaibel, G. Fluiddynamik und Stofftransport in gepackten Blasensäulen. Chem. Ing. Tech. 2005, 77, 1814–1818. [Google Scholar] [CrossRef]
  9. Lesniak, A. Strukturierung von Blasensäulen; 1. Auflage; Verlag Dr. Hut: München, Germany, 2019; ISBN 978-3-8439-4113-6. [Google Scholar]
  10. Lesniak, A.K.; Grünewald, M. Influence of structured packings on local phase distribution in a semi-batch bubble column operated in the homogeneous regime. J. Chem. Eng. Jpn. 2018, 51, 366–372. [Google Scholar] [CrossRef]
  11. Hooshyar, N.; Vervloet, D.; Kapteijn, F.; Hamersma, P.J.; Mudde, R.F.; van Ommen, J.R. Intensifying the Fischer–Tropsch Synthesis by reactor structuring—A model study. Chem. Eng. J. 2012, 207–208, 865–870. [Google Scholar] [CrossRef]
  12. Miller, C.; Kaibel, G.; Benfer, R. Packungseinbauten—Neue anwendungen bei reaktivdestillationen und in reaktoren. Chem. Ing. Tech. 2004, 76, 730–733. [Google Scholar] [CrossRef]
  13. Salden, A.; Göbbel, H.-G.; Kaibel, G.; Kotrel, S. Blasensäulenreaktoren mit packungen. Chem. Ing. Tech. 2003, 75, 1045. [Google Scholar] [CrossRef]
  14. Parra-Cabrera, C.; Achille, C.; Kuhn, S.; Ameloot, R. 3D printing in chemical engineering and catalytic technology: Structured catalysts, mixers and reactors. Chem. Soc. Rev. 2018, 47, 209–230. [Google Scholar] [CrossRef] [PubMed]
  15. Inayat, A.; Klumpp, M.; Lämmermann, M.; Freund, H.; Schwieger, W. Development of a new pressure drop correlation for open-cell foams based completely on theoretical grounds: Taking into account strut shape and geometric tortuosity. Chem. Eng. J. 2016, 287, 704–719. [Google Scholar] [CrossRef]
  16. Bianchi, E.; Schwieger, W.; Freund, H. Assessment of periodic open cellular structures for enhanced heat conduction in catalytic fixed-bed reactors. Adv. Eng. Mater. 2016, 18, 608–614. [Google Scholar] [CrossRef]
  17. Busse, C.; Freund, H.; Schwieger, W. Intensification of heat transfer in catalytic reactors by additively manufactured periodic open cellular structures (POCS). Chem. Eng. Process.-Process. Intensif. 2018, 124, 199–214. [Google Scholar] [CrossRef]
  18. Do, G.; Geißelbrecht, M.; Schwieger, W.; Freund, H. Additive manufacturing of interpenetrating periodic open cellular structures (interPOCS) with in operando adjustable flow characteristics. Chem. Eng. Process.-Process. Intensif. 2020, 148, 107786. [Google Scholar] [CrossRef]
  19. Klumpp, M.; Inayat, A.; Schwerdtfeger, J.; Körner, C.; Singer, R.F.; Freund, H.; Schwieger, W. Periodic open cellular structures with ideal cubic cell geometry: Effect of porosity and cell orientation on pressure drop behavior. Chem. Eng. J. 2014, 242, 364–378. [Google Scholar] [CrossRef]
  20. Lämmermann, M.; Horak, G.; Schwieger, W.; Freund, H. Periodic open cellular structures (POCS) for intensification of multiphase reactors: Liquid holdup and two-phase pressure drop. Chem. Eng. Process.-Process. Intensif. 2018, 126, 178–189. [Google Scholar] [CrossRef]
  21. Lämmermann, M.; Schwieger, W.; Freund, H. Experimental investigation of gas-liquid distribution in periodic open cellular structures as potential catalyst supports. Catal. Today 2016, 273, 161–171. [Google Scholar] [CrossRef]
  22. Schwieger, W.; Machoke, A.G.; Weissenberger, T.; Inayat, A.; Selvam, T.; Klumpp, M.; Inayat, A. Hierarchy concepts: Classification and preparation strategies for zeolite containing materials with hierarchical porosity. Chem. Soc. Rev. 2016, 45, 3353–3376. [Google Scholar] [CrossRef] [Green Version]
  23. Spille, C.; Lyberis, A.; Maiwald, M.I.; Herzog, D.; Hoffmann, M.; Emmelmann, C.; Schlüter, M. SMART-Reactors: Tailoring gas holdup distribution by additively manufactured lattice structures. Chem. Eng. Technol. 2020, 43, 2053–2061. [Google Scholar] [CrossRef]
  24. Hu, X.; Spille, C.; Schlüter, M.; Smirnova, I. Smart structures: Additive manufacturing of smart materials for adaptive packings. Ind. Eng. Chem. Res. 2020, 59, 19458–19464. [Google Scholar] [CrossRef]
  25. Büscher, N.; Spille, C.; Kracht, J.K.; Sayoga, G.V.; Dawood, A.W.H.; Maiwald, M.I.; Herzog, D.; Schlüter, M.; Liese, A. Countercurrently operated reactive extractor with an additively manufactured enzyme carrier structure. Org. Process. Res. Dev. 2020, 24, 1621–1628. [Google Scholar] [CrossRef]
  26. Spille, C.; Hu, X.; Maiwald, M.I.; Herzog, D.; Hoffmann, M.; Emmelmann, C.; Smirnova, I.; Schlüter, M. SMART reactors: Intelligente additiv gefertigte strukturierte einbauten zur optimierung von Gas/Flüssig-Reaktionen. Chem. Ing. Tech. 2020, 92, 1328. [Google Scholar] [CrossRef]
  27. Eixenberger, D.; Büscher, N.; Hu, X.; Dawood, A.; Smirnova, I.; Liese, A. Smart reactors—Surface enhancement for enzyme immobilization on additively manufactured packings. Chem. Ing. Tech. 2020, 92, 1223. [Google Scholar] [CrossRef]
  28. Möller, C.-O.; Hoffmann, M.; Schlüter, M. Experimental study of mass transfer and local flow parameters of bubbly flows in Periodic Open Cell Structures (POCS). In Proceedings of the 3rd International Symposium on Multiscale Multiphase Process Engineering (MMPE), Toyama City, Japan, 8–11 May 2017. [Google Scholar]
  29. Hecht, C. Experimentelle Untersuchungen zum Einsatz Neuartig Strukturierter Einbauten in Blasensäulen-und Rieselphasenreaktoren. Ph.D Thesis, Ruhr Unviversity Bochum, Bochum, Germany, 2017. [Google Scholar]
  30. Hecht, C.; Grünewald, M. Erstes design und einsatz 3D-gedruckter strukturen in blasensäulenreaktoren. Chem. Ing. Tech. 2019, 91, 1273–1280. [Google Scholar] [CrossRef]
  31. Llamas, C.G.; Spille, C.; Kastens, S.; Paz, D.G.; Schlüter, M.; Kameke, A. Potential of lagrangian analysis methods in the study of chemical reactors. Chem. Ing. Tech. 2020, 92, 540–553. [Google Scholar] [CrossRef] [Green Version]
  32. Wagner, M.; Möller, C.-O.; Hessenkemper, H.; Bieberle, M.; Hampel, U.; Schlüter, M. Hydrodynamics in cellular grid packed bubble columns disclosed with ultrafast X-ray tomography. In Proceedings of the 8th World Congress on Industrial Process Tomography, Foz do Iguaçu, Brazil, 26–29 September 2016. [Google Scholar]
  33. Zuanon, N. B-POP: Phase Detection Optical Probe for Bubbly Flows-User Manual. Grenoble, France, 2013. Available online: https://pdf.directindustry.com/pdf/a2-photonic-sensors/b-pop-mono-optical-probe-bubbly-flow-analysis/65114-319159.html (accessed on 10 May 2021).
  34. Fransolet, E.; Crine, M.; L’Homme, G.; Toye, D.; Marchot, P. Analysis of electrical resistance tomography measurements obtained on a bubble column. Meas. Sci. Technol. 2001, 12, 1055–1060. [Google Scholar] [CrossRef]
  35. Wang, A.; Marashdeh, Q.; Fan, L.-S. ECVT imaging and model analysis of the liquid distribution inside a horizontally installed passive cyclonic gas–liquid separator. Chem. Eng. Sci. 2016, 141, 231–239. [Google Scholar] [CrossRef]
  36. Wang, A.; Marashdeh, Q.; Fan, L.-S. ECVT imaging of 3D spiral bubble plume structures in gas-liquid bubble columns. Can. J. Chem. Eng. 2014, 92, 2078–2087. [Google Scholar] [CrossRef]
  37. Wang, A.; Marashdeh, Q.; Motil, B.J.; Fan, L.-S. Electrical capacitance volume tomography for imaging of pulsating flows in a trickle bed. Chem. Eng. Sci. 2014, 119, 77–87. [Google Scholar] [CrossRef]
  38. Sines, J.N.; Hwang, S.; Marashdeh, Q.M.; Tong, A.; Wang, D.; He, P.; Straiton, B.J.; Zuccarelli, C.E.; Fan, L.-S. Slurry bubble column measurements using advanced electrical capacitance volume tomography sensors. Powder Technol. 2019, 355, 474–480. [Google Scholar] [CrossRef]
  39. Marashdeh, Q.; Warsito, W.; Fan, L.-S.; Teixeira, F.L. A nonlinear image reconstruction technique for ECT using a combined neural network approach. Meas. Sci. Technol. 2006, 17, 2097–2103. [Google Scholar] [CrossRef]
  40. Chowdhury, S.; Marashdeh, Q.M.; Teixeira, F.L. Velocity profiling of multiphase flows using capacitive sensor sensitivity gradient. IEEE Sens. J. 2016, 16, 8365–8373. [Google Scholar] [CrossRef]
  41. Marashdeh, Q.; Teixeira, F.L.; Fan, L.-S. Electrical capacitance tomography. In Industrial Tomography; Woodhead Publishing: Shaxton, UK, 2015; pp. 3–21. [Google Scholar] [CrossRef]
  42. Warsito, W.; Marashdeh, Q.; Fan, L.-S. Electrical capacitance volume tomography. IEEE Sens. J. 2007, 7, 525–535. [Google Scholar] [CrossRef]
  43. Deckwer, W.-D. (Ed.) Bubble Column Reactors; Wiley: Chichester, UK, 1992; ISBN 9780471918110. [Google Scholar]
  44. Ueyama, K.; Miyauchi, T. Properties of recirculating turbulent two phase flow in gas bubble columns. AIChE J. 1979, 25, 258–266. [Google Scholar] [CrossRef]
  45. Bothe, M. Experimental Analysis and Modeling of Industrial Two-Phase Flows in Bubble Column Reactors, 1st ed.; Cuvillier Verlag: Göttingen, Germany, 2016; ISBN 978-3-7369-9193-4. [Google Scholar]
Figure 1. Schematic capacitor measuring principle.
Fluids 06 00321 g001
Figure 2. Experimental setup for the four different cases (liquid flow mode: stagnant or co-currently liquid flow; with/without packing) including A2PS-B-POP optical needle probe.
Fluids 06 00321 g002
Figure 3. Investigated structures: (A) Cubic regular with a unit cell size of 6 mm, (B) Cubic on the tip with a unit cell size of 6 mm, (C) Cubic on the tip with a unit cell size of 5 mm, (D) Cubic regular with dissimilar sizes on either side (5 mm and 6 mm); all structures have a strut thickness of 1 mm.
Fluids 06 00321 g003
Figure 4. Determination of the change in liquid level ((A) Initial level (yellow), (B) Lower reference during bubbling (red), (C) Mean reference during bubbling (red), (D) Upper reference during bubbling (red)) at uG = 5.2 × 10⁻³ ms−1.
Fluids 06 00321 g004
Figure 5. Comparison of the overall gas volume fraction in water without packing; ECVT (blue) versus volume expansion method (red).
Fluids 06 00321 g005
Figure 6. Case 2 overall gas holdup from ECVT data versus volume expansion method; (a) 6 mm cubic regular; (b) 6 mm cubic on the tip; (c) 5 mm cubic on the tip; (d) 5 mm/6 mm modified structure regular.
Fluids 06 00321 g006
Figure 7. ECVT visualization of the local gas holdup for an aerated empty tube at uG = (a) 5.2 × 10⁻³ ms−1 (b) 10.3 × 10⁻³ ms−1 and (c) 15.5 × 10⁻³ ms−1, and a packed column with 6 mm cubic on the tip structures with H/D = 1.81 at uG = (d) 5.2 × 10⁻³ ms−1 (e) 10.3 × 10⁻³ ms−1 and (f) 15.5 × 10⁻³ ms−1.
Fluids 06 00321 g007
Figure 8. Averaged radial gas holdup profiles of the modified structure, in initial orientation (red) and rotated by 180° (blue).
Fluids 06 00321 g008
Figure 9. Overall gas holdup over superficial gas velocity for three ECVT measurement repetitions compared with the visual reference showing the reproducibility of the ECVT measurement technique.
Fluids 06 00321 g009
Figure 10. Case 3 and Case 4 ECVT versus visual reference for two different liquid flow rates (8.8 × 10⁻³ m s−1 corresponds to “low” and 20 × 10−3 m s−1 to “high”); (a) empty tube; (b) 6 mm cubic on the tip; (c) 5 mm cubic on the tip; (d) 5 mm/6 mm modified structure regular.
Fluids 06 00321 g010
Figure 11. Comparison of the different measuring methods: ECVT (blue), A2PS-B-POP optical probe (black), volume expansion method (visual reference); min and max (gray) and the correlation after Ueyama and Miyauchi [44] for b = 1.8 (red) and b = 2.3 (yellow) in the empty pipe.
Fluids 06 00321 g011
Table 1. Experimental conditions.
Temperature
T
[°C]
Pressure
p
[Pa] × 102
Superficial Liquid Velocity
ul
[m∙s−1] × 10−3
Superficial Gas Velocity
ug
[m∙s−1] × 10−3
20 ± 11013 ± 30{0, 8.8, 20}{2.6, 5.2, 7.7, 10.3, 12.9, 15.5}
Table 2. Overview about the investigated cases.
Case:Liquid Flow Mode:Packing:
1Bubble Columnw/o POCS
2Bubble ColumnPOCS
3Co-current Floww/o POCS
4Co-current FlowPOCS
Publisher’s Note: MDPI stays neutral with regard to jurisdictional claims in published maps and institutional affiliations.

