Article

Rheological Characteristics of Soluble Cress Seed Mucilage and β-Lactoglobulin Complexes with Salts Addition: Rheological Evidence of Structural Rearrangement

1
Department of Food Process Engineering, Faculty of Food Science and Technology, Gorgan University of Agricultural Sciences and Natural Resources, Gorgan 49138-15739, Iran
2
Food, Chemical and Biotechnology Cluster, Singapore Institute of Technology, 10 Dover Drive, Singapore 138683, Singapore
3
Department of Pharmaceutical Nanotechnology and Center for Nanotechnology in Drug Delivery, Shiraz University of Medical Sciences, Shiraz 71348-14336, Iran
*
Authors to whom correspondence should be addressed.
Gels 2023, 9(6), 485; https://doi.org/10.3390/gels9060485
Submission received: 20 May 2023 / Revised: 3 June 2023 / Accepted: 5 June 2023 / Published: 13 June 2023
(This article belongs to the Special Issue Advances in Polymer Rheology)

Abstract

:
Functional, physicochemical, and rheological properties of protein–polysaccharide complexes are remarkably under the influence of the quality of solvent or cosolute in a food system. Here, a comprehensive description of the rheological properties and microstructural peculiarities of cress seed mucilage (CSM)-β-lactoglobulin (Blg) complexes are discussed in the presence of CaCl2 (2–10 mM), (CSM–Blg–Ca), and NaCl (10–100 mM) (CSM–Blg–Na). Our results on steady-flow and oscillatory measurements indicated that shear thinning properties can be fitted well by the Herschel–Bulkley model and by the formation of highly interconnected gel structures in the complexes, respectively. Analyzing the rheological and structural features simultaneously led to an understanding that formations of extra junctions and the rearrangement of the particles in the CSM–Blg–Ca could enhance elasticity and viscosity, as compared with the effect of CSM–Blg complex without salts. NaCl reduced the viscosity and dynamic rheological properties and intrinsic viscosity through the salt screening effect and dissociation of structure. Moreover, the compatibility and homogeneity of complexes were approved by dynamic rheometry based on the Cole–Cole plot supported by intrinsic viscosity and molecular parameters such as stiffness. The results outlined the importance of rheological properties as criteria for investigations that determine the strength of interaction while facilitating the fabrication of new structures in salt-containing foods that incorporate protein–polysaccharide complexes.

Graphical Abstract

1. Introduction

Liquid–liquid phase separation or complex coacervation involves interactions between molecules that ultimately make charged polymers bind with each other, especially in protein–polysaccharide interactions [1]. Where complex coacervation occurs, solvent–polymer and polymer–polymer interactions usually bring change to the rheology of components [2]. This can be regarded as a complex formation between polymers, while finding the specifications of this formation can involve measurements of viscosity and viscoelastic properties. In particular, the said properties can be detected in the isolate–beet pectin of ovalbumin/dextran sulfate [3], pea protein [4], and rice bran protein–flaxseed gum [5]. In other words, despite the macromolecular importance of the interaction of polymers (i.e., type and intensity of chemical interaction, structure, and conformations), the rheological properties of the complex can remarkably affect both macromolecular perspective and application of complexes.
With its small size, β-lactoglobulin (Blg) is a compact, dominant, globular part of whey protein, and has received considerable attention due to its extensive functional properties (i.e., foaming, emulsification thickening, delivery of lipophilic micronutrients, and bioactive molecules) [6]. Due to electrostatic repulsions between its monomers, Blg solutions are stable. Near the isoelectric point (pI = 5.1), it, however, starts to aggregates and form a different structure depending on the ionic strength and pH of the solution [7]. There is a possibility to impress the aggregation, thereby generating functional properties of Blg when it enters complexation with other biopolymers such as acacia gum [8], pectin [9], and κ-carrageenan [10].
Cress seed mucilage (CSM) is mostly comprised of carbohydrates (85%) and is extracted from Lepidium sativum. The molecular weight of CSM is approximately 540 kDa. Its zeta potential is −10.78 ± 0.19 mV and it is characterized by an intrinsic viscosity of 13.3 dL/g. While it is regarded as a polyelectrolyte molecule, CSM comprises a rigid chain conformation and contains D-galacturonic acid and D-glucuronic acid [11]. As a novel source of hydrocolloids, CSM is indicated by unique functional properties and physicochemical features in the scientific literature [12,13]. It can withstand a diversity of pH values, ionic effects of NaCl and CaCl2, and heat effects by thermal processing. These properties make CSM a suitable option in formulating foods.
The polyelectrolytic and anionic features of this hydrocolloid can facilitate the formation of mucilage-based complexes with protein molecules, while also having the ability to participate in electrostatic reactions. In previous research, the electrostatic interactions of cress mucilage with Blg have been studied and approved. While electrostatic attraction has a significant role in regulating the integrity of Blg with its polar charges, the attraction is specifically sourced from cationic amino groups and from those on CSM macromolecules (i.e., anion groups). Thus, the ionic strength of the medium can largely suppress interactions while causing complex formations in insoluble/soluble forms and changing the properties of physicochemical features. On the other hand, the electrostatic interaction between CSM and Blg can be affected by modifying the solvent through the use of additives such as salts. Accordingly, the compatibility (i.e., miscibility of polymers with other polymers) of the ingredients, hydration parameters (coil radius and volume), hydrodynamic parameters (chain flexibility; stiffness), and their conformation can be altered by changes occurring in the solvent, which is assessable by rheological measurements [14].
In multiphase systems such as polymer blends, there is a possibility to monitor the structure complexation with the investigation of flow behavior and especially with viscoelasticity studies. Therefore, any changes in the morphology of the CSM–Blg structure were assessed at different salt conditions to derive a relationship between the structural variations and rheological characteristics. In this context, the present paper addresses the multifaceted dimensions of rheological features (i.e., flow behavior, formation of complexes and interactions) along with the aggregation behavior and structural changes of the CSM–Blg complex in the presence of NaCl and CaCl2. The results of the current research can shed light on specific potentials for prospective uses in pharmaceutical media and in functional foods that contain salt. These can benefit from the CSM–Blg complex in their stability and preservation.

2. Results and Discussion

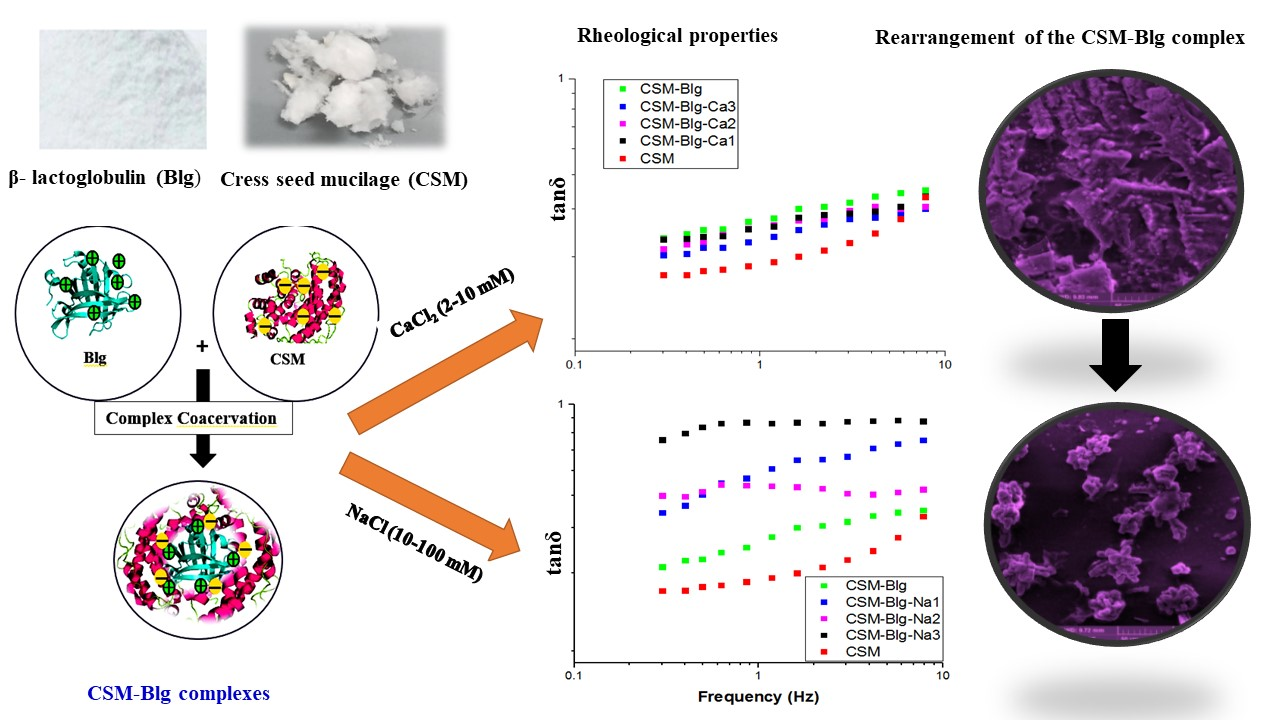
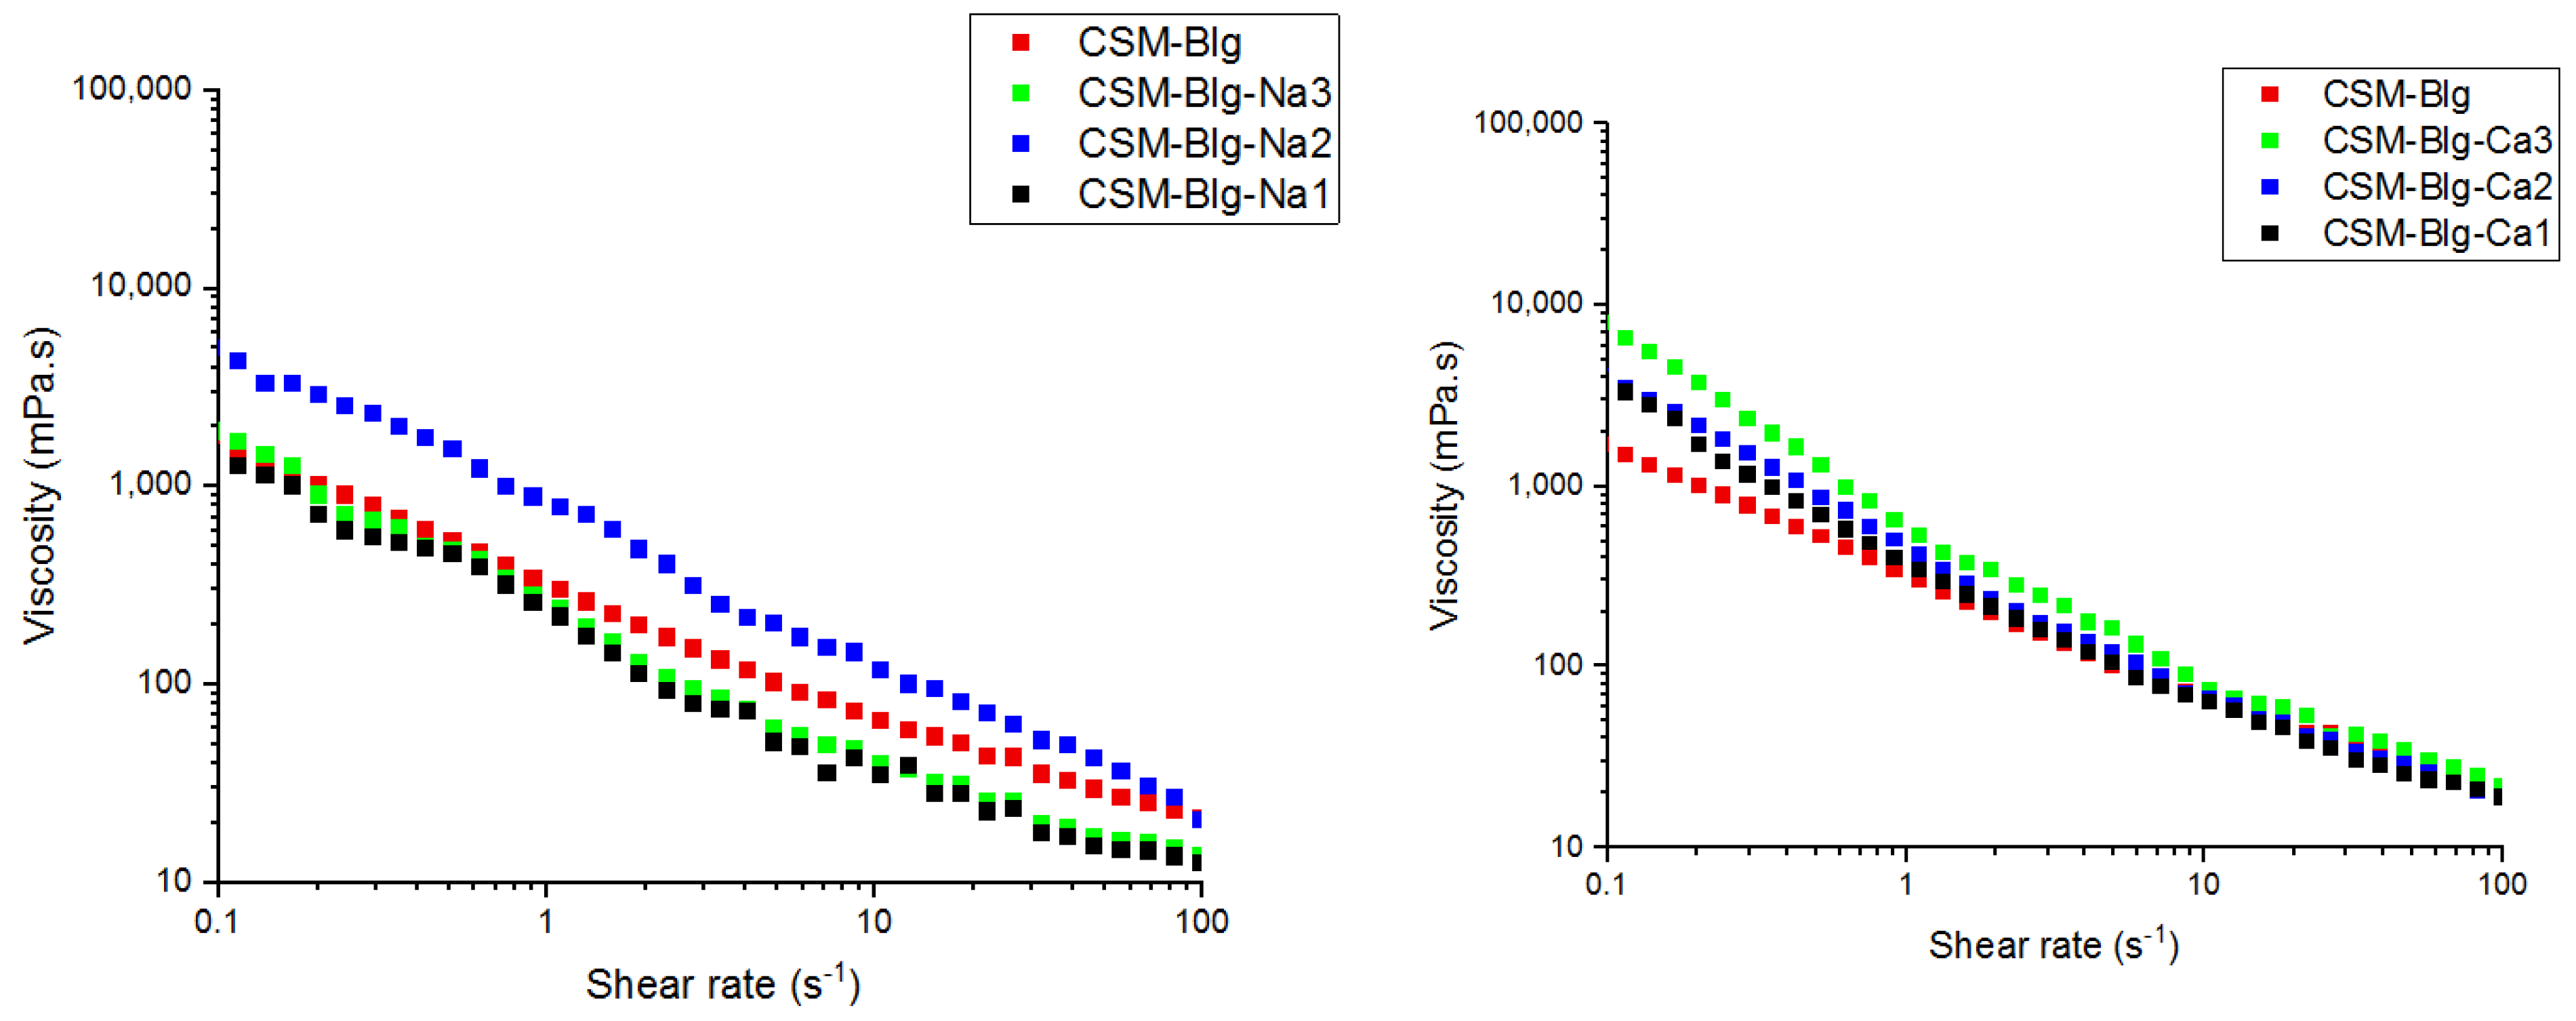
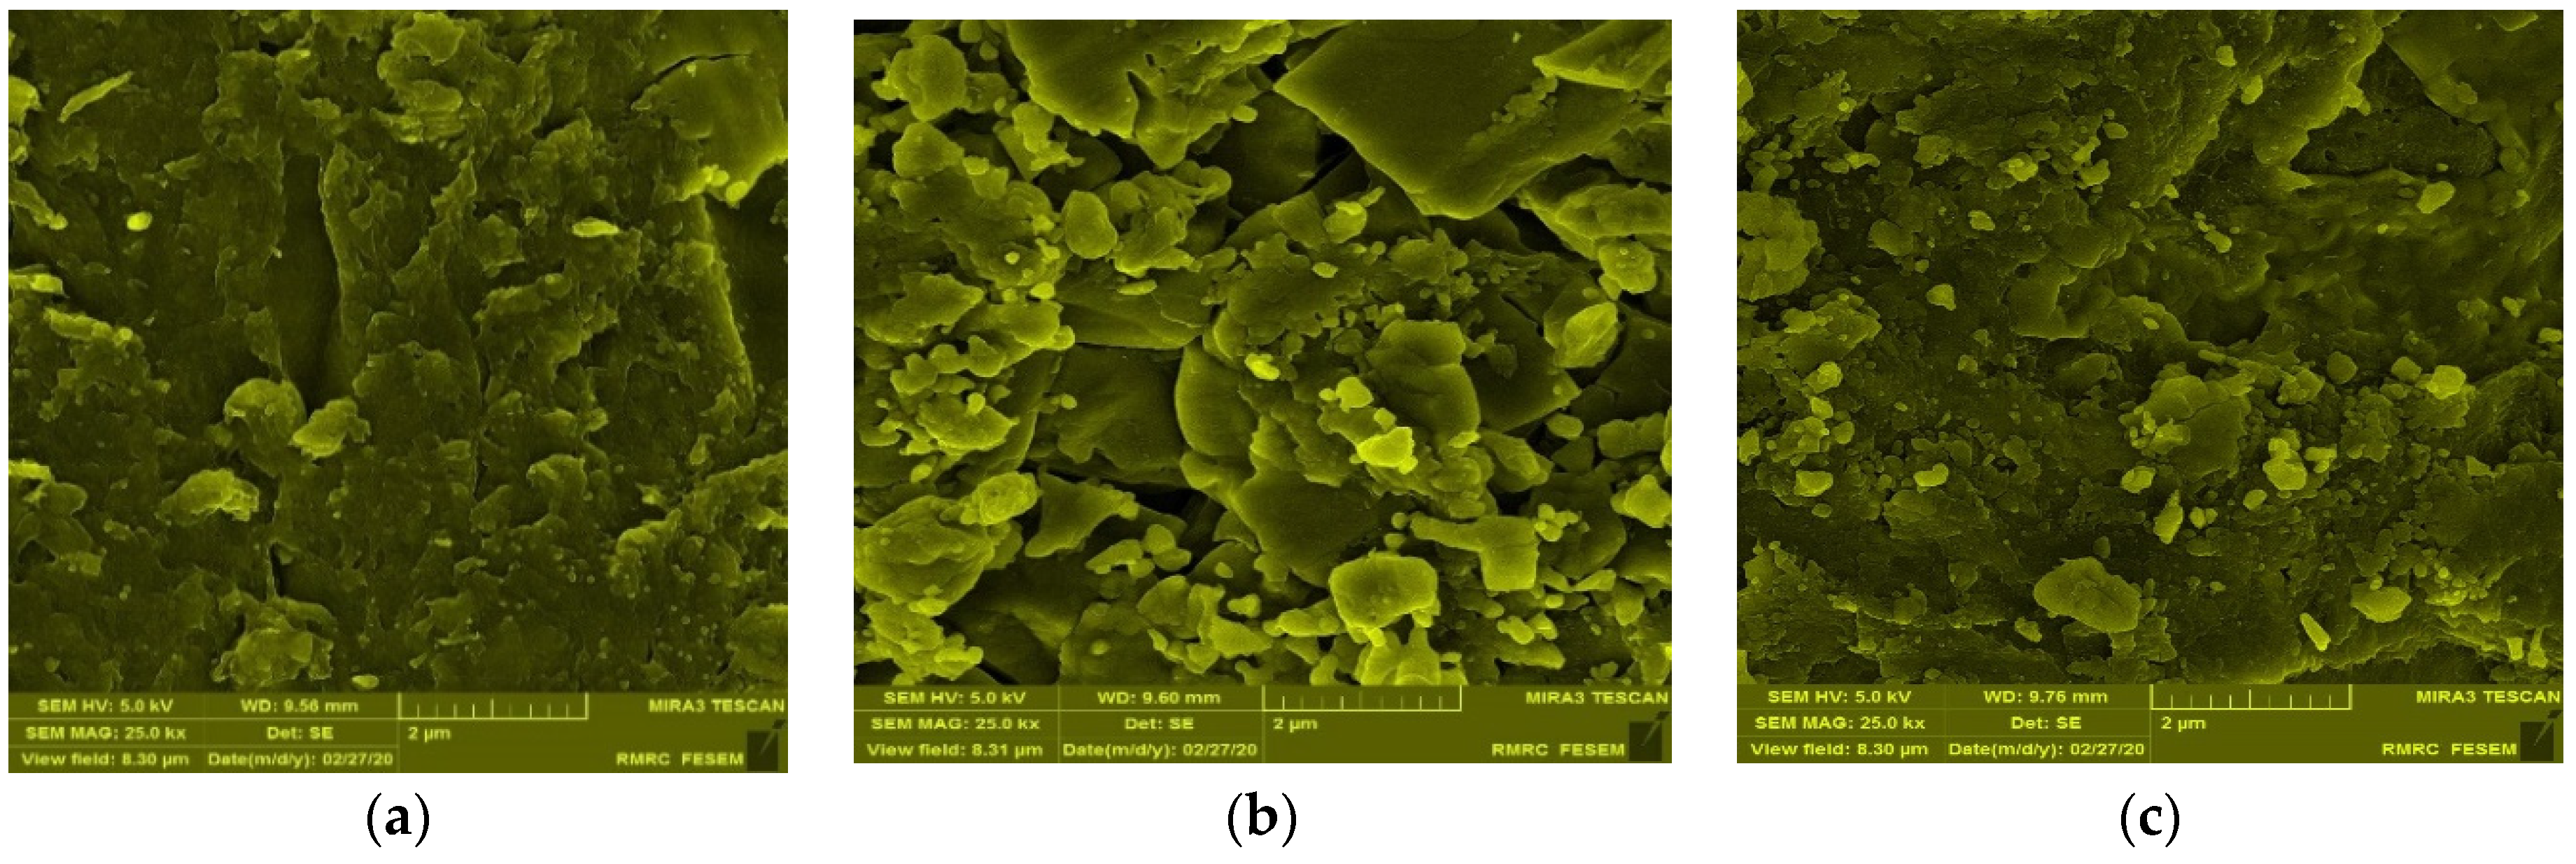
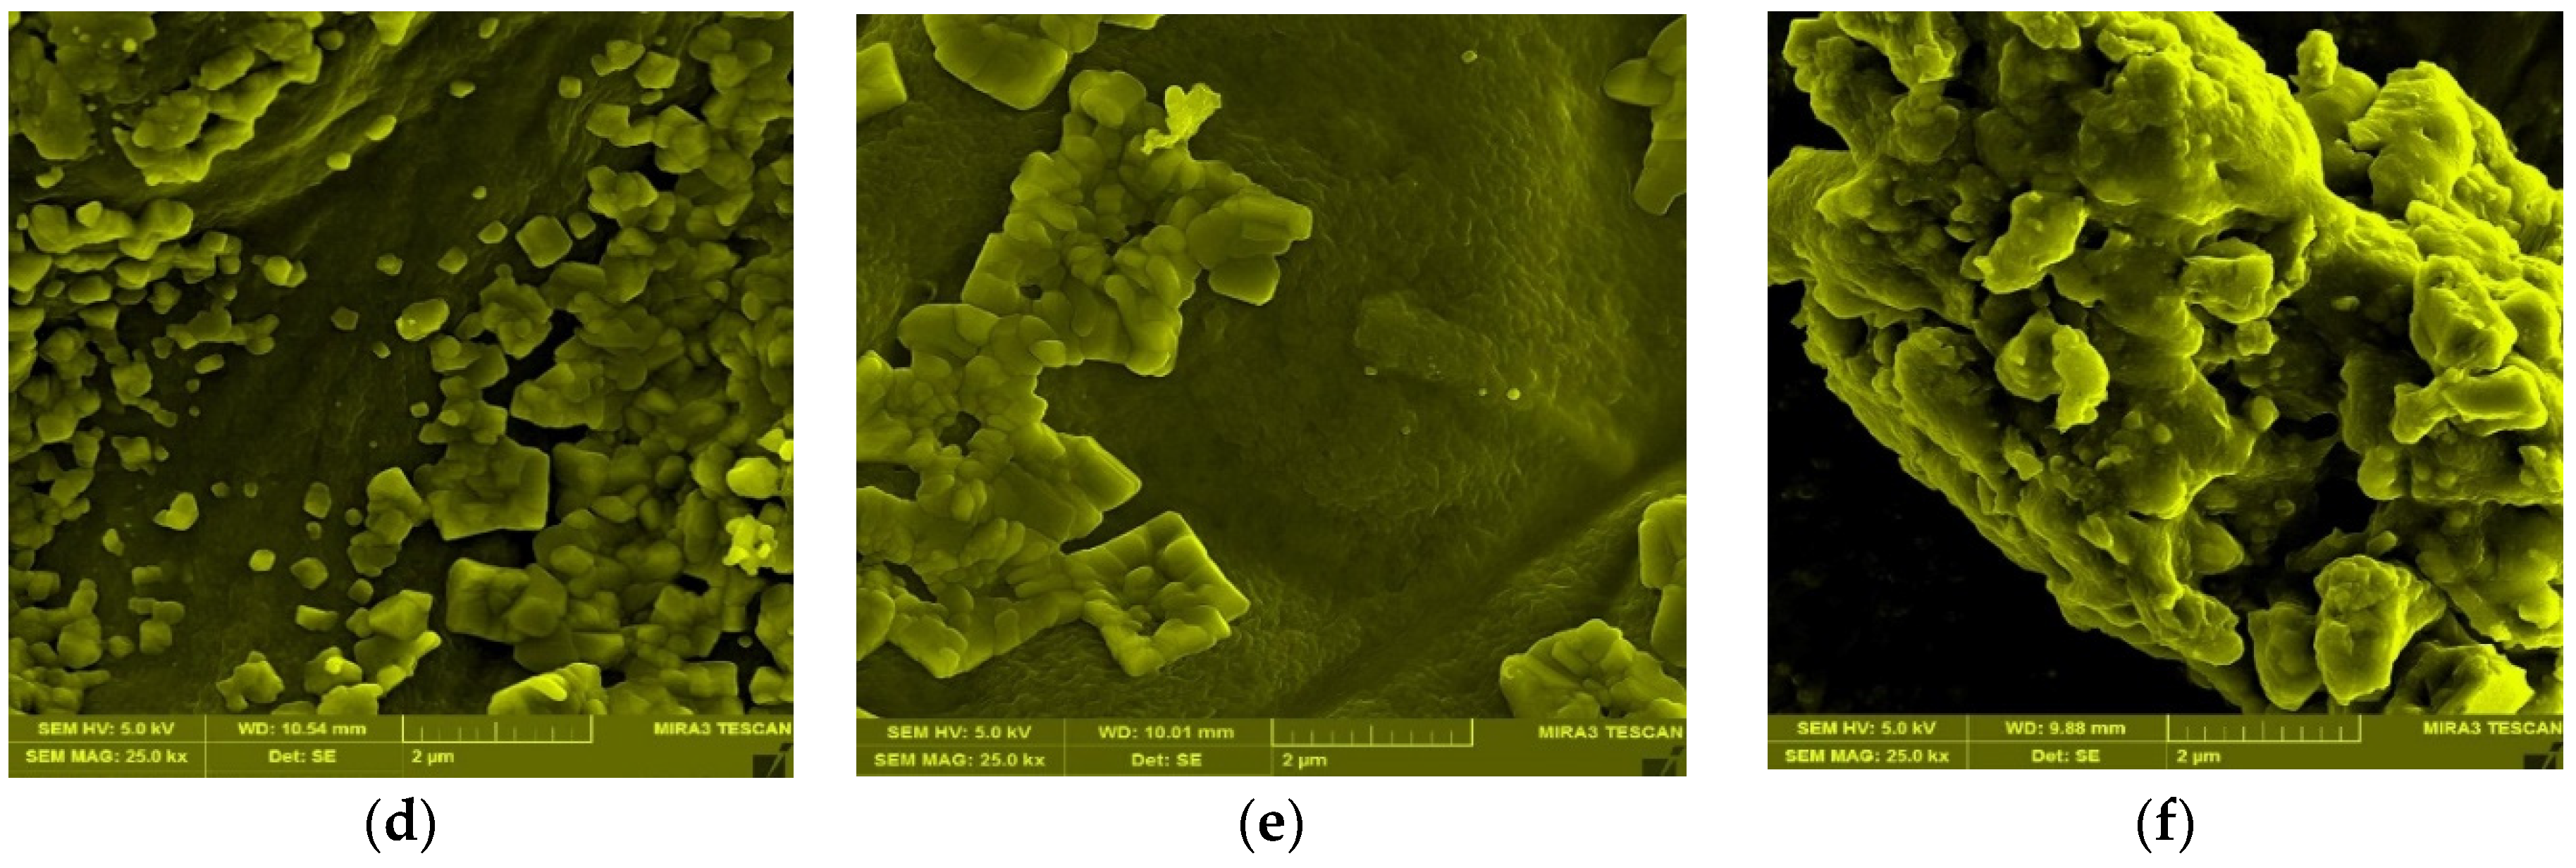
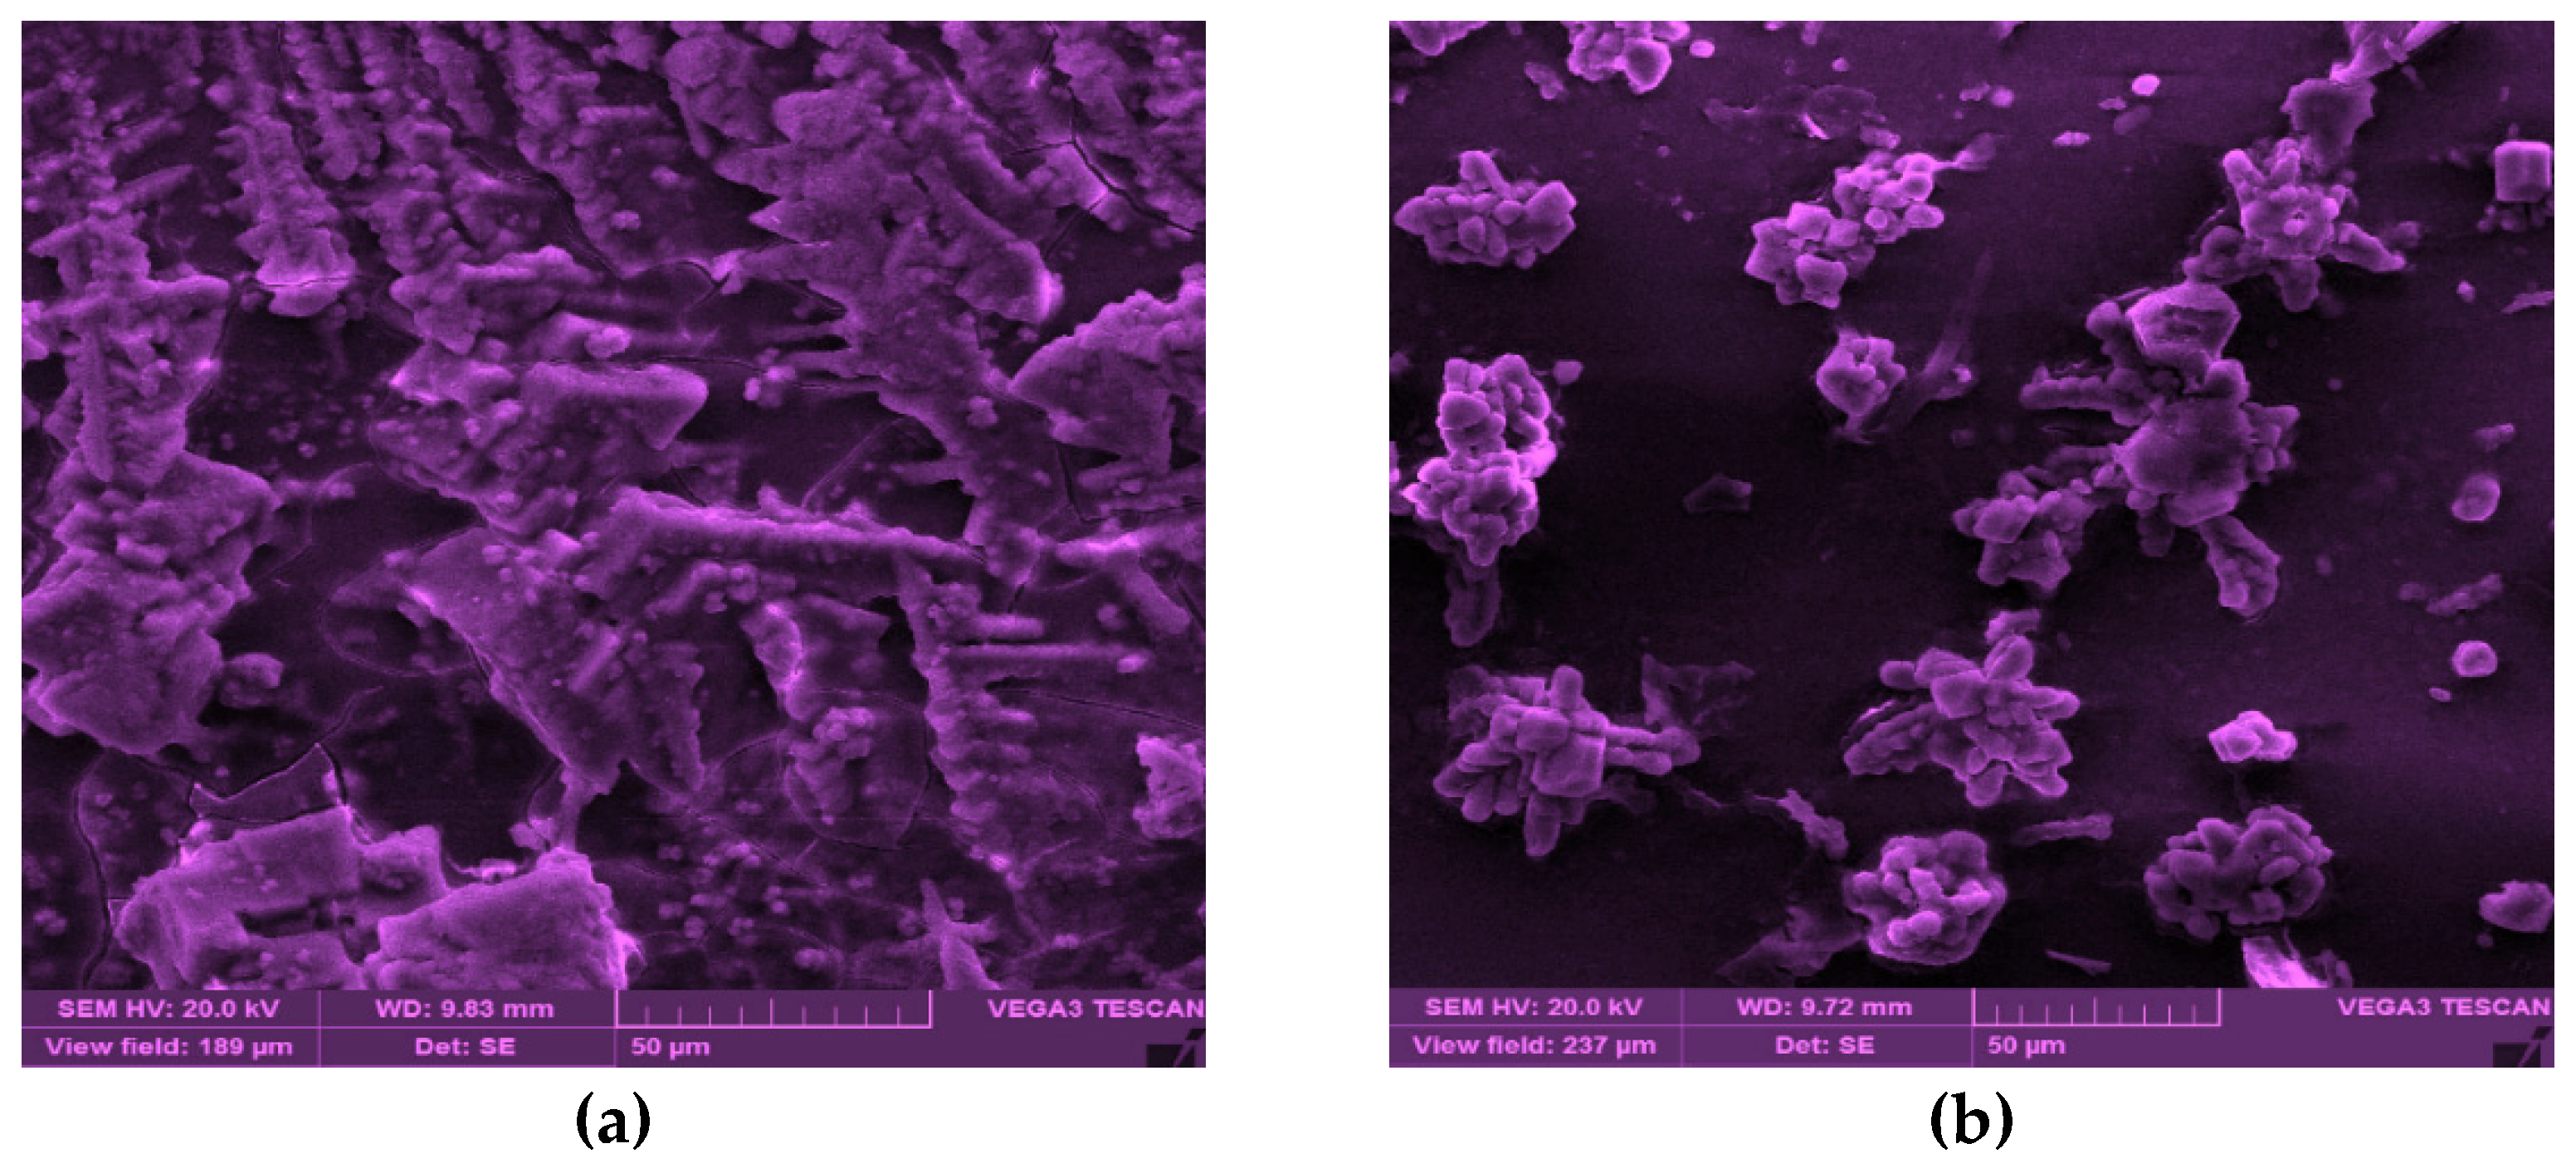
2.1. Morphological Analysis and Steady Shear

Exploring the suitability of models was aimed at achieving precise indications of flow behavior, which involved 2 w/v% CSM–Blg solutions. Rheological models that were time-independent in this research were used in measuring data of shear stress–shear rate in CSM–Blg solutions. Despite that these models indicated large values of R2, the experimental data suggested that the Herschel–Bulkley model performed optimally (i.e., with the highest R2) (Table 1). Regarding the flow behavior of CSM, the Herschel model has already been described in the available literature as a suitable option for this purpose [15]. Considering the higher coefficient of determination in association with the CSM–Blg complex in this model, polysaccharides are important in directing the flow properties of the protein–polysaccharide complex. A shear thinning (pseudoplastic) behavior (nH < 1) was observed in CSM–Blg complexes, which partly emanated from differences in salt concentrations, alignment of anisotropic particles, interacting particles, and their rearrangements, and an applied change in shear rate (0.1–100 s−1) in combination with the structural relaxation of complexes [16,17]. The highest nH and the lowest k were attributable to the CSM–Blg, meaning that the salt incorporation increased the pseudoplasticity (n) and thickening (k) properties of the complex. In general, adding the electrolyte to polymer solutions stabilized by an extending electrical double layer (EDL) results in the compression of the layer (Debye–Hückel theory), and addition of further electrolyte led to the collapse of the double layer, loss of structure, and a corresponding shear thinning behavior [18,19].
The strength of attraction-forced electrostatic interactions between protein–polysaccharides can be monitored in association with viscosity. Due to the higher viscosity of polysaccharides in comparison with proteins, the increase in protein viscosity after complex formation contributed to the formation of continuous network structure through polymers that take part in complex coacervation [20,21]. In polyelectrolyte molecules such as CSM, viscosity is affected by ionic strength. In CSM–Blg complexes, the highest value of apparent viscosity was measured in the treatment group that had 10 mM CaCl2 (7.95 Pa.s at 0.1 s−1) and 50 mM NaCl (4.97 Pa.s at 0.1 s−1) (Figure 1), which can be due to a tightly packed structure that generated the strongest electrostatic interactions of attraction between CSM and Blg molecules [22,23]. Hasanvand and Rafe (2018) conducted research on the complexation of rice bran protein–flaxseed (Linum usitatissimum L.) and showed that the complex had higher levels of apparent viscosity due to its denser structure and higher electrostatic attraction between the gum and protein molecules. Liu et al. (2017) reported that enhancement of viscosity can be attributed to a higher degree of compatibility among biopolymers at the medium levels of salt which increased the prevalence of biopolymers in the continuous phase, thereby making entanglement more probable in the chains [24].
The higher the NaCl concentration, the lower the viscosity of the CSM–Blg complex system. This trend can be assigned to the reduced charge density of counter-ions with the polymer molecules which, in turn, declined the electrostatic attraction of the charged groups on the polymer chains [25]. An investigation into the aggregation behavior of CSM–Blg complexes with FE-SEM (Figure 2a–c) showed that NaCl, at low concentrations in a biopolymer mixture, ultimately led to structures that were tightly packed. Nonetheless, adding more salt beyond this point (50 mM) caused a dissociation of CSM–Blg agglomerates (i.e., more loosely packed structure) due to the screening of charges by dissolved Na+ and Cl. Similar findings were reported by Zhang et al. (2021), who examined the rheological characteristics of the pea protein isolate–chitosan complex. Accordingly, it was reported that the maximum amount of packed network structure of the complex was prepared at 0.1 M NaCl, whereas higher concentrations caused a loosening of the complex’s structure [25,26].
FE-SEM images showed how the biopolymer mixture contained CaCl2 at small concentrations (2 and 5 mM), implying that the structures are more packed, although further increases in the CaCl2 concentration culminated in a slightly porous structure (Figure 2d–f). An increase in the apparent viscosity was reported as an increase in porosity at high ionic strength (CaCl2) in the chitosan–whey protein isolate complex [27,28]. In this regard, W. Wang et al. (2018) studied the Mesona blumes polysaccharide–soy protein complex and showed rougher and larger networks, surfaces, and pores when using high CaCl2 concentrations (0.015–0.02 M), compared to low concentrations (0.005–0.01 M). In sum, the CSM–Blg complex had a viscosity value that showed that the apparent viscosity was increased by the action of CaCl2 at high concentrations. This happened through the porosity of the structure, whereas quite the opposite occurred when using NaCl [29].
As a general rule of thumb, for biopolymer complexes to act as structuring agents in food formulation systems, they must demonstrate shear thinning characteristics and high viscosity. Moreover, the viscoelasticity (elastic component predominates over the viscous component) has the same significance.

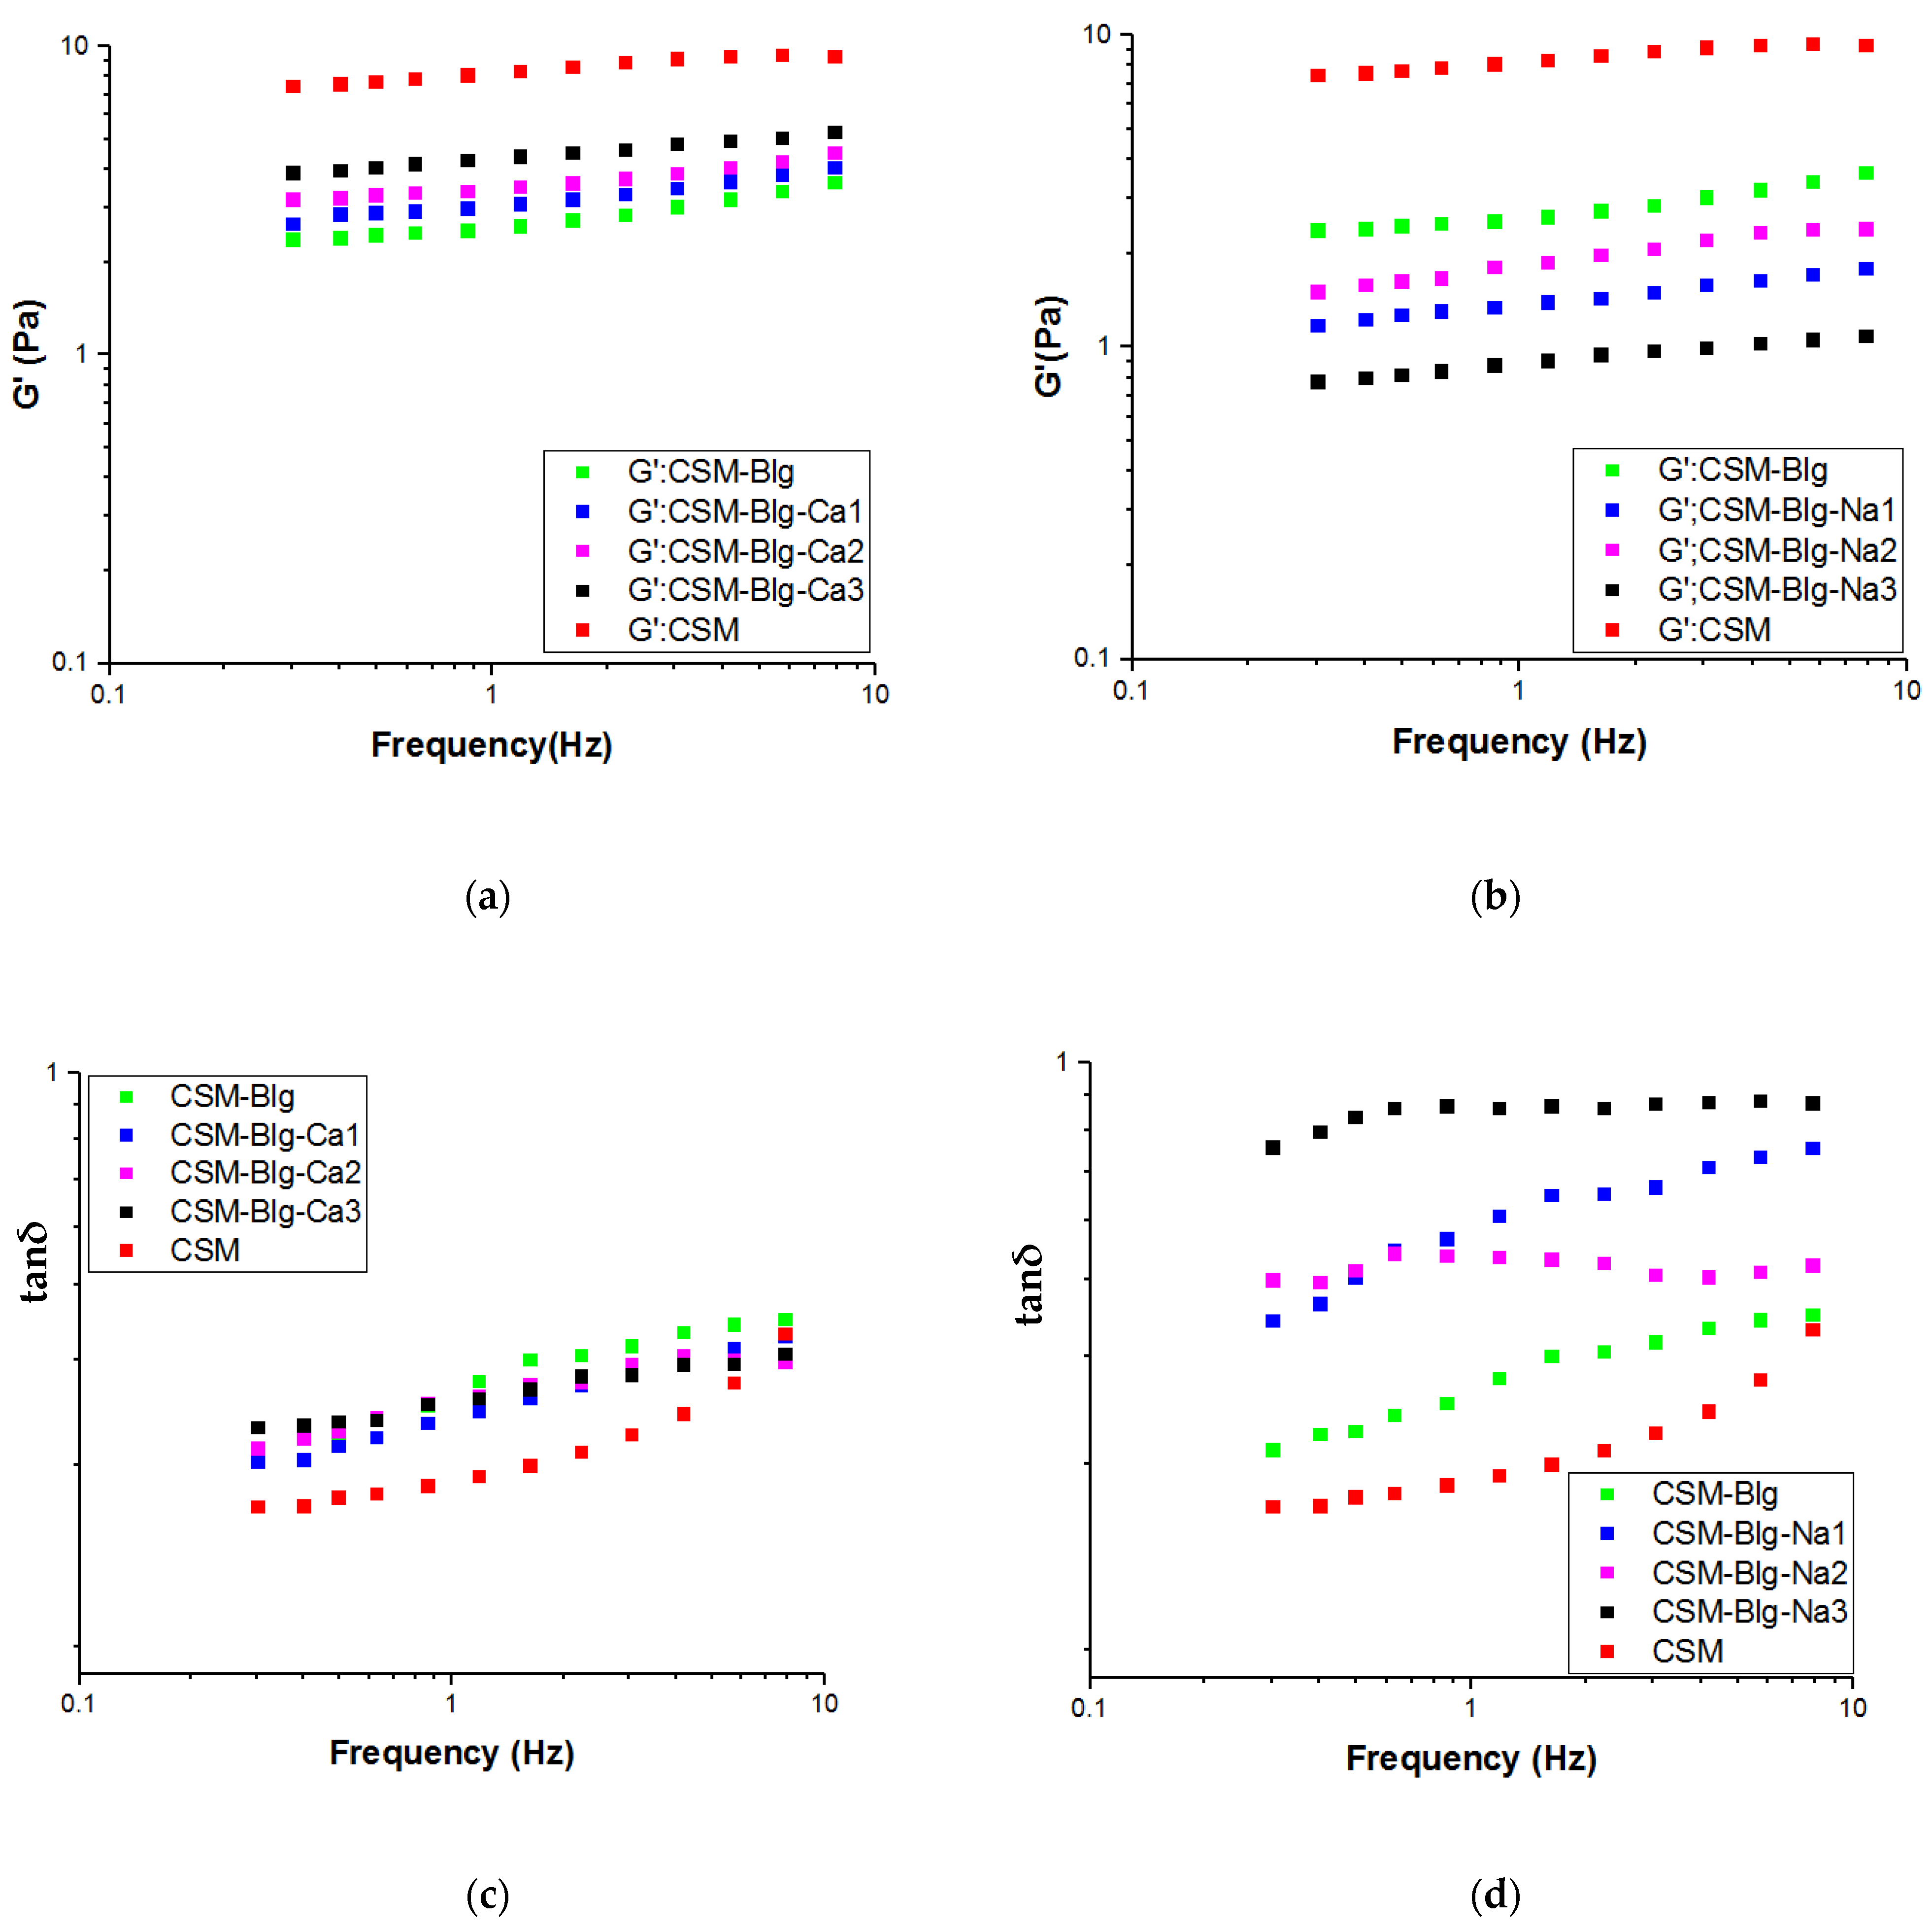
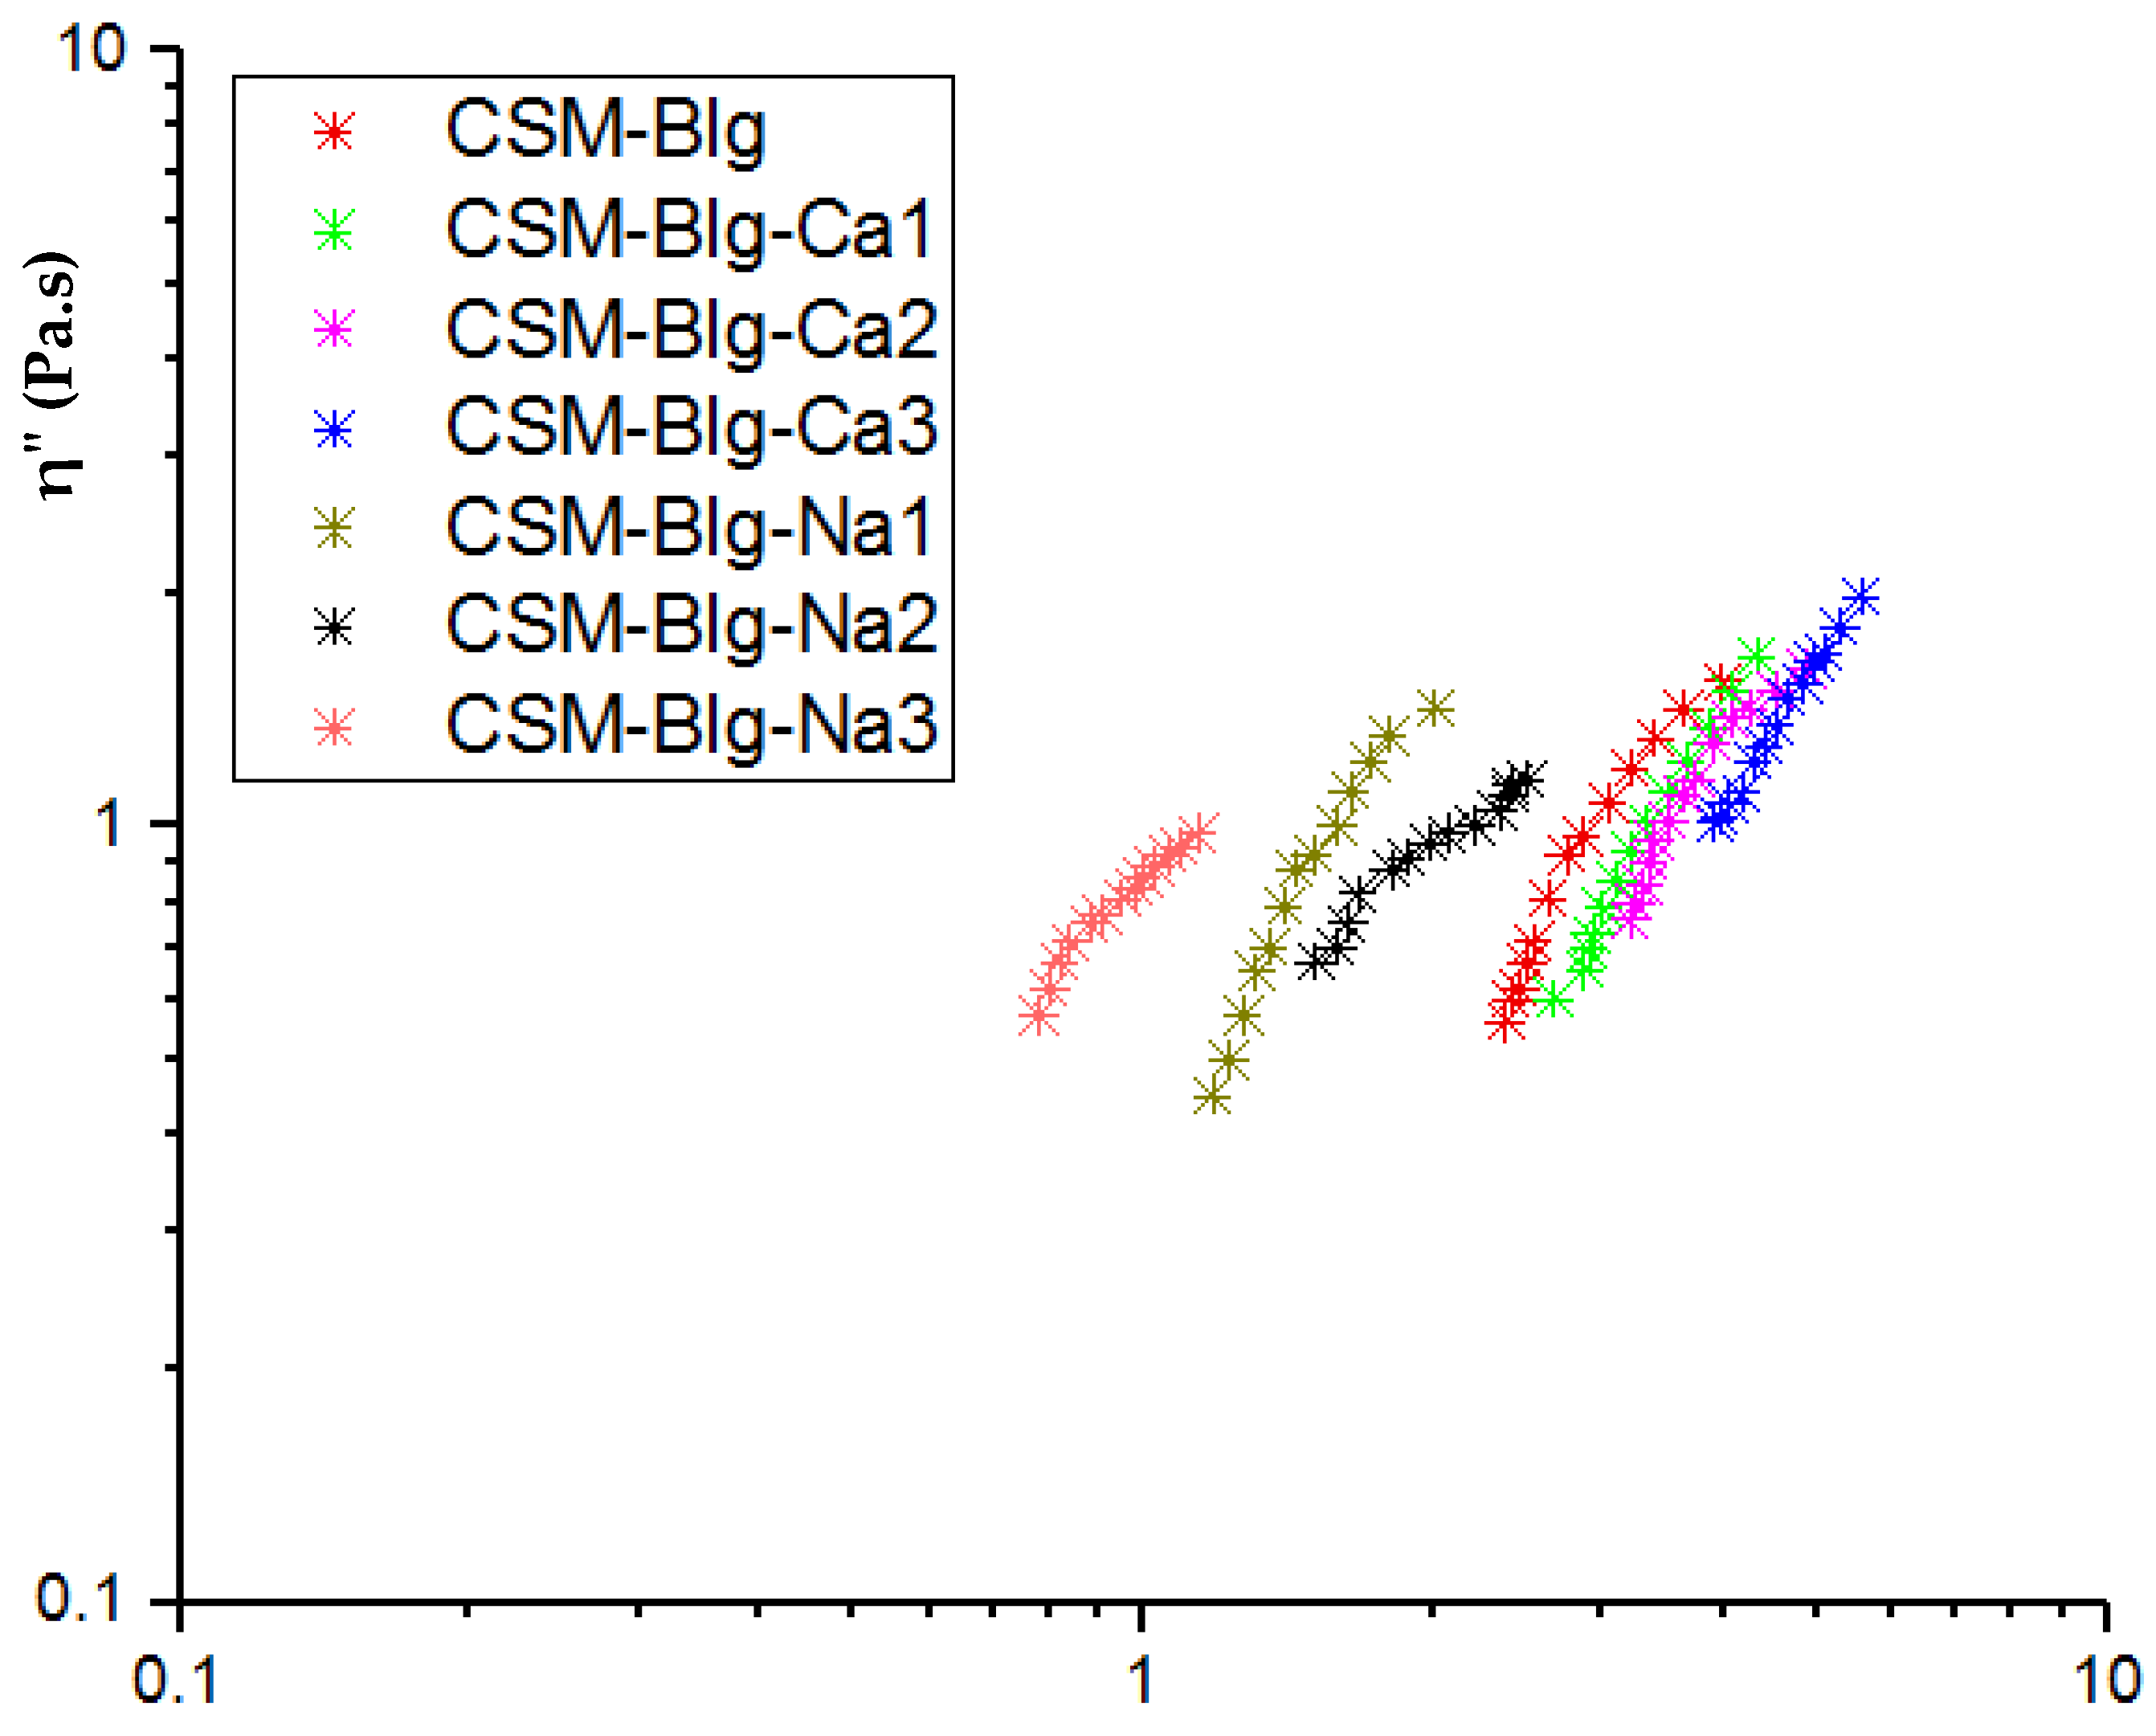
2.2. Frequency Sweep Results

In polymer blends (as a multiphase systems), the strength of complexation and structure of the biopolymers can be monitored by studying the viscoelasticity. For the evolution and to reach the ideal from the structure, it is necessary to applied small strain in experimental condition, so the dynamic oscillatory method may obtain the true responses. Here, Figure 3a–d illustrate the tanδ in CSM–Blg complexes and depicts how G’, G” values are frequency-dependent. These details are required for an accurate understanding of the different effects caused by calcium concentrations (2–10 mM) and sodium ion concentrations (10–100 mM). In comparison with Blg–CSM complexes and in the same concentration, the CSM had a bigger G′ and G″ values. A single-protein biopolymer, especially globular protein (Blg), was unable to create viscoelastic properties at low concentrations. Thus, after its interaction with polysaccharides, the viscoelastic properties of the Blg–CSM complex probably decreases, compared to the polysaccharide alone [30].
Higher values of G were compared to the low values of G″ in the analyses of frequency, which demonstrates that a network structure of an interwoven gel was created by all CSM–Blg complexes. In fact, this confirms the interactions between Blg molecules (weak elastic property) and CSM and highlights the role of CSM in terms of rheological features. Similar gel features that mimic frequency dependence (G′, G″) have been indicated in previous research on soy protein isolate–chitosan as a matrix for protein–polysaccharide complexes [31]. Other matrixes in the available literature include pea protein isolate–sugar beet pectin [32] and gelatin–gum Arabic [33]. Nonetheless, where biopolymer systems comprised ovalbumin–gum Arabic as a matrix for complexes, a viscous behavior became prominently apparent [34].
Adding sodium ions lowered the modulus further, whereas calcium ions induced an increase in the modulus but did not recover the CSM solution modulus. In comparison with CaCl2 and NaCl, where G′ varied in response to CaCl2, G′ values increased in response to higher concentrations of CaCl2 (Figure 3a). While greater values of G′ reflect a network structure with stronger internal connection and construct, measurements of viscoelasticity showed that adding CaCl2 acted in favor of the interaction between CSM and Blg. The viscoelastic properties of CSM–Blg complex with the addition of NaCl were inferior to that of the complex in the presence of CaCl2. In response to higher NaCl concentrations (10–100 mM), both dynamic G′ and G″ decreased in value and reached their lowest in response to NaCl = 100 mM, suggesting how weaker gel network structures gradually grow deformed in the presence of NaCl. On the other hand, using 50 mM NaCl caused an increase in the value of G′, although a salient difference still occurred in comparison with the salt-free sample (Figure 3b). According to the literature, Xiong et al. (2016) studied the complexation of ovalbumin (OVA)–chitosan (CS) and reported that a stronger network structure between OVA and CS led to a high value of G′ in response to 50 mM NaCl [34]. Meanwhile, Xiong et al. (2017) reported that a high range of ionic strength (20–400 mM) in an ovalbumin–carboxymethylcellulose complex was the precursor of a decrease in the viscoelastic properties of the complex through shielded biopolymer charges, thereby making a loosely compacted structure [35].
The phase angle (tan δ) is another important numerical value that can facilitate a precise evaluation of a given complex in terms of viscoelastic behavior. In fact, the ratio of G″/G′ serves as a definition of the phase angle [36,37]. As can be seen in Figure 3c,d, where G″/G′ < 1, solid elasticity became apparent in the CSM–Blg complexes. Accordingly, a strong solid elasticity was observed in the CSM–Blg complexes when CaCl2 was used. The tanδ value grew small in response to low CaCl2 concentrations (2 mM), compared to high concentrations. In contrast, tanδ became small in response to low NaCl concentrations (10–50 mM), but increased in response to the high NaCl concentration (100 mM) [38]. This finding was similar to previous results by W. Wang et al. (2018) regarding complexation in Mesona blumes polysaccharide–soy protein isolates, demonstrating that high sodium ion concentrations (0.02 M) can result in poorer solid elasticity in a complex. Generally, the findings showed that the frequency dependence of G′, G″, and tan δ is sophisticated and considerable in the CSM–Blg system, although it is heavily dependent on the salt concentration.
To assess (n′ and n″) and (k′ and k″) from Equations (5) and (6), nonlinear regression analysis (power law models) were taken from oscillatory measurements and applied onto all complexes. As observed, the model can finely estimate both G′ and G″ alterations vs. frequency (R2 = 0.95–0.99) and (R2 = 0.94–0.99), respectively. Since the value was much higher than the k″ value in the case of all complexes (k″/k′ < 1, Table 2), the previous results can be confirmed regarding the gel behavior of these systems [39]. Incorporating the CaCl2 into CSM–Blg complexes caused a decrease in n′ and n″ values, whereas significant increases were observed in the magnitudes of k′ and k″, thereby manifesting a decrease in frequency dependence and a stronger gel behavior.
The values of (n′ and n″) and (k’ and k″) are indicative of the number and strength of interactions, respectively. If all of the indexes (n′, n″, k′, and k″) were enhanced, the elastic part is dominated, which means the solid viscoelastic-like response is more prominent in the interaction of polymers. In contrast, a decline in these indexes reflects the dominance of the liquidlike viscoelastic features and the higher fluidlike behavior in the interactions [40]. As demonstrated in Table 2, the magnitudes of n′ and n″ for CSM–Blg–Na ranged between (0.105–0.148) and (0.137–0.311), indicating the dominance of liquidlike character with the addition of NaCl (100 mM).
The Cole–Cole graph demonstrates the relaxation and miscibility of the polymer blends. This graph can be also used to identify the structural changes [41]. The Cole–Cole plot indicates the frequency dependence of the imaginary viscosity η″ (G′/ω) versus the real viscosity η′ (G″/ω) (Figure 4). The curves did not superimpose with each other in the presence of sodium and a high concentration of calcium, showing that the complex creates various structures after the addition of salts. Moreover, the Cole–Cole plot of all CSM–Blg complexes showed a semicircular shape with one arc corresponding to the compatibility and homogeneity of complexes at the presence of salts [42]. At high concentrations, the plots showed a clear deviation from the semicircular shape and indicated a linear variation of the storage viscosity versus the loss viscosity. This represents a gel structure and demonstrates the occurrence of maximum particle–particle interactions at high calcium ion levels. In an ideal Maxwellian fluid, the semicircular and smooth curves suggest the proper miscibility of the polymer. Any deviation from this shape demonstrates the incompatibility of participant polymer in complexation. The power law model was used for the evolution of the deviation from the semicircular shape. The power law index (α) is indicated in Table 2. CSM–Blg demonstrated the worst miscibility at the presence of low and high concentrations of NaCl.

2.3. Dilute Solution Properties

The intrinsic viscosity (η) is a convenient way to measure the hydrodynamic volume occupied by individual macromolecule coil and is closely related to the size and topological structure of the macromolecular chains [43]. The results of fitting the intrinsic models are demonstrated in Table 3, which suggests high accuracy for Higiro 1 models (R2 = 0.93 to 0.98) for all CSM–Blg complexes, showing the efficiency of these models to measure the intrinsic viscosity of CSM–Blg complexes in various solvents/cosolutes (Table 3). As indicated in Table 3, the intrinsic viscosity was remarkably affected by enhancing the ionic strength (I). The intrinsic viscosity of CSM–Blg in deionized water was reported to be 0.46 ± 0.03 dL/g, which is higher than those of other complexes in presence of salts (see Table 3). This confirms the reduced quality of solvent and synergy behavior of [η] between Blg and CSM with cosolute (NaCl and CaCl2) [44]. In the case of Na+ ion, an increase in I from 0.01 to 0.1 M resulted in a drop in CSM–Blg intrinsic viscosity compared to Ca+2 from (0.46 to 0.18 dL/g) and (0.46 to 0.28 dL/g), respectively. Such a decrease with the addition of NaCl can be assigned to the enhanced charge screening of polymer chain inducing more contracted conformation and causing a reduction in the hydrodynamic size of the molecule [45]. With the increase of CaCl2 in dispersions, intrinsic viscosities decreased (from 0.46 to 0.32 dL/g and from 0.46 to 0.25 dL/g) in the presence of 2 and 5 mM CaCl2 (Table 3), respectively. However, a slight increase was detected at high calcium concentrations.
For a deeper insight into the effect of the high concentration of calcium, SEM image analysis was carried out (see Figure 5). SEM images of the complex with no CaCl2 showed that most of the particles are clustered together, forming a rod shape. These big microparticles are mainly composed of small nanoparticles in various size ranges (roughly from 50 nm to several micrometers). Figure 5 depicts the complex with CaCl2 which exhibited a certain change in morphology with an organized structure. Some particles are tightly combined, and nanoparticles and microparticles showed a tendency to form an organized structure. i.e., hexagonal-like. In other words, the rearrangement of the particles to new structures could result in the variation of the rheology of this particle at high concentrations.
FTIR spectroscopy is a sensitive diagnostic tool for monitoring conformational alterations in biopolymers. Considering Blg, the observed peaks correspond to the β-sheet, random coil, α-helix, β-turn, and β-antiparallel sheet at 1613–1637 cm−1, 1637–1644.5 cm−1, 1644.5–1662 cm−1, 1662.5–1682 cm−1, and 1682–1689 cm−1, respectively. These parameters were previously confirmed by [46]. In our study, the strongest peak emerged at 1629 cm−1 for Blg. This peak describes how the native protein is organized in solution by the β-sheet. After the formation of the nanocomplex, a shift can be observed to 1630 cm−1 and 1628 cm−1 in Blg–CSM and Blg–CSM–Ca3, respectively, highlighting the possibility that Blg preserved its structures, suggesting the role of CSM in the reorganization of structure. A relatively big surface area exists in the β-sheet structure and can benefit the formation of ordered hydrogen bonds [47]. Thus, it can be inferred that hydrogen bonds contributed to the creation of CSM–Blg complexes. With a progressive amorphous state, the α-helix protein structure converts to the β-sheet structure when the solution comprises polysaccharides (Souza and Rojas (2016)). Sankalia et al. (2007) demonstrated that when biopolymers are mixed, they are thermodynamically stable. Thus, intermolecular interactions dominate the FTIR spectra of the mixed polymers, showing a deviation from their constituent polymers. In contrast, FTIR spectra overlapped with the mixture of two incompatible polymers (phase-separated). The FTIR results indicated that these two polymers are thermodynamically compatible (Figure 6). The thermodynamic compatibility of protein–polysaccharide complexes by FTIR was also reported by Raie et al. (2018) in a study on high methoxy pectin–whey protein and β-lactoglobulin and basil seed gum [48].
In sum, wherever the same ionic strength applied, the divalent ion (Ca2+) had a more prominent effect on intrinsic viscosity of CSM–Blg, compared to the monovalent type (Na+). A possible reason for this is the occurrence of molecular crosslinking among CSM and calcium ions, as well as various degrees of aggregation which lead to a diverse extent of molecular contraction [49]. The alteration of coil radius (Rcoil) and its corresponding volume (Vcoil) in CSM–Blg complexes was strongly affected by ion type and concentration, as demonstrated in Table 3. Rcoil values of CSM–Blg complexes were higher and were reduced with an increase in the salt level, which could be ascribed to less-extended CSM chains and more compact structure. The changes of intrinsic viscosity, coil radius, and volume are interdependent. These findings are corroborated by changes in the intrinsic viscosity of CSM–Blg samples. As an indicator of polymer chain stiffness, salt tolerance correlates with a higher degree of chain flexibility. A higher level of dependency on ionic strength in intrinsic viscosity is usually accompanied by a greater salt tolerance. Based on Equation (17), the plot of the intrinsic viscosity was obtained vs. the reciprocal of the square root of ionic strength (I−0.5) for evaluation of the CSM–Blg stiffness parameter in the presence of Na+ and Ca2+ ions. As seen, the stiffness parameter was lower in the presence of the monovalent ion NaCl (3.34) as compared to the divalent one (CaCl2) (14.46), demonstrating a stiffer backbone of CSM–Blg in the presence of divalent ions. In other words, contraction caused by Ca2+ in CSM–Blg complex was greater than that of Na+, which is consistent with the results of viscosity and SEM images.

3. Conclusions

The high values of G′ compared to G″ in the frequency ranges were demonstrated by oscillatory measurements, indicating network structures with strong interconnections in their gel formations of the complexes. In part, the said observation can be explained by the fact that Blg and CSM molecules have electrostatic interactions between themselves, and this can occur even when salt is present in the medium. It was observed that solvent quality decreased with increasing the salt concentration, which can be ascribed to the larger reduction of the intrinsic viscosity and miscibility through monovalent cations compared with the divalent cations. The system was homogenous and compatible as approved by dynamic rheometry based on Cole–Cole plot. Since the rheological properties of the high concentrations of calcium were different from the other samples, the analysis of SEM indicated the rearrangement of the CSM–Blg complex in the presence of 10 Mm CaCl2. The rheological features demonstrated how important these concepts are in understanding the mesoscale structures, while validating previous standings on rheological data through evaluations of interactions that occur in complex polymers. More research can actualize potential applications of such relevance in foods, especially by considering salt treatments.

4. Materials and Methods

4.1. Materials

Cress seeds were locally obtained from a reputable seed seller. CaCl2 (anhydrous), Blg (with 93% purity), sodium hydroxide (NaOH), and hydrochloric acid (HCl) were sourced from Sigma-Aldrich (Schnelldorf, Germany). Deionized water was used for diluting the solutions when necessary (Nanopure Infinity, Barnstead International, Dubuque, IA, USA).

4.2. Cress Seed Mucilage Extraction and Purification

Extraction and purification processes of cress seed mucilage were carried out appropriately [50]. Briefly, water–seed ratio was 30:1, with an alkaline pH value (10) and 15 min of soaking, which rendered extraction conditions optimum. After extracting the slurry, ethanol precipitation was applied for the purification of mucilage. This was followed by stirring the mucilage with ethanol for 10 min (1:3 ratio, mucilage volume: ethanol volume). Stirring was followed by centrifuging the mixture at 15,000 rpm for 3 min at 25 °C. Then, freeze-drying was applied as a treatment on the mucilage to make it dehydrated (LD Plus Alpha, Martin Christ, Germany). The chemical composition of the powdered CSM comprised 12.85 ± 0.63% moisture, 0.91 ± 0.02% pr1otein, 7.93 ± 0.03% ash and 81.7 ± 0.8% total carbohydrate [50].

4.3. Preparation of CSM–Blg Complexes

To prepare stock solutions of Blg and CSM, the two components were dissolved in deionized water to reach 20 mg/mL and 30 mg/mL, respectively. Then, by post-blending acidification, CSM–Blg complexes were created. CSM was added to Blg dropwise. The variables were selected according to previous methods [50]. For the preparation of CSM–Blg–Ca and Na complexes, CaCl2 and NaCl were added to the aforementioned mixture, and the resultant dispersion was mildly stirred for 2 h. The final contents of CaCl2 and NaCl were in the range of 2–10 mM and 10–100 mM, respectively. Salt concentrations were set out according to the stability of CSM in the said range of salt content [51]. Ultimately, the procedure involved freeze-drying the nanocomplexes.

4.4. Rheology

4.4.1. Steady Shear Values

Within 0.1–100 1/s, the various properties of steady shear flow (CSM–Blg) (20 °C) were determined by a rheometer (MCR 301, Anton Paar, GmbH, Graz, Austria). After applying shear thinning models, the experimental curves that describe the flow behavior were fitted by the Ostwald–de Waele (or power law), Herschel–Bulkley model, Bingham, and Casson (Equations (1)–(4)):
τ = k p γ ˙ n
where n and kp describe the flow behavior index (dimensionless) and power-law consistency coefficient (Pa·sn), respectively.
τ = τ 0 H + k H γ ˙ n H
where nH describes flow behavior index (dimensionless), kH defines the consistency coefficient (Pa·sn), and τ0H is the yield stress (Pa) according to the Herschel–Bulkley model.
τ = η B γ ˙ + τ 0 B
where τ0B and ηB are the Bingham yield stress (Pa) and Bingham plastic viscosity (Pa s), respectively.
τ 0.5 = τ C 0.5 + η C ( γ ˙ 0.5 )
where τ0C and ηC are the Casson yield stress (Pa) and Casson plastic viscosity (Pa s), respectively.
The flow behavior of nanocomplex solutions was depicted by a best-fitting model which had the highest coefficient of determination (R2).

4.4.2. Oscillatory Measurements

The CSM–Blg had its rheological behavior of dynamic shear properties determined through a finite level of total biopolymer concentration (2% w/v) at three levels of concentration for NaCl (10, 50, 100 mM) and CaCl2 (2, 5, 10 mM) via a rheometer (MCR 301, Anton Paar, GmbH, Graz, Austria). Before measuring the dynamic shear, each sample was maintained for 10 min in storage at 25 °C. The linear–viscoelastic region (LVR) was estimated by strain sweep determinations before frequency sweep tests, where G″ and G′ performed without dependency on strain amplitude. In this context, within 0.01–100% of strain, a constant frequency of 1.0 Hz enabled the strain sweep determination (25 °C). While the LVR circumstances applied, frequency sweep tests ran at a constant strain amplitude (0.1%). In the LVR region, 0.01–10 Hz frequencies were considered for frequency sweep determinations. Frequency dependence of the storage modulus (G′) and loss modulus (G″) was examined accordingly through the power law model [52]:
G = k   ω n
G = k ω n
where k′ and k″ (Pa·sn) are constants; n′ and n″ are the viscoelastic components of elastic and viscous moduli, and ω denotes the oscillatory frequency (Hz).
The miscibility of different semidilute CSM–Blg complexes (2% w/w total concentration) at different salt levels was investigated by Cole–Cole plots. To this end, the imaginary (η") part of the viscosity was plotted against its real (η′) component [53].
η = G ω  
η = G ω

4.4.3. Intrinsic Viscosity

A thermostatic water bath was used for hosting a U-tube capillary viscometer (Cannon Instruments Co., State College, PA, USA) in suspension form. The conditions were under an accurate temperature control (25 ± 0.1 °C), by which relative viscosity (ηrel) was measured along with specific viscosity (ηsp) as follows (Equations (9) and (10)):
η r e l = η η s = t t 0
η s p = η r e l 1
where t and t0 are the flow times of sample and pure solvent (deionized water), respectively. The intrinsic viscosity (η) was calculated by the models below [54]:
Huggins   equation :   η s p C = [ η ] + K [ η ] 2 C
Kraemer s   equation :   l n η r e l C = [ η ] + K [ η ] 2 C
Tan glertpaibul   and   Rao   equation :   η r e l = 1 + [ η ] C
Higiro   et   al .   equations :   η r e l = e C [ η ]
where c is the solution concentration, and K′ and K″ represent the Huggins and Kraemer constants, respectively.

4.4.4. Hydrodynamic Coil and Volume Radius, Stiffness Parameter

Hydrodynamic coil radius (Rcoil) and hydrodynamic coil volume (VCoil) were estimated by the following equations (Equations (15) and (16)) [55]:
R c o i l = [ 3 [ η ] . M w 10 π . N A ] 1 3
where NA is Avogadro’s number and MW (kDa) denotes weight–average molecular weight.
V c o i l = 4 3 π R c o i l 3
The ionic strength dependence of the intrinsic viscosity of polyelectrolytes usually follows the empirical Smidsrød and Haug (1971) equation which allows for describing the macromolecular chain stiffness depending on molecular weight:
[ η ] = [ η ] + S I 0.5
where η is the intrinsic viscosity at infinite ionic strength and corresponds to conformations unaffected by electrostatic interaction, and S (also known as salt tolerance) represents a comparative criterion for evaluation stiffness macromolecular chains [56].

4.5. Morphological Observation

To arrive at a sufficient description of variations in nanocomplexes within the specifications of salts and their features, the procedure involved placing samples on an FE-SEM stub for field-emission scanning electron microscopy. After coating each sample with an Au–Pt layer, electron conductivity was supposedly exposed to the surface of the sample. High-pressure vacuum (10−5–10−6 Pa) was used for taking the images (5–10 kV). The structural changes were also examined by scanning electron microscopy (SEM, TESCAN-Vega 3, Czech). A drop of the suspension was dripped onto glass stubs and placed on the surface of the sample stub, which was then left to dry. The stub was then coated with a thin (<20 nm) conductive gold layer using a sputter coater (Quorum Technologies, Lewes, UK) before imaging. After preparation, the morphological features of each sample were visualized by electron microscopy.

4.6. Fourier-Transform Infrared (FTIR) Spectroscopy

Chemical structures of Blg, CSM, CSM–Blg, and CSM–Blg–Ca were described with the assistance of a Tensor-II FTIR spectrometer (Bruker Co., Bremen, Germany) at 400–4000 cm−1 wavelength range.

4.7. Statistical Methods

In triplicate, the measurements were deemed reliable and with few errors. Mean values ± standard deviation were considered to present experimental data. The Origin Pro 9.1 software (Origin Lab Co., Northampton, MA, USA) was used for generating figures. Differences between means were determined by one-way analysis of variance (ANOVA). Duncan’s comparison validated the analysis of variance (p < 0.05) via SPSS 23.0 (IBM® Armonk, NY, USA).

Author Contributions

A.T.: Conceptualization, formal analysis, methodology, investigation, software, visualization, writing—original draft, writing—review and editing. M.K.: Methodology, investigation, project administration, resources supervision, writing—review and editing draft. A.M.T.: Supervision, validation, writing—review and editing. J.D.: Funding acquisition, resources, project administration, writing—review and editing. S.M.J.: Investigation, writing—review and editing. All authors have read and agreed to the published version of the manuscript.

Funding

This research is supported by Singapore Food Story R&D Programme Industry Alignment Fund Prepositioning (IAF-PP) Theme 2—Advanced Biotech-based Protein Production Grant (A21H7a0131 and H21H8a0005), administered by A*STAR.

Institutional Review Board Statement

Not applicable.

Informed Consent Statement

Not applicable.

Data Availability Statement

Data is contained within the article.

Conflicts of Interest

The authors declare no conflict of interest.

References

  1. Du, J.; Reuhs, B.L.; Jones, O.G. Influence of PEGylation on the ability of carboxymethyl-dextran to form complexes with α-lactalbumin. Food Chem. 2016, 196, 853–859. [Google Scholar] [CrossRef] [PubMed]
  2. Taheri, A.; Kashaninejad, M. Rheological properties for determining the interaction of soluble cress seed mucilage and β-lactoglobulin nanocomplexes under sucrose and lactose treatments. Food Chem. 2022, 378, 132133. [Google Scholar] [CrossRef] [PubMed]
  3. Liu, J.; Chai, J.; Zhang, T.; Yuan, Y.; Saini, R.K.; Xu, M.; Li, S.; Shang, X. Phase behavior, thermodynamic and rheological properties of ovalbumin/dextran sulfate: Effect of biopolymer ratio and salt concentration. Food Hydrocoll. 2021, 118, 106777. [Google Scholar] [CrossRef]
  4. Lan, Y.; Ohm, J.B.; Chen, B.; Rao, J. Phase behavior and complex coacervation of concentrated pea protein isolate-beet pectin solution. Food Chem. 2020, 307, 125536. [Google Scholar] [CrossRef]
  5. Hasanvand, E.; Rafe, A. Rheological and structural properties of rice bran protein-flaxseed (Linum usitatissimum L.) gum complex coacervates. Food Hydrocoll. 2018, 83, 296–307. [Google Scholar] [CrossRef]
  6. Taheri, A.; Kashaninejad, M.; Tamaddon, A.M.; Jafari, S.M. Comparison of binary cress seed mucilage (CSM)/β-lactoglobulin (BLG) and ternary CSG-BLG-Ca (calcium) complexes as emulsifiers: Interfacial behavior and freeze-thawing stability. Carbohydr. Polym. 2021, 266, 118148. [Google Scholar] [CrossRef]
  7. Schestkowa, H.; Wollborn, T.; Westphal, A.; Wagemans, A.M.; Fritsching, U.; Drusch, S. Conformational state and charge determine the interfacial stabilization process of beta-lactoglobulin at preoccupied interfaces. J. Colloid Interface Sci. 2019, 536, 300–309. [Google Scholar] [CrossRef]
  8. Wang, Z.; Liu, J.; Gao, J.; Cao, M.; Ren, G.; Xie, H.; Yao, M. Formation and Characterization of β-Lactoglobulin and Gum Arabic Complexes: The Role of pH. Molecules 2020, 25, 3871. [Google Scholar] [CrossRef]
  9. Ramamirtham, S.; Williams, M.A.K.; Zare, D.; Weeks, M.; Whitby, C.P. Complexes of β-lactoglobulin and high methyl-esterified pectin as a one-shot delivery system for reinforcing oil/water interfaces. Soft Matter 2021, 17, 8517–8522. [Google Scholar] [CrossRef]
  10. Zhao, M.; Hu, J.; Zhang, H.; Nishinari, K.; Fang, Y. Electrostatic complexation of β-lactoglobulin aggregates with κ-carrageenan and the resulting emulsifying and foaming properties. J. Dairy Sci. 2020, 103, 8709–8720. [Google Scholar] [CrossRef]
  11. Taheri, A.; Kashaninejad, M.; Tamaddon, A.M.; Ganjeh, M.; Jafari, S.M. Complexation of cress seed mucilage and β-lactoglobulin; optimization through response surface methodology and adaptive neuro-fuzzy inference system (ANFIS). Chemom. Intell. Lab. Syst. 2022, 228, 104615. [Google Scholar] [CrossRef]
  12. Beikzadeh, S.; Khezerlou, A.; Jafari, S.M.; Pilevar, Z.; Mortazavian, A.M. Seed mucilages as the functional ingredients for biodegradable films and edible coatings in the food industry. Adv. Colloid Interface Sci. 2020, 280, 102164. [Google Scholar] [CrossRef] [PubMed]
  13. Fahami, A.; Fathi, M. Development of cress seed mucilage/PVA nanofibers as a novel carrier for vitamin A delivery. Food Hydrocoll. 2018, 81, 31–38. [Google Scholar] [CrossRef]
  14. Zdunek, A.; Pieczywek, P.M.; Cybulska, J. The primary, secondary, and structures of higher levels of pectin polysaccharides. Compr. Rev. Food Sci. Food Saf. 2021, 20, 1101–1117. [Google Scholar] [CrossRef]
  15. Razmkhah, S.; Razavi, S.M.A.; Mohammadifar, M.A. Purification of cress seed (Lepidium sativum) gum: A comprehensive rheological study. Food Hydrocoll. 2016, 61, 358–368. [Google Scholar] [CrossRef] [Green Version]
  16. Liu, J.; Shim, Y.Y.; Reaney, M.J.T. Ionic strength and hydrogen bonding effects on whey protein isolate–flaxseed gum coacervate rheology. Food Sci. Nutr. 2020, 8, 2102–2111. [Google Scholar] [CrossRef] [Green Version]
  17. Fitch, R.M.; Tsai, C.H. Particle Formation in Polymer Colloids, III: Prediction of the Number of Particles by a Homogeneous Nucleation Theory. In Polymer Colloids: Proceedings of an American Chemical Society Symposium on Polymer Colloids held in Chicago, IL, USA, 13–18 September 1970; Plenum Press: New York, NY, USA, 1971; pp. 73–102. [Google Scholar]
  18. Xin, X.; Wang, L.; Shen, J.; Xu, G.; Li, Y. Rheological properties of hydrolyzed polyacrylamide/sodium oleate mixed system in the presence of different inorganic salts. J. Pet. Sci. Eng. 2014, 114, 15–21. [Google Scholar] [CrossRef]
  19. Goh, K.K.T.; Teo, A.; Sarkar, A.; Singh, H. Milk protein-polysaccharide interactions. In Milk Proteins: From Expression to Food; Elsevier: Amsterdam, The Netherlands, 2019; pp. 499–535. ISBN 9780128152515. [Google Scholar]
  20. Tavares, L.; Noreña, C.P.Z. Encapsulation of garlic extract using complex coacervation with whey protein isolate and chitosan as wall materials followed by spray drying. Food Hydrocoll. 2019, 89, 360–369. [Google Scholar] [CrossRef]
  21. Fan, C.; Han, S.; Liu, F.; Liu, Y.; Wang, L.; Pan, S. Influence of calcium lactate and pH on emulsification of low-methoxylated citrus pectin in a Pickering emulsion. J. Dispers. Sci. Technol. 2017, 38, 1175–1180. [Google Scholar] [CrossRef]
  22. Yan, J.N.; Xue, S.; Du, Y.N.; Wang, Y.Q.; Xu, S.Q.; Wu, H.T. Influence of pH and blend ratios on the complex coacervation and synergistic enhancement in composite hydrogels from scallop (patinopecten yessoensis) protein hydrolysates and κ-carrageenan/xanthan gum. LWT 2022, 154, 112745. [Google Scholar] [CrossRef]
  23. Liu, J.; Shim, Y.Y.; Shen, J.; Wang, Y.; Reaney, M.J.T. Whey protein isolate and flaxseed (Linum usitatissimum L.) gum electrostatic coacervates: Turbidity and rheology. Food Hydrocoll. 2017, 64, 18–27. [Google Scholar] [CrossRef]
  24. Li, Z.; Fu, Y.; McClements, D.J.; Li, T. Impact of alginate block type on the structure and physicochemical properties of curcumin-loaded complex biopolymer nanoparticles. LWT 2022, 162, 113435. [Google Scholar] [CrossRef]
  25. Wang, X.; Lee, J.; Wang, Y.W.; Huang, Q. Composition and rheological properties of β-lactoglobulin/pectin coacervates: Effects of salt concentration and initial protein/polysaccharide ratio. Biomacromolecules 2007, 8, 992–997. [Google Scholar] [CrossRef]
  26. Zhang, Q.; Jeganathan, B.; Dong, H.; Chen, L.; Vasanthan, T. Effect of sodium chloride on the thermodynamic, rheological, and microstructural properties of field pea protein isolate/chitosan complex coacervates. Food Chem. 2021, 344, 128569. [Google Scholar] [CrossRef]
  27. Tavares, L.; Souza, H.K.S.; Gonçalves, M.P.; Rocha, C.M.R. Physicochemical and microstructural properties of composite edible film obtained by complex coacervation between chitosan and whey protein isolate. Food Hydrocoll. 2021, 113, 106471. [Google Scholar] [CrossRef]
  28. Wang, W.; Shen, M.; Liu, S.; Jiang, L.; Song, Q.; Xie, J. Gel properties and interactions of Mesona blumes polysaccharide-soy protein isolates mixed gel: The effect of salt addition. Carbohydr. Polym. 2018, 192, 193–201. [Google Scholar] [CrossRef]
  29. Liberman, G.N.; Ochbaum, G.; Bitton, R.; Arad, S.M. Antimicrobial hydrogels composed of chitosan and sulfated polysaccharides of red microalgae. Polymer 2021, 215, 123353. [Google Scholar] [CrossRef]
  30. Li, G.Y.; Chen, Q.H.; Su, C.R.; Wang, H.; He, S.; Liu, J.; Nag, A.; Yuan, Y. Soy protein-polysaccharide complex coacervate under physical treatment: Effects of pH, ionic strength and polysaccharide type. Innov. Food Sci. Emerg. Technol. 2021, 68, 102612. [Google Scholar] [CrossRef]
  31. Lan, Y.; Ohm, J.B.; Chen, B.; Rao, J. Microencapsulation of hemp seed oil by pea protein isolate-sugar beet pectin complex coacervation: Influence of coacervation pH and wall/core ratio. Food Hydrocoll. 2021, 113, 106423. [Google Scholar] [CrossRef]
  32. Guo, C.; Zhang, M.; Devahastin, S. Color/aroma changes of 3D-Printed buckwheat dough with yellow flesh peach as triggered by microwave heating of gelatin-gum Arabic complex coacervates. Food Hydrocoll. 2021, 112, 106358. [Google Scholar] [CrossRef]
  33. Li, K.Y.; Zhang, X.R.; Huang, G.Q.; Teng, J.; Guo, L.P.; Li, X.D.; Xiao, J.X. Complexation between ovalbumin and gum Arabic in high total biopolymer concentrations and the emulsifying ability of the complexes. Colloids Surfaces A Physicochem. Eng. Asp. 2022, 642, 128624. [Google Scholar] [CrossRef]
  34. Weinbreck, F.; Minor, M.; De Kruif, C.G. Microencapsulation of oils using whey protein/gum arabic coacervates. J. Microencapsul. 2004, 21, 667–679. [Google Scholar] [CrossRef]
  35. Xiong, W.; Ren, C.; Jin, W.; Tian, J.; Wang, Y.; Shah, B.R.; Li, J.; Li, B. Ovalbumin-chitosan complex coacervation: Phase behavior, thermodynamic and rheological properties. Food Hydrocoll. 2016, 61, 895–902. [Google Scholar] [CrossRef]
  36. Xiong, W.; Ren, C.; Tian, M.; Yang, X.; Li, J.; Li, B. Complex coacervation of ovalbumin-carboxymethylcellulose assessed by isothermal titration calorimeter and rheology: Effect of ionic strength and charge density of polysaccharide. Food Hydrocoll. 2017, 73, 41–50. [Google Scholar] [CrossRef]
  37. Benoso, P.; Bittante, A.M.Q.B.; Moraes, I.C.F.; do Amaral Sobral, P.J. Rheological and viscoelastic properties of colloidal solutions based on gelatins and chitosan as affected by pH. Int. J. Food Sci. Technol. 2022, 57, 2365–2375. [Google Scholar] [CrossRef]
  38. Razi, S.M.; Motamedzadegan, A.; Shahidi, S.A.; Rashidinejad, A. Steady and dynamic shear rheology as a toolfor evaluation of the interactions between egg white albumin and basil seed gum. Rheol. Acta 2020, 59, 317–331. [Google Scholar] [CrossRef]
  39. Kan, L.; Capuano, E.; Oliviero, T.; Renzetti, S. Wheat starch-tannic acid complexes modulate physicochemical and rheological properties of wheat starch and its digestibility. Food Hydrocoll. 2022, 126, 107459. [Google Scholar] [CrossRef]
  40. Hammani, S.; Moulai-Mostefa, N.; Samyn, P.; Bechelany, M.; Dufresne, A.; Barhoum, A. Morphology, Rheology and Crystallization in Relation to the Viscosity Ratio of Polystyrene/Polypropylene Polymer Blends. Materials 2020, 13, 926. [Google Scholar] [CrossRef] [PubMed] [Green Version]
  41. Khan, M.; Shah, L.A.; Rehman, T.; Khan, A.; Iqbal, A.; Ullah, M.; Alam, S. Synthesis of physically cross-linked gum Arabic-based polymer hydrogels with enhanced mechanical, load bearing and shape memory behavior. Iran. Polym. J. (Engl. Ed.) 2020, 29, 351–360. [Google Scholar] [CrossRef]
  42. Ivancic, R.J.S.; Orski, S.V.; Audus, D.J. Structure-Dilute Solution Property Relationships of Comblike Macromolecules in a Good Solvent. Macromolecules 2022, 55, 766–775. [Google Scholar] [CrossRef]
  43. Jo, W.; Bak, J.H.; Yoo, B. Rheological characterizations of concentrated binary gum mixtures with xanthan gum and galactomannans. Int. J. Biol. Macromol. 2018, 114, 263–269. [Google Scholar] [CrossRef] [PubMed]
  44. Lupo, C.; Boulos, S.; Nyström, L. Influence of Partial Acid Hydrolysis on Size, Dispersity, Monosaccharide Composition, and Conformation of Linearly-Branched Water-Soluble Polysaccharides. Molecules 2020, 25, 2982. [Google Scholar] [CrossRef] [PubMed]
  45. Qiao, X.; Yang, L.; Gu, J.; Cao, Y.; Li, Z.; Xu, J.; Xue, C. Kinetic interactions of nanocomplexes between astaxanthin esters with different molecular structures and β-lactoglobulin. Food Chem. 2021, 335, 127633. [Google Scholar] [CrossRef] [PubMed]
  46. Niu, F.; Kou, M.; Fan, J.; Pan, W.; Feng, Z.J.; Su, Y.; Yang, Y.; Zhou, W. Structural characteristics and rheological properties of ovalbumin-gum arabic complex coacervates. Food Chem. 2018, 260, 1–6. [Google Scholar] [CrossRef]
  47. Sankalia, M.G.; Mashru, R.C.; Sankalia, J.M.; Sutariya, V.B. Reversed chitosan-alginate polyelectrolyte complex for stability improvement of alpha-amylase: Optimization and physicochemical characterization. Eur. J. Pharm. Biopharm. 2007, 65, 215–232. [Google Scholar] [CrossRef]
  48. Raei, M.; Rafe, A.; Shahidi, F. Rheological and structural characteristics of whey protein-pectin complex coacervates. J. Food Eng. 2018, 228, 25–31. [Google Scholar] [CrossRef]
  49. Hosseini, S.M.H.; Emam-Djomeh, Z.; Razavi, S.H.; Moosavi-Movahedi, A.A.; Saboury, A.A.; Atri, M.S.; Van der Meeren, P. β-Lactoglobulin-sodium alginate interaction as affected by polysaccharide depolymerization using high intensity ultrasound. Food Hydrocoll. 2013, 32, 235–244. [Google Scholar] [CrossRef]
  50. Taheri, A.; Kashaninejad, M.; Tamaddon, A.M.; Jafari, S.M. Vitamin D3 cress seed mucilage -β-lactoglobulin nanocomplexes: Synthesis, characterization, encapsulation and simulated intestinal fluid in vitro release. Carbohydr. Polym. 2020, 256, 117420. [Google Scholar] [CrossRef]
  51. Behrouzian, F.; Razavi, S.M.A.; Karazhiyan, H. Intrinsic viscosity of cress (Lepidium sativum) seed gum: Effect of salts and sugars. Food Hydrocoll. 2014, 35, 100–105. [Google Scholar] [CrossRef]
  52. Tiwari, P.; Ranjan, R.; Das, K.; Bohidar, H.; Aswal, V.K.; Arfin, N. Exfoliation and gelation in laponite-carboxymethyl cellulose complexes and its application in sustained drug release. Polym. Bull. 2019, 77, 5389–5406. [Google Scholar] [CrossRef]
  53. Escócio, V.A.; Pacheco, E.B.A.V.; Silva, A.L.N.D.; Cavalcante, A.D.P.; Visconte, L.L.Y. Rheological Behavior of Renewable Polyethylene (HDPE) Composites and Sponge Gourd (Luffa cylindrica) Residue. Int. J. Polym. Sci. 2015, 2015, 714352. [Google Scholar] [CrossRef] [Green Version]
  54. Bastos, L.P.H.; de Carvalho, C.W.P.; Garcia-Rojas, E.E. Formation and characterization of the complex coacervates obtained between lactoferrin and sodium alginate. Int. J. Biol. Macromol. 2018, 120, 332–338. [Google Scholar] [CrossRef] [PubMed]
  55. de la Torre, J.G.; Cifre, J.G.H. Hydrodynamic Properties of Biomacromolecules and Macromolecular Complexes: Concepts and Methods. A Tutorial Mini-Review. J. Mol. Biol. 2020, 432, 2930–2948. [Google Scholar] [CrossRef] [PubMed]
  56. Smidsrød, O.; Haug, A. Estimation of the relative stiffness of the molecular chain in polyelectrolytes from measurements of viscosity at different ionic strengths. Biopolymers 1971, 10, 1213–1227. [Google Scholar] [CrossRef] [PubMed]
Figure 1. CSM–Blg complexes and their viscosity values, as affected by different salt concentrations.
Gels 09 00485 g001
Figure 2. FE-SEM images of CSM–Blg complex samples. (a) Table 1, sample CSM–Blg–Na1; (b) Table 1, sample CSM–Blg–Na2; (c) Table 1, sample CSM–Blg–Na3; (d) Table 1, sample CSM–Blg–Ca1; (e) Table 1, sample CSM–Blg–Ca2; and (f) Table 1, sample CSM–Blg–Ca3. All images were taken through similar magnification, with 2 μm as the scale bar.
Gels 09 00485 g002aGels 09 00485 g002b
Figure 3. (a,b) Variation of G′ of CSM–Blg (frequency range of 0.1–10 (Hz) at 25 °C) with different concentrations of CaCl2 and NaCl, respectively; (c,d) variation of tan δ of CSM–Blg with different concentrations of CaCl2 and NaCl, respectively.
Gels 09 00485 g003
Figure 4. Cole–Cole plot of the imaginary part of viscosity (η″) versus dynamic viscosity η′ for CSM–Blg complexes for various salt concentrations.
Gels 09 00485 g004
Figure 5. The SEM images of CSM–Blg complexes: (a) without CaCl2 and (b) with 10 mM CaCl2 (scale bar: 50 μm).
Gels 09 00485 g005
Figure 6. FTIR spectra of biopolymers (CSM, Blg) and complexes (CSM–Blg and CSM–Blg–Ca3) prepared at pH, CSM–Blg mixing ratio, CSM concentration, and Blg concentration of 3.5, 1:2, 0.35% w/v, and 0.1% w/v, respectively.
Gels 09 00485 g006
Table 1. Steady shear rheological parameters of different CSM–Blg complexes at 25 °C.
Model CaCl2 (mM) NaCl (mM)
0251001050100
CSM–BlgCSM–Blg–Ca1CSM–Blg–Ca2CSM–Blg–Ca3CSM–BlgCSM–Blg–Na1CSM–Blg–Na2CSM–Blg–Na3
Power law
kp (Pa·sn)3.48 ± 0.126 d4.5 ± 0.084 c4.92 ± 0.133 b7.15 ± 0.152 a3.48 ± 0.126 b2.37 ± 0.110 d7.02 ± 0.148 a2.70 ± 0.110 c
np0.326 ± 0.007 a0.214 ± 0.002 b0.221 ± 0.002 b0.163 ± 0.001 c0.326 ± 0.007 a0.253 ± 0.003 c0.278 ± 0.004 b0.248 ± 0.002 c
R20.9820.8660.8940.7710.9820.9140.8970.924
Bingham
τ0 B (Pa)2.81 ± 0.086 d3.60 ± 0.314 c4.10 ± 0.152 b6.17 ± 0.189 a2.81 ± 0.086 b1.84 ± 0.113 d6.80 ± 0.157 a2.1 ± 0.113 c
ηB (Pa s)0.212 ± 0.002 a0.171 ± 0.001 c0.171 ± 0.002 c0.181 ± 0.001 b0.212 ± 0.002 a0.114 ± 0.002 c0.212 ± 0.003 a0.124 ± 0.001 b
R20.9250.9510.9520.8840.9250.9610.9010.955
Herschel-Bulkley
kH (Pa·sn)1.05 ± 0.010 d3.22 ± 0.032 c4.18 ± 0.018 b5.30 ± 0.024 a1.05 ± 0.010 d1.15 ± 0.011 c2.89 ± 0.033 a1.71 ± 0.020 b
nH0.761 ± 0.003 a0.162 ± 0.002 c0.491 ± 0.003 b0.491 ± 0.002 b0.761 ± 0.003 a0.342 ± 0.001 c0.421 ± 0.002 b0.336 ± 0.001 d
R20.9880.9700.9600.8880.9880.9610.9020.965
Casson
τ0 c (Pa)1.28 ± 0.015 d1.64 ± 0.028 c1.74 ± 0.041 b2.24 ± 0.025 a1.28 ± 0.015 b1.13 ± 0.012 c2.15 ± 0.010 a1.22 ± 0.018 bc
ηc(Pa s)0.360 ± 0.005 a0.273 ± 0.004 b0.272 ± 0.001 b0.243 ± 0.001 c0.360 ± 0.005 a0.239 ± 0.004 d0.321 ± 0.003 b0.246 ± 0.002 c
R20.9700.9580.9270.8080.9700.9540.8810.949
1, 2, and 3 as subscripts indicate the highest, moderate, and lowest CaCl2 concentrations (2, 5, and 10 mM) and NaCl (10, 50, and 100 mM), respectively; a–d: means followed by the same lower case in the same row are not significantly different (p > 0.05).
Table 2. Frequency dependence of elastic and viscous modulus of CSM–Blg complexes at 25 °C.
Treatments k′n′R2k″n″R2K″/k′α
CaCl2 (mM)
02.66 ± 0.03 d0.140 ± 0.003 a0.9560.77 ± 0.003 c0.292 ± 0.002 a0.9910.290 ± 0.002 a0.631 ± 0.005 b
23.15 ± 0.01 c0.125 ± 0.001 b0.9730.82 ± 0.002 c0.278 ± 0.002 b0.9920.266 ± 0.001 c0.659 ± 0.004 a
53.51 ± 0.02 b0.112 ± 0.001 c0.9500.98 ± 0.004 b0.212 ± 0.001 c0.9800.280 ± 0.002 b0.516 ± 0.006 d
104.35 ± 0.04 a0.096 ± 0.002 d0.9911.23 ± 0.08 a0.189 ± 0.001 d0.9830.283 ± 0.003 b0.597 ± 0.003 c
NaCl (mM)
02.66 ± 0.03 a0.140 ± 0.003 b0.9560.77 ± 0.003 b0.292 ± 0.002 b0.9910.290 ± 0.002 d0.631 ± 0.005 c
101.37 ± 0.01 c0.134 ± 0.001 c0.9870.70 ± 0.001 d0.311 ± 0.003 a0.9870.513 ± 0.001 b1.25 ± 0.004 a
501.82 ± 0.01 b0.148 ± 0.003 a0.9850.84 ± 0.001 a0.148 ± 0.002 c0.9540.464 ± 0.001 c0.452 ± 0.002 d
1000.880 ± 0.002 d0.105 ± 0.002 d0.9930.73 ± 0.002 c0.137 ± 0.001 d0.9480.821 ± 0.002 a1.06 ± 0.002 b
a–d: Means followed by the same lower case in the same column are not significantly different (p > 0.05); the reported values are means (n = 3) ± SD.
Table 3. Intrinsic viscosity (dL/g) of CSM–Blg with the addition of salts at 25 °C.
SampleHugginsKramerTanglertpaibul & RaoHigiro 1Rcoil (nm)Vcoil (nm3)
CSM–BlgR2 = 0.91
η = 0.97 ± 0.008
R2 = 0.88
η = 0.72 ± 0.004
R2 = 0.97
η = 0.42 ± 0.003
R2 = 0.98
η = 0.46 ± 0.003 a
8.50 ± 1.00 a2662.0 ± 74.2 a
CSM–Blg–Ca1R2 = 0.89
η = 2.11 ± 0.21
R2 = 0.91
η = 1.80 ± 0.21
R2 = 0.95
η = 0.58 ± 0.003
R2 = 0.96
η = 0.32 ± 002 b
7.76 ± 0.51 ab1956.2 ± 58.7 b
CSM–Blg–Ca2R2 = 0.91
η = 1.80 ± 0.15
R2 = 0.93
η = 1.62 ± 0.14
R2 = 0.97
η = 0.41 ± 0.003
R2 = 0.98
η = 0.25 ± 002 d
7.15 ± 0.34 a1530.3 ± 35.6 d
CSM–Blg–Ca3R2 = 0.92
η = 2.60 ± 0.30
R2 = 0.93
η = 2.27 ± 0.36
R2 = 0.94
η = 0.44 ± 0.004
R2 = 0.95
η = 0.28 ± 0.001 c
7.33 ± 0.28 ab1648.2 ± 41.4 c
CSM–Blg–Na1R2 = 0.87
η = 1.76 ± 0.24
R2= 0.90
η = 1.60 ± 0.11
R2 = 0.93
η = 0.31 ± 0.004
R2 = 0.98
η = 0.20 ± 002 c
6.64 ± 0.41 b1225.6 ± 24.9 c
CSM–Blg–Na2R2= 0.74
η = 1.18 ± 0.13
R2 = 0.80
η = 1.25 ± 0.08
R2 = 0.94
η = 0.40 ± 0.004
R2 = 0.95
η = 0.22 ± 0.001 b
6.85 ± 0.21 b1345.2 ± 20.1 b
CSM–Blg–Na3R2 = 0.92
η = 1.36 ± 0.11
R2 = 0.93
η = 1.56 ± 0.13
R2 = 0.98
η = 0.35 ± 0.004
R2 = 0.98
η = 0.18 ± 0.001 d
6.41 ± 0.16 b1102.2 ± 14.8 d
1, 2, and 3 as subscripts indicate the highest, moderate, and lowest CaCl2 concentrations (2, 5, and 10 mM) and NaCl (10, 50, and 100 mM), respectively; a–d: means followed by the same lower case in the same row are not significantly different (p > 0.05).
Disclaimer/Publisher’s Note: The statements, opinions and data contained in all publications are solely those of the individual author(s) and contributor(s) and not of MDPI and/or the editor(s). MDPI and/or the editor(s) disclaim responsibility for any injury to people or property resulting from any ideas, methods, instructions or products referred to in the content.

