
Development of Diagnostic Markers and Applied for Genetic Diversity Study and Population Structure of Bipolaris sorokiniana Associated with Leaf Blight Complex of Wheat
 , ,
, ,
Abstract
:1. Introduction
2. Materials and Methods
2.1. Fungal Isolate Collection
2.2. Fungi Isolation and DNA Extraction
2.3. Microsatellite Development and Bioinformatics
2.4. Microsatellite PCR Amplification and Genotyping
2.5. SSR Polymorphism and Genetic Diversity
2.6. Population Structure and Gene Flow
3. Results
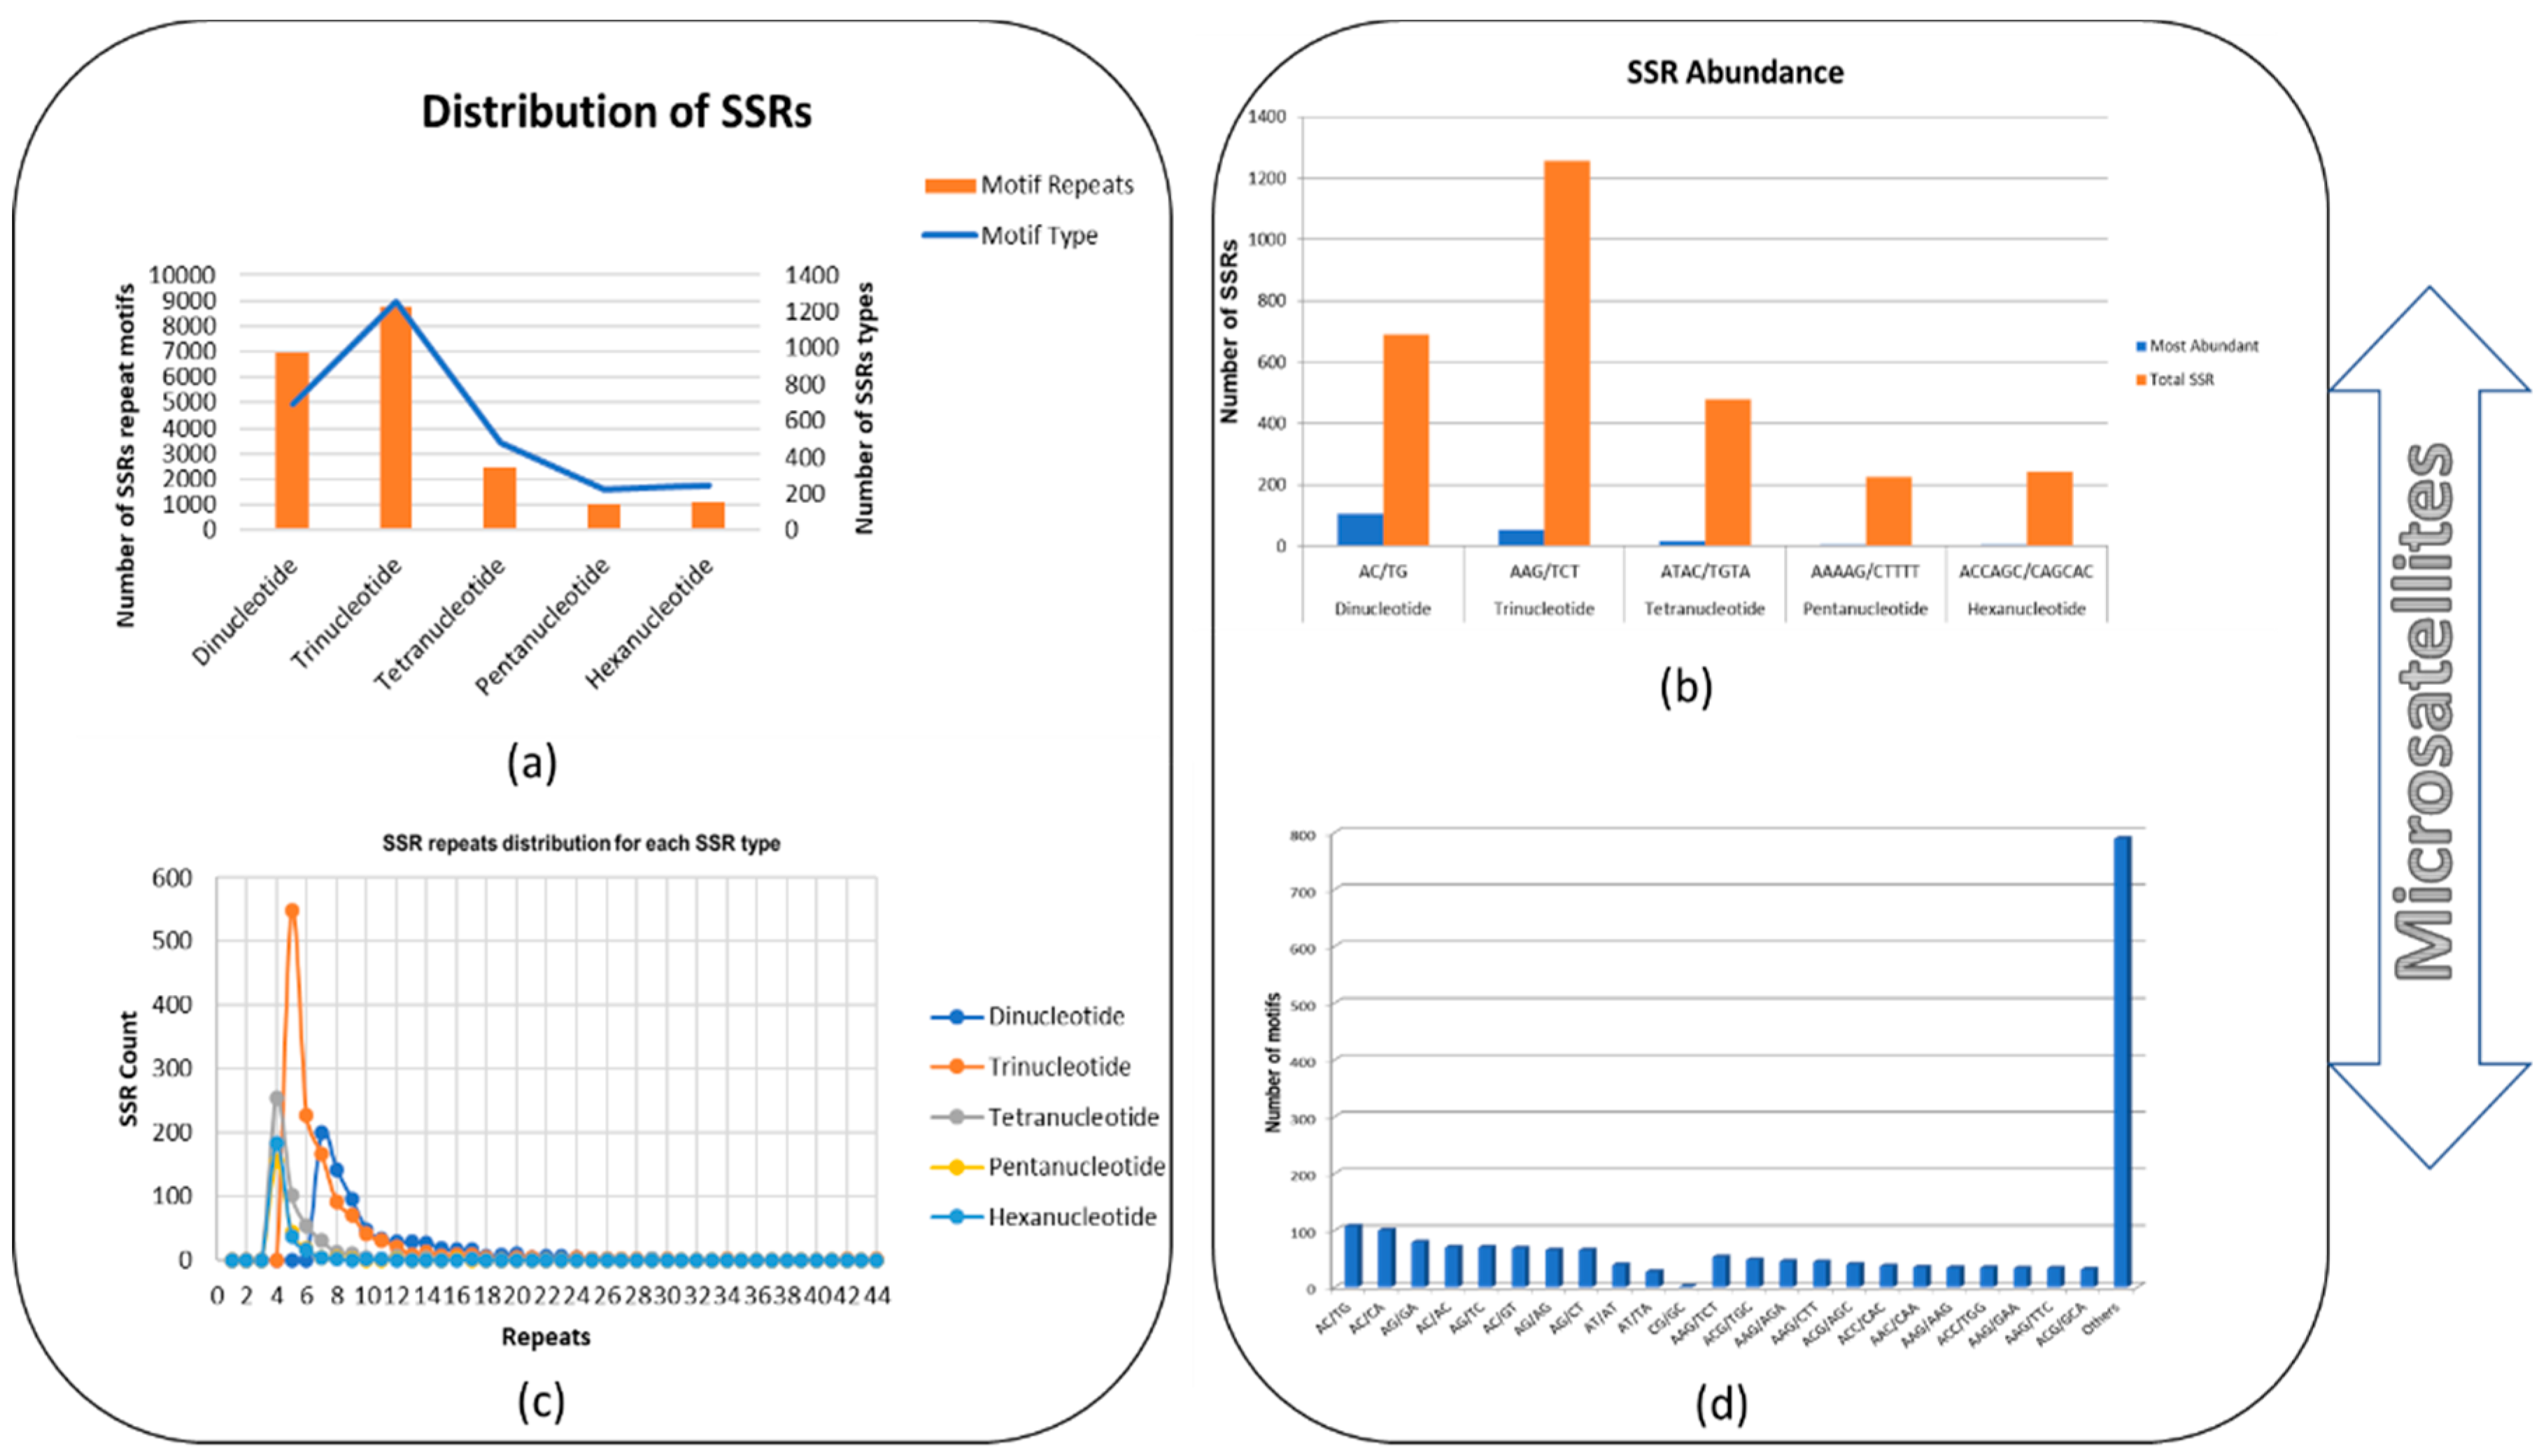
3.1. Detection and Distribution of SSRs in B. sorokiniana Genome
3.2. Polymorphism of SSR Markers
3.3. Analysis of Molecular Variance
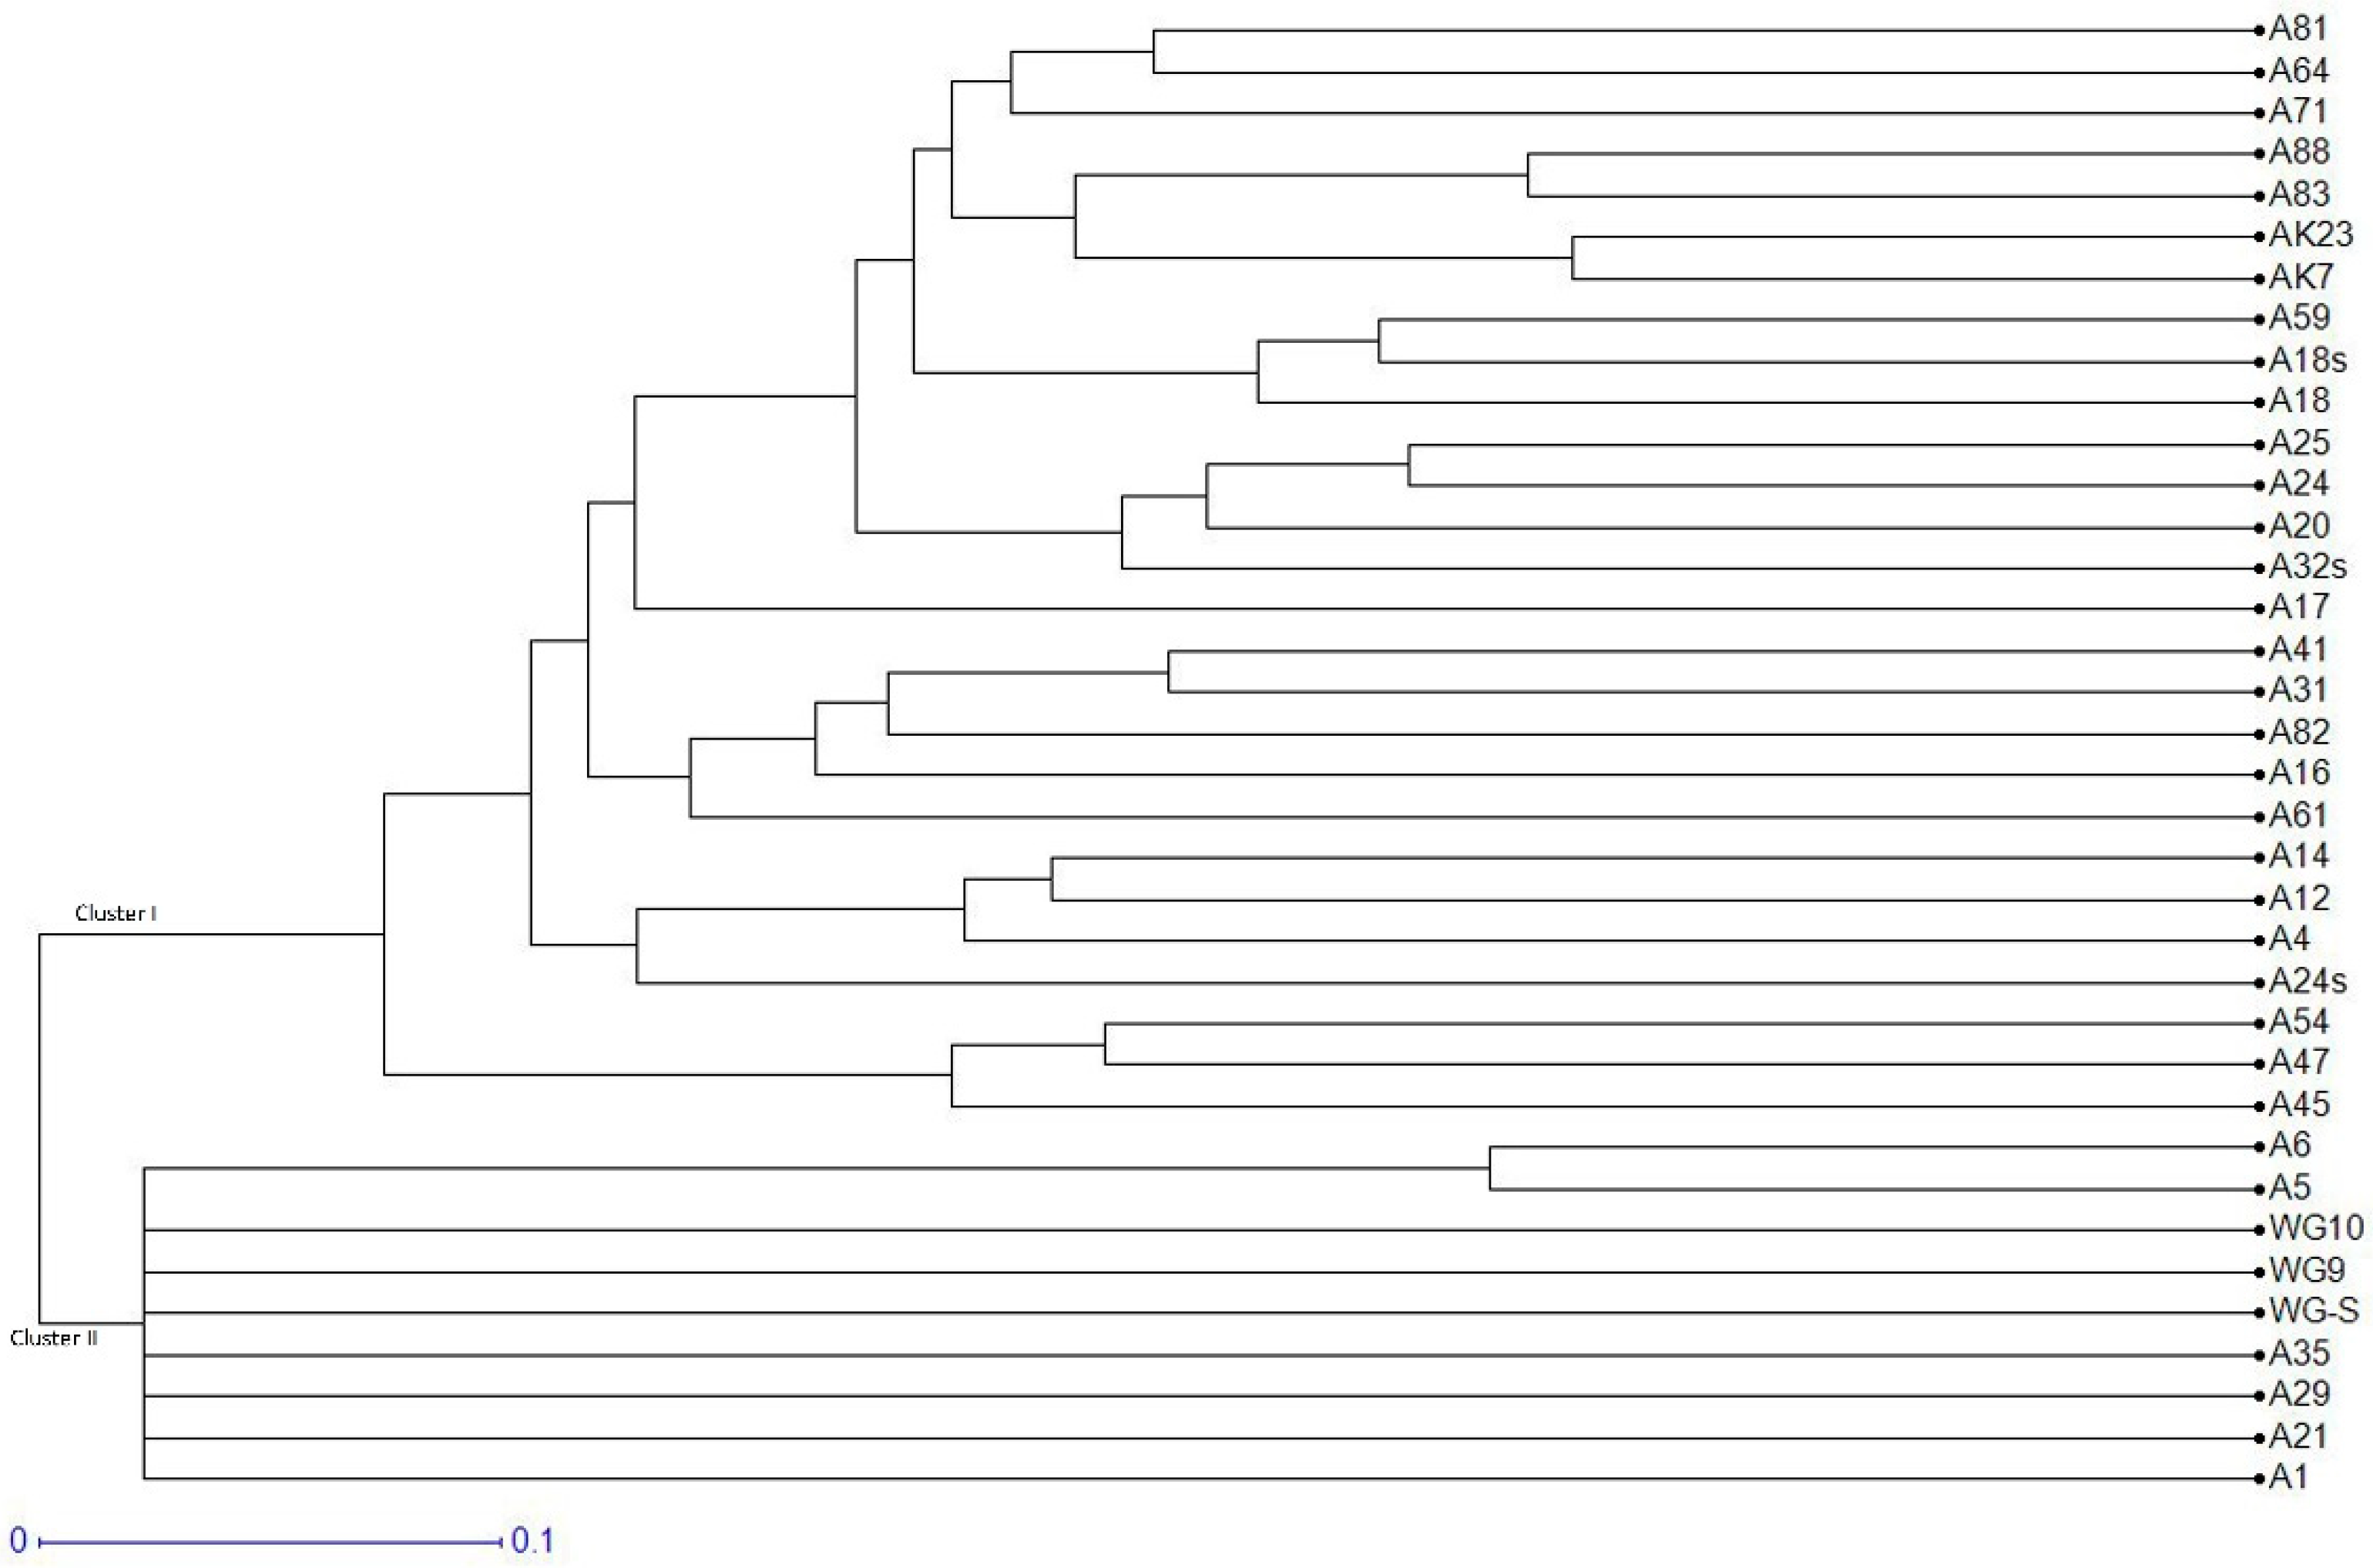
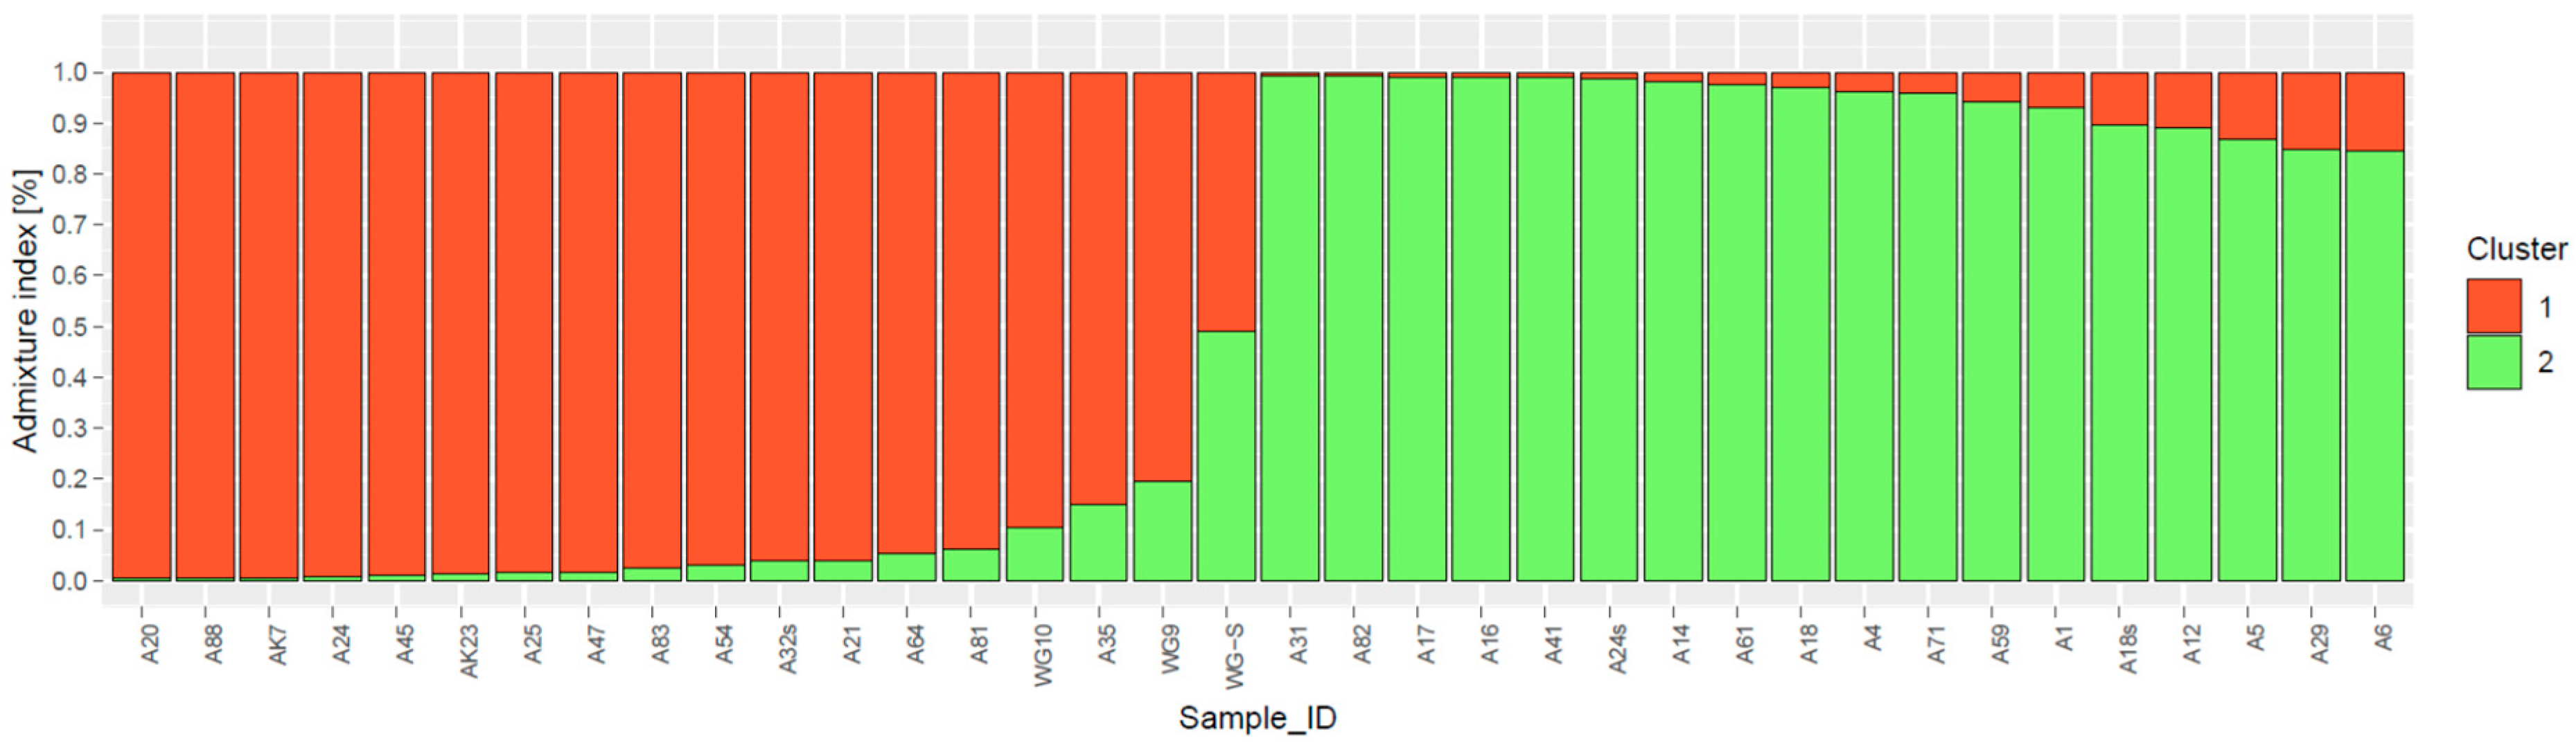
3.4. Population Genetic Structure
4. Discussion
5. Conclusions
Supplementary Materials
Author Contributions
Funding
Institutional Review Board Statement
Informed Consent Statement
Data Availability Statement
Acknowledgments
Conflicts of Interest
References
- Nelson, A.R.L.E.; Ravichandran, K.; Antony, U. The impact of the Green Revolution on indigenous crops of India. J. Ethn. Foods 2019, 6, 8. [Google Scholar] [CrossRef] [Green Version]
- Aryal, J.P.; Sapkota, T.B.; Khurana, R.; Khatri-Chhetri, A.; Rahut, D.B.; Jat, M.L. Climate change and agriculture in South Asia: Adaptation options in smallholder production systems. Environ. Dev. Sustain. 2020, 22, 5045–5075. [Google Scholar] [CrossRef] [Green Version]
- FAO. Food Outlook—Biannual Report on Global Food Markets; FAO: Rome, Italy, 2022; Available online: https://www.fao.org/documents/card/en/c/cb9427en (accessed on 19 September 2022).
- Pandey, P.; Irulappan, V.; Bagavathiannan, M.V.; Senthil-Kumar, M. Impact of Combined Abiotic and Biotic Stresses on Plant Growth and Avenues for Crop Improvement by Exploiting Physio-morphological Traits. Front. Plant Sci. 2017, 8, 537. [Google Scholar] [CrossRef] [Green Version]
- Dublin, H.J.; Van Ginkel, M. The status of wheat disease and disease research in warmer areas. In Wheat for the Non-Traditional Warm Areas, A Proceeding of the International Conference; Sanders, D.A., Ed.; CIMMYT: El Batán, Mexico, 1991; pp. 125–145. [Google Scholar]
- Al-Sadi, A.M. Bipolaris sorokiniana-Induced Black Point, Common Root Rot, and Spot Blotch Diseases of Wheat: A Review. Front. Cell. Infect. Microbiol. 2021, 11, 584899. [Google Scholar] [CrossRef] [PubMed]
- Gupta, P.K.; Chand, R.; Vasistha, N.K.; Pandey, S.P.; Kumar, U.; Mishra, V.K.; Joshi, A.K. Spot blotch disease of wheat: The current status of research on genetics and breeding. Plant Pathol. 2018, 67, 508–531. [Google Scholar] [CrossRef]
- Sultana, S.; Adhikary, S.K.; Islam, M.; Rahman, S.M.M. Evaluation of Pathogenic Variability Based on Leaf Blotch Disease Development Components of Bipolaris sorokiniana in Triticum aestivum and Agroclimatic Origin. Plant Pathol. J. 2018, 34, 93–103. [Google Scholar] [CrossRef] [PubMed]
- Hyde, K.D.; Xu, J.; Rapior, S.; Jeewon, R.; Lumyong, S.; Niego, A.G.T.; Abeywickrama, P.D.; Aluthmuhandiram, J.V.S.; Brahamanage, R.S.; Brooks, S.; et al. The amazing potential of fungi: 50 ways we can exploit fungi industrially. Fung. Divers. 2019, 97, 1–136. [Google Scholar] [CrossRef] [Green Version]
- Persson, M.; Falk, A.; Dixelius, C. Studies on the mechanism of resistance toBipolaris sorokinianain the barley lesion mimic mutantbst. Mol. Plant Pathol. 2009, 10, 587–598. [Google Scholar] [CrossRef]
- Alkan, M.; Bayraktar, H.; İmren, M.; Özdemir, F.; Lahlali, R.; Mokrini, F.; Paulitz, T.; Dababat, A.A.; Özer, G. Monitoring of Host Suitability and Defense-Related Genes in Wheat to Bipolaris sorokiniana . J. Fungi 2022, 8, 149. [Google Scholar] [CrossRef]
- Rosa, S.M.; Borner, A.; Struik, P.C. Fungal Wheat Diseases: Etiology, Breeding, and Integrated Management. Front. Plant Sci. 2021, 12, 671060. [Google Scholar]
- Manzar, N.; Kashyap, A.S.; Maurya, A.; Rajawat, M.V.S.; Sharma, P.K.; Srivastava, A.K.; Roy, M.; Saxena, A.K.; Singh, H.V. Multi-Gene Phylogenetic Approach for Identification and Diversity Analysis of Bipolaris maydis and Curvularia lunata Isolates Causing Foliar Blight of Zea mays . J. Fungi 2022, 8, 802. [Google Scholar] [CrossRef] [PubMed]
- Kashyap, A.S.; Manzar, N.; Ahamad, F.; Tilgam, J.; Sharma, P.K.; Saxena, A.K. First Report of Root Rot Disease in Green Gram (Vigna radiata) Caused by Ectophoma multirostrata in India. Plant Dis. 2022, 106, 2256. [Google Scholar] [CrossRef]
- Canessa, P.; Schumacher, J.; Hevia, M.A.; Tudzynski, P.; Larrondo, L.F. Assessing the Effects of Light on Differentiation and Virulence of the Plant Pathogen Botrytis cinerea: Characterization of the White Collar Complex. PLoS ONE 2013, 8, e84223. [Google Scholar] [CrossRef] [PubMed] [Green Version]
- Raja, H.A.; Miller, A.N.; Pearce, C.J.; Oberlies, N.H. Fungal Identification Using Molecular Tools: A Primer for the Natural Products Research Community. J. Nat. Prod. 2017, 80, 756–770. [Google Scholar] [CrossRef] [PubMed]
- Lücking, R.; Aime, M.C.; Robbertse, B.; Miller, A.N.; Ariyawansa, H.A.; Aoki, T.; Cardinali, G.; Crous, P.W.; Druzhinina, I.S.; Geiser, D.M.; et al. Unambiguous identification of fungi: Where do we stand and how accurate and precise is fungal DNA barcoding? IMA Fungus 2020, 11, 1–32. [Google Scholar] [CrossRef] [PubMed]
- Badotti, F.; de Oliveira, F.S.; Garcia, C.F.; Vaz, A.B.M.; Fonseca, P.L.C.; Nahum, L.A.; Oliveira, G.; Góes-Neto, A. Effectiveness of ITS and sub-regions as DNA barcode markers for the identification of Basidiomycota (Fungi). BMC Microbiol. 2017, 17, 42. [Google Scholar] [CrossRef] [Green Version]
- Fry, N.K.; Savelkoul, P.H.; Visca, P. Amplified fragment length polymorphism analysis. In Molecular Epidemiology of Microorganisms. Methods in Molecular Biology; Caugant, D., Ed.; Humana Press: Totowa, NJ, USA, 2009; Volume 551, pp. 89–104. [Google Scholar]
- Guichoux, E.; Lagache, L.; Wagner, S.; Chaumeil, P.; Léger, P.; Lepais, O.; Lepoittevin, C.; Malausa, T.; Revardel, E.; Salin, F.; et al. Current trends in microsatellite genotyping. Mol. Ecol. Resour. 2011, 11, 591–611. [Google Scholar] [CrossRef]
- Bardakci, F. Random amplified polymorphic DNA (RAPD) markers. Turk. J. Biol. 2001, 25, 185–196. [Google Scholar]
- Hassel, K.; Gunnarsson, U. The use of inter simple sequence repeats (ISSR) in bryophyte population studies. Lindbergia 2003, 28, 152–157. [Google Scholar]
- Oliveira, M.; Azevedo, L. Molecular Markers: An Overview of Data Published for Fungi over the Last Ten Years. J. Fungi 2022, 8, 803. [Google Scholar] [CrossRef]
- Andriantahina, F.; Liu, X.; Huang, H. Genetic Map Construction and Quantitative Trait Locus (QTL) Detection of Growth-Related Traits in Litopenaeus vannamei for Selective Breeding Applications. PLoS ONE 2013, 8, e75206, Erratum in PLoS One 2013, 8. [Google Scholar] [CrossRef]
- Kim, J.-H.; Chung, I.K.; Kim, K.-M. Construction of a genetic map using EST-SSR markers and QTL analysis of major agronomic characters in hexaploid sweet potato (Ipomoea batatas (L.) Lam). PLoS ONE 2017, 12, e0185073. [Google Scholar] [CrossRef] [PubMed] [Green Version]
- Zhong, Y.; Cheng, Y.; Ruan, M.; Ye, Q.; Wang, R.; Yao, Z.; Zhou, G.; Liu, J.; Yu, J.; Wan, H. High-Throughput SSR Marker Development and the Analysis of Genetic Diversity in Capsicum frutescens . Horticulturae 2021, 7, 187. [Google Scholar] [CrossRef]
- Brake, M.; Al-Qadumii, L.; Hamasha, H.; Migdadi, H.; Awad, A.; Haddad, N.; Sadder, M.T. Development of SSR Markers Linked to Stress Responsive Genes along Tomato Chromosome 3 (Solanum lycopersicum L.). BioTech 2022, 11, 34. [Google Scholar] [CrossRef]
- Beier, S.; Thiel, T.; Münch, T.; Scholz, U.; Mascher, M. MISA-web: A web server for microsatellite prediction. Bioinformatics 2017, 33, 2583–2585. [Google Scholar] [CrossRef] [Green Version]
- Kõressaar, T.; Lepamets, M.; Kaplinski, L.; Raime, K.; Andreson, R.; Remm, M. Primer3_masker: Integrating masking of template sequence with primer design software. Bioinformatics 2018, 34, 1937–1938. [Google Scholar] [CrossRef] [Green Version]
- Hossienzadeh-Colagar, A.; Haghighatnia, M.J.; Amiri, Z.; Mohadjerani, M.; Tafrihi, M. Microsatellite (SSR) amplification by PCR usually led to polymorphic bands: Evidence which shows replication slippage occurs in extend or nascent DNA strands. Mol. Biol. Res. Commun. 2016, 5, 167–174. [Google Scholar] [CrossRef]
- Rohlf, F.J. Geometric morphometrics and phylogeny. In Morphology, Shape and Phylogeny; Forey, P.L., Ed.; CRC Press: Boca Raton, FL, USA, 2002; pp. 175–193. [Google Scholar] [CrossRef]
- Peakall, R.; Smouse, P.E. GenAlEx 6.5: Genetic analysis in Excel. Population genetic software for teaching and research—An update. Bioinformatics 2012, 28, 2537–2539. [Google Scholar] [CrossRef] [Green Version]
- Kashyap, P.L.; Kumar, S.; Sharma, A.; Kumar, R.S.; Mahapatra, S.; Kaul, N.; Khanna, A.; Jasrotia, P.; Singh, G.P. Molecular diversity, haplotype distribution and genetic variation flow of Bipolaris sorokiniana fungus causing spot blotch disease in different wheat-growing zones. J. Appl. Genet. 2022, 63, 793–803. [Google Scholar] [CrossRef]
- Yeh, F.C.; Yang, R.C.; Boyle, T. POPGENE Software Package Version 1.31 for Population Genetic Analysis; University of Alberta: Edmonton, AB, Canada, 1999. [Google Scholar]
- Evanno, G.; Regnaut, S.; Goudet, J. Detecting the number of clusters of individuals using the software structure: A simulation study. Mol. Ecol. 2005, 14, 2611–2620. [Google Scholar] [CrossRef] [Green Version]
- Bass, D.; Stentiford, G.D.; Wang, H.-C.; Koskella, B.; Tyler, C.R. The Pathobiome in Animal and Plant Diseases. Trends Ecol. Evol. 2019, 34, 996–1008. [Google Scholar] [CrossRef] [PubMed] [Green Version]
- Singh, V.; Lakshman, D.K.; Roberts, D.P.; Ismaiel, A.; Abhishek, A.; Kumar, S.; Hooda, K.S. Fungal Species Causing Maize Leaf Blight in Different Agro-Ecologies in India. Pathogens 2021, 10, 1621. [Google Scholar] [CrossRef]
- Gupt, S.K.; Chand, R.; Mishra, V.K.; Ahirwar, R.N.; Bhatta, M.; Joshi, A.K. Spot blotch disease of wheat as influenced by foliar trichome and stomata density. J. Agric. Food Res. 2021, 6, 100227. [Google Scholar] [CrossRef]
- Amaradasa, B.S.; Amundsen, K. First Report of Curvularia inaequalis and Bipolaris spicifera Causing Leaf Blight of Buffalograss in Nebraska. Plant Dis. 2014, 98, 279. [Google Scholar] [CrossRef] [PubMed]
- Dutech, C.; Enjalbert, J.; Fournier, E.; Delmotte, F.; Barrès, B.; Carlier, J.; Tharreau, D.; Giraud, T. Challenges of microsatellite isolation in fungi. Fungal Genet. Biol. 2007, 44, 933–949. [Google Scholar] [CrossRef] [PubMed]
- Zane, L.; Bargelloni, L.; Patarnello, T. Strategies for microsatellite isolation: A review. Mol. Ecol. 2002, 11, 1–16. [Google Scholar] [CrossRef]
- Hamelin, R.C.; Beaulieu, J.; Plourde, A. Genetic diversity in populations of Cronartium ribicola in plantations and natural stands of Pinus strobus. Theor. Appl. Genet. 1995, 91, 1214–1221. [Google Scholar] [CrossRef]
- Braithwaite, K.S.; Bakkeren, G.; Croft, B.J.; Brumbley, S.M. Genetic variation in a worldwide collection of the sugarcane smut fungus Ustilago scitaminea. Proc. Aust. Soc. Sugar Cane Technol. 2004, 26, 1–9. [Google Scholar]
- Zhou, Y.-L.; Pan, Y.-J.; Xie, X.-W.; Zhu, L.-H.; Xu, J.-L.; Wang, S.; Li, Z.-K. Genetic Diversity of Rice False Smut Fungus, Ustilaginoidea virens and its Pronounced Differentiation of Populations in North China. J. Phytopathol. 2008, 156, 559–564. [Google Scholar] [CrossRef]
- Varady, E.S.; Bodaghi, S.; Vidalakis, G.; Douhan, G.W. Microsatellite characterization and marker development for the fungus Penicillium digitatum, causal agent of green mold of citrus. Microbiol. Open 2019, 8, e788. [Google Scholar] [CrossRef] [Green Version]
- Chen, R.; Shimono, A.; Aono, M.; Nakajima, N.; Ohsawa, R.; Yoshioka, Y. Genetic diversity and population structure of feral rapeseed (Brassica napus L.) in Japan. PLoS ONE 2020, 15, e0227990. [Google Scholar] [CrossRef] [PubMed] [Green Version]
- Ivanizs, L.; Monostori, I.; Farkas, A.; Megyeri, M.; Mikó, P.; Türkösi, E.; Gaál, E.; Lenykó-Thegze, A.; Szőke-Pázsi, K.; Szakács, É.; et al. Unlocking the Genetic Diversity and Population Structure of a Wild Gene Source of Wheat, Aegilops biuncialis Vis., and Its Relationship With the Heading Time. Front. Plant Sci. 2019, 10, 1531. [Google Scholar] [CrossRef] [PubMed] [Green Version]
- Pyne, R.M.; Honig, J.A.; Vaiciunas, J.; Wyenandt, C.A.; Simon, J.E. Population structure, genetic diversity and downy mildew resistance among Ocimum species germplasm. BMC Plant Biol. 2018, 18, 69. [Google Scholar] [CrossRef] [PubMed]
- Gadissa, F.; Tesfaye, K.; Dagne, K.; Geleta, M. Genetic diversity and population structure analyses of Plectranthus edulis (Vatke) Agnew collections from diverse agro-ecologies in Ethiopia using newly developed EST-SSRs marker system. BMC Genet. 2018, 19, 92. [Google Scholar] [CrossRef] [PubMed]


| Locus | Forward Primer Sequence (5′-3′) | Reverse Primer Sequence (5′-3′) | Tm (°C) | Allele Size (bp) | Motif | Repeat |
|---|---|---|---|---|---|---|
| BS-1 | GGAGATGTGTGTCATGGTGC | GGTCTTGATATTCCGTGTGCG | 58 | 265 | AGT | 44 |
| BS-2 | ATGTCACTTCCGACTCCAGC | TTTTGCTTCGGTTGCTTCGG | 59 | 224 | ACA | 42 |
| BS-3 | TGAGATGGTTGCAAAGGGGG | TCAACTCCATATTGCTTGGACC | 60 | 243 | AGA | 34 |
| BS-4 | GTTCTTGTTCTGCAGGTGCG | GAACAGCAGAGAAAAGGCGC | 60 | 214 | ACT | 30 |
| BS-5 | CACAGATGCTTTATCGCGCG | GCAACTGAAAACGGCAAATCC | 60 | 183 | GTA | 24 |
| BS-6 | GATTTTGATCGAAGGGGCGG | ACCTCATATGCGCACAAAAGG | 59 | 157 | TTC | 24 |
| BS-7 | TGGATTTGTCGGAGTTGAATTGC | TTTCCAACGGAAATTCGCGG | 60 | 199 | CTT | 21 |
| BS-8 | TGAGGATGAGGTTGTTGCGG | AACATACGCCCACCTCATCC | 60 | 174 | GAG | 21 |
| BS-9 | CGGTTAGCCACAGCAAAGC | TGTATTGTTCAAGCTGGCGC | 59 | 153 | TAG | 20 |
| BS-10 | CAACATGCTCGTTACCGTGG | TCACGCATCTAAGCAGCAGC | 59 | 125 | TAC | 20 |
| BS-11 | GGAACCTACTCCGACGTTGC | ATGTACAGACGCACGTCAGC | 60 | 209 | TGA | 18 |
| BS-12 | ACGGGTAAATCATCGGTGCC | TGGTGCAGGTATGAAGACGG | 60 | 175 | ACT | 18 |
| BS-13 | TTGCTGCTGCCTTGTATTGC | GCGTGCTGCAACAATGGG | 59 | 130 | ACT | 18 |
| BS-14 | ACGAGTCCTTTTTACCACAGC | ATCTGGCGTACTTTCCGTCC | 58 | 177 | GAA | 17 |
| BS-15 | GACACACTCGACTCGATGCC | CGCGAGGTTACTGGGATTGG | 60 | 135 | ACA | 17 |
| BS-16 | AGATTATCAGGCCTCCACAGG | CTCTCCAGGCACCAACCG | 58 | 191 | ATC | 16 |
| BS-17 | ACACTCGCCTTTAGTTTGGC | TGGTATGTCGTCCCAAAGCC | 58 | 180 | TTC | 16 |
| BS-18 | TCCACCCCAATTCTATACTTACTACC | TAATCAGAGGGGCAAAGGGC | 59 | 209 | TAG | 15 |
| BS-19 | ACCGTCCTACCCAGATACCC | TTGAGGATGGGGTGGGATCC | 60 | 184 | AGA | 15 |
| BS-20 | TTGCCCATTGCTCGTTACCC | GAGGGGTTTCAGCAGTAGGG | 60 | 183 | CTA | 14 |
| BS-21 | AGGCTGAAGCTGACAAAGGC | TTGGAGGAGAAGGAGGACGG | 60 | 182 | GAA | 14 |
| BS-22 | CGAGCACACAGTCGTCTAGG | TTGTTCGTTTTGCGTGTCGG | 60 | 182 | TCA | 14 |
| BS-23 | AGGCATTCAGTCCGTTAGTCC | CTTATTGCCGGCTGCTTACG | 59 | 125 | GTCA | 16 |
| BS-24 | ATGTGGGAATACGGGGAAGG | TTCAGCCAAGTCTCTTGTGC | 59 | 205 | AGAA | 14 |
| BS-25 | AGACCATCTGTTGCCCAACC | CAGACTGATTCCTTGTCGAGC | 60 | 165 | ATAC | 14 |
| BS-26 | GCGTTTGCTTTCGATCGTCC | AGGCTGGAGAGGAGAGTTGG | 60 | 157 | AAGA | 12 |
| BS-27 | AGACATTGAGGCAGTCGTGG | GGAAAACAGGCCGTTGTTGC | 60 | 148 | GGCT | 12 |
| BS-28 | GACATCGTATCTGCCGTGGG | AAAGCTGTCAAATTGCGGGC | 60 | 174 | TACA | 11 |
| BS-29 | TCAAATGCAATGTATTCTCTACCCG | CACGTCCCATAACGGATTGC | 59 | 159 | TCTT | 11 |
| BS-30 | ACAACCTGCCACTATCACGG | CCTAGTGGATGGGCAATGGG | 60 | 169 | CCAT | 10 |
| BS-31 | TGCATCACTGTAAGCCCTGG | TCCCAGCTTCAATGCCTTGG | 60 | 167 | CATA | 10 |
| BS-32 | TTTTCTTTCTCTCCGCACGC | GTCTTGGGGGTGGACAAGG | 59 | 168 | AGAA | 9 |
| BS-33 | TTTTGATCGAGGTCTAACAGGC | GCTCAATCGAGGAACTATGCC | 58 | 168 | CTTT | 9 |
| BS-34 | GAATAGGGAGTGGACGAGAGC | ACAAACGCTGCGTAGATTTCC | 59 | 196 | AAAG | 8 |
| BS-35 | GATTGGGCCAGTTGAAACCG | TGCCACCCTCCTCTACTACC | 59 | 188 | GGTT | 8 |
| BS-36 | CTGGTAGCGGTAGTGGTAGC | CTTGTAGAGAGGAGCCCTGC | 59 | 158 | GTGTA | 16 |
| BS-37 | CGTTCATTTTCTCCGCCAGG | TGGCATATGAATCCTGGGGG | 59 | 165 | AAAAG | 12 |
| BS-38 | CATCAGCCAAACCGTTGACG | TGTACTCTACACGGATGCATACG | 60 | 176 | ACTAC | 9 |
| BS-39 | GCCCCTAGATGAGAACTCGC | GCGAAATTTGCTGCAATCCC | 59 | 178 | TCGTG | 8 |
| BS-40 | TCAGTATCTAGTGCGCACCC | TGTGCATTGTTGTGCTGTCC | 59 | 171 | TGCCC | 8 |
| BS-41 | CTTCCATACTAGTCGGTCCCC | GGCAGGGCTTTCTTTTTGGG | 59 | 178 | CACTA | 7 |
| BS-42 | GACTAGTACTGGGCGATGGC | ACCAATCCTACTCGGCATGC | 59 | 204 | CGCAA | 6 |
| BS-43 | CTGCCCTAGAGTAAGACGGC | TGGAGTGTGTTGCTGCTAGG | 59 | 166 | CATCC | 6 |
| BS-44 | CCTACCTCCTCCCACTACCC | AAGTGATAGTGCGGGTGTGG | 60 | 160 | CCATC | 6 |
| BS-45 | CCGTTCACATGCCGTAAACG | CTGGGCGTGGTGTTTGTCG | 60 | 151 | CCATC | 6 |
| BS-46 | CTTTGCATGTTCCTGACCCG | CTTGCAACTCCAACATGGCC | 59 | 259 | AGCAGT | 17 |
| BS-47 | TCGTCTACGCCACGAATAGC | CCTCTAATGCGACGCGACG | 59 | 249 | TAGATG | 11 |
| BS-48 | TCTAGGCGTAGAGTGCTCCC | CCTGTCGAGCTGAAAATGCG | 60 | 159 | GCTCAT | 10 |
| BS-49 | TTTCGCTGAAACTTGCTCGC | TGAAGCCGAAGATGAGCAGG | 60 | 121 | TCCTGT | 8 |
| BS-50 | GTATGGGGCAGACTGGTAGC | CTCGTCCACGTCTACATCCC | 59 | 199 | TGCTGT | 7 |
| BS-51 | CAAATGTCCGGCGATGTTGG | GCTAACATGCAGCCAACACC | 60 | 192 | TGATTC | 7 |
| BS-52 | TAGGACTTGTTGCGGCTAGG | ACATGCTACACGGACACACC | 59 | 179 | ACCAGC | 6 |
| BS-53 | TCCTTGTCCTTGTCCTTGTCC | AGCCCTATGGTCACGAATGC | 59 | 179 | TTCTCT | 6 |
| BS-54 | GGGCTGGACGAGTGATATGG | TGCTGATACCGTTGCTGTCG | 59 | 160 | AGGAGC | 6 |
| BS-55 | ATCTTTTCGTGCAGGGGAGG | TCGATCCTCAAATAGCGCCC | 60 | 158 | TGTGGC | 6 |
| Marker | Major Allele Frquency | Allele No. | Availability | Gene Diversity | Observed Heterozygosity | Expected Heterozygosity | Polymorphic Information Content | Shannon’s Information Index |
|---|---|---|---|---|---|---|---|---|
| BS-2 | 0.5238 | 3.0000 | 0.5833 | 0.5397 | 0.4472 | 0.5528 | 0.4368 | 0.8468 |
| BS-3 | 0.8333 | 2.0000 | 0.5000 | 0.2778 | 0.3444 | 0.3556 | 0.2392 | 0.5297 |
| BS-4 | 0.5000 | 3.0000 | 0.7222 | 0.5355 | 0.4546 | 0.5461 | 0.4276 | 0.8287 |
| BS-5 | 0.8333 | 3.0000 | 0.5000 | 0.2901 | 0.2016 | 0.2984 | 0.2686 | 0.5566 |
| BS-6 | 0.5238 | 2.0000 | 0.5833 | 0.4989 | 0.4892 | 0.5111 | 0.3744 | 0.6921 |
| BS-7 | 0.5714 | 3.0000 | 0.5833 | 0.5261 | 0.4611 | 0.5389 | 0.4292 | 0.8324 |
| BS-8 | 0.8947 | 2.0000 | 0.5278 | 0.1884 | 0.5065 | 0.4935 | 0.1706 | 0.3365 |
| BS-9 | 0.8571 | 2.0000 | 0.5833 | 0.2449 | 0.5491 | 0.5509 | 0.2149 | 0.4101 |
| BS-10 | 0.7391 | 3.0000 | 0.6389 | 0.4197 | 0.6851 | 0.6149 | 0.3819 | 0.7356 |
| BS-11 | 0.7500 | 3.0000 | 0.4444 | 0.3984 | 0.5242 | 0.4758 | 0.3542 | 0.7775 |
| BS-13 | 0.7143 | 2.0000 | 0.1944 | 0.4082 | 0.5604 | 0.4396 | 0.3249 | 0.5983 |
| BS-14 | 0.8750 | 2.0000 | 0.4444 | 0.2188 | 0.1742 | 0.1258 | 0.1948 | 0.3768 |
| BS-15 | 0.8462 | 2.0000 | 0.3611 | 0.2604 | 0.4292 | 0.5708 | 0.2265 | 0.4293 |
| BS-16 | 0.8182 | 2.0000 | 0.3056 | 0.2975 | 0.5883 | 0.4117 | 0.2533 | 0.4741 |
| BS-17 | 0.5000 | 2.0000 | 0.5556 | 0.5000 | 0.4872 | 0.5128 | 0.3750 | 0.6931 |
| BS-18 | 0.8750 | 2.0000 | 0.2222 | 0.2188 | 0.4667 | 0.5333 | 0.1948 | 0.3768 |
| BS-19 | 0.6667 | 2.0000 | 0.4167 | 0.4444 | 0.5402 | 0.4598 | 0.3457 | 0.6365 |
| BS-20 | 0.6364 | 3.0000 | 0.3056 | 0.5124 | 0.4632 | 0.5368 | 0.4442 | 0.8633 |
| BS-21 | 0.5400 | 3.0000 | 0.6944 | 0.5864 | 0.4016 | 0.5984 | 0.5112 | 0.9726 |
| BS-22 | 0.6957 | 3.0000 | 0.6389 | 0.4612 | 0.5285 | 0.4715 | 0.4075 | 0.7966 |
| BS-23 | 0.3947 | 1.0000 | 0.2278 | 0.3942 | 0.2431 | 0.2131 | 0.3674 | 0.4895 |
| BS-24 | 0.5000 | 5.0000 | 0.8056 | 0.6474 | 0.4412 | 0.5688 | 0.5932 | 1.2415 |
| BS-25 | 0.5000 | 3.0000 | 0.7222 | 0.5888 | 0.4997 | 0.5003 | 0.5042 | 0.9632 |
| BS-26 | 0.5000 | 3.0000 | 0.4444 | 0.6172 | 0.3629 | 0.4371 | 0.5439 | 1.0239 |
| BS-27 | 0.9167 | 2.0000 | 0.6667 | 0.1528 | 0.8441 | 0.8563 | 0.1411 | 0.2868 |
| BS-28 | 0.5238 | 3.0000 | 0.5833 | 0.6122 | 0.5728 | 0.6272 | 0.5436 | 1.0221 |
| BS-30 | 0.6111 | 4.0000 | 0.5000 | 0.5432 | 0.4413 | 0.5287 | 0.4800 | 0.9779 |
| BS-31 | 0.5500 | 2.0000 | 0.8333 | 0.4950 | 0.4966 | 0.5034 | 0.3725 | 0.6881 |
| BS-32 | 0.8846 | 2.0000 | 0.7222 | 0.2041 | 0.7919 | 0.8081 | 0.1833 | 0.3576 |
| BS-33 | 0.7532 | 2.0000 | 0.8332 | 0.1932 | 0.3212 | 0.2155 | 0.3211 | 0.6236 |
| BS-34 | 0.7420 | 2.0000 | 0.5278 | 0.2716 | 0.3321 | 0.4120 | 0.3982 | 0.4896 |
| BS-35 | 0.5200 | 3.0000 | 0.6944 | 0.5344 | 0.4547 | 0.5453 | 0.4282 | 0.8366 |
| BS-36 | 0.8333 | 2.0000 | 0.6667 | 0.2778 | 0.7163 | 0.7837 | 0.2392 | 0.4506 |
| BS-37 | 0.8261 | 2.0000 | 0.6389 | 0.2873 | 0.5131 | 0.4871 | 0.4461 | 0.6693 |
| BS-38 | 0.6522 | 3.0000 | 0.6389 | 0.4991 | 0.4899 | 0.5101 | 0.4337 | 0.8417 |
| BS-39 | 0.9167 | 2.0000 | 0.3333 | 0.1528 | 0.8406 | 0.7594 | 0.1411 | 0.2868 |
| BS-40 | 0.8333 | 4.0000 | 0.8333 | 0.2933 | 0.7017 | 0.7983 | 0.2763 | 0.6089 |
| BS-41 | 0.4228 | 2.0000 | 0.4722 | 0.2974 | 0.3211 | 0.4810 | 0.3902 | 0.5608 |
| BS-42 | 0.8261 | 2.0000 | 0.6389 | 0.2873 | 0.7063 | 0.2937 | 0.2461 | 0.4623 |
| BS-43 | 0.4737 | 3.0000 | 0.5278 | 0.5873 | 0.4969 | 0.5031 | 0.4988 | 0.9551 |
| BS-44 | 0.5037 | 2.0000 | 0.4111 | 0.5109 | 0.4211 | 0.4140 | 0.4012 | 0.6221 |
| BS-45 | 0.6667 | 2.0000 | 0.6667 | 0.4444 | 0.5461 | 0.4539 | 0.3457 | 0.6365 |
| BS-46 | 0.5296 | 2.0000 | 0.5278 | 0.4924 | 0.2291 | 0.2312 | 0.3122 | 0.4287 |
| BS-47 | 0.5714 | 3.0000 | 0.5833 | 0.5805 | 0.4053 | 0.4947 | 0.5157 | 0.9773 |
| BS-48 | 0.6957 | 3.0000 | 0.6389 | 0.4461 | 0.5441 | 0.4561 | 0.3782 | 0.7393 |
| BS-49 | 0.9231 | 2.0000 | 0.3611 | 0.1420 | 0.8523 | 0.8477 | 0.1319 | 0.2712 |
| BS-50 | 0.7218 | 2.0000 | 0.3611 | 0.5107 | 0.2121 | 0.2311 | 0.2101 | 0.3214 |
Disclaimer/Publisher’s Note: The statements, opinions and data contained in all publications are solely those of the individual author(s) and contributor(s) and not of MDPI and/or the editor(s). MDPI and/or the editor(s) disclaim responsibility for any injury to people or property resulting from any ideas, methods, instructions or products referred to in the content. |
© 2023 by the authors. Licensee MDPI, Basel, Switzerland. This article is an open access article distributed under the terms and conditions of the Creative Commons Attribution (CC BY) license (https://creativecommons.org/licenses/by/4.0/).
Share and Cite
Kashyap, A.S.; Manzar, N.; Maurya, A.; Mishra, D.D.; Singh, R.P.; Sharma, P.K. Development of Diagnostic Markers and Applied for Genetic Diversity Study and Population Structure of Bipolaris sorokiniana Associated with Leaf Blight Complex of Wheat. J. Fungi 2023, 9, 153. https://doi.org/10.3390/jof9020153
Kashyap AS, Manzar N, Maurya A, Mishra DD, Singh RP, Sharma PK. Development of Diagnostic Markers and Applied for Genetic Diversity Study and Population Structure of Bipolaris sorokiniana Associated with Leaf Blight Complex of Wheat. Journal of Fungi. 2023; 9(2):153. https://doi.org/10.3390/jof9020153
Chicago/Turabian StyleKashyap, Abhijeet Shankar, Nazia Manzar, Avantika Maurya, Deendayal Das Mishra, Ravinder Pal Singh, and Pawan Kumar Sharma. 2023. "Development of Diagnostic Markers and Applied for Genetic Diversity Study and Population Structure of Bipolaris sorokiniana Associated with Leaf Blight Complex of Wheat" Journal of Fungi 9, no. 2: 153. https://doi.org/10.3390/jof9020153