
Multifarious Translational Regulation during Replicative Aging in Yeast
 , and
, and 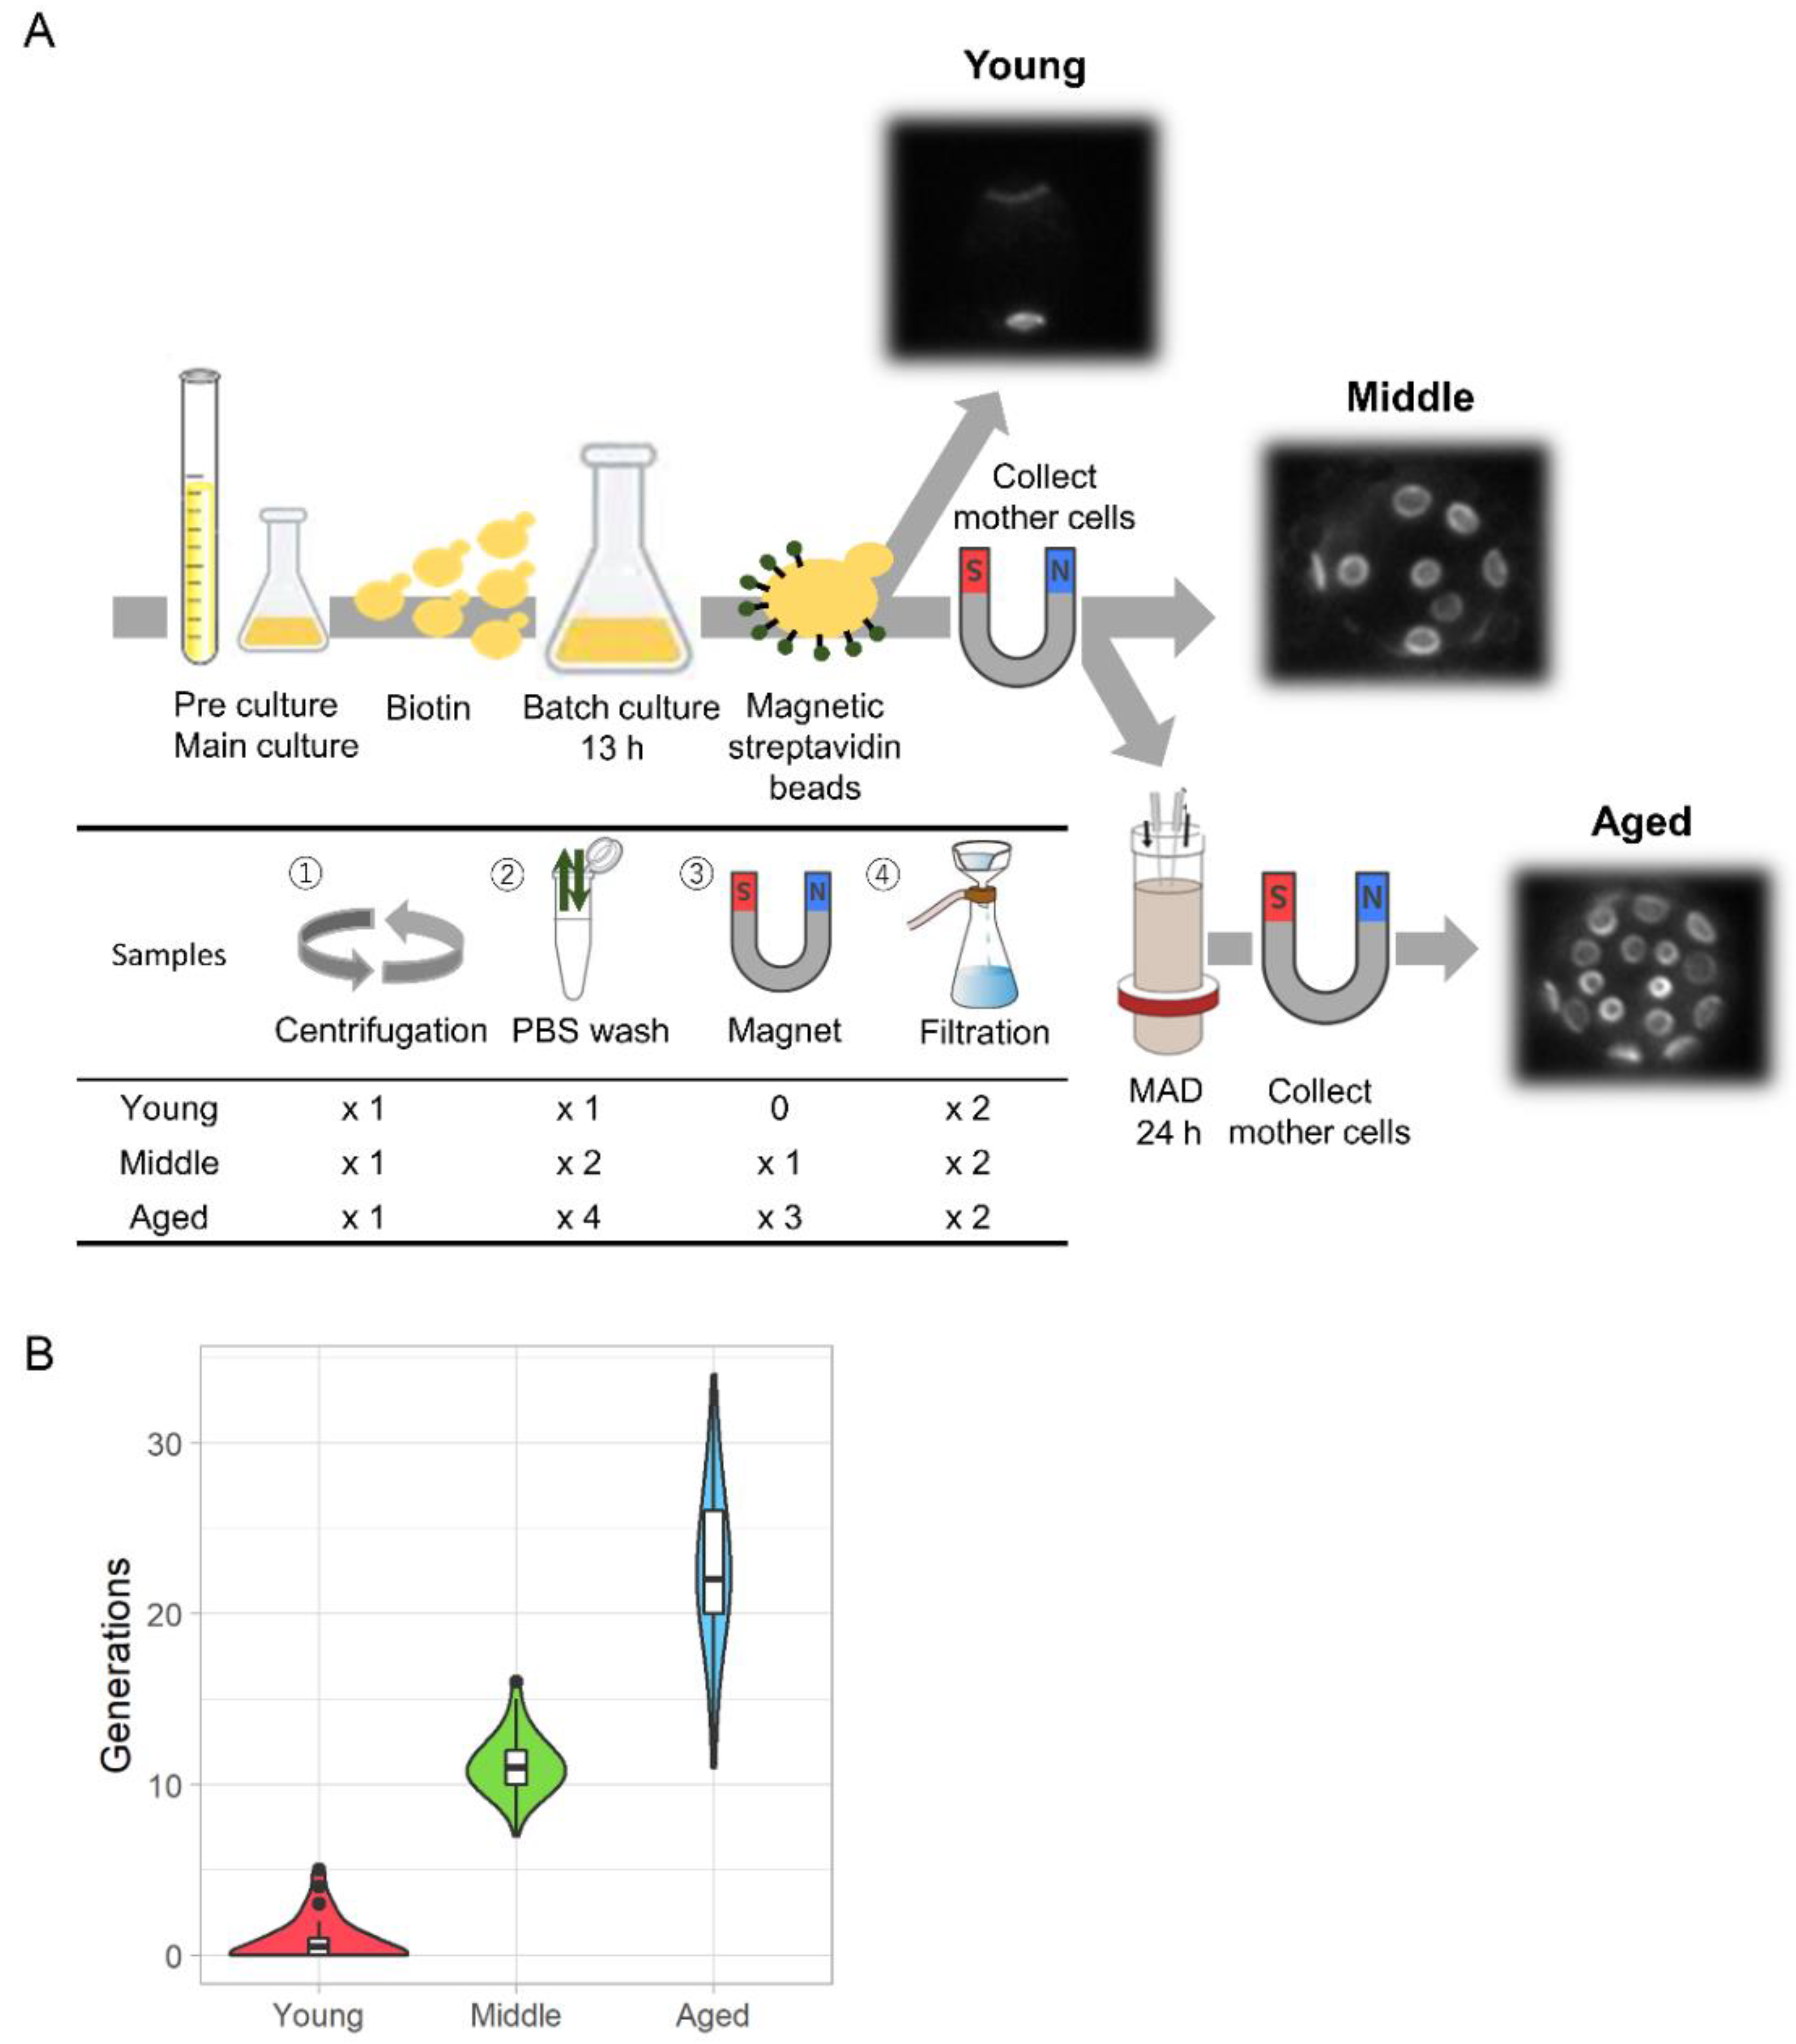
Abstract
:1. Introduction
2. Materials and Methods
2.1. Assembly of MADs
2.2. Preparation of Aged Yeast Cells
2.3. Cell Harvest
2.4. Cell Lysis
2.5. Library Preparation for Ribosome Profiling and RNA-Seq
2.6. Data Analysis
2.7. Biochemistry
2.8. Fluorescence Microscopy
2.9. Database
3. Results and Discussion
3.1. Outline of the Experiments
3.2. Validation of Our Samples with RNA-Seq Data
3.3. Quality Control of Ribosome-Protected mRNA Footprints
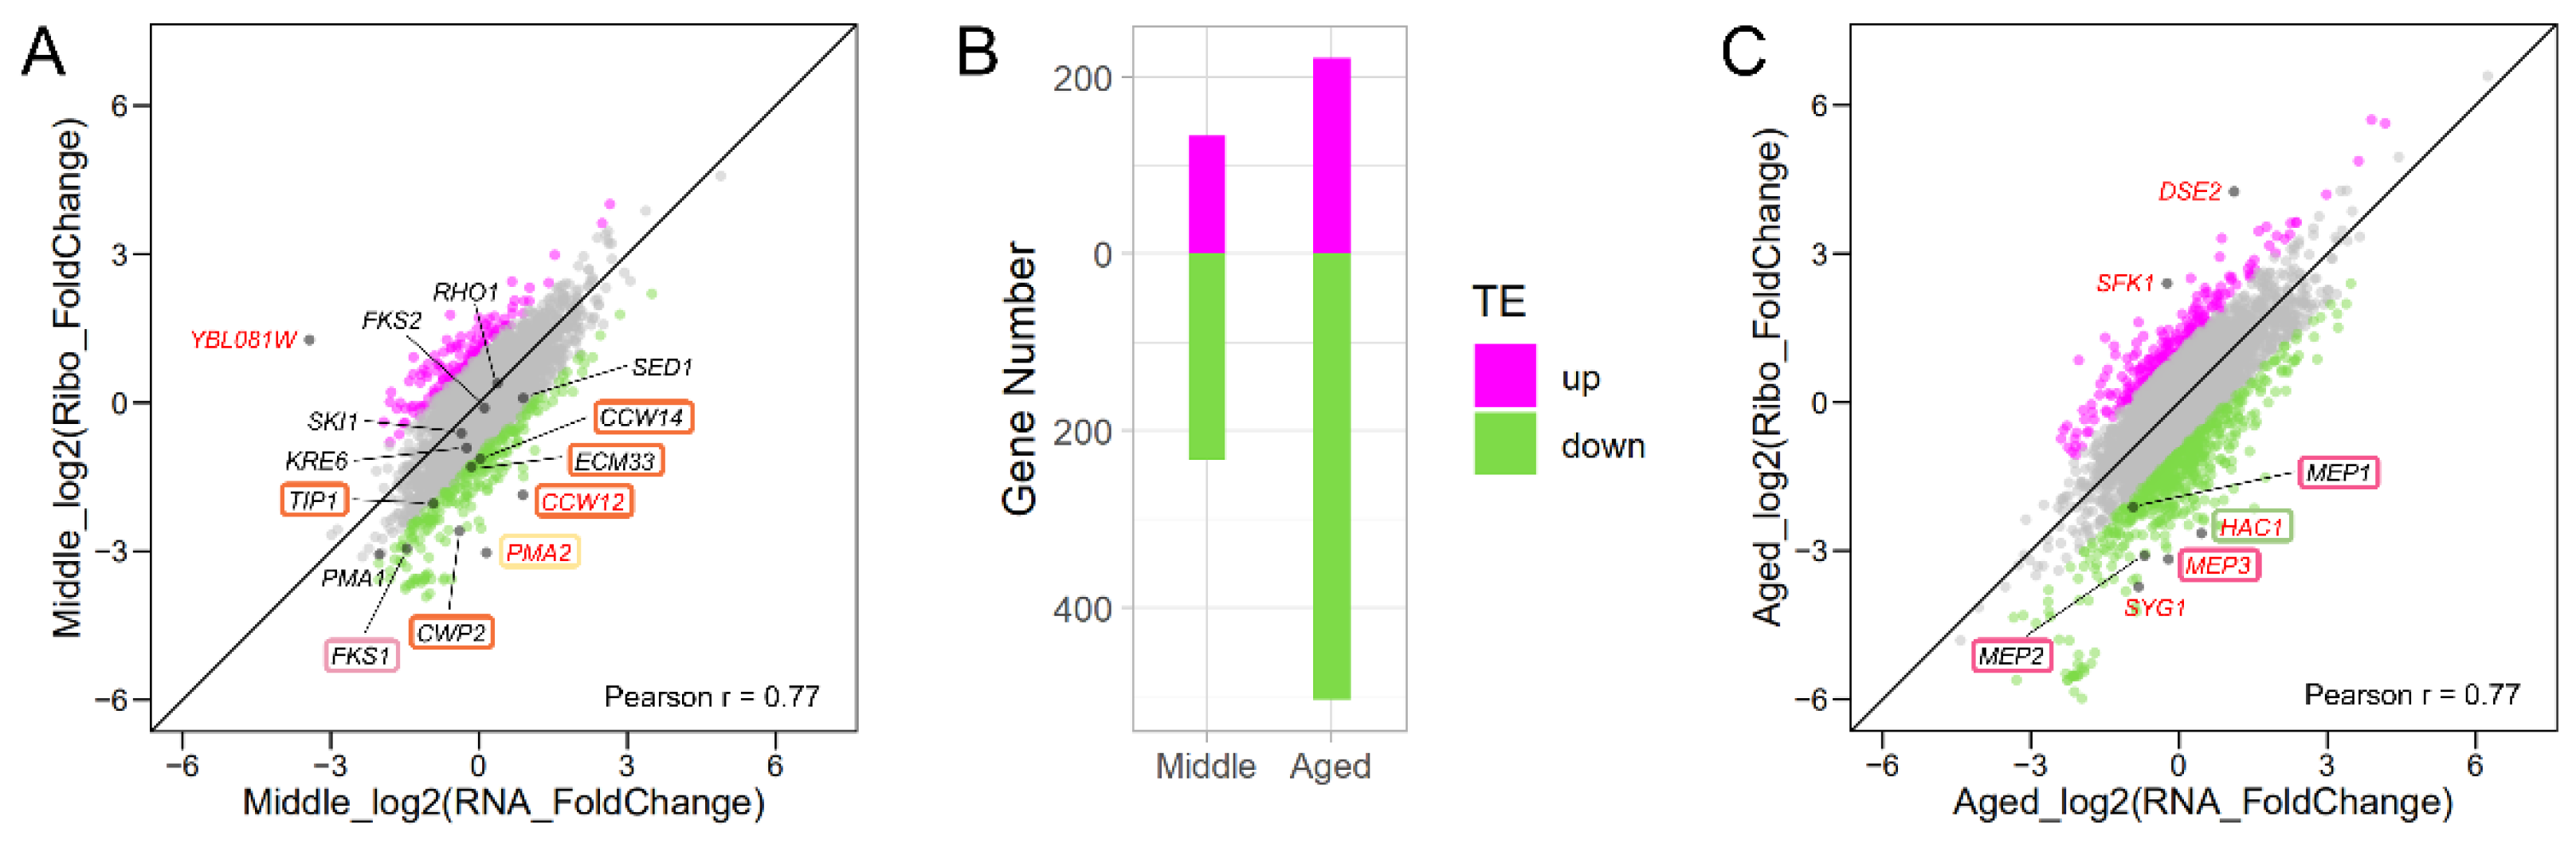
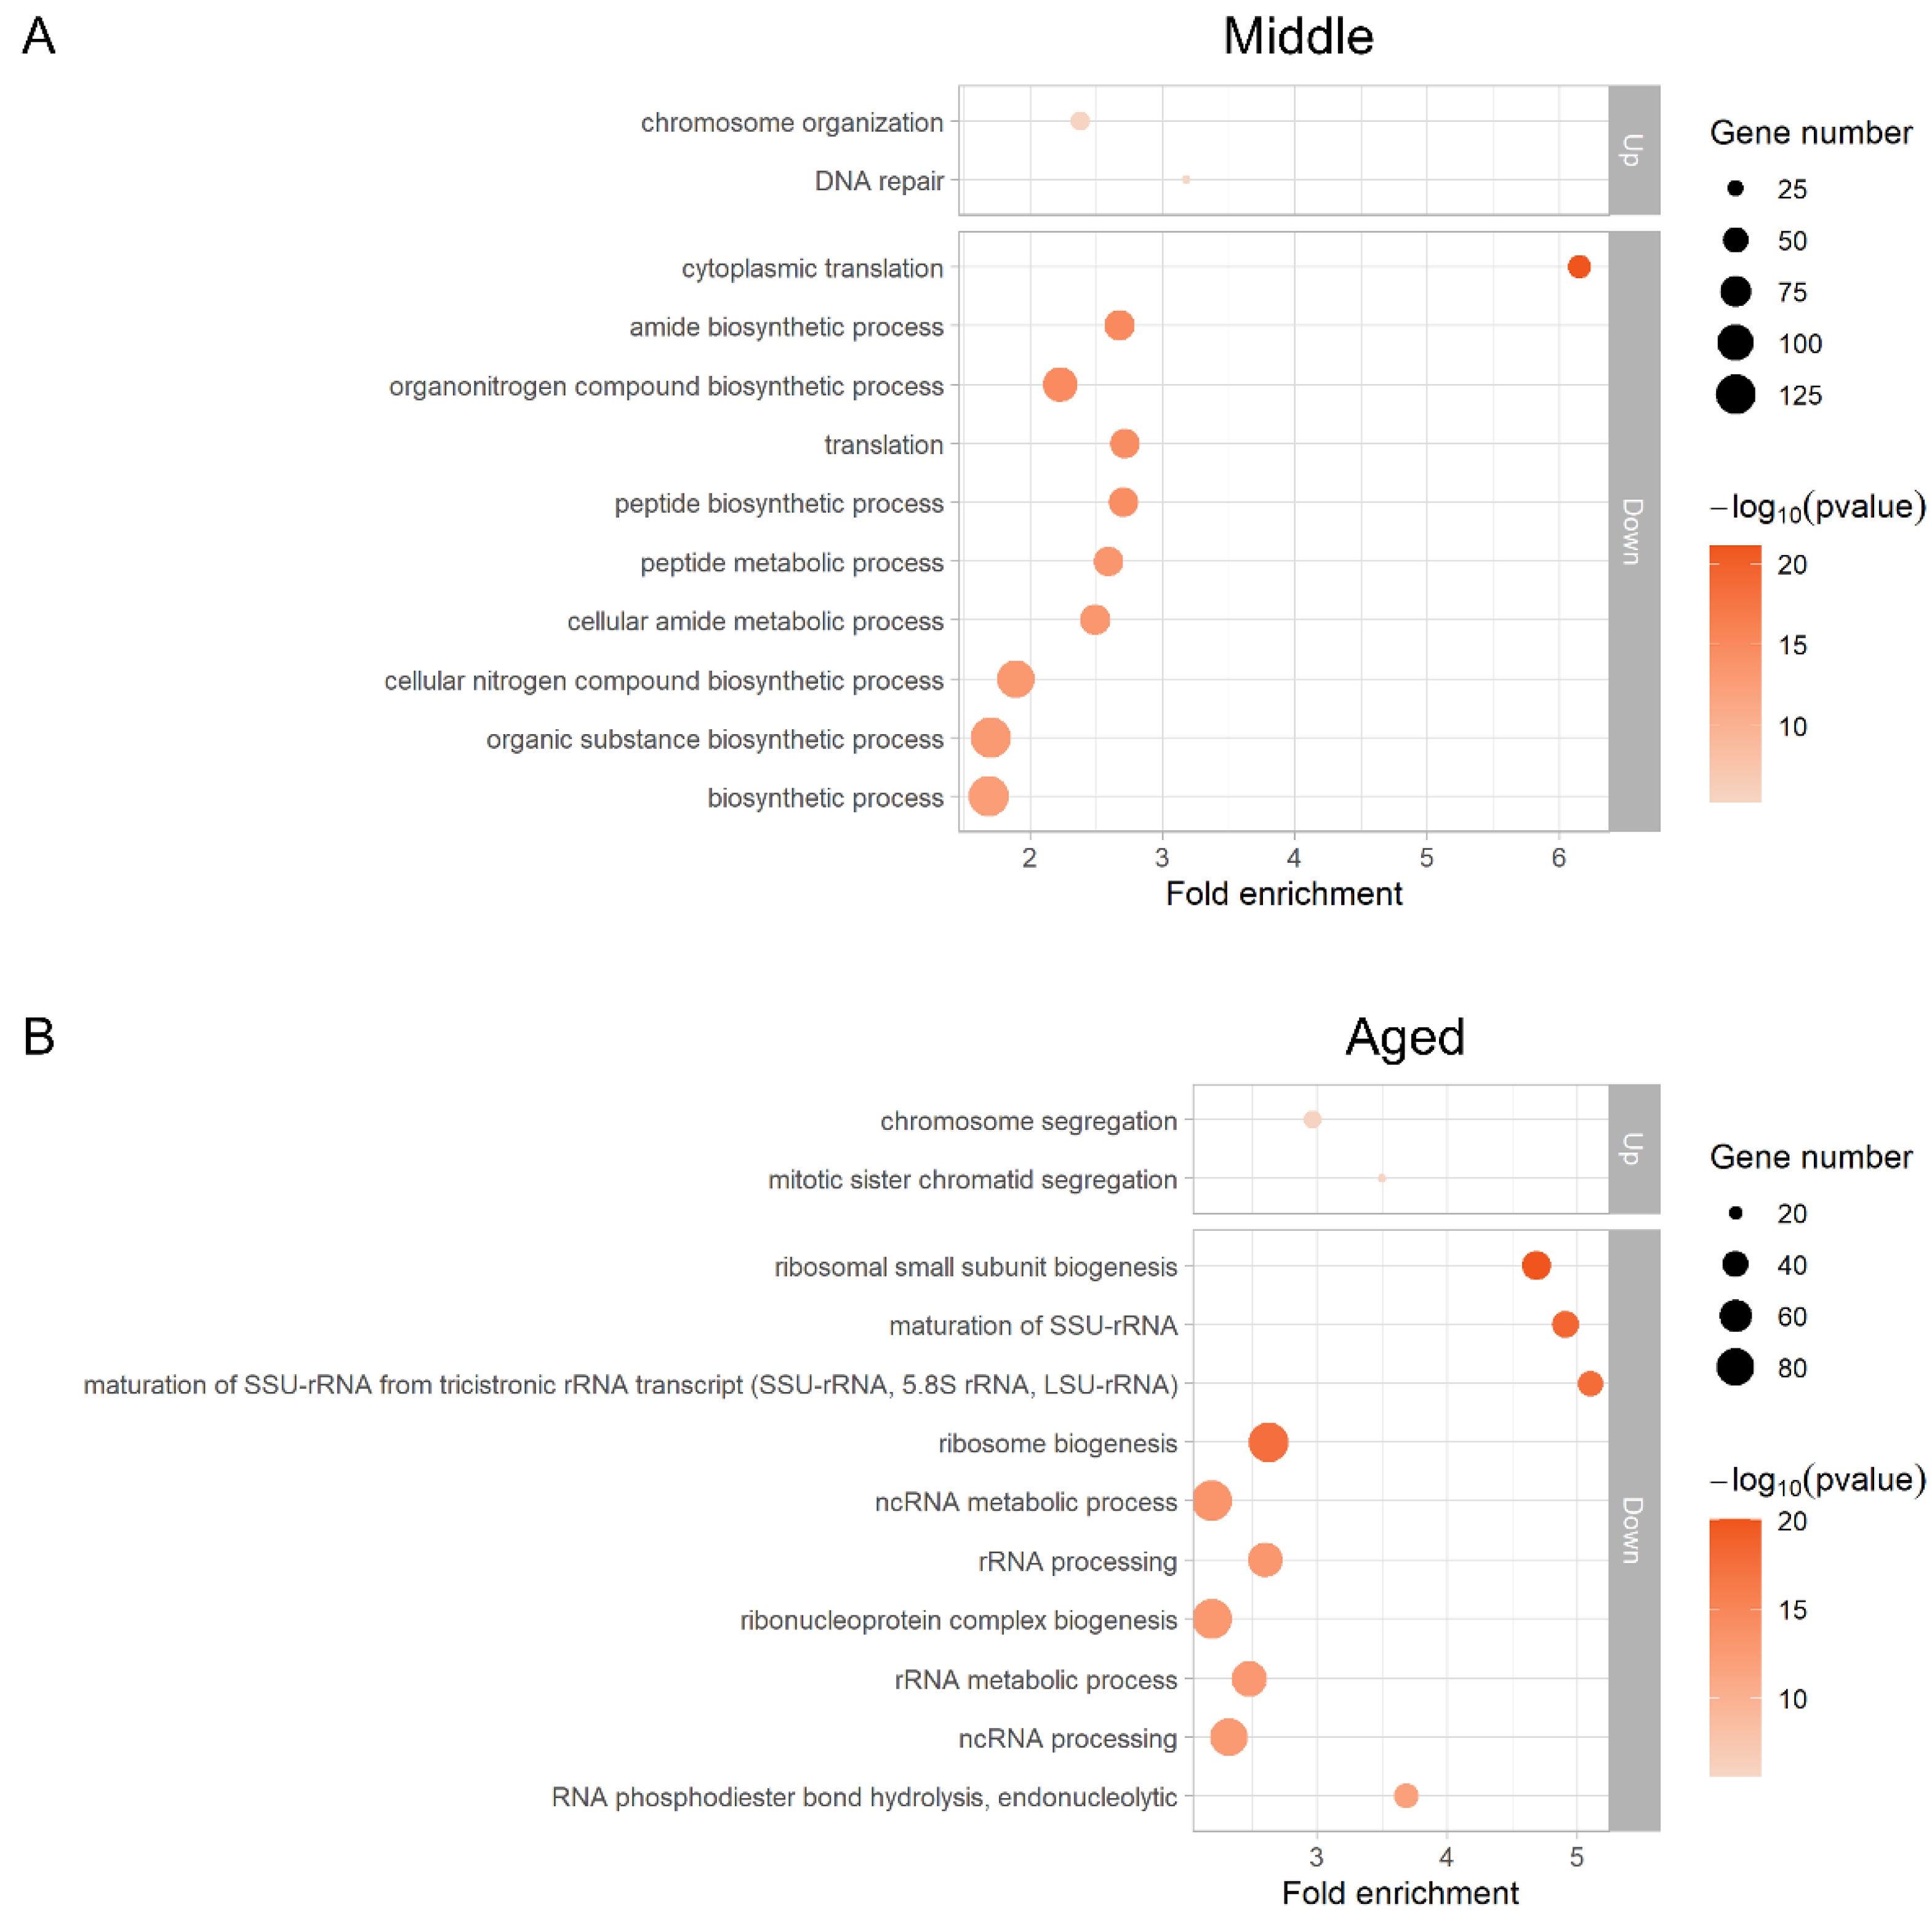
3.4. Translation Profile Changes during Replicative Aging
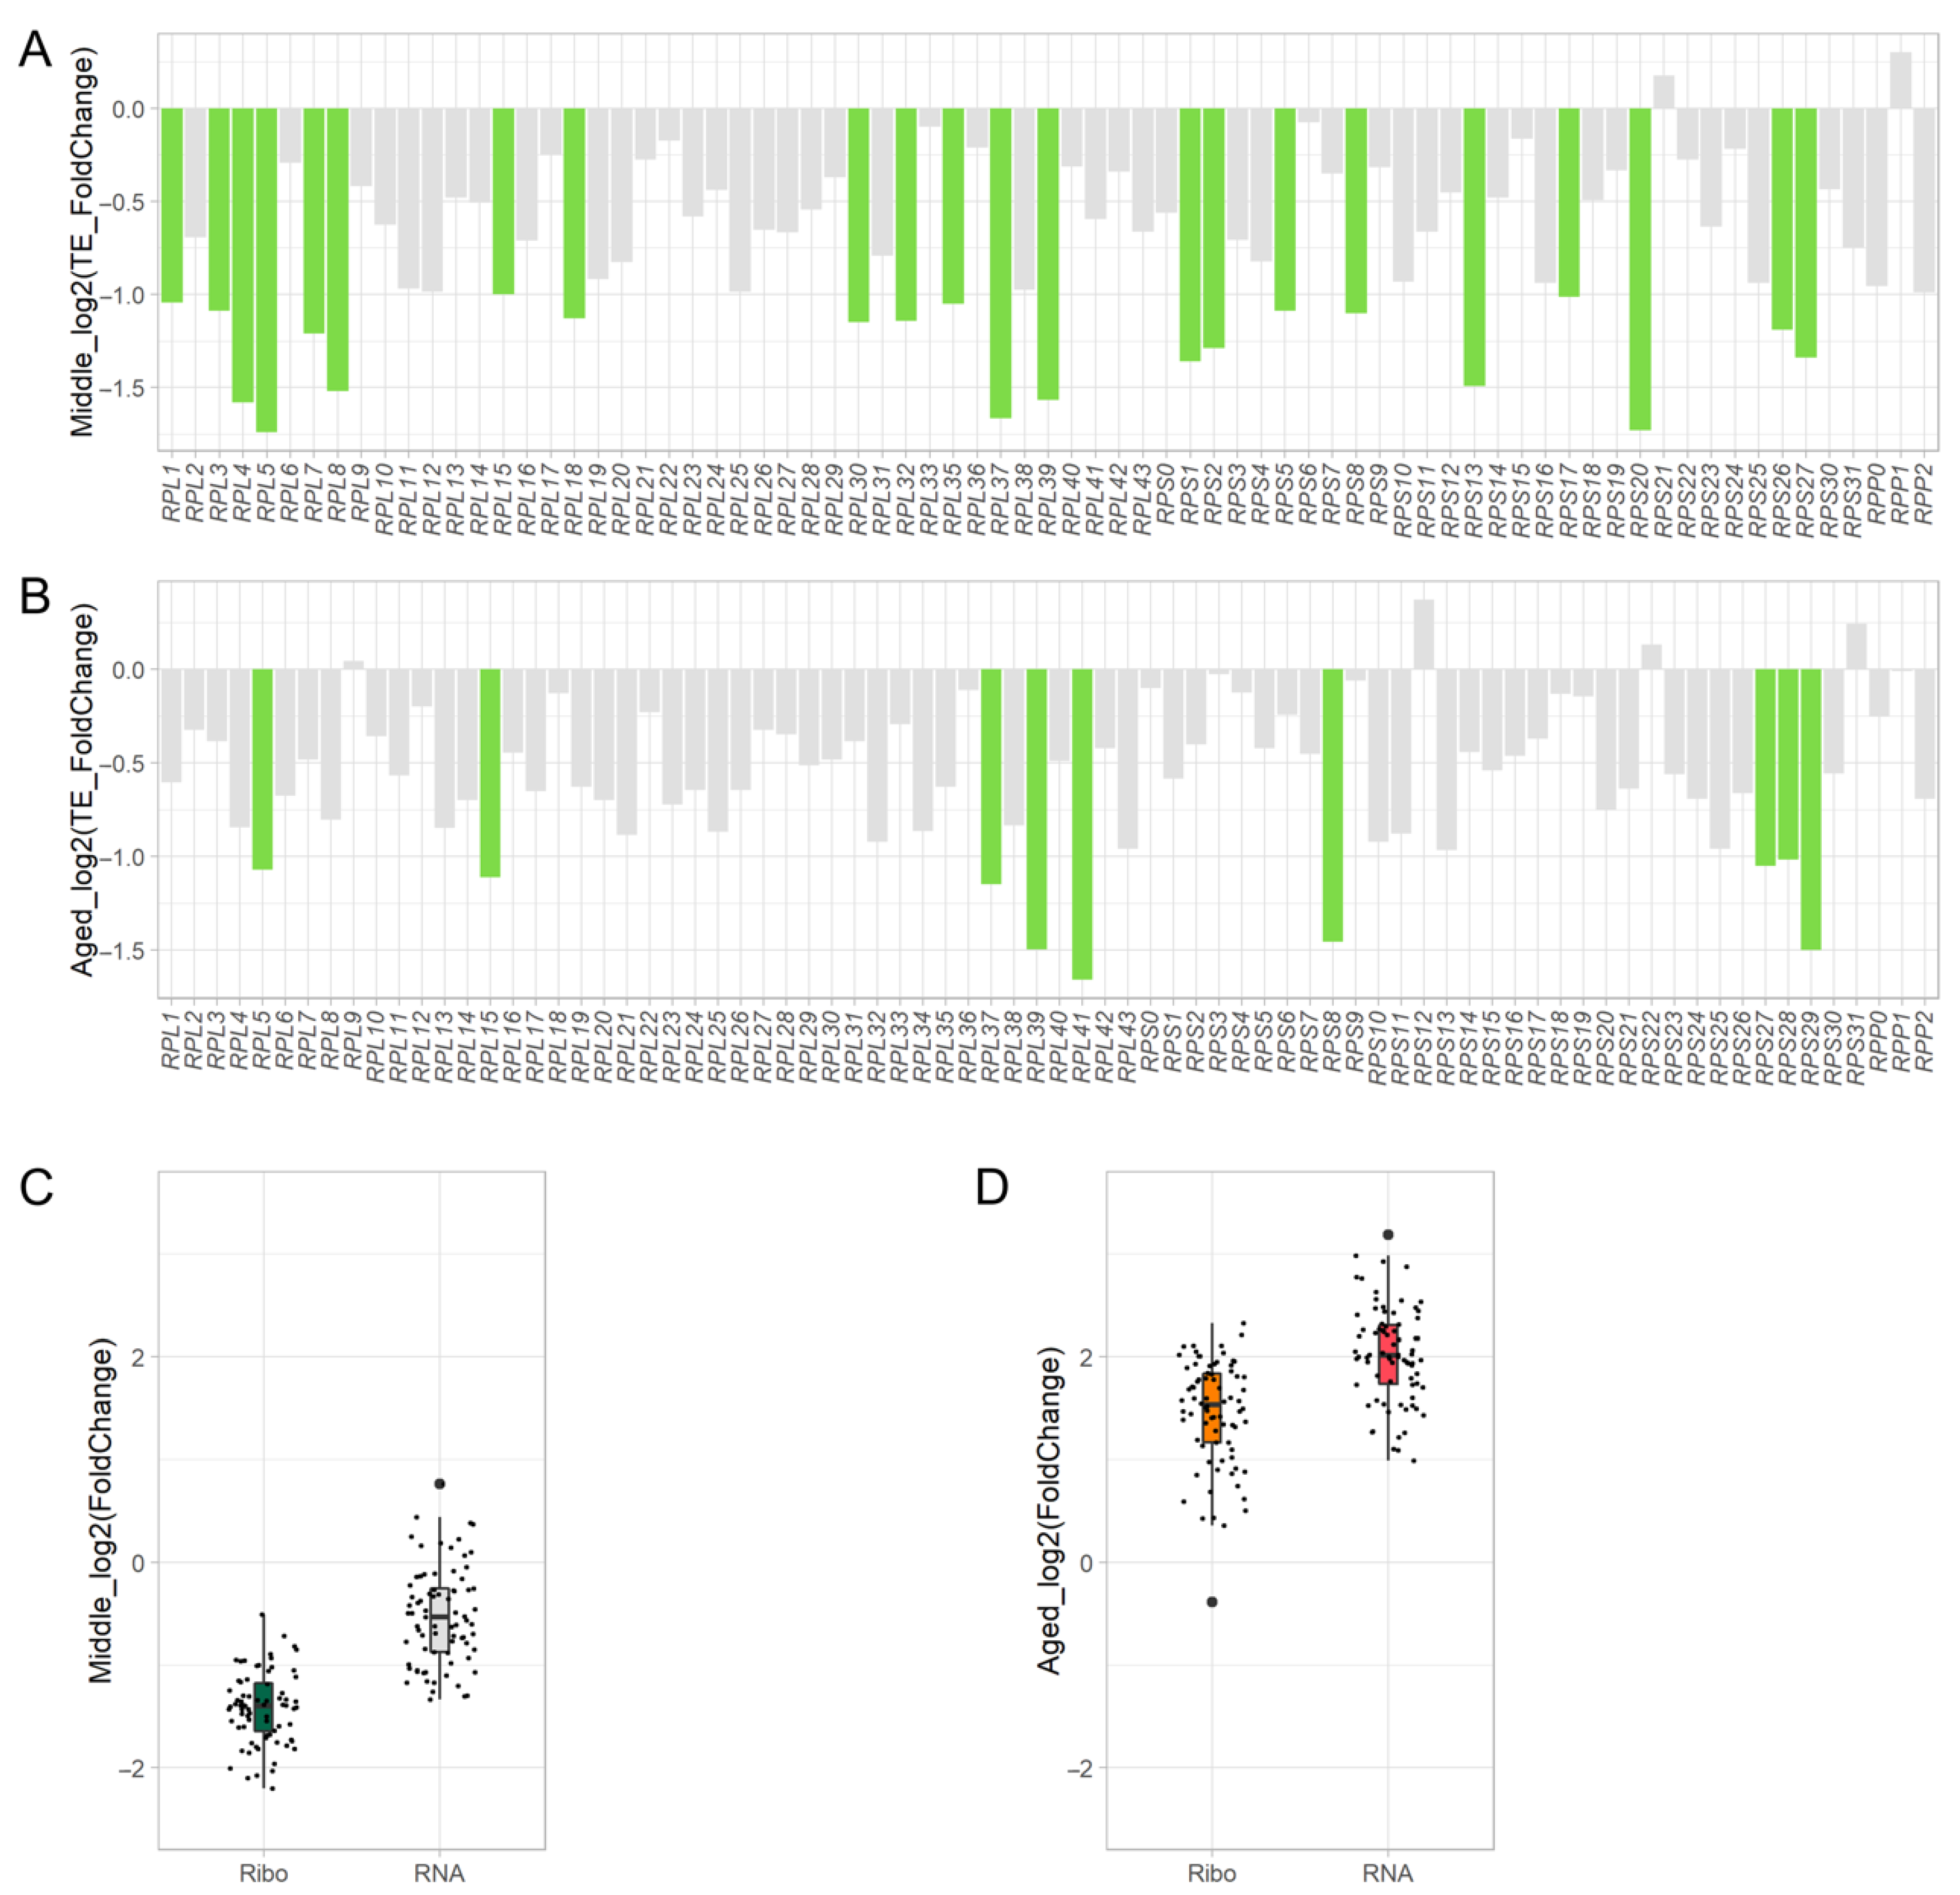
3.5. Translation of Ribosome Components Decreases during Aging
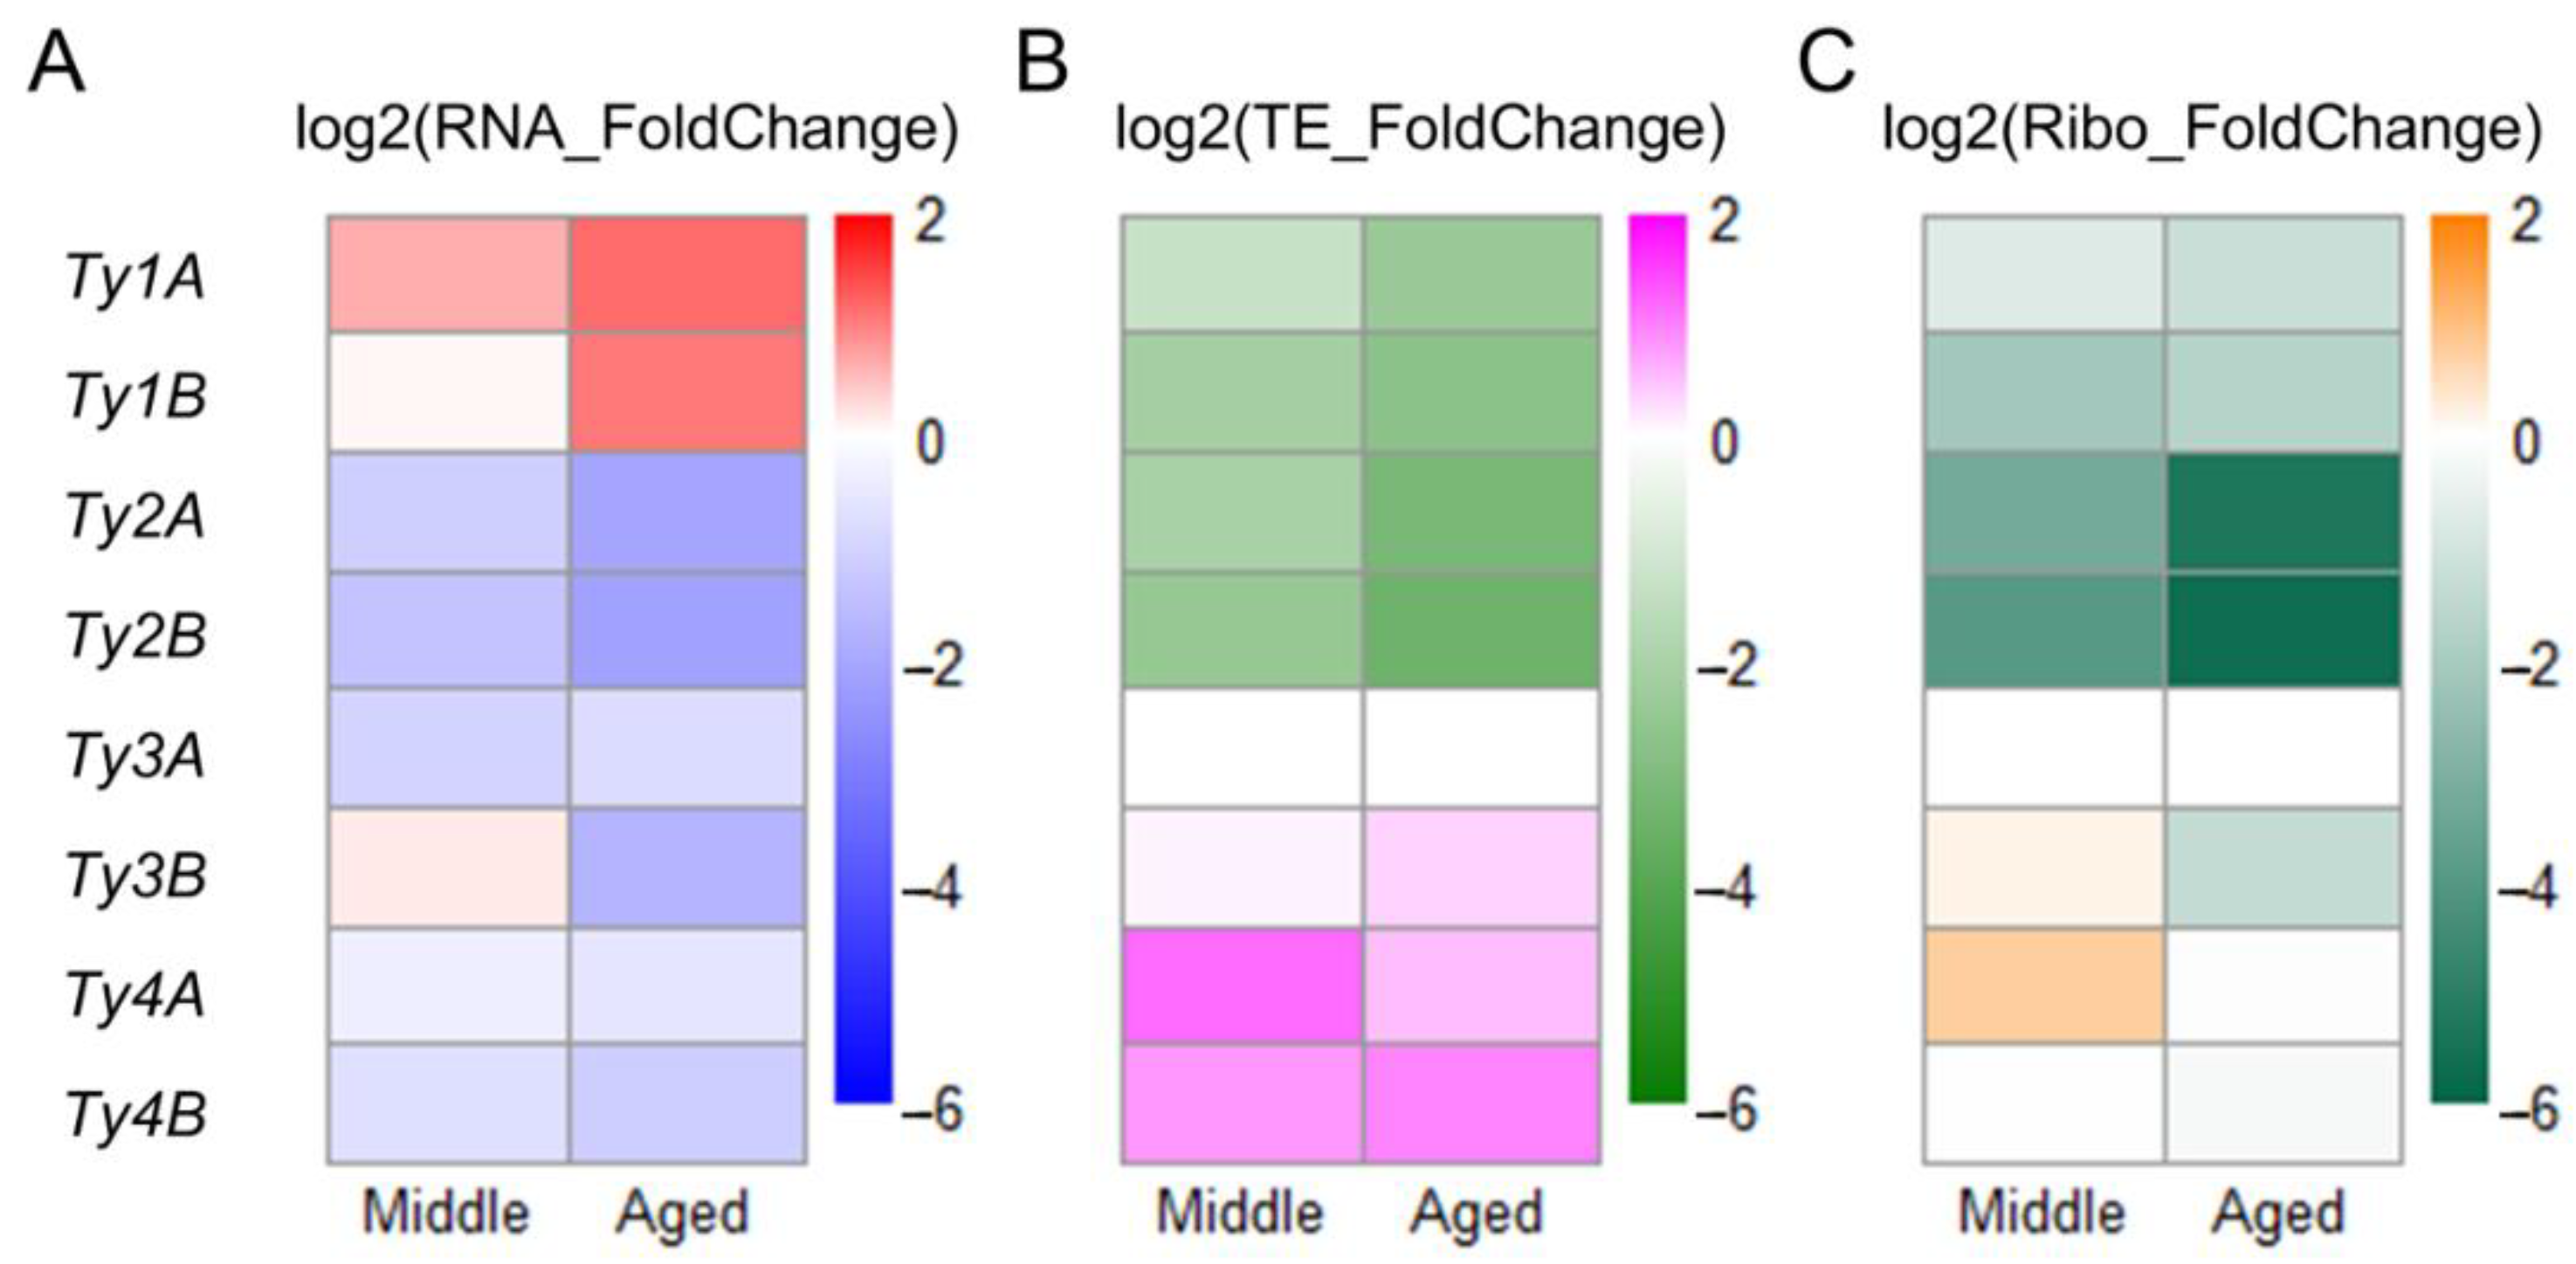
3.6. Translation of Ty1 and Ty2 Transposon Genes Decreases during Aging
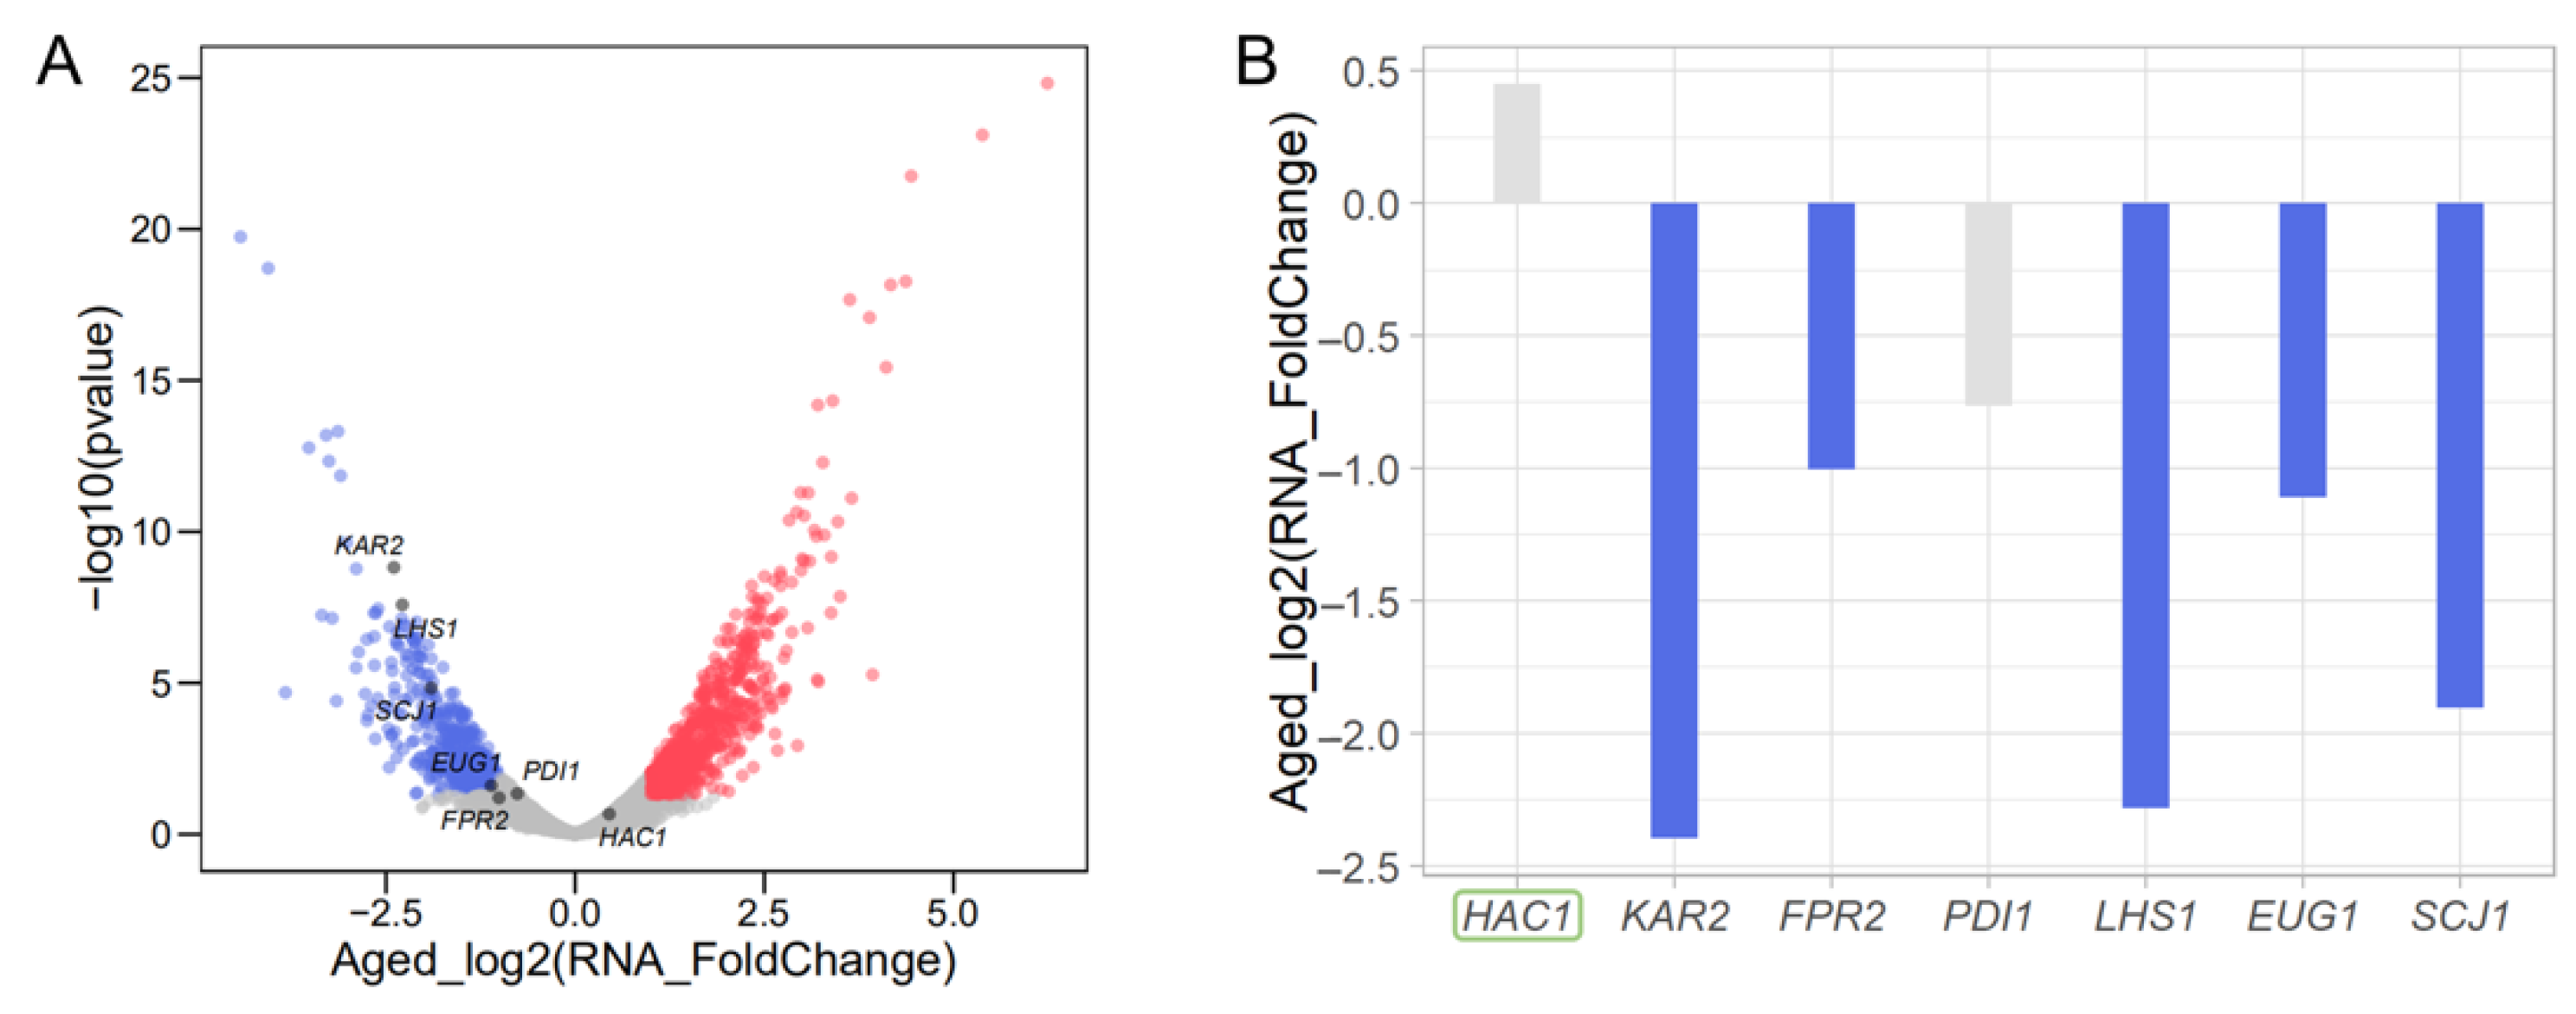
3.7. Translational Reduction of HAC1 Leads to Transcriptional Repression of Genes Involved in Protein Folding
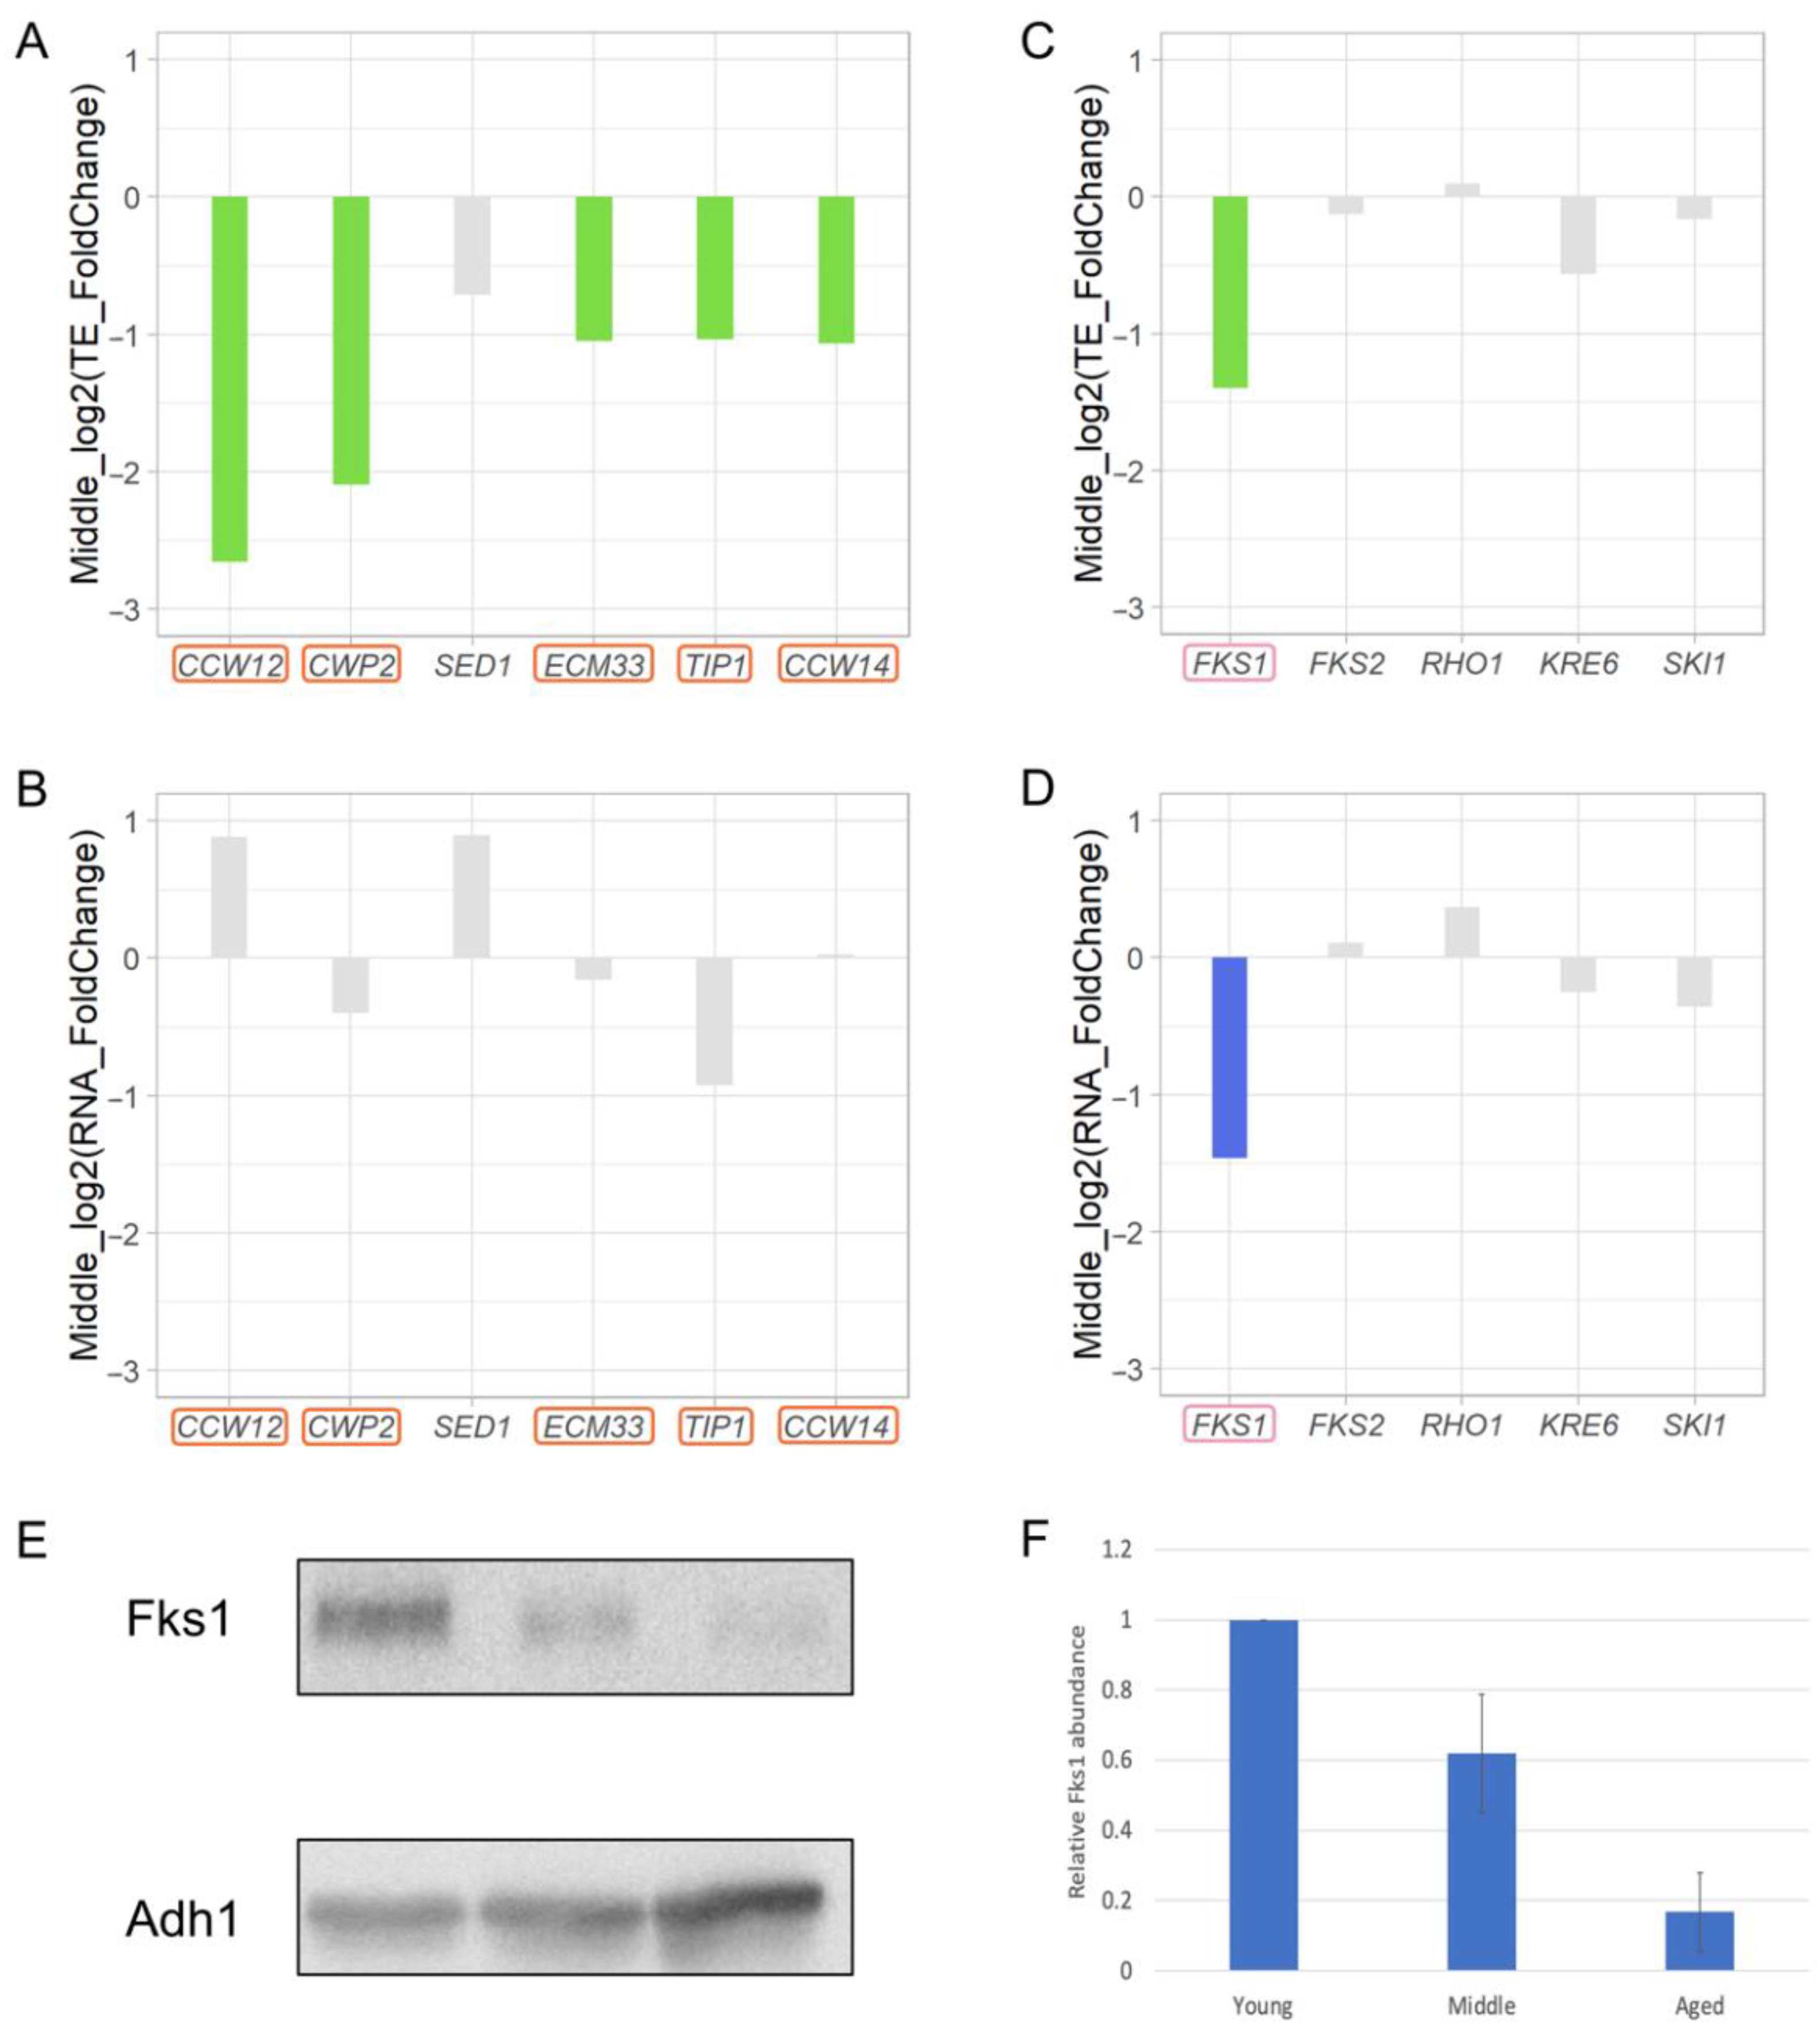
3.8. Decreased Cell Wall Biosynthesis during Replicative Aging
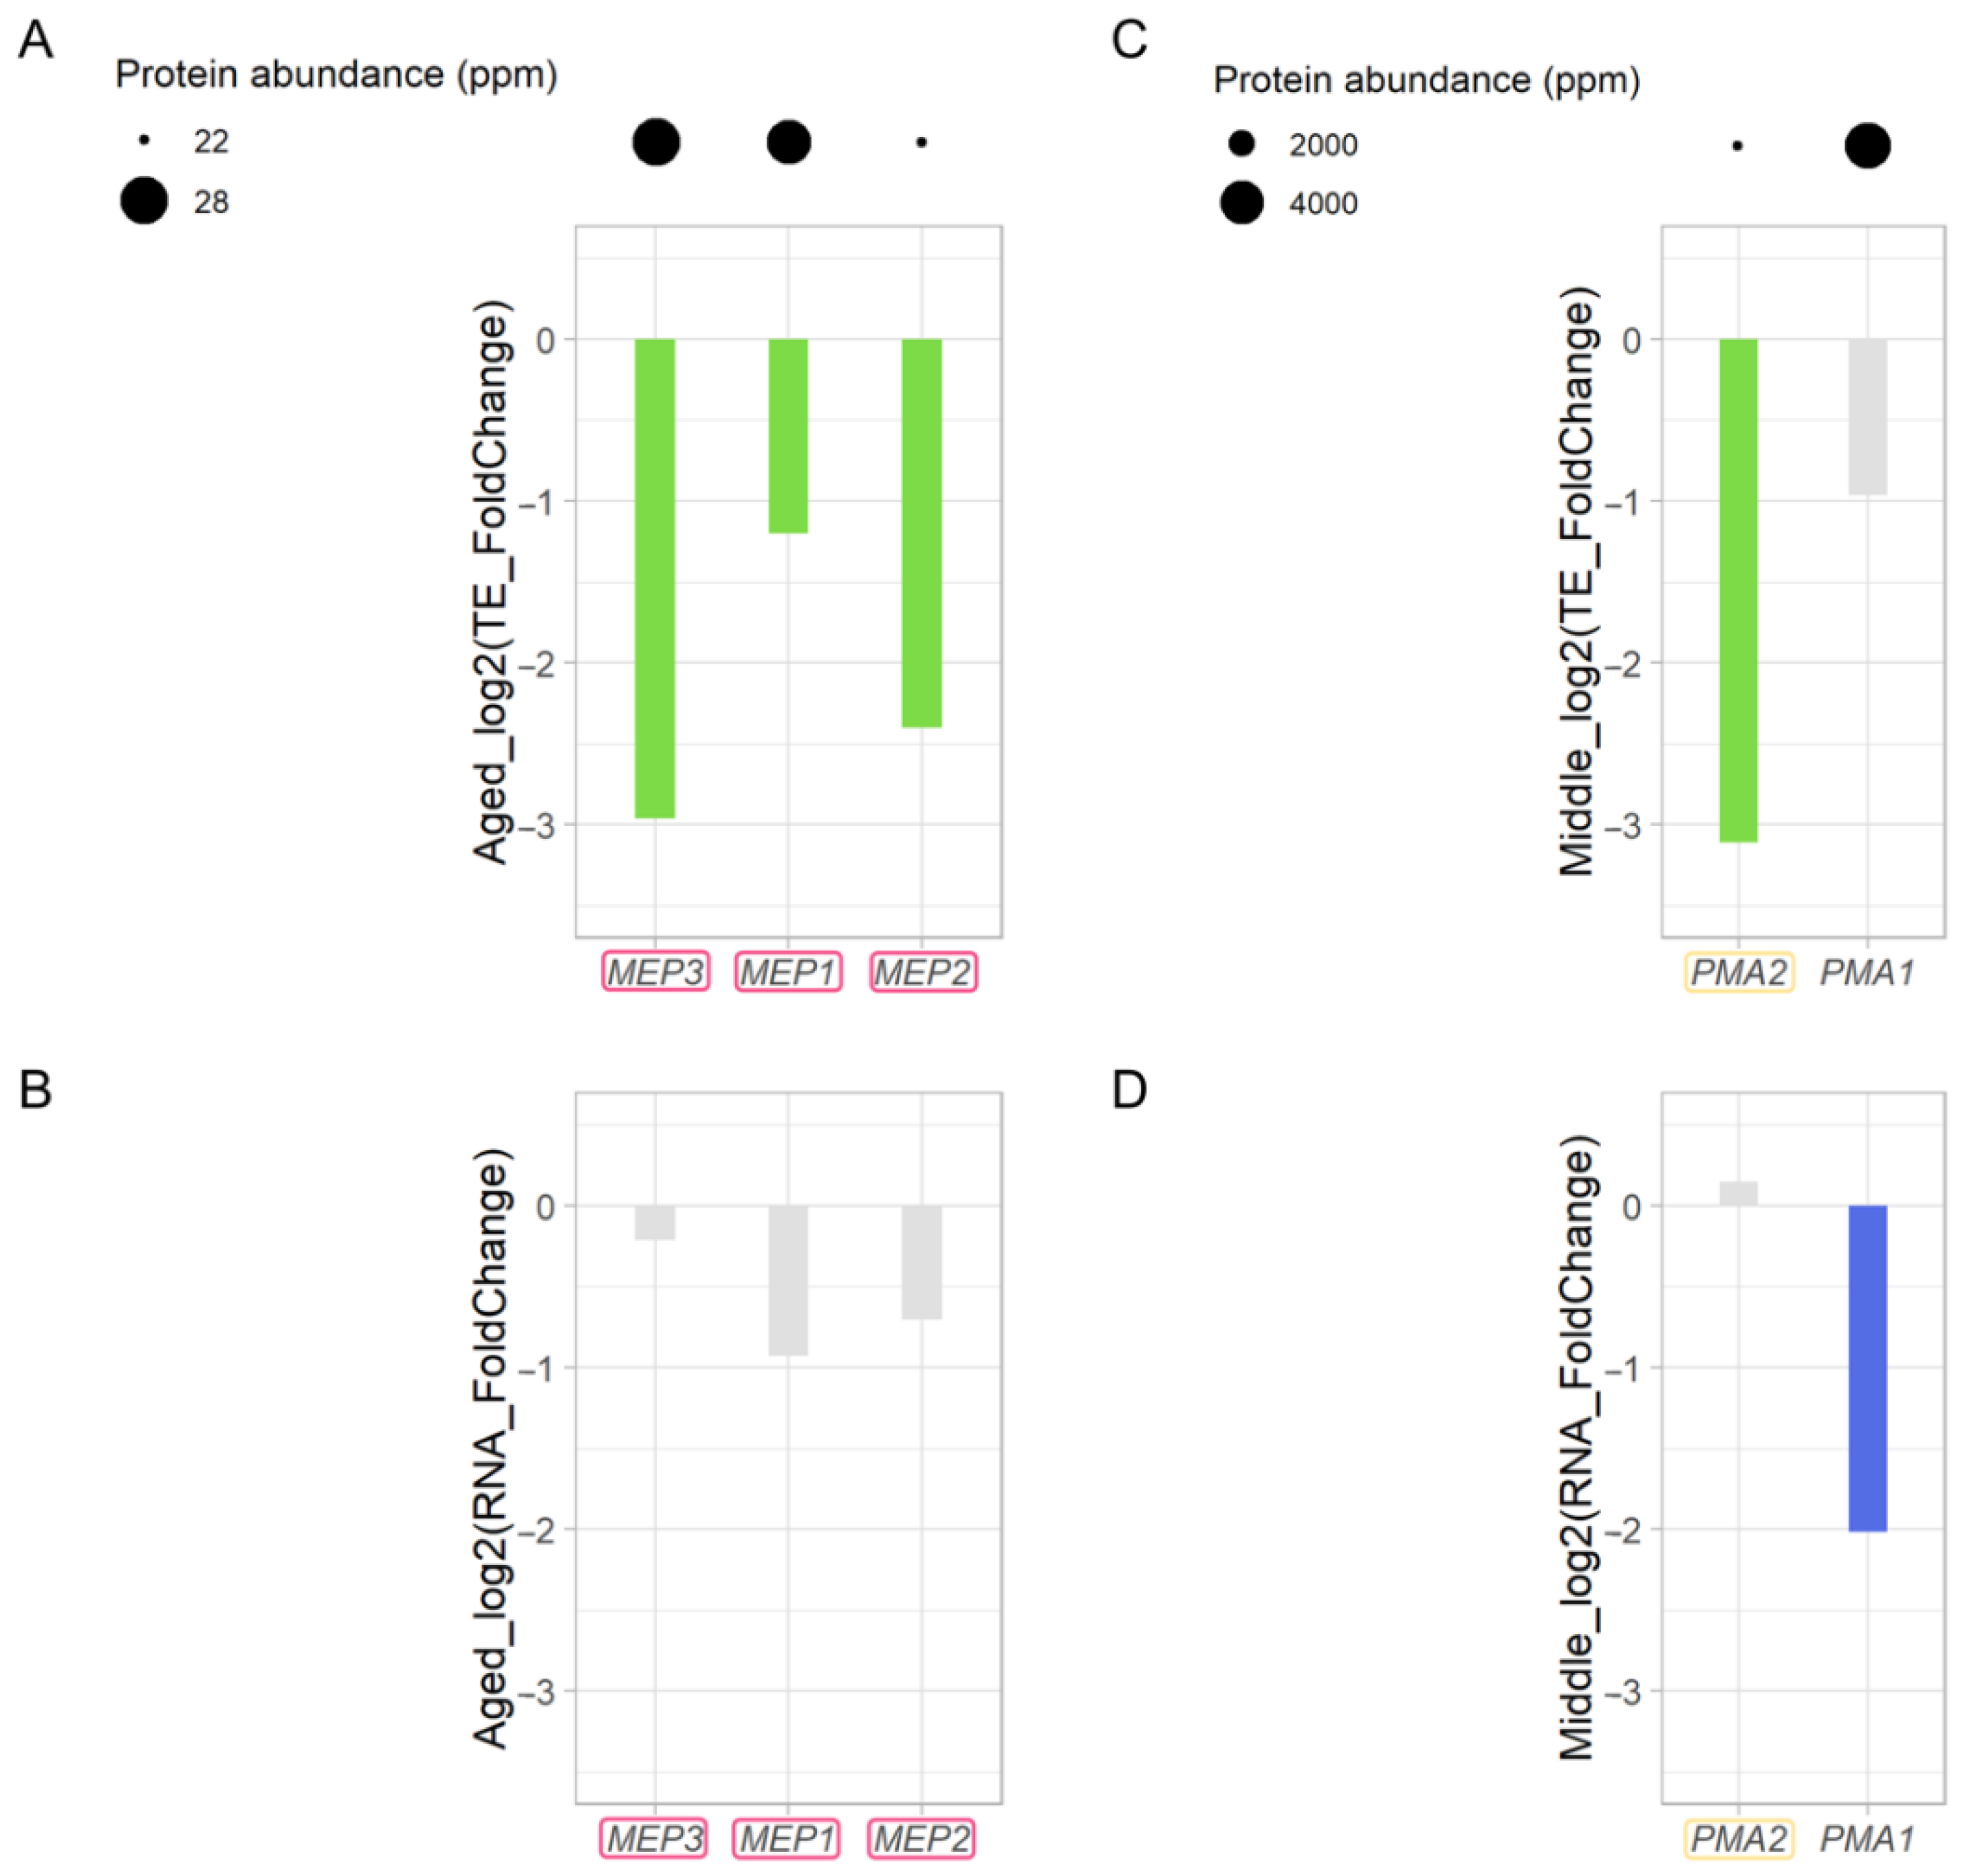
3.9. Decreased Ammonium Permease during Replicative Aging
3.10. Comparison with Other Aging Cells
4. Conclusions
Supplementary Materials
Author Contributions
Funding
Institutional Review Board Statement
Informed Consent Statement
Data Availability Statement
Acknowledgments
Conflicts of Interest
Abbreviations
References
- Klimova, B.; Novotny, M.; Kuca, K. Anti-aging drug—Prospect of longer life? Curr. Med. Chem. 2018, 25, 1946–1953. [Google Scholar] [CrossRef] [PubMed]
- Madeo, F.; Eisenberg, T.; Pietrocola, F.; Kroemer, G. Spermidine in health and disease. Science 2018, 359, eaan2788. [Google Scholar] [CrossRef] [PubMed]
- Steinkraus, K.A.; Kaeberlein, M.; Kennedy, B.K. Replicative aging in yeast: The means to the end. Annu. Rev. Cell Dev. Biol. 2008, 24, 29–54. [Google Scholar] [CrossRef] [PubMed]
- Kapahi, P.; Kaeberlein, M.; Hansen, M. Dietary restriction and lifespan: Lessons from invertebrate models. Ageing Res. Rev. 2017, 39, 3–14. [Google Scholar] [CrossRef]
- McCormick, M.A.; Delaney, J.R.; Tsuchiya, M.; Tsuchiyama, S.; Shemorry, A.; Sim, S.; Chou, A.C.Z.; Ahmed, U.; Carr, D.; Murakami, C.J.; et al. A comprehensive analysis of replicative lifespan in 4698 single-gene deletion strains uncovers conserved mechanisms of aging. Cell Metab. 2015, 22, 895–906. [Google Scholar] [CrossRef]
- Howitz, K.T.; Bitterman, K.J.; Cohen, H.Y.; Lamming, D.W.; Lavu, S.; Wood, J.G.; Zipkin, R.E.; Chung, P.; Kisielewski, A.; Zhang, L.L.; et al. Small molecule activators of sirtuins extend Saccharomyces cerevisiae lifespan. Nature 2003, 425, 191–196. [Google Scholar] [CrossRef]
- Kaeberlein, M. Lessons on longevity from budding yeast. Nature 2010, 464, 513–519. [Google Scholar] [CrossRef]
- McFaline-Figueroa, J.R.; Vevea, J.; Swayne, T.C.; Zhou, C.; Liu, C.; Leung, G.; Boldogh, I.R.; Pon, L.A. Mitochondrial quality control during inheritance is associated with lifespan and mother-daughter age asymmetry in budding yeast. Aging Cell 2011, 10, 885–895. [Google Scholar] [CrossRef]
- Hughes, C.E.; Coody, T.K.; Jeong, M.Y.; Berg, J.A.; Winge, D.R.; Hughes, A.L. Cysteine toxicity drives age-related mitochondrial decline by altering iron homeostasis. Cell 2020, 180, 296–310.e18. [Google Scholar] [CrossRef]
- Hotz, M.; Thayer, N.H.; Hendrickson, D.G.; Schinski, E.L.; Xu, J.; Gottschling, D.E. rDNA array length is a major determinant of replicative lifespan in budding yeast. Proc. Natl. Acad. Sci. USA 2022, 119, 10. [Google Scholar] [CrossRef]
- Lee, M.B.; Dowsett, I.T.; Carr, D.T.; Wasko, B.M.; Stanton, S.G.; Chung, M.S.; Ghodsian, N.; Bode, A.; Kiflezghi, M.G.; Uppal, P.A.; et al. Defining the impact of mutation accumulation on replicative lifespan in yeast using cancer-associated mutator phenotypes. Proc. Natl. Acad. Sci. USA 2019, 116, 3062–3071. [Google Scholar] [CrossRef] [PubMed]
- Amine, A.A.A.; Liao, C.W.; Hsu, P.C.; Opoc, F.J.G.; Leu, J.Y. Experimental evolution improves mitochondrial genome quality control in Saccharomyces cerevisiae and extends its replicative lifespan. Curr. Biol. 2021, 31, 3663–3670.e4. [Google Scholar] [CrossRef] [PubMed]
- Liu, J.; Wang, L.; Wang, Z.; Liu, J.P. Roles of telomere biology in cell senescence, replicative and chronological ageing. Cells 2019, 8, 54. [Google Scholar] [CrossRef]
- Manzano-López, J.; Matellán, L.; Álvarez-Llamas, A.; Blanco-Mira, J.C.; Monje-Casas, F. Asymmetric inheritance of spindle microtubule-organizing centres preserves replicative lifespan. Nat. Cell Biol. 2019, 21, 952–965. [Google Scholar] [CrossRef] [PubMed]
- Leupold, S.; Hubmann, G.; Litsios, A.; Meinema, A.C.; Takhaveev, V.; Papagiannakis, A.; Niebel, B.; Janssens, G.; Siegel, D.; Heinemann, M. Saccharomyces cerevisiae goes through distinct metabolic phases during its replicative lifespan. Elife 2019, 8, e41046. [Google Scholar] [CrossRef] [PubMed]
- Lin, S.J.; Defossez, P.A.; Guarente, L. Requirement of NAD and SIR2 for life-span extension by calorie restriction in Saccharomyces cerevisiae. Science 2000, 289, 2126–2128. [Google Scholar] [CrossRef]
- Mei, S.C.; Brenner, C. Calorie restriction-mediated replicative lifespan extension in yeast is non-cell autonomous. PLoS. Biol. 2015, 13, e1002048. [Google Scholar] [CrossRef]
- Campion, R.; Bloxam, L.; Burrow, K.; Brownridge, P.J.; Pentland, D.R.; Thomas, P.; Gourlay, C.W.; Eyers, C.E.; Barclay, J.W.; Morgan, A. Proteomic analysis of dietary restriction in yeast reveals a role for Hsp26 in replicative lifespan extension. Biochem. J. 2021, 478, 4153–4167. [Google Scholar] [CrossRef]
- Mortimer, R.K.; Johnston, J.R. Life span of individual yeast cells. Nature 1959, 183, 1751–1752. [Google Scholar] [CrossRef]
- Park, P.U.; McVey, M.; Guarente, L. Separation of mother and daughter cells. In Guide To Yeast Genetics and Molecular and Cell Biology, Pt C; Guthrie, C., Fink, G.R., Eds.; Elsevier Academic Press Inc.: San Diego, CA, USA, 2002; Volume 351, pp. 468–477. [Google Scholar]
- Lindstrom, D.L.; Gottschling, D.E. The mother enrichment program: A genetic system for facile replicative life span analysis in Saccharomyces cerevisiae. Genetics 2009, 183, 413–422. [Google Scholar] [CrossRef] [Green Version]
- Janssens, G.E.; Meinema, A.C.; Gonzalez, J.; Wolters, J.C.; Schmidt, A.; Guryev, V.; Bischoff, R.; Wit, E.C.; Veenhoff, L.M.; Heinemann, M. Protein biogenesis machinery is a driver of replicative aging in yeast. Elife 2015, 4, e08527. [Google Scholar] [CrossRef] [PubMed]
- Hendrickson, D.G.; Soifer, I.; Wranik, B.J.; Kim, G.; Robles, M.; Gibney, P.A.; McIsaac, R.S. A new experimental platform facilitates assessment of the transcriptional and chromatin landscapes of aging yeast. Elife 2018, 7, e39911. [Google Scholar] [CrossRef] [PubMed]
- Yu, R.; Jo, M.C.; Dang, W. Measuring the replicative lifespan of Saccharomyces cerevisiae using the HYAA microfluidic platform. Methods Mol. Biol. 2020, 2144, 1–6. [Google Scholar] [PubMed]
- Kamei, Y.; Tamada, Y.; Nakayama, Y.; Fukusaki, E.; Mukai, Y. Changes in transcription and metabolism during the early stage of replicative cellular senescence in budding yeast. J. Biol. Chem. 2014, 289, 32081–32093. [Google Scholar] [CrossRef] [PubMed]
- Dang, W.W.; Steffen, K.K.; Perry, R.; Dorsey, J.A.; Johnson, F.B.; Shilatifard, A.; Kaeberlein, M.; Kennedy, B.K.; Berger, S.L. Histone H4 lysine 16 acetylation regulates cellular lifespan. Nature 2009, 459, 802-U2. [Google Scholar] [CrossRef]
- Lesur, I.; Campbell, J.L. The transcriptome of prematurely aging yeast cells is similar to that of telomerase-deficient cells. Mol. Biol. Cell 2004, 15, 1297–1312. [Google Scholar] [CrossRef]
- Gonskikh, Y.; Polacek, N. Alterations of the translation apparatus during aging and stress response. Mech. Ageing Dev. 2017, 168, 30–36. [Google Scholar] [CrossRef]
- Janssens, G.E.; Veenhoff, L.M. The natural variation in lifespans of single yeast cells is related to variation in cell size, ribosomal protein, and division time. PLoS ONE 2016, 11, e0167394. [Google Scholar]
- Woodward, K.; Shirokikh, N.E. Translational control in cell ageing: An update. Biochem. Soc. Trans. 2021, 49, 2853–2869. [Google Scholar] [CrossRef]
- McGlincy, N.J.; Ingolia, N.T. Transcriptome-wide measurement of translation by ribosome profiling. Methods 2017, 126, 112–129. [Google Scholar] [CrossRef]
- Mito, M.; Mishima, Y.; Iwasaki, S. Protocol for disome profiling to survey ribosome collision in humans and zebrafish. STAR Protoc. 2020, 1, 100168. [Google Scholar] [CrossRef] [PubMed]
- Chen, S.F.; Zhou, Y.Q.; Chen, Y.R.; Gu, J. fastp: An ultra-fast all-in-one FASTQ preprocessor. Bioinformatics 2018, 34, 884–890. [Google Scholar] [CrossRef]
- Dobin, A.; Davis, C.A.; Schlesinger, F.; Drenkow, J.; Zaleski, C.; Jha, S.; Batut, P.; Chaisson, M.; Gingeras, T.R. STAR: Ultrafast universal RNA-seq aligner. Bioinformatics 2012, 29, 15–21. [Google Scholar] [CrossRef] [PubMed]
- Love, M.I.; Huber, W.; Anders, S. Moderated estimation of fold change and dispersion for RNA-seq data with DESeq2. Genome Biol. 2014, 15, 550. [Google Scholar] [CrossRef]
- Consortium, G.O. The gene ontology resource: Enriching a GOld mine. Nucleic Acids Res. 2021, 49, D325–D334. [Google Scholar] [CrossRef] [PubMed]
- Ashburner, M.; Ball, C.A.; Blake, J.A.; Botstein, D.; Butler, H.; Cherry, J.M.; Davis, A.P.; Dolinski, K.; Dwight, S.S.; Eppig, J.T.; et al. Gene ontology: Tool for the unification of biology. The Gene Ontology Consortium. Nat. Genet. 2000, 25, 25–29. [Google Scholar] [CrossRef]
- Boyle, E.I.; Weng, S.; Gollub, J.; Jin, H.; Botstein, D.; Cherry, J.M.; Sherlock, G. GO::TermFinder—open source software for accessing Gene Ontology information and finding significantly enriched Gene Ontology terms associated with a list of genes. Bioinformatics 2004, 20, 3710–3715. [Google Scholar] [CrossRef]
- Katz, Y.; Wang, E.T.; Silterra, J.; Schwartz, S.; Wong, B.; Thorvaldsdóttir, H.; Robinson, J.T.; Mesirov, J.P.; Airoldi, E.M.; Burge, C.B. Quantitative visualization of alternative exon expression from RNA-seq data. Bioinformatics 2015, 31, 2400–2402. [Google Scholar] [CrossRef]
- Thorvaldsdóttir, H.; Robinson, J.T.; Mesirov, J.P. Integrative genomics viewer (IGV): High-performance genomics data visualization and exploration. Brief. Bioinform. 2012, 14, 178–192. [Google Scholar] [CrossRef] [PubMed]
- Katoh, K.; Rozewicki, J.; Yamada, K.D. MAFFT online service: Multiple sequence alignment, interactive sequence choice and visualization. Brief. Bioinform. 2017, 20, 1160–1166. [Google Scholar] [CrossRef]
- Katoh, K.; Standley, D.M. MAFFT multiple sequence alignment software version 7: Improvements in performance and usability. Mol. Biol. Evol. 2013, 30, 772–780. [Google Scholar] [CrossRef] [PubMed] [Green Version]
- Sukegawa, Y.; Negishi, T.; Kikuchi, Y.; Ishii, K.; Imanari, M.; Ghanegolmohammadi, F.; Nogami, S.; Ohya, Y. Genetic dissection of the signaling pathway required for the cell wall integrity checkpoint. J. Cell Sci. 2018, 131, jcs219063. [Google Scholar] [CrossRef] [PubMed]
- Qadota, H.; Python, C.P.; Inoue, S.B.; Arisawa, M.; Anraku, Y.; Zheng, Y.; Watanabe, T.; Levin, D.E.; Ohya, Y. Identification of yeast Rho1p GTPase as a regulatory subunit of 1,3-β-glucan synthase. Science 1996, 272, 279–281. [Google Scholar] [CrossRef] [PubMed]
- Wu, C.C.C.; Zinshteyn, B.; Wehner, K.A.; Green, R. High-resolution ribosome profiling defines discrete ribosome elongation states and translational regulation during cellular stress. Mol. Cell 2019, 73, 959–970.e5. [Google Scholar] [CrossRef]
- Ben-Shem, A.; Loubresse, N.G.D.; Melnikov, S.; Jenner, L.; Yusupova, G.; Yusupov, M. The structure of the eukaryotic ribosome at 3.0 Å resolution. Science 2011, 334, 1524–1529. [Google Scholar] [CrossRef]
- Kim, J.M.; Vanguri, S.; Boeke, J.D.; Gabriel, A.; Voytas, D.F. Transposable elements and genome organization: A comprehensive survey of retrotransposons revealed by the complete Saccharomyces cerevisiae genome sequence. Genome Res. 1998, 8, 464–478. [Google Scholar] [CrossRef]
- Lesage, P.; Todeschini, A.L. Happy together: The life and times of Ty retrotransposons and their hosts. Cytogenet. Genome Res. 2005, 110, 70–90. [Google Scholar] [CrossRef]
- Friant, S.; Heyman, T.; Poch, O.; Wilhelm, M.; Wilhelm, F.X. Sequence comparison of the Ty1 and Ty2 elements of the yeast genome supports the structural model of the tRNA(i)(Met)-Ty1 RNA reverse transcription initiation complex. Yeast 1997, 13, 639–645. [Google Scholar] [CrossRef]
- Patterson, M.N.; Scannapieco, A.E.; Au, P.H.; Dorsey, S.; Royer, C.A.; Maxwell, P.H. Preferential retrotransposition in aging yeast mother cells is correlated with increased genome instability. DNA Repair 2015, 34, 18–27. [Google Scholar] [CrossRef]
- Chatterjee, N.; Walker, G.C. Mechanisms of DNA damage, repair, and mutagenesis. Environ. Mol. Mutagen. 2017, 58, 235–263. [Google Scholar] [CrossRef]
- Mori, K. The unfolded protein response: The dawn of a new field. Proc. Jpn. Acad. Ser. B Phys. Biol. Sci. 2015, 91, 469–480. [Google Scholar] [CrossRef] [PubMed] [Green Version]
- Xia, X. Translation control of HAC1 by regulation of splicing in Saccharomyces cerevisiae. Int. J. Mol. Sci. 2019, 20, 2860. [Google Scholar] [CrossRef] [PubMed]
- Craven, R.A.; Egerton, M.; Stirling, C.J. A novel Hsp70 of the yeast ER lumen is required for the efficient translocation of a number of protein precursors. EMBO J. 1996, 15, 2640–2650. [Google Scholar] [CrossRef]
- Mori, K.; Kawahara, T.; Yoshida, H.; Yanagi, H.; Yura, T. Signalling from endoplasmic reticulum to nucleus: Transcription factor with a basic-leucine zipper motif is required for the unfolded protein-response pathway. Genes Cells 1996, 1, 803–817. [Google Scholar] [CrossRef]
- Takeuchi, M.; Kimata, Y.; Kohno, K. Saccharomyces cerevisiae Rot1 is an essential molecular chaperone in the endoplasmic reticulum. Mol. Biol. Cell 2008, 19, 3514–3525. [Google Scholar] [CrossRef]
- Berner, N.; Reutter, K.R.; Wolf, D.H. Protein quality control of the endoplasmic reticulum and ubiquitin-proteasome-triggered degradation of aberrant proteins: Yeast pioneers the path. In Annual Review of Biochemistry, Vol 87; Kornberg, R.D., Ed.; Annual Reviews; Palo Alto: Santa Clara County, CA, USA, 2018; Volume 87, pp. 751–782. [Google Scholar]
- Labunskyy, V.M.; Gerashchenko, M.V.; Delaney, J.R.; Kaya, A.; Kennedy, B.K.; Kaeberlein, M.; Gladyshev, V.N. Lifespan extension conferred by endoplasmic reticulum secretory pathway deficiency requires induction of the unfolded protein response. PLoS Genet. 2014, 10, e1004019. [Google Scholar] [CrossRef] [PubMed]
- Zhao, W.; Liu, J.X.; Guo, F.; Liu, X.G. Yeast MED2 is involved in the endoplasmic reticulum stress response and modulation of the replicative lifespan. Mech. Ageing Dev. 2020, 192, 111381. [Google Scholar] [CrossRef]
- Orlean, P. Architecture and biosynthesis of the Saccharomyces cerevisiae cell wall. Genetics 2012, 192, 775–818. [Google Scholar] [CrossRef] [PubMed]
- Ho, B.; Baryshnikova, A.; Brown, G.W. Unification of protein abundance datasets yields a quantitative Saccharomyces cerevisiae proteome. Cell Syst. 2018, 6, 192–205.e3. [Google Scholar] [CrossRef]
- Crane, M.M.; Clark, I.B.N.; Bakker, E.; Smith, S.; Swain, P.S. A microfluidic system for studying ageing and dynamic single-cell responses in budding yeast. PLoS ONE 2014, 9, e100042. [Google Scholar]
- Boeckstaens, M.; Andre, B.; Marini, A.M. The yeast ammonium transport protein Mep2 and its positive regulator, the Npr1 kinase, play an important role in normal and pseudohyphal growth on various nitrogen media through retrieval of excreted ammonium. Mol. Microbiol. 2007, 64, 534–546. [Google Scholar] [CrossRef] [PubMed]
- Cueto-Rojas, H.F.; Milne, N.; van Helmond, W.; Pieterse, M.M.; van Maris, A.J.A.; Daran, J.M.; Wahl, S.A. Membrane potential independent transport of NH3 in the absence of ammonium permeases in Saccharomyces cerevisiae. BMC Syst. Biol. 2017, 11, 49. [Google Scholar] [CrossRef] [PubMed] [Green Version]
- Marini, A.M.; SoussiBoudekou, S.; Vissers, S.; Andre, B. A family of ammonium transporters in Saccharomyces cerevisiae. Mol. Cell. Biol. 1997, 17, 4282–4293. [Google Scholar] [CrossRef] [PubMed]
- Supply, P.; Wach, A.; Goffeau, A. Enzymatic properties of the PMA2 plasma membrane-bound H+-ATPase of Saccharomyces cerevisiae. J. Biol. Chem. 1993, 268, 19753–19759. [Google Scholar] [CrossRef]
- Niu, R.X.; Zhou, Y.L.; Zhang, Y.; Mou, R.; Tang, Z.J.; Wang, Z.; Zhou, G.L.; Guo, S.B.; Yuan, M.; Xu, G.Y. uORFlight: A vehicle toward uORF-mediated translational regulation mechanisms in eukaryotes. Database 2020, 2020, baaa007. [Google Scholar] [CrossRef]
- Gaba, A.; Wang, Z.; Krishnamoorthy, T.; Hinnebusch, A.G.; Sachs, M.S. Physical evidence for distinct mechanisms of translational control by upstream open reading frames. EMBO J. 2001, 20, 6453–6463. [Google Scholar] [CrossRef]
- Stein, K.C.; Morales-Polanco, F.; van der Lienden, J.; Rainbolt, T.K.; Frydman, J. Ageing exacerbates ribosome pausing to disrupt cotranslational proteostasis. Nature 2022, 601, 637–642. [Google Scholar] [CrossRef]
- Anisimova, A.S.; Meerson, M.B.; Gerashchenko, M.V.; Kulakovskiy, I.V.; Dmitriev, S.E.; Gladyshev, V.N. Multifaceted deregulation of gene expression and protein synthesis with age. Proc. Natl. Acad. Sci. USA 2020, 117, 15581–15590. [Google Scholar] [CrossRef]
- Hu, Z.; Xia, B.; Postnikoff, S.D.L.; Shen, Z.-J.; Tomoiaga, A.S.; Harkness, T.A.; Seol, J.H.; Li, W.; Chen, K.; Tyler, J.K. Ssd1 and Gcn2 suppress global translation efficiency in replicatively aged yeast while their activation extends lifespan. eLife 2018, 7, e35551. [Google Scholar] [CrossRef]


Publisher’s Note: MDPI stays neutral with regard to jurisdictional claims in published maps and institutional affiliations. |
© 2022 by the authors. Licensee MDPI, Basel, Switzerland. This article is an open access article distributed under the terms and conditions of the Creative Commons Attribution (CC BY) license (https://creativecommons.org/licenses/by/4.0/).
Share and Cite
Zhao, T.; Chida, A.; Shichino, Y.; Choi, D.; Mizunuma, M.; Iwasaki, S.; Ohya, Y. Multifarious Translational Regulation during Replicative Aging in Yeast. J. Fungi 2022, 8, 938. https://doi.org/10.3390/jof8090938
Zhao T, Chida A, Shichino Y, Choi D, Mizunuma M, Iwasaki S, Ohya Y. Multifarious Translational Regulation during Replicative Aging in Yeast. Journal of Fungi. 2022; 8(9):938. https://doi.org/10.3390/jof8090938
Chicago/Turabian StyleZhao, Tianyu, Asaka Chida, Yuichi Shichino, Dongwoo Choi, Masaki Mizunuma, Shintaro Iwasaki, and Yoshikazu Ohya. 2022. "Multifarious Translational Regulation during Replicative Aging in Yeast" Journal of Fungi 8, no. 9: 938. https://doi.org/10.3390/jof8090938