Article

Polyketide Derivatives from the Endophytic Fungus Phaeosphaeria sp. LF5 Isolated from Huperzia serrata and Their Acetylcholinesterase Inhibitory Activities

1
Key Laboratory of Protection and Utilization of Subtropic Plant Resources of Jiangxi Province, College of Life Sciences, Jiangxi Normal University, Nanchang 330022, China
2
Key Laboratory of Bioprocess Engineering of Jiangxi Province, College of Life Sciences, Jiangxi Science and Technology Normal University, Nanchang 330013, China
3
College of Chemistry and Biological Engineering, Yichun University, Yichun 336000, China
*
Author to whom correspondence should be addressed.
These authors contributed equally to this work.
J. Fungi 2022, 8(3), 232; https://doi.org/10.3390/jof8030232
Submission received: 3 February 2022 / Revised: 21 February 2022 / Accepted: 24 February 2022 / Published: 26 February 2022

Abstract

:
The secondary metabolites of Phaeosphaeria sp. LF5, an endophytic fungus with acetylcholinesterase (AChE) inhibitory activity isolated from Huperzia serrata, were investigated. Their structures and absolute configurations were elucidated by means of extensive spectroscopic data, including one- and two-dimensional nuclear magnetic resonance (NMR), high-resolution electrospray ionization mass spectrometry (HR-ESI-MS) analyses, and calculations of electronic circular dichroism (ECD). A chemical study on the solid-cultured fungus LF5 resulted in 11 polyketide derivatives, which included three previously undescribed derivatives: aspilactonol I (4), 2-(1-hydroxyethyl)-6-methylisonicotinic acid (7), and 6,8-dihydroxy-3-(1′R, 2′R-dihydroxypropyl)-isocoumarin (9), and two new natural-source-derived aspilactonols (G, H) (2, 3). Moreover, the absolute configuration of de-O-methyldiaporthin (11) was identified for the first time. Compounds 4 and 11 exhibited inhibitory activity against AChE with half maximal inhibitory concentration (IC50) values of 6.26 and 21.18 µM, respectively. Aspilactonol I (4) is the first reported furanone AChE inhibitor (AChEI). The results indicated that Phaeosphaeria is a good source of polyketide derivatives. This study identified intriguing lead compounds for further research and development of new AChEIs.

1. Introduction

Natural products are important sources of active compounds and play important roles in modern drug research and development. Fungi are considered an important group of microorganisms in the production of antitumor, immunosuppressant, antibiotic, antifungal, antiparasitic, anti-inflammatory, enzyme-inhibiting, and other active secondary metabolites [1,2]. Endophytic fungi reside in the internal tissues of living plants without causing apparent disease. Due to their unique ecological niche, endophytic fungi have become important sources of natural products to be screened for with unique chemical structures and biological activity [3,4]. Therefore, the natural product screening of endophytic fungi is currently a hot research topic [5,6,7,8,9]. In this sense, it is worth undertaking a constant search for novel compounds from endophytic fungal sources and paying attention to discovering potential drug candidates.
Huperzia serrata is a member of the Lycophyllaceae family called shezucao in China [10]. Huperzine A (HupA) was first isolated from H. serrata in the 1980s and was approved in the 1990s in China as an acetylcholinesterase inhibitor (AChEI) to treat Alzheimer’s disease (AD). These promising studies showed that endophytic fungi of H. serrata can synthesize HupA and similar compounds in host plants and also contains many novel compounds [10]. Thus far, many studies have been conducted on the diversity of endophytic fungi of H. serrata, but there are few studies on the isolation and screening of AChEIs in these endophytic fungi, and therefore further studies are needed. In our previous study, a total of 22 endophytic fungal strains showed strong AChE inhibitory activity (≥50%) [11]. As part of our ongoing research, we are currently characterizing the bioactive secondary metabolites of these endophytic fungi.
Phaeosphaeria sp. LF5 is an endophytic fungus isolated from the leaves of H. serrata [12]. Members of Phaeosphaeria have afforded a variety of natural products, such as polyketides, peptides, and terpenes [13,14]. Herein, Phaeosphaeria sp. LF5 was selected for screening for new AChEI natural products. We refermented the strain in solid substrate fermentation medium and then isolated 11 polyketide derivatives, which included three new compounds, aspilactonol I (4), 2-(1-hydroxyethyl)-6-methylisonicotinic acid (7), and 6,8-dihydroxy-3-(1′R, 2′R-dihydroxypropyl)-isocoumarin (9), and two new natural source-derived aspilactonols (G, H) (2, 3). We also identified the absolute configuration of de-O-methyldiaporthin (11) for the first time (Figure 1). In addition, we detected their AChE inhibitory activity. Herein, the isolation, structural elucidation, and bioactivities of these isolated compounds are described.
Generally, furanone derivatives are polyketide metabolites found in Aspergillus [15,16]. They are classified into three structural types: linear (aspinonene), δ-lactones (aspinrone), and γ-lactones (isoaspinonene and aspilactonols) [17]. To date, it has been a challenging task to assign the absolute configurations of furanone derivatives due to the flexibility of their aliphatic sidechain in the partial polyketide unit [18,19]. Isocoumarins comprise a six-membered oxygen heterocycle (α-pyranone) with one benzene ring. Isocoumarins represent a group of natural compounds rich in lactones, which are mainly derived from the fungal polyketone pathway. These compounds have exhibited a wide range of biological functions, including antifungal, anti-inflammatory, insecticidal, and hepatoprotective activities [20]. However, the determination of their absolute configuration becomes quite challenging due to the high degree of free rotation of the steric centers on the chain, with the side chains connected to the nuclei of isocoumarin derivatives [21]. In the present study, the structures and absolute configurations of polyketide derivatives isolated from Phaeosphaeria sp. LF5 were elucidated by means of extensive spectroscopic data, including one- and two-dimensional nuclear magnetic resonance (NMR) spectrometry, high-resolution electrospray ionization mass spectrometry (HR-ESI-MS) analyses, and calculations of electronic circular dichroism (ECD).

2. Materials and Methods

2.1. General Experimental Procedures

Optical rotation values were determined on a JASCO P-1010 polarimeter (Jasco, Tokyo, Japan). UV spectra were recorded on a PerkinElmer Lambda 365 UV-Vis spectrophotometer (PerkinElmer, Hopkinton, MA, USA). High-resolution electrospray ionization mass spectrometry (HR-ESI-MS) data were measured on a Waters ACQUITY UPLC H-Class Q-TOF LC-MS spectrometer (Waters, Milford, MA, USA). High-performance liquid chromatography (HPLC) analysis was carried out on an ACQUITY UPLC H-Class System (quaternary solvent manager, sample manager, PDA detector, and ELS detector) using a YMC ODS (4.6 × 250 mm, 5 µm, 1 mL/min) column. MPLC was performed on a PuriFlash450 (Interchim, Los Angeles, CA, USA) with a Flash C18 cartridge (50 µm, 40 g, YMC, Kyoto, Japan). Semipreparative HPLC was performed on a Waters 2535 Quaternary gradient module with a FlexInject, 2489 UV–VIS detector and Fraction Collector Ⅲ (Waters, Milford, MA, USA). The NMR spectra were recorded on a Bruker Avance 400 MHz spectrometer using tetramethylsilane as the internal standard (Bruker, Ettlingen, Germany). Thin-layer chromatography (TLC) analyses were performed on glass precoated with silica gel GF254 glass plates. All reagents for the analysis were purchased from Xilong Scientific Co., Ltd. (Guangdong, China).

2.2. Fungal Material

The endophytic fungus Phaeosphaeria sp. LF5 was isolated from the leaves of H. serrata at the Chinese Academy of Sciences’ Lushan Botanical Garden in Jiangxi Province, China [12]. This strain was deposited in the culture collection of the Key Laboratory of Protection and Utilization of Subtropical Plant Resources of Jiangxi Province, Jiangxi Normal University.

2.3. Fermentation and Extraction

The endophytic fungus LF5 was cultivated in 100 Erlenmeyer flasks (1000 mL); each flask contained 80 g of rice and 120 g of H2O to create solid rice medium. The flasks were then static incubated at 28 °C for 40 days.
After the mycelia entered the static growth state, the rice solid fermentation was taken out of the Erlenmeyer flask, dried at 45 °C to remove the water, crushed before adding 80% ethanol, and ultrasonically agitated for 1 h. The static precipitation was filtered, and the above steps were repeated four times to obtain an ethanol extract. The filtrate was removed with a rotary evaporator (35 °C, 160 rpm). The ethanol crude extract was placed in 2000 mL of water and transferred to a separatory funnel. In turn, petroleum ether (PE), ethyl acetate (EA), and water-saturated butanol were used for extraction four times and were concentrated in vacuo to yield the combined crude extracts, PE extract (16.2 g), EA extract (76 g), n-butanol extract (105 g), and water extract (450 g).

2.4. Isolation and Purification

The EA extract (76.0 g) was dried and subjected to column chromatography on 200–300 mesh silica gel with different solvents of increasing polarity from PE to EA to MeOH to obtain eight fractions (Frs. 1–8) on the basis of TLC analysis.
Fraction 6 was purified by Sephadex LH-20 (GE Healthcare, Pittsburgh, PA, USA) (MeOH) to obtain three subfractions: Fr. 6.1–Fr. 6.3. Fraction 6.1 was further purified by semipreparative HPLC (CH3OH/H2O, 30:70, v/v) to yield 1 (12 mg, tR = 4.0 min), 2 (9.5 mg, tR = 2.9 min), and 3 (7 mg, tR = 7.0 min). Fraction 8 was loaded onto a Sephadex LH-20 column and eluted with EA/CH3OH (8:2) to yield two subfractions: Fr. 8.1 and Fr. 8.2. Subfraction Fr. 8.2 was separated by semi-preparative RP-HPLC (CH3OH/H2O, 10:90) to generate 4 (6.8 mg, tR = 11.0 min) and 5 (4.0 mg, tR = 8.0 min). Fraction 3 was separated by Sephadex LH-20 using CH3OH as the eluting solvent and was then further purified via semipreparative HPLC CH3OH/H2O (30:70, v/v) to obtain compound 6 (2.9 mg, tR = 6.0 min). Fraction 7 was further purified using Sephadex LH-20 (EA/CH3OH, 90:10, v/v) to yield two subfractions: Frs. 7.1 and 7.2. Subfraction Fr. 7.1 was separated by semipreparative reversed-phase HPLC (RP-HPLC) (CH3OH-H2O, 5:95) to produce 7 (4.5 mg, tR = 4.5 min). Fraction 2 (PE/EA 7:3) was separated into three subfractions (Fr. 2.1–2.3) with Sephadex LH-20 using MeOH as a mobile phase. Subfraction Fr. 2.1 was further purified via semipreparative HPLC using CH3OH:H2O (30:70) as a mobile phase at a flow rate of 5 mL/min to yield 8 (10 mg, tR = 36.0 min). Subfraction Fr. 6.3 was separated by preparative HPLC (CH3OH/H2O, 30:70, v/v) to yield compounds 9 (8 mg, tR = 17 min), 10 (5 mg, tR = 30.0 min), and 11 (4 mg, tR = 45.0 min).

2.5. Acetylcholinesterase Inhibitory Activity In Vitro Assay

The determination of the in vitro AChE inhibitory activity of the endophytic fungal extracts and compounds 111 was performed according to the spectrophotometry method developed by Ellman et al. [22] and modified by Ortiz et al. [23]. Rivastigmine and HupA, two known AChEIs, were used as positive controls. The assay was carried out in a 96-well microtiter plate reader. In brief, a preincubation solution of 250 μL of phosphate buffer (200 mM, pH 7.7) that contained 15 μL of purified compounds/HupA, 80 μL of DTNB (3.96 mg of DTNB and 1.5 mg of sodium bicarbonate dissolved in 10 mL of phosphate buffer, pH 7.7), and 10 μL of AChE was prepared. The mixture was incubated for 5 min at 25 °C. After preincubation, 15 μL of the substrate AChI (10.85 mg in 5 mL of phosphate buffer) was added and incubated again for 5 min. The color developed was measured in a microwell plate reader at 412 nm (Molecular Devices, SpectraMax M2, San Jose, CA, USA). Percent inhibition was calculated through the following formula: (control absorbance–sample absorbance)/control absorbance × 100. The IC50 values were the means ± SD of three determinations.

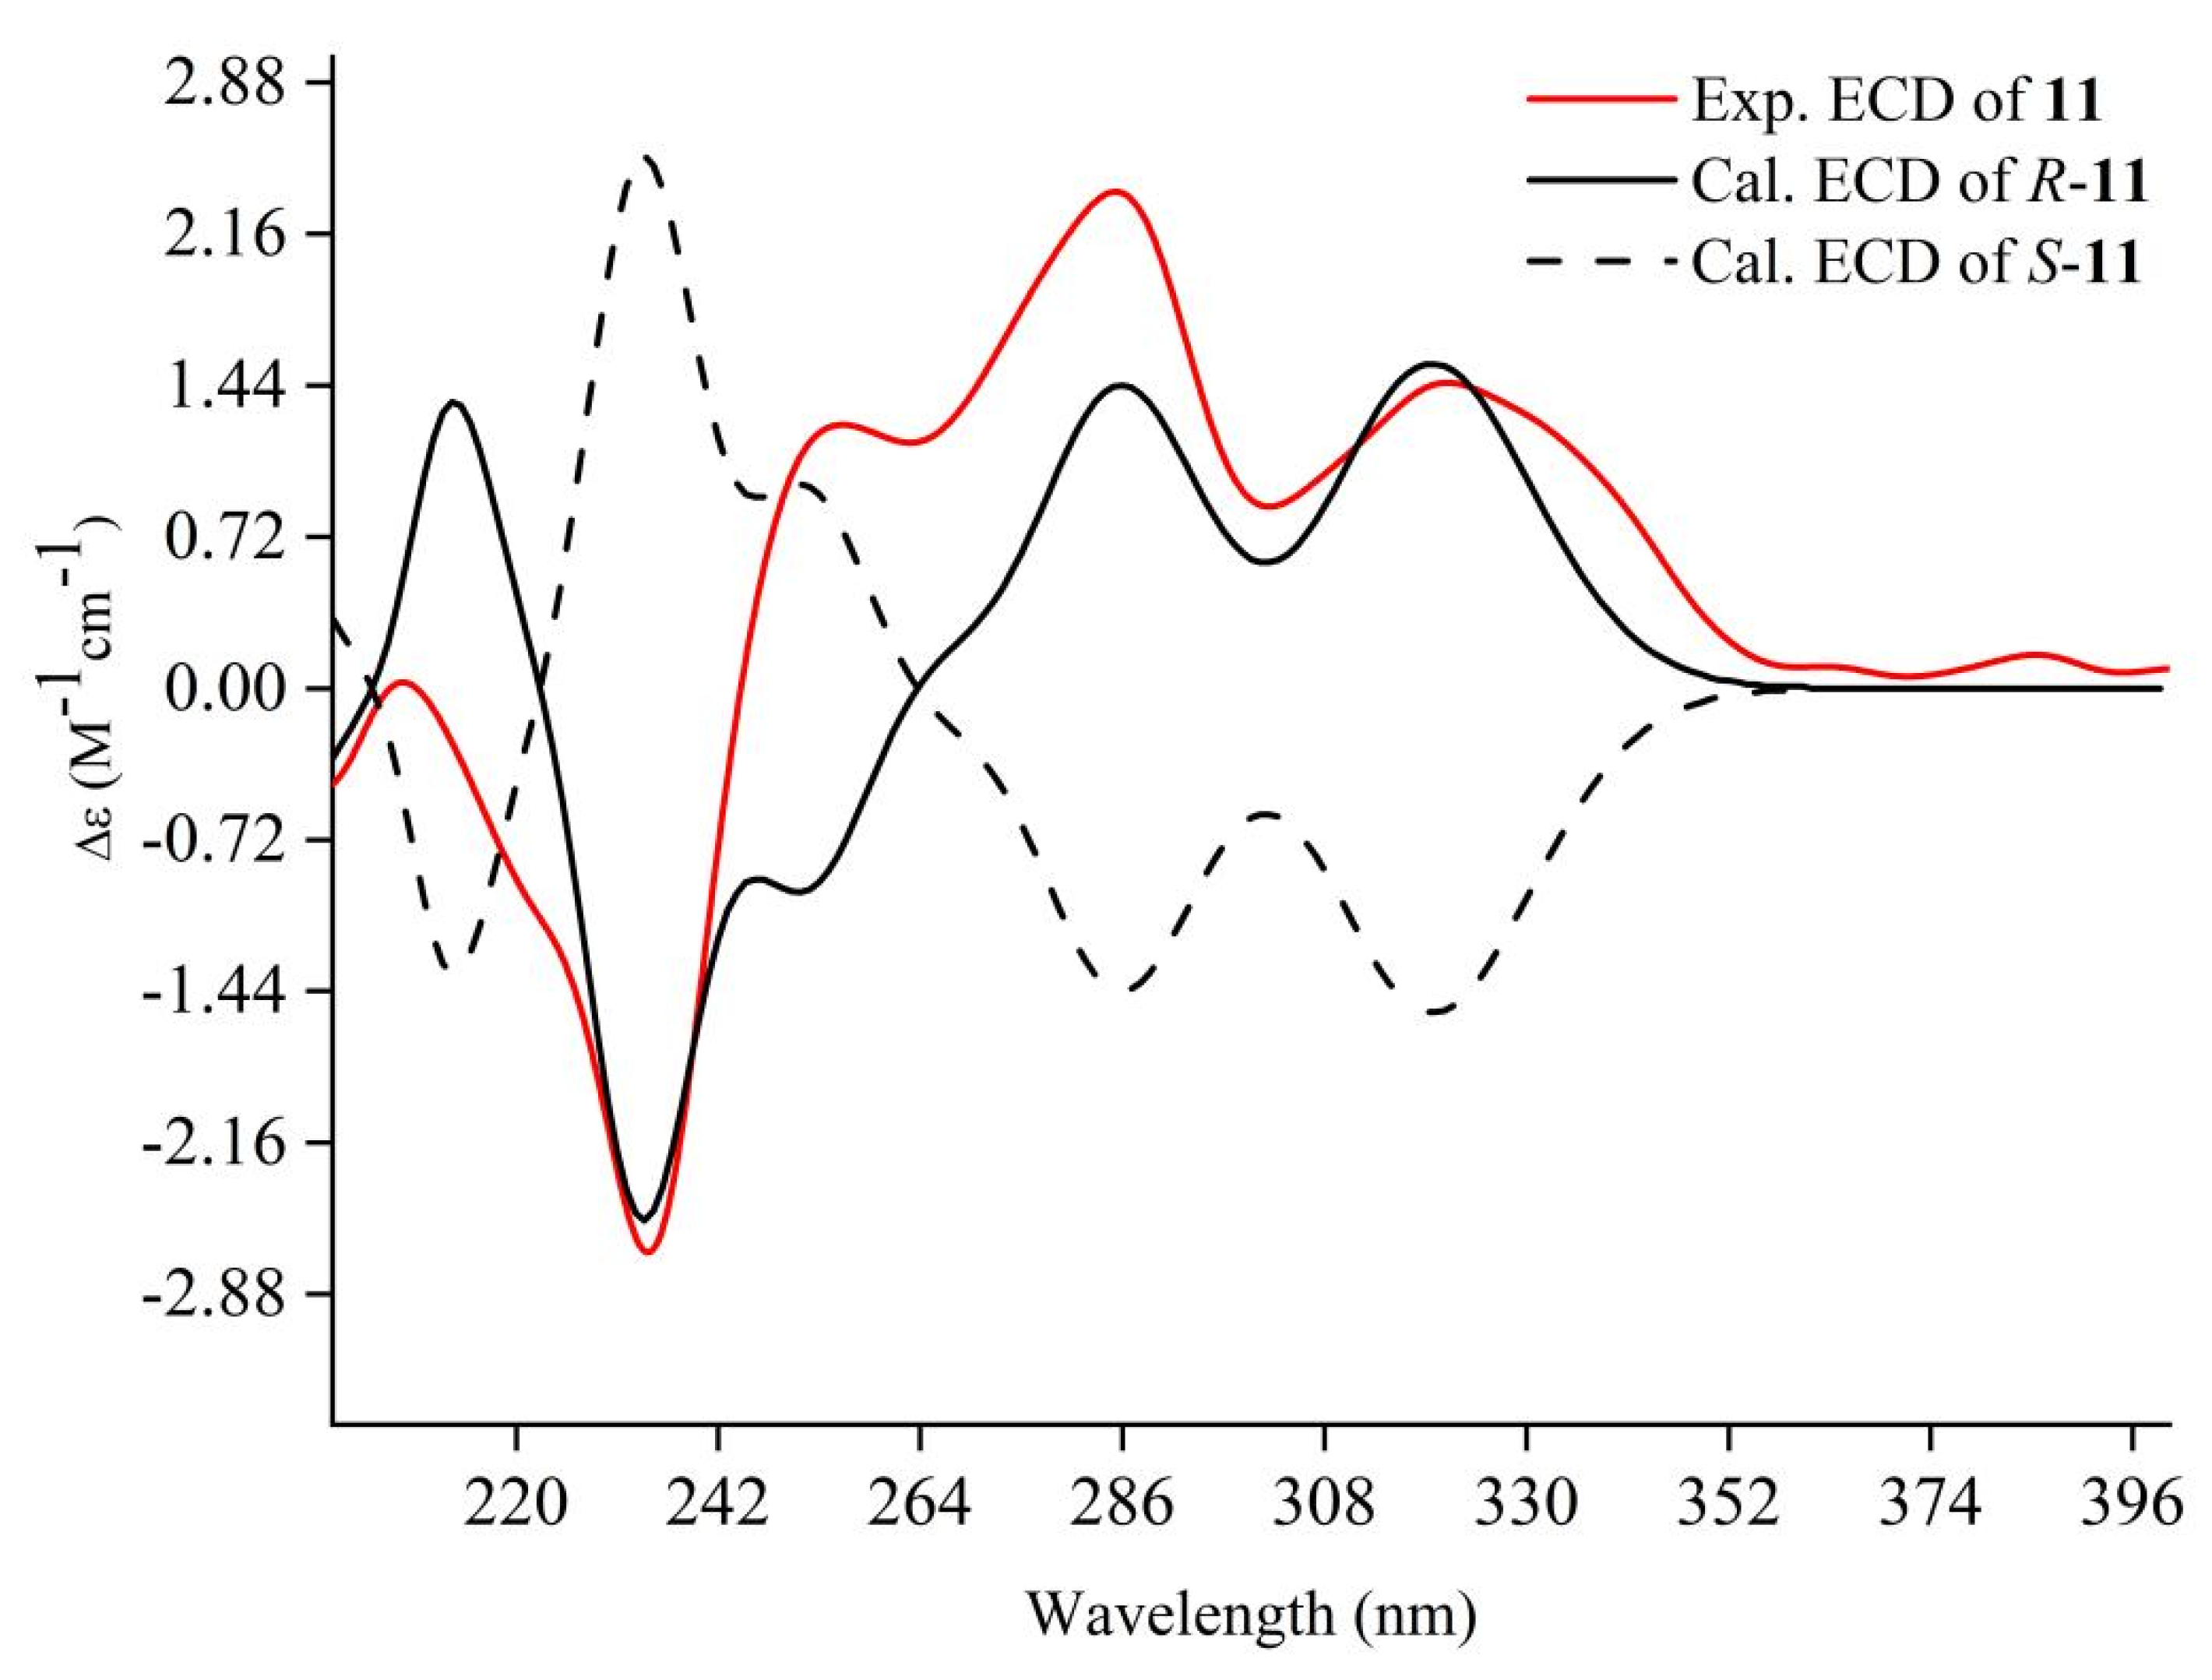
2.6. ECD Calculations

In general, conformational analyses were performed by random searching in Sybyl-X 2.0 using the MMFF94S force field with an energy cut-off of 5 kcal/mol (Sybyl Software, version X 2.0, 2013) [24]. The results showed the five lowest-energy conformers for compounds 4, 7, 9, and 11. Subsequently, geometric optimizations and frequency analyses were implemented at the B3LYP-D3(BJ)/6-31G* level in PCM MeOH using ORCA4.2.1 [25,26]. All conformers used for property calculations in this study were characterized as stable points on a potential energy surface with no imaginary frequencies. The excitation energies, oscillator strengths, and rotational strengths (velocity) of the first 60 excited states were calculated by the time-dependent density-functional theory (TD-DFT) at the PBE0/def2-TZVP level in MeOH. The ECD spectra were simulated by the overlapping Gaussian function (half the bandwidth at 1/e peak height, sigma = 0.30 for all) [27]. The Gibbs free energies for the conformers were determined by using thermal correction at the B3LYP-D3(BJ)/6-31G** level, and electronic energies were evaluated at the wB97M-V/def2-TZVP level in PCM MeOH using ORCA4.2.1 [25,26]. To obtain the final spectra, we used the Boltzmann distribution theory and the conformers’ relative Gibbs free energy (∆G) to average the simulated spectra. The absolute configuration of the only chiral center was determined by comparing the experimental spectra to the calculated molecular models.

3. Results and Discussion

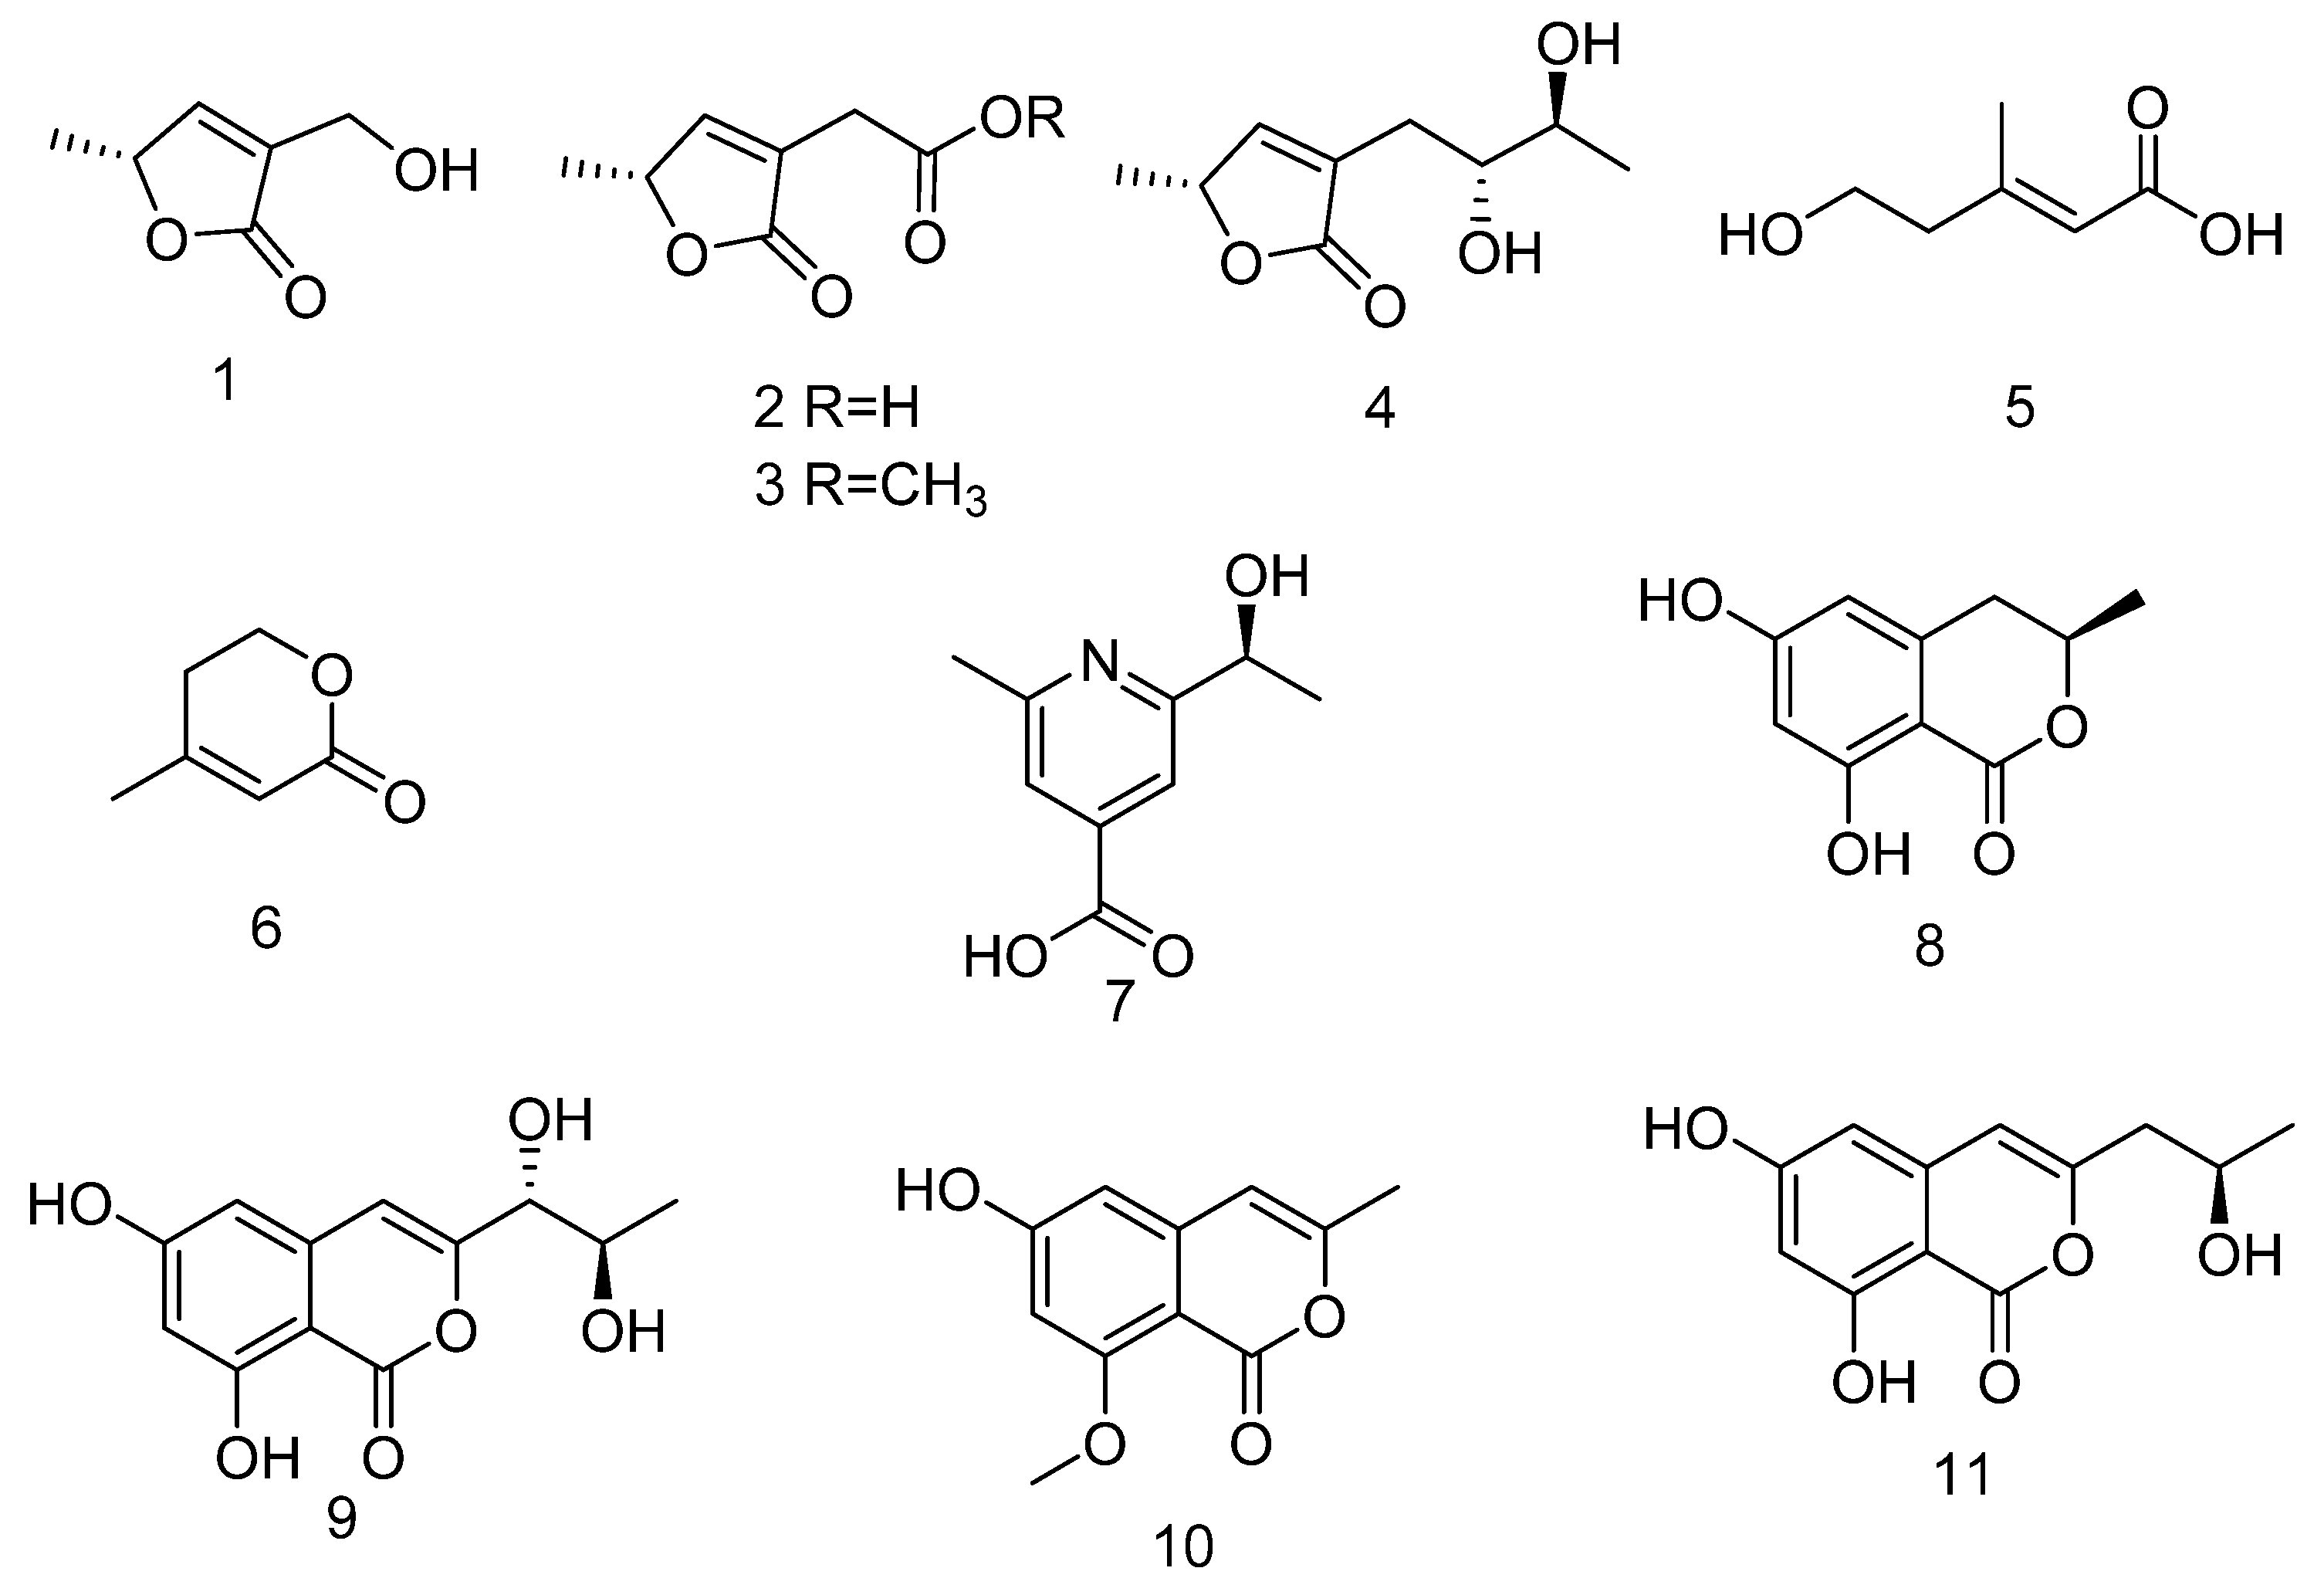
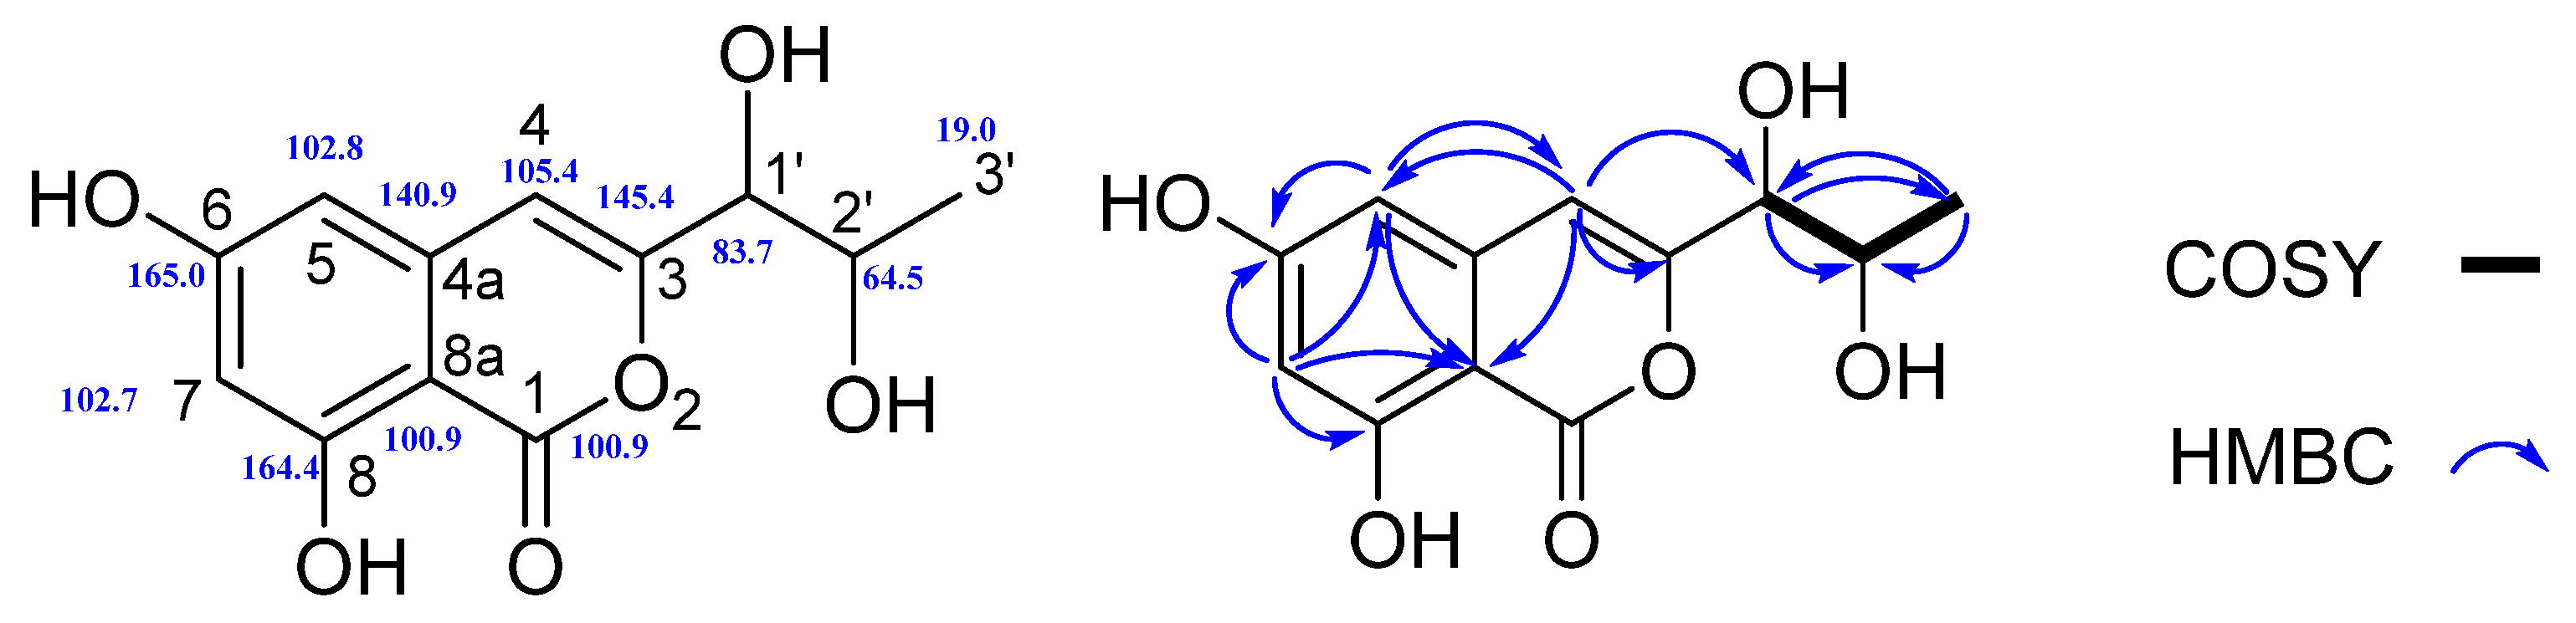
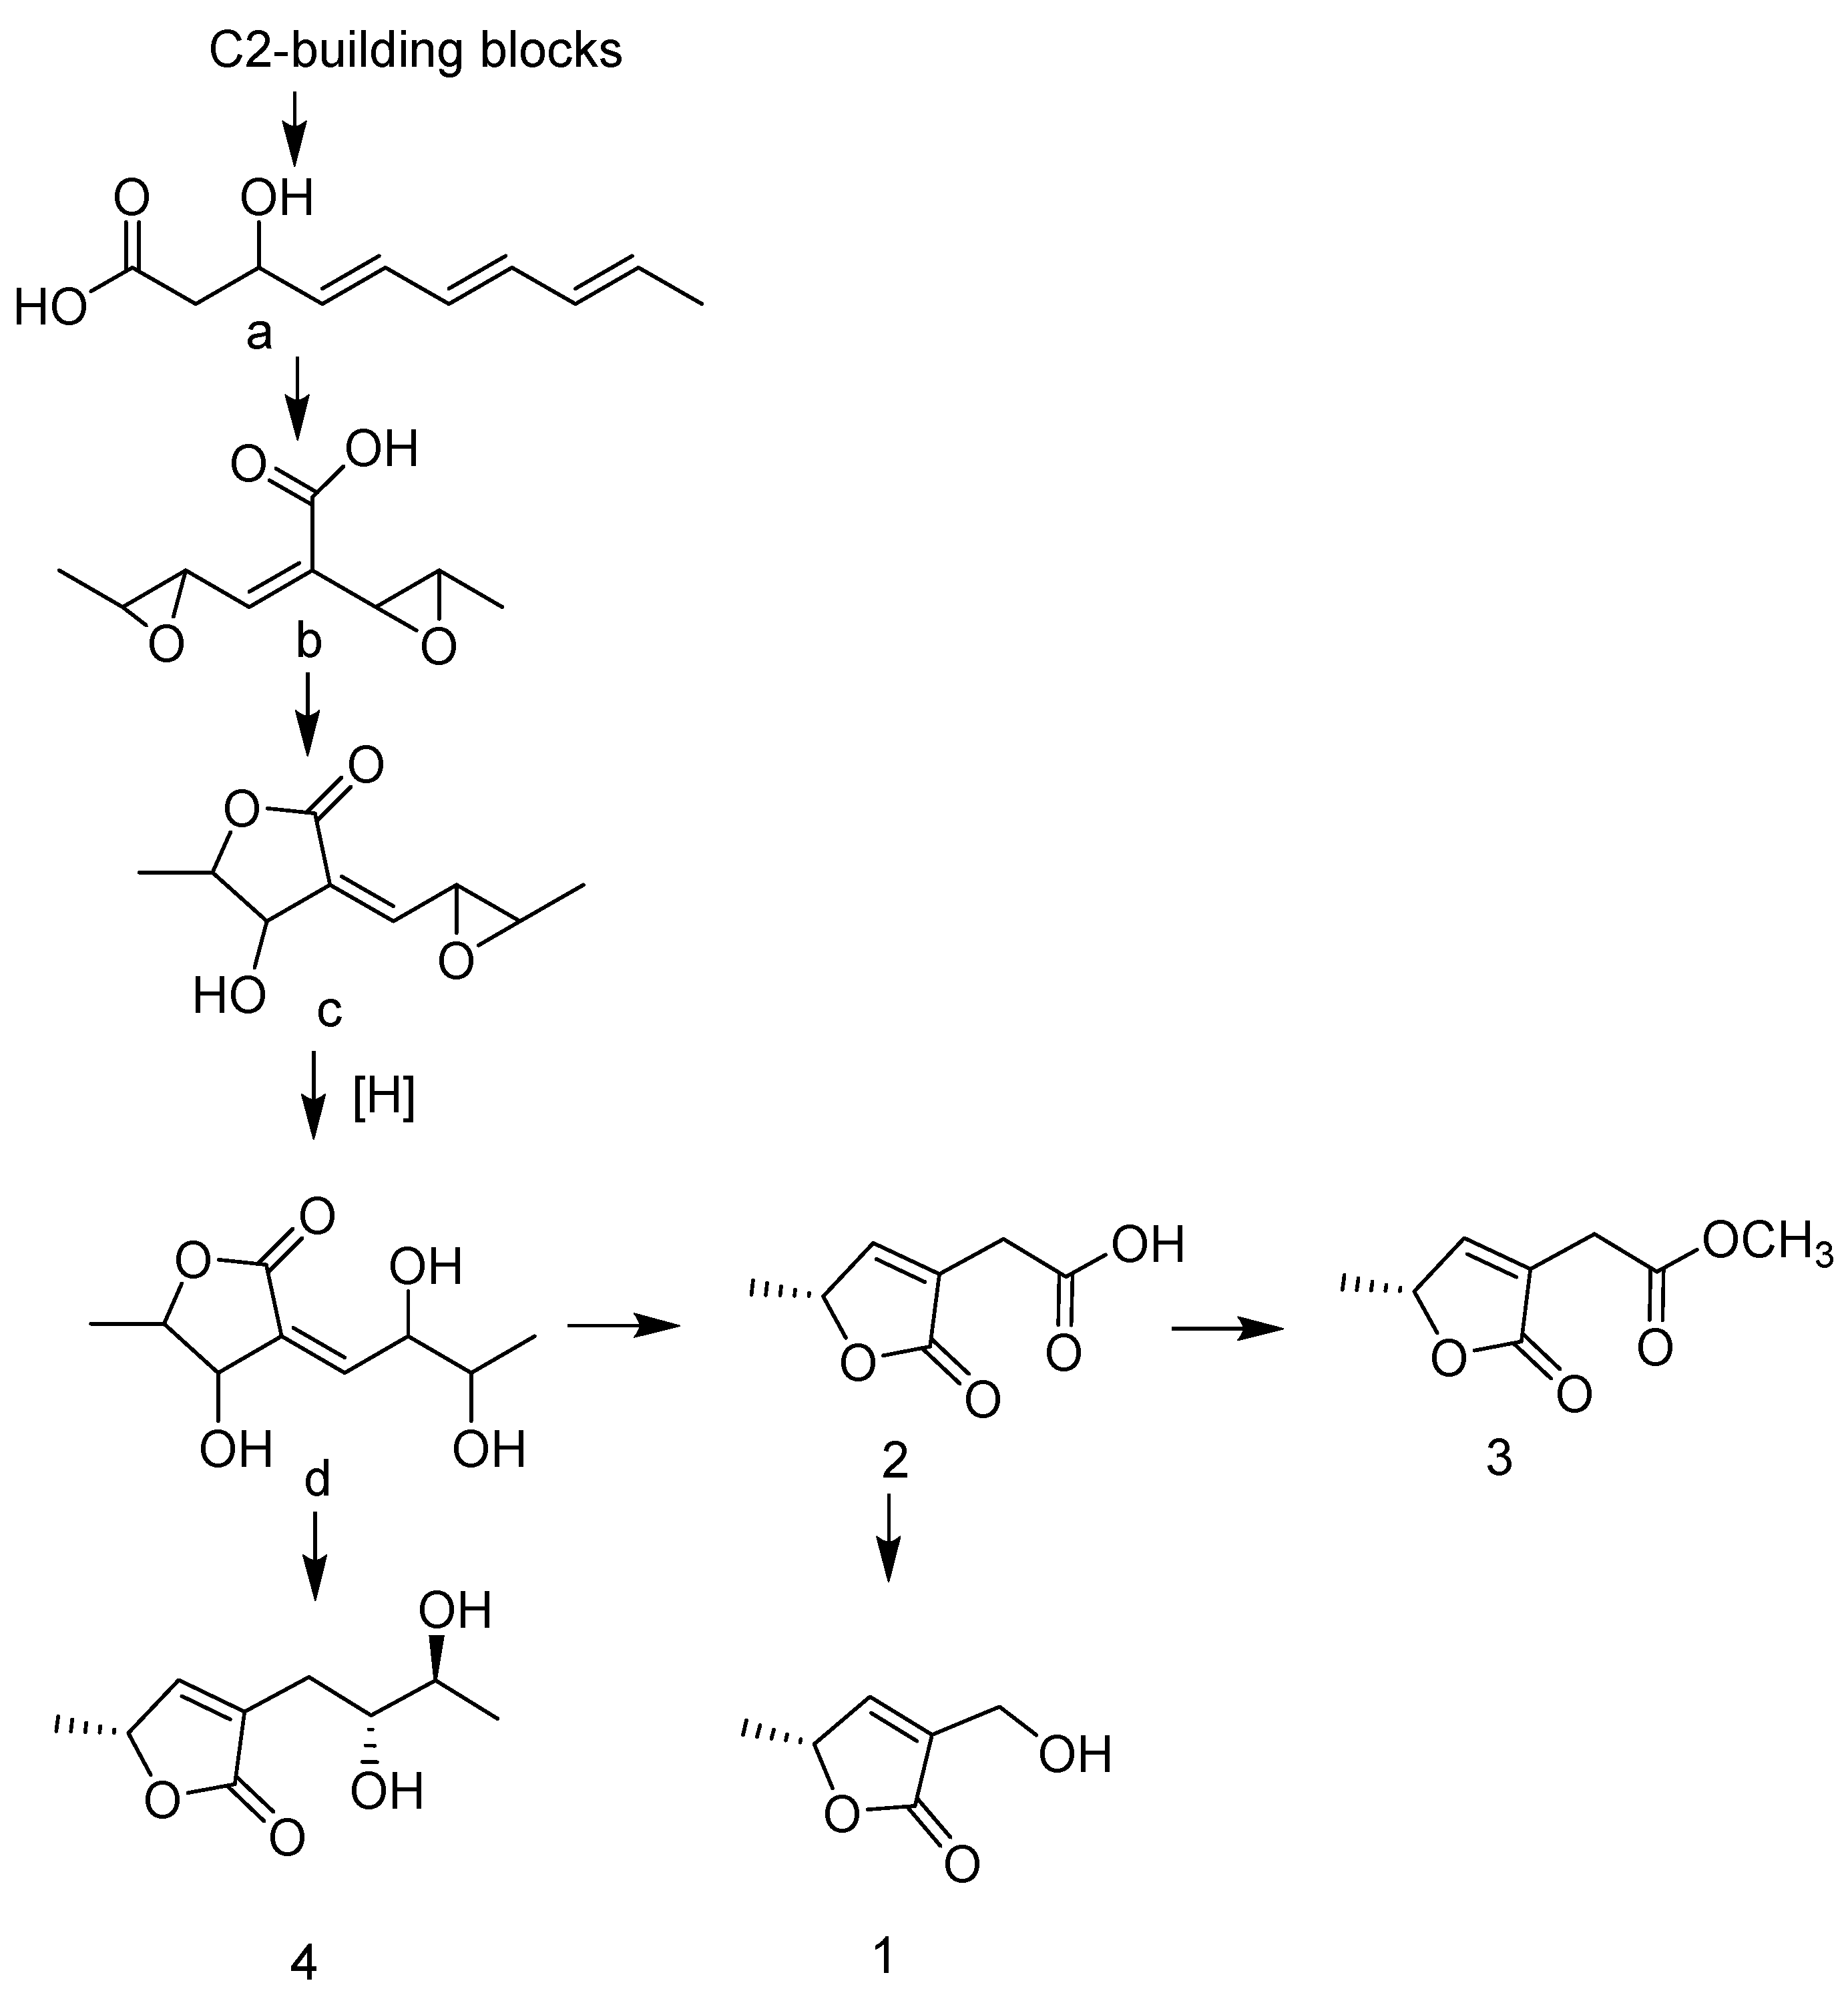
Structure Elucidation

Compound 4, a white powder soluble in methanol (MeOH), exhibited a pseudomolecular ion peak at m/z 187.0965 [M + H]+ (calculated for C9H15O4+: 187.0926) in the HR-ESI-MS spectrum, indicating a molecular formula of C9H14O4, and two degrees of unsaturation. The 1H NMR data indicated two methyls at δH 1.20 (3H, d, J = 6.1 Hz, H-10) and 1.39 (3H, d, J = 6.8 Hz, H-6); one olefinic methane at δH 7.36 (1H, br s, H-4); and three oxymethines at δH 3.58 (1H, m, H-9), 3.60 (1H, m, H-8), and 5.09 (1H, br q, J = 6.8 Hz, H-5). The 13C-NMR spectra revealed one ester carbonyl (δC 176.5), one olefinic methine (δC 154.2), one nonprotonated sp2 carbon (δC 131.7), three oxygenated methines (δC 71.6, 74.8, and 79.8), one methylene (δC 29.6), and two methyls (δC 18.9 and 19.1).
The HMBC spectrum showed correlations between H-10 (δH 1.20)/C-8 (δC 74.8) and H-10 (δH 1.20)/C-9 (δC 71.6), as well as H-9 (δH 3.58)/C-7 (δC 29.6), H-9 (δH 3.58)/C-8, and H-9 (δH 3.58)/C-10. C-8 was correlated with C-3, C-7, and C-9 (Figure 2). When combined with the peak shape analysis of H-10 (δH 1.20, d, J = 6.1), C-9 was found to be connected to C-10, and C-8 was connected to C-9. Since C-8 and C-9 are methylene carbons and there is no nitrogen in the molecular formula, when combined with the chemical shift value, C-8 and C-9 were found to be connected to hydroxyl groups. H-7 is related to C-8, C-9, C-3, and C-4, and H-7 is methylene, but there were two groups of different H signals. Therefore, it can be inferred that one side of C-7 was connected to C-8. C-3 had the same characteristic signals as H-4, H-7, and H-8. The carbon shift signals of C-3 and C-4 were δC 131.7 and δC 154.2, respectively. HSQC indicated that C-4 was connected by protons, and it can be concluded that C-3 and C-4 were connected by a double bond and that C-4 was a quaternary carbon with two substitutions, one of which was connected with C-7. According to the HMBC cross-peak correlation of H-4/C-2 (δC 176.5), H-7/C-2, and C-3, we were able to infer that the side-chain fragment was attached to α,β-unsaturated-γ-lactone. HSQC indicated that C-2 was not connected to a proton. When combined with the molecular formula, C-4 was found to be a carbonyl group, H-4 was related to C-5, H-5 was related to C-6, and H-4 was related to HMBC. It was concluded that C-5 was connected to C-4, C-6 was connected to C-5, and the chemical shift value of C-5 was δC 79.8. When combined with the molecular formula, C-5 was also found to be connected to oxygen. Since the unsaturation degree of the compound was 2, the double bond between C-4 and C-3 occupied an unsaturation. An unsaturation remained, and there was no other double-bond carbon signal in the compound: hence, it is inferred that there was a cyclization system in which the chemical shift of C-2 was lower-field than that of the conventional carbonyl group. It was inferred that the other side of C-2 was connected to the oxygen and that C-5 and C-2 passed through the oxygen to form a lactone ring. The 1H (CD3OD, 400 MHz) and 13C-NMR (CD3OD, 100 MHz) data are listed in Table 1.
The 13C chemical shift calculation was carried out at the B3LYP-D3(BJ)/6-31G** level to obtain the accurate relative configuration of 4. In addition, the absolute configurations of 4 (5R, 8R, and 9S) were established by comparing electronic circular dichroism (ECD) calculations at the PBE0/def2-TZVP level with the experimental one (Figure 3). In addition, high correlation coefficients (R2) between experimental and calculated chemical shifts were shown, with 0.9985 for 4 (Figure 4), indicating that the δC of 4 matched the calculated δC very well, which confirmed the framework of 4. The structure of compound 4 was determined to be (R)-5-((8R, 9S)-8, 9-dihydroxybutyl)-5-methylfuran-2(5H)-one, so compound 4 was named aspilactonol I, as shown in Figure 1 (See Supplementary material).
Compound 7, a white powder soluble in MeOH, has the molecular formula of C9H11NO3 with four degrees of unsaturation from the protonated molecular ion at m/z 182.0810 [M + H]+ (calculated for C9H12NO3+, 182.0812), as evidenced by HR-ESI-MS; the combination of 13C-NMR and 1H-NMR spectra showed that the compound contained six low-field carbon signals, including four substituted low-field carbons, two unsubstituted aromatic carbons, one submethyl carbon, and two methyl carbons, including one methyl carbon directly connected to the aromatic ring. The compound is an alkaloid, as verified by the bismuth potassium iodide reaction. It is inferred that the compound contained a nitrogen-containing heterocyclic ring. According to the HMBC signal (Table 2), H-5 (δH 7.67) was correlated with C-6, C-3, and C-9, and H-3 was strongly correlated with C-2, C-5, and C-9. Furthermore, the HMBC-related signal intensity was weakly correlated. Combined with hydrogen spectrum signal splitting, C-3 and C-5 were interpositionally substituted, and H-3 and H-5 were weakly correlated with the C-9 signal intensity. H-5 was correlated with C-6 and C-10, and H-10 was strongly correlated with C-6, indicating that C-10 was linked to C-6, and the chemical shift of C-6 was lower than that of conventional aromatic carbonization. It is inferred that C-6 was linked to heteroatom N, resulting in a low chemical shift field, and H-3 and C-2 (δC 166.9) were detected. The correlation signal of H-7 with C-3 and C-8 and the correlation hydrogen spectrum signal of H-8 split (d) indicated that C-2 was connected with a hydroxyethyl, and the abnormal chemical shift of C-2 indicates that it was connected to N. After assignment of the related signals, it was found that C-4 (δC 142.2) did not generate any related signals, and there were two oxygens in the molecular formula of the compound that had not been attributed. Thus, it was inferred that the compound contained carboxylic acid groups. Since the unsaturation degree of the compound was 4 and it was a nitrogen-containing alkaloid, the carboxylic acid groups should be connected with the pyridine ring (Figure 5). The position of C-9 was determined according to the signal correlation between H-3, H-5, and C-9, and the paraposition substitution of the carbonyl group and paraposition N led to the chemical shift of C-4 moving to the lower field: 1H-NMR (400 MHz, CD3OD) δH 7.89 (br s, 1H, H-3), 7.67 (br s, 1H, H-5), 4.89 (1H, overlapped, H-7), 2.59 (s, 3H, H-10) and 1.46 (d, J = 6.6, H-8); 13C-NMR (100 MHz; CD3OD) δC 168.4 (C-9), 166.9 (C-1), 159.5 (C-6), 142.2 (C-4), 122.6 (C-5), 117.5 (C-3), 71.1 (C-3), 24.4 (C-8), and 23.7 (C-10).
To confirm the stereochemical assignments of 7, we carried out the ECD calculation at the PBE0/def2-TZVP level. The experimental ECD spectrum of 7 exhibited a negative Cotton effect at 258 nm (Δε −10.54) and a positive Cotton effect at 286 nm (Δε +7.76), which displayed strong agreement with the calculated ECD curve of S-7 (Figure 6). Thus, the absolute configuration at the stereogenic center in 7 was (7S). The structure of compound 7 was determined to be 2-(1-hydroxyethyl)-6-methylisonicotinic acid.
Compound 9 was isolated as a light yellow powder, and the HR-ESI-MS data showed a molecule peak at m/z 253.0655 [M + H]+ (calculated for C12H13O6+, 253.0707), which indicated the molecular formula as C12H12O6 and 7 as the index of hydrogen deficiency; 1H-NMR (400 MHz; DMSO-d6) δH 1.12–1.14 (d, J = 6 Hz, 3H, H-3′), 3.77–3.85 (m, J = 6.2 Hz, 1H, H-2′), 3.97–4.00 (t, J = 5.6 Hz, 1H, H-3′), 3.75–3.77 (d, 1H, OH), 5.64–5.55 (d, 1H, OH), 6.34 (d, J = 1.2 Hz, 1H, H-5), 6.44 (d, J = 1.2 Hz, 1H, H-7), 6.61 (s, 1H, H-4), 10.85 (s, 1H, H-6), 11.00 (s, 1H, H-8); and 13C-NMR (400 MHz; DMSO-d6) δC 165.5(C-1), 165.3 (C-6), 162.5 (C-8), 157.6 (C-3), 139.2 (C-4a), 104.4 (C-4), 102.9 (C-5), 101.5 (C-7), 97.8 (C-8a), 74.4 (C-1′), 67.4 (C-2′), and 19.7 (C-3′) (Figure 7). The 1H-NMR showed that the compound contained one methyl group, two methoxymethyl groups, two alcohol hydroxyl groups, one phenolic hydroxyl group, one phenolic hydroxyl group forming an intramolecular hydrogen bond, and two double-bond protons. The 13C-NMR spectrum (DMSO-d6) of the compound showed 12 carbon signals, including five oxygen-linked aromatic carbons, four oxygen-free aromatic carbons, two oxygen-linked methylene carbons, and one methyl carbon. The unsaturation of the compound was calculated as 6 according to the molecular formula of the compound, and it was inferred that the compound contained two amphioxic heterocyclic systems. H-7 (δ 6.33) was correlated with C-5 (δ 102.9), C-8a (δ 97.8), C-8 (δ 162.5), and C-6 (δ 165.3), and H-5 was correlated with C-4 (δ 104.4), C-6 (δ 165.3), and C-8a (δ 97.8). Among them, oxygen substitution existed in C-6 (δ 165.3), C-8 (δ 162.5), and C-1 (δ 165.54). According to a comparison of the hydrogen spectra of CD3OD, C-6 and C-8 are hydroxyl substitutions, and C-1 is the carbonyl group. The abnormal chemical shift of the C-8 hydroxyl group (δ 11.00) indicated that it was greatly shifted to the lower field under the influence of the neighboring carbonyl group. The low-field shift for C-3 (δ 157.6) and the HSQC signal suggested the existence of substitution. On the basis of a combination with the HMBC and chemical shift characteristics of C-3 and C-1, we inferred that the two carbons were connected by oxygen, resulting in a large chemical shift to the low field (Table 3). On the basis of the above information, we inferred that the compound was a derivative of an isocoumarin skeleton. There was a correlation between C-4, C-3, and C-1, and it was inferred that C-3 had a branched chain substitution: H-1′, C-2′, C-3′, and H-3′ were correlated with C-1′ and C-2′. A combination of the H spectrum splitting characteristics and hydrogen integral values of H-1, H-2, and H-3 (dd, dq, d peaks; 1H, 1H, 3H, respectively) and the chemical shifts of C-1′, C-2′, and C-3′ (74.4, 67.4, and 19.7, respectively) determined that C-1′ and C-2′ were hydroxyl substituted and C-3′ was a methyl, and the compound signal was assigned. The absolute configurations of compound 9 were established to be 1′R and 2′R by the ECD calculations (Figure 8). Finally, compound 9 was named 6,8-dihydroxy-3-(1′R, 2′R-dihydroxypropyl)-isocoumarin (Figure 1).
In addition to the new compounds described above, eight known compounds obtained in this study were identified as compounds 13, 56, 8, and 1011 by comparing their spectroscopic data to those reported in the literature. Details of NMR and MS data for compounds 111 were given in the Supplementary Materials.
Compound 1 was obtained as a colorless powder, and the HR-ESI-MS data showed a molecule peak at m/z 129.0552 [M + H]+ (calculated for C6H9O3+, 129.0546), which indicated a molecular formula of C6H8O3 with three degrees of unsaturation. In examining the proton nuclear magnetic resonance (1H-NMR) data, we found signals for methyl protons δH 1.41 (3H d, J = 6.8 Hz, H-CH3), one methylene proton δH 4.28 (2H, d, J = 1.7 Hz), and two methines (two oxygenated sp3 and one sp2): δH 5.11–5.16 (1H, m, H-5) and δH 7.42–7.47 (1H, m, H-4). The 13C-NMR spectra revealed six carbon signals: one ester carbonyl (δC 174.53), one olefinic methine (δC 152.93), one nonprotonated sp2 carbon (δC 134.75), two oxygenated methines (δC 80.13), one oxygenated methylene (δC 56.95), and methyls (δC 19.02). The structure of 1 was determined as 3-(hydroxymethyl)-5-methylfuran-2(5H)-one [28], as shown in Figure 1.
Compound 2 was a white powder with the molecular formula (C7H8O4): HR-ESI-MS m/z 157.0493 [M + H]+ (calculated for C7H9O4+, 157.0495); 1H-NMR (400 MHz, CD3OD) δH 1.33 (d, J = 6.8 Hz, 3H, H-CH3), 5.05–5.09 (m, 1H, H-5), and 7.41–7.45 (m, 1H, H-4); and 13C-NMR (100 MHz, CD3OD) δC 18.93 (C-CH3), 31.08 (C-2′), 80.00 (C-5), 127.99 (C-3), 155.38 (C-4), 173.10 (C-2), and 175.47 (C-1′). Thus, compound 2 was identified as [2-(5-methyl-2-oxo-2,5-dihydrofuran-3-yl)-acetic acid] by comparing NMR reference data [29]. Previously, compound 2 had only been obtained through chemical synthesis and was isolated as a natural product for the first time [29]. Thus, we named it aspilactonol G.
Compound 3 was a colorless oil with the molecular formula (C8H10O4): HR-ESI-MS (m/z 171.0654 [M + H]+ (calculated for C8H10O4+, 171.0652)). 1H-NMR data (400 MHz, CD3OD) δH 1.33 (d, J = 6.8 Hz, 3H, H-5), 5.05–5.09 (m, 2H, H-2), and 7.41–7.45 (m, 1H, H-4); and 13C-NMR (100 MHz, CD3OD) δC 18.92, 30.09, 52.68, 80.05, 127.55, 155.58, 171.64, and 175.25. Thus, compound 3 was identified as [methyl-2-(5-methyl-2-oxo-2,5-dihydrofuran -3-yl)-acetate] by comparing NMR reference data [29]. Compound 3 was also obtained as a natural product for the first time [29]; thus, we named it aspilactonol H.
Compound 5 yielded the following data: HR-ESI-MS m/z 131.0663 [M + H]+ (calculated for C6H11O3+, 131.0703); 1H-NMR (400 MHz, CD3OD) δH 2.11 (d, 3H, C-6), 2.30–2.34 (t, 2H, H-4), 3.67–3.70 (t, 2H, H-5), and 5.76 (s, 1H, H-2); and 13C-NMR (400 MHz, CD3OD) δC 18.5, 44.6, 60.9, 120.4, 152.7, and 172.1. Compound 5 is E-Δ2-anhydromevalonic acid [30].
Compound 6 yielded the following data: HR-ESI-MS m/z 113.0604 [M + H]+ (calculated for C6H9O2+, 113.0597); 1H-NMR (400 MHz, CD3OD), δH 5.79 (1H, q, J = 1.5 Hz, H-3), 4.38 (2H, t, J = 6.0 Hz, H-6), 2.41 (2H, br.t, J = 6.0 Hz, H-5), and 2.02 (3H, s, H-7); and 13C-NMR (100 MHz, CD3OD) δC 22.6, 28.8, 65.6, 116.2, 158.0, and 164.4. Compound 6 is 4-methyl-5,6-dihydropyren-2-one [31].
Compound 8 was a white amorphous powder. The molecular formula, C10H10O4, was determined by HR-ESI-MS 195.0651 m/z [M + H]+ (calculated for C10H11O4+, 195.0652) and 13C-NMR data, corresponding to six degrees of unsaturation; 1H-NMR (400 MHz, CD3OD) δH 6. 21 (1H, s, H-5), 6.20 (1H, s, H-7), 4.63–4.67 (1H, m, H-3), 2.92 (1H, dd, J = 16.4, 3.6 Hz, H-4a), 2.82 (H, dd, J = 16.4, 11.2 Hz, H-4b), and 1.45 (3H, d, J = 6.3 Hz, H-9); and 13C-NMR (CD3OD, 100 MHz) δC 170.30 (C-1), 164.99 (C-8), 164.23 (C-6), 142.08 (C-4a), 106.53 (C-5), 100.82 (C-8a), 100.0 (C-7), 75.77 (C-3), 34.13 (C-4), and 19.44 (C-9). Compound 8 was identified as (R)-6-hydroxymellein [32].
Compound 10, C11H10O4, was a yellow powder: HR-ESI-MS m/z 207.0651 [M + H]+ (calculated for C11H11O4+, 207.0652); 1H-NMR (400 MHz, CD3OD, δ, ppm) δH 6.39 (1H, d, J = 1.5 Hz, H-7), 6.29 (1H, d, J = 1.5 Hz, H-5), 6.24 (1H, s, H-4), 3.78 (3H, s, H-10), and 2.10 (3H, s, H-9); and 13C-NMR (100 MHz, CD3OD) δC 165.1 (C, C-1), 163.6 123 (C, C-8), 158.3 (C, C-6), 155.0 (C, C-3), 142.2 (C, C-4a), 103.5 (CH, C-4), 102.9 (CH, C-5), 100.4 (C, C-8a), 99.2 (CH, C-7), 56.8 (CH3, C-10), and 19.4 (CH3, C-9). Compound 10 is 6-hydroxy-8-methoxy-3-methylisocoumarin [33].
Compound 11, C12H12O5, was a yellow powder: ESI-MS m/z 237.0765 [M + H]+ (calculated for C12H13O5+, 237.0757); 1H-NMR (400 MHz, CD3OD, δ, ppm), δH 6.40 (2H, d, J = 2.1, H-5, 7), 6.37 (1H, d, J = 2.1, H-4), 4.69 (1H, m, H-2′), 2.59 (2H, m, H-1′), and 1.26 (3H, d, J = 6.2, H-3′); and 13C-NMR (100 MHz, CD3OD, δ, ppm), δC 167.8 (C, C-1), 167.3 (C, C-8), 164.8 (C, C-6), 156.2 (C, C-3), 141.3 (CH, C-4), 107.0 (C, C-7), 103.7 (C, C-10), 102.6 (CH, C-9), 99.8 (CH, C-5), 66.2 (CH, C-2′), 43.8 (CH2, C-1′), and 23.3 (CH3, C-3′). The absolute configuration of compound 11 was established to be 2′R by the ECD calculations (Figure 9). Thus, compound 11 was identified as de-O-methyldiaporthin by comparing NMR reference data [34,35].
The biosynthesis of the isolated compounds 14 and 811 was proposed as shown in Scheme 1 and Scheme 2, respectively. Furan ring groups are abundant in natural products and play important roles in the pharmacophore of bioactive substances. Furanone and its derivatives have been shown to inhibit the formation of bacterial biofilms; interfere with bacterial population effects; and have analgesic, anti-inflammatory, anticancer, anticonvulsive, antibacterial, antifungal, antioxidation, and other activities. Most of the furanone compounds are synthesized by a single polyketone pathway, although chain fusion of furanone has also been reported in recent years [19,36]. In this study, compounds 4 and 9 possessed o-diol side chains. Different carbon skeletons with the same o-diol side chains suggested the presence of specific hydroxylating enzymes. A plausible biosynthetic pathway for compounds 14 is proposed (Scheme 1). Furanone 14 are derivatives of α,β-unsaturated γ-lactone. Their synthesis begins with the condensation of five molecules of acetyl-CoA to form the intermediate a, which is reduced to generate the critical intermediate b, and forms the intermediate c under the action of cyclase. Then, c undergoes ring-opening and oxidation to generate the intermediate d, which is dehydrated to produce compound 4. Compound 2 is synthesized from d through an undefined pathway, then methylated to compound 3 and decarboxylated to compound 1 [19,36]. Compounds 811 are isocoumarin derivatives (Scheme 2), whose biosynthesis by the polyketone synthesis pathway begins with acetyl-CoA. Isocoumarin derivatives have been detected in both plants and microorganisms. The C-8 of isocoumarins does not have the oxidation found in plants, while the isocoumarins commonly found in microorganisms have oxidation at the C-8 position, which is considered to be the biological source of the two types of isocoumarin [37,38].
The AChE inhibitory activities of the crude extracts were evaluated using Ellman’s method, with Rivastigmine and Hup A as the control groups [22,39]. Ethyl acetate, with an inhibition effect value of 82.68%, exhibited better inhibition against AChE than did either petroleum ether extract (47.23%) or buthanol extract (15.82%) (Table S1). In addition, all of the compounds were investigated for their anti-AChE activities. Compounds 13 and 510 exhibited no inhibitory activity against AChE. Compounds 4 and 11 displayed moderate inhibitory effect on AChE activities with IC50 values of 6.26 and 21.18 µM, respectively (Table 4).
Structurally, almost all of the furanone compounds in this study contained an α,β-unsaturated carboxylic acid lactone moiety, which might be the key functional group for their biological activity. De-O-methyldiaporthin (11) was first reported in 1988 [34,35]. It can be used as a microbial herbicide due to its very strong phytotoxic activity [40]. AChEIs are drugs that can be used clinically to treat or alleviate symptoms of AD. They are primarily associated with the direction and efficacy of AD drug development based on the cholinergic injury hypothesis. Thus far, two generations of five AChEI drugs (Tacrine, Donepezil, Rivastigmine, Galantamine, and HupA) have been successfully developed and have become the first choice for clinical treatment or mitigation of AD [10]. Existing clinical AChEI drugs have limitations such as limited efficacy, significant toxicity, and drug resistance. In this study, furanone compound 4 and isocoumarin compound 11 were found to have the potential to inhibit AChE. To the best of our knowledge, furanone compounds were reported here for the first time for their AChE inhibitory activity. Their mechanisms of action and structure–activity relationships in inhibiting AChE require further study by inhibition kinetics analysis and molecular docking methods.

4. Conclusions

To summarize, 11 polyketide derivatives, which included three new compounds, aspilactonol I (4), 2-(1-hydroxyethyl)-6-methylisonicotinic acid (7), and 6, 8-dihydroxy-3-(1′R, 2′R-dihydroxypropyl)-isocoumarin (9), and two new natural-sources-derived aspilactonols (G, H) (2, 3) were isolated from an endophytic fungus Phaeosphaeria sp. LF5 of H. serrata. Their absolute configurations of three new compounds (4, 7, and 9) and known compound 11 were determined by ECD calculations. Furanone compound 4 and isocoumarin compound 11 exhibited potent AChE inhibitory activities. This study indicates that Phaeosphaeria sp. LF5 from H. serrata may contain various AChEI compounds, which is a potential resource pool for bioprospecting and isolating AChEIs. Furthermore, this research also provided a material basis for the development of new and efficient AChEI drugs.

Supplementary Materials

The following supporting information can be downloaded at https://www.mdpi.com/article/10.3390/jof8030232/s1. Table S1: Acetylcholinesterase inhibitory activities of the crude extracts, Figure S1: 1H NMR spectrum of compound 1 in CD3OD, Figure S2: 13C NMR spectrum of compound 1 in CD3OD, Figure S3: 1H NMR spectrum of compound 2 in CD3OD, Figure S4: 13C NMR spectrum of compound 2 in CD3OD, Figure S5: 1H NMR spectrum of compound 3 in CD3OD, Figure S6: 13C NMR spectrum of compound 3 in CD3OD, Figure S7: 1H NMR spectrum of compound 4 in CD3OD, Figure S8: 13C NMR spectrum of compound 4 in CD3OD, Figure S9: 1H-1H COSY spectrum of compound 4 in CD3OD, Figure S10: DEPT 90 spectrum of compound 4 in CD3OD, Figure S11: DEPT 135 spectrum of compound 4 in CD3OD, Figure S12: HSQC spectrum of compound 4 in CD3OD, Figure S13: HMBC spectrum of compound 4 in CD3OD, Figure S14: NOESY spectrum of compound 4 in CD3OD, Figure S15: HRESIMS spectrum of compound 4, Figure S16: 1H NMR spectrum of compound 5 in CD3OD, Figure S17: 13C NMR spectrum of compound 5 in CD3OD, Figure S18: 1H NMR spectrum of compound 6 in CD3OD, Figure S19: 13C NMR spectrum of compound 6 in CD3OD, Figure S20: 1H NMR spectrum of compound 7 in CD3OD, Figure S21: 13C NMR spectrum of compound 7 in CD3OD, Figure S22: 1H-1H COSY spectrum of compound 7 in CD3OD, Figure S23: HSQC spectrum of compound 7 in CD3OD, Figure S24: HMBC spectrum of compound 7 in CD3OD, Figure S25: NOESY spectrum of compound 7 in CD3OD, Figure S26: HRESIMS spectrum of compound 7, Figure S27: 1H NMR spectrum of compound 8 in CD3OD, Figure S28: 13C NMR spectrum of compound 8 in CD3OD, Figure S29: 1H NMR spectrum of compound 9 in DMSO-d6, Figure S30: 13C NMR spectrum of compound 9 in DMSO-d6, Figure S31: DEPT 90 spectrum of compound 9 in DMSO-d6, Figure S32: DEPT 135 spectrum of compound 9 in DMSO-d6, Figure S33: 1H-1H COSY spectrum of compound 9 in DMSO-d6, Figure S34: HSQC spectrum of compound 9 in DMSO-d6, Figure S35: HMBC spectrum of compound 9 in DMSO-d6, Figure S36: NOESY spectrum of compound 9 in DMSO-d6, Figure S37: HRESIMS spectrum of compound 9, Figure S38: 1H NMR spectrum of compound 10 in CD3OD, Figure S39: 13C NMR spectrum of compound 10 in CD3OD, Figure S40: 1H NMR spectrum of compound 11 in CD3OD, Figure S41: 13C NMR spectrum of compound 11 in CD3OD.

Author Contributions

Y.X.: conceptualization, methodology, validation, investigation, and writing—original draft; W.L.: investigation, methodology, and validation; S.Z.: data curation and software; Z.Z.: investigation; Y.W.: investigation and methodology; D.Z.: conceptualization, methodology, writing—review and editing, project administration, and funding acquisition; J.L.: resources and methodology; J.C.: resources; C.J.: chemical structure analysis. All authors have read and agreed to the published version of the manuscript.

Funding

This research was supported by the National Natural Science Foundation of China (81760649) and the Natural Science Foundation of Jiangxi Province of China (20181BAB215044).

Institutional Review Board Statement

Not applicable.

Informed Consent Statement

Not applicable.

Data Availability Statement

All data generated or analyzed in this study are available within the manuscript and are available from the corresponding authors upon request.

Conflicts of Interest

The authors declare no conflict of interest.

References

  1. Newman, D.J.; Cragg, G.M. Plant endophytes and epiphytes: Burgeoning sources of known and “unknown” cytotoxic and antibiotic agents. Planta Med. 2020, 86, 13–14. [Google Scholar] [CrossRef] [PubMed] [Green Version]
  2. Zou, Z.B.; Zhang, G.; Li, S.M.; He, Z.H.; Yan, Q.X.; Lin, Y.K.; Xie, C.L.; Xia, J.M.; Luo, Z.H.; Luo, L.Z.; et al. Asperochratides A–J, Ten new polyketides from the deep-sea-derived Aspergillus ochraceus. Bioorg. Chem. 2020, 105, 104349. [Google Scholar] [CrossRef] [PubMed]
  3. Venugopalan, A.; Srivastava, S. Endophytes as in vitro production platforms of high value plant secondary metabolites. Biotechnol. Adv. 2015, 33, 873–887. [Google Scholar] [CrossRef]
  4. Gakuubi, M.M.; Munusamy, M.; Liang, Z.X.; Ng, S.B. Fungal endophytes: A promising frontier for discovery of novel bioactive compounds. J. Fungi 2021, 7, 786. [Google Scholar] [CrossRef]
  5. Deshmukh, S.K.; Gupta, M.K.; Prakash, V.; Saxena, S. Endophytic fungi: A source of potential antifungal compounds. J. Fungi 2018, 4, 77. [Google Scholar] [CrossRef] [Green Version]
  6. Pal, P.P.; Shaik, A.B.; Begum, A.S. Prospective leads from endophytic fungi for anti-inflammatory drug discovery. Planta Med. 2020, 86, 941–959. [Google Scholar] [CrossRef] [PubMed] [Green Version]
  7. Keshri, P.K.; Rai, N.; Verma, A.; Kamble, S.C.; Barik, S.; Mishra, P.; Singh, S.K.; Salvi, P.; Gautam, V. Biological potential of bioactive metabolites derived from fungal endophytes associated with medicinal plants. Mycol. Prog. 2021, 20, 577–594. [Google Scholar] [CrossRef]
  8. Zheng, R.; Li, S.; Zhang, X.; Zhao, C. Biological activities of some new secondary metabolites isolated from endophytic fungi: A review study. Int. J. Mol. Sci. 2021, 22, 959. [Google Scholar] [CrossRef] [PubMed]
  9. Bang, S.; Baek, J.Y.; Kim, G.J.; Kim, J.; Kim, S.J.; Deyrup, S.T.; Choi, H.; Kang, K.S.; Shim, S.H. Azaphilones from an endophytic Penicillium sp. prevent neuronal cell death via inhibition of MAPKs and reduction of Bax/Bcl-2 ratio. J. Nat. Prod. 2021, 84, 2226–2237. [Google Scholar] [CrossRef] [PubMed]
  10. Cao, D.; Sun, P.; Bhowmick, S.; Wei, Y.H.; Guo, B.; Wei, Y.H.; Mur, L.A.J.; Sun, Z.L. Secondary metabolites of endophytic fungi isolated from Huperzia serrata. Fitoterapia 2021, 155, 104970. [Google Scholar] [CrossRef] [PubMed]
  11. Wang, Y.; Lai, Z.; Li, X.X.; Yan, R.M.; Zhang, Z.B.; Yang, H.L.; Zhu, D. Isolation, diversity and acetylcholinesterase inhibitory activity of the culturable endophytic fungi harboured in Huperzia serrata from Jinggang Mountain, China. World J. Microbiol. Biotechnol. 2016, 32, 20. [Google Scholar] [CrossRef] [PubMed]
  12. Wang, Y.; Zeng, Q.G.; Zhang, Z.B.; Yan, R.M.; Zhu, D. Isolation and characterization of endophytic huperzine a-producing fungi from Huperzia serrata. J. Ind. Microbiol. Biotechnol. 2010, 38, 1267–1278. [Google Scholar] [CrossRef] [PubMed]
  13. Singh, S.B.; Ondeyka, J.; Harris, G.; Herath, K.; Zink, D.; Vicente, F.; Bills, G.; Collado, J.; Platas, G.; González del Val, A.; et al. Isolation, structure, and biological activity of phaeofungin, a cyclic lipodepsipeptide from a Phaeosphaeria sp. using the genome-wide Candida albicans fitness test. J. Nat. Prod. 2013, 76, 334–345. [Google Scholar] [CrossRef] [PubMed]
  14. Karakoyun, Ç.; Küçüksolak, M.; Bilgi, E.; Doğan, G.; Çömlekçi, Y.E.; Bedir, E. Five new cardenolides transformed from oleandrin and nerigoside by Alternaria eureka 1e1bl1 and Phaeosphaeria sp. 1e4cs-1 and their cytotoxic activities. Phytochem. Lett. 2021, 41, 152–157. [Google Scholar] [CrossRef]
  15. Zhan, Z.J.; Jin, J.P.; Ying, Y.M.; Shan, W.G. Furanone derivatives from Aspergillus sp. xw-12, an endophytic fungus in Huperzia serrata. Helv. Chim. Acta 2011, 94, 1454–1458. [Google Scholar] [CrossRef]
  16. Husain, A.; Khan, S.A.; Iram, F.; Iqbal, M.A.; Asif, M. Insights into the chemistry and therapeutic potential of furanones: A versatile pharmacophore. Eur. J. Med. Chem. 2019, 191, 66–92. [Google Scholar] [CrossRef] [PubMed]
  17. Yurchenko, A.N.; Trinh, P.T.H.; Ivanets, E.V.G.; Smetanina, O.F.; Afiyatullov, S.S. Biologically active metabolites from the marine sediment-derived fungus Aspergillus flocculosus. Mar. Drugs 2019, 17, 579. [Google Scholar] [CrossRef] [PubMed] [Green Version]
  18. Liu, Y.; Li, X.M.; Meng, L.H.; Wang, B.G. Polyketides from the marine mangrove-derived fungus Aspergillus ochraceus MA-15 and their activity against aquatic pathogenic bacteria. Phytochem. Lett. 2015, 12, 232–236. [Google Scholar] [CrossRef]
  19. Hu, H.C.; Li, C.Y.; Tsai, Y.H.; Yang, D.Y.; Chang, F.R. Secondary metabolites and bioactivities of Aspergillus ochraceopetaliformis isolated from Anthurium brownii. ACS Omega 2020, 5, 20991–20999. [Google Scholar] [CrossRef] [PubMed]
  20. Tianpanich, K.; Prachya, S.; Wiyakrutta, S.; Mahidol, C.; Ruchirawat, S.; Kittakoop, P. Radical scavenging and antioxidant activities of isocoumarins and a phthalide from the endophytic fungus Colletotrichum sp. J. Nat. Prod. 2011, 74, 79–81. [Google Scholar] [CrossRef] [PubMed]
  21. Gao, W.; Wang, X.; Chen, F.; Li, C.; Cao, F.; Luo, D. Setosphlides A-D, New Isocoumarin Derivatives from the Entomogenous Fungus Setosphaeria rostrate LGWB-10. Natur. Prod. Bioprosp. 2021, 11, 137–142. [Google Scholar] [CrossRef]
  22. Ellman, G.L.; Courtney, K.D.; Andres, V.; Featherstone, R.M. A new and rapid colorimetric determination of acetylcholinesterase activity. Biochem. Pharmacol. 1961, 7, 88–95. [Google Scholar] [CrossRef]
  23. Ortiz, J.E.; Berkov, S.; Pigni, N.B.; Theoduloz, C.; Roitman, G.; Tapia, A.; Bastida, J.; Feresin, G. Wild Argentinian Amaryllidaceae, a new renewable source of the acetylcholinesterase inhibitor galanthamine and other alkaloids. Molecules 2012, 17, 13473–13482. [Google Scholar] [CrossRef] [PubMed] [Green Version]
  24. Sybyl Software; Version X 2.0; Tripos Associates Inc.: St. Louis, MO, USA, 2013.
  25. Neese, F. The ORCA program system. WIREs Comput. Mol. Sci. 2012, 2, 73–78. [Google Scholar] [CrossRef]
  26. Neese, F. Software update: The ORCA program system, version 4.0. WIREs Comput. Mol. Sci. 2017, 8, e1327. [Google Scholar] [CrossRef]
  27. Stephens, P.J.; Harada, N. ECD cotton effect approximated by the Gaussian curve and other methods. Chirality 2010, 22, 229–233. [Google Scholar] [CrossRef] [PubMed]
  28. National Center for Biotechnology Information. PubChem Compound Summary for CID 234614, 3-(Hydroxymethyl)-5-methylfuran-2(5h)-one. 2022. Available online: https://pubchem.ncbi.nlm.nih.gov/compound/3-_Hydroxymethyl_-5-methylfuran-2_5h_-one (accessed on 24 January 2022).
  29. Patel, R.M.; Puranik, V.G.; Argade, N.P. Regio- and stereoselective selenium dioxide allylic oxidation of (E)-dialkyl alkylidenesuccinates to (Z)-allylic alcohols: Synthesis of natural and unnatural butenolides. Org. Biomol. Chem. 2011, 9, 6312–6322. [Google Scholar] [CrossRef] [PubMed]
  30. Widmer, J.; Keller-Schierlein, W. Stoffwechselprodukte von Mikroorganismen. 139. Mitteilung. Synthesen in der Sideramin-Reihe: Rhodotorulasäure und Dimerumsäure. Helv. Chim. Acta 1974, 57, 1904–1912. [Google Scholar] [CrossRef]
  31. Li, L.J.; Tao, M.H.; Chen, Y.C.; Zheng, C.X.; Huo, G.H.; Zhang, W.M. Secondary metabolites from the solid culture of marine fungal strain Penicillium sclerotiorum FS50. Mycosystema 2015, 34, 117–123. Available online: http://en.cnki.com.cn/Article_en/CJFDTOTAL-JWXT201501016.htm (accessed on 12 January 2022).
  32. de Sá, J.D.M.; Pereira, J.A.; Dethoup, T.; Cidade, H.; Sousa, M.E.; Rodrigues, I.C.; Costa, P.M.; Mistry, S.; Silva, A.M.S.; Kijjoa, A. Anthraquinones, diphenyl ethers, and their derivatives from the culture of the marine sponge-associated fungus Neosartorya spinosa KUFA 1047. Mar. Drugs 2021, 19, 457. [Google Scholar] [CrossRef] [PubMed]
  33. Feng, L.X.; Zhang, B.Y.; Zhu, H.J.; Pan, L.; Cao, F. Bioactive metabolites from Talaromyces purpureogenus, an endophytic fungus from Panax notoginseng. Chem. Nat. Comp. 2020, 56, 974–976. [Google Scholar] [CrossRef]
  34. Hallock, Y.F.; Clardy, J.; Kenfield, D.S.; Strobel, G. De-O-methyldiaporthin, a phytotoxin from Drechslera siccans. Phytochemistry 1988, 27, 3123–3125. [Google Scholar] [CrossRef]
  35. Zhang, X.Q.; Qu, H.R.; Bao, S.S.; Deng, Z.S.; Guo, Z.Y. Secondary metabolites from the endophytic fungus Xylariales sp. and their antimicrobial activity. Chem. Nat. Comp. 2020, 56, 530–532. [Google Scholar] [CrossRef]
  36. Chen, X.W.; Li, C.W.; Cui, C.B.; Hua, W.; Zhu, T.J.; Gu, Q.Q. Nine new and five known polyketides derived from a deep sea-sourced Aspergillus sp. 16-02-1. Mar. Drugs 2014, 12, 3116–3137. [Google Scholar] [CrossRef] [Green Version]
  37. Hussain, H.; Green, I.R. A patent review of two fruitful decades (1997–2016) of isocoumarin research. Expert Opin. Ther. Pat. 2017, 27, 1267–1275. [Google Scholar] [CrossRef]
  38. Xiang, P.; Ludwig-Radtke, L.; Yin, W.B.; Li, S.M. Isocoumarin formation by heterologous gene expression and modification by host enzymes. Org. Biomol. Chem. 2020, 18, 4946–4948. [Google Scholar] [CrossRef]
  39. Sonmez, F.; Zengin Kurt, B.; Gazioglu, I.; Basile, L.; Dag, A.; Cappello, V.; Ginex, T.; Kucukislamoglu, M.; Guccione, S. Design, synthesis and docking study of novel coumarin ligands as potential selective acetylcholinesterase inhibitors. J. Enzyme Inhib. Med. Chem. 2017, 32, 285–297. [Google Scholar] [CrossRef] [Green Version]
  40. Yuan, C.; Guo, Y.H.; Li, G.; Wu, C.S.; Li, M. Metabolites of endophytic fungus Elaphocordyceps sp. Microbiol. China 2014, 41, 857–861. [Google Scholar]
Figure 1. Chemical structure of compounds 1–11.
Jof 08 00232 g001
Figure 2. Signal assignments of compound 4 via 13C and 2D NMR.
Jof 08 00232 g002
Figure 3. Experimental ECD spectra (200–400 nm) of 4 in MeOH and the calculated ECD spectra of the model molecules of 4 at the PBE0/def2-TZVP level.
Jof 08 00232 g003
Figure 4. Calculated 13C chemical shifts against the experimental data of 4.
Jof 08 00232 g004
Figure 5. Signal assignment of compound 7 via 13C and 2D NMR.
Jof 08 00232 g005
Figure 6. Experimental ECD spectra (200–400 nm) of 7 in methanol and the calculated ECD spectra of the model molecules of 7 at the PBE0/def2-TZVP level.
Jof 08 00232 g006
Figure 7. Signal assignment of compound 9 via 13C and HMBC.
Jof 08 00232 g007
Figure 8. Experimental ECD spectra (200–400 nm) of 9 in methanol and the calculated ECD spectra of the model molecules of 9 at the PBE0/def2-TZVP level.
Jof 08 00232 g008
Figure 9. Experimental ECD spectra (200–400 nm) of 11 in methanol and the calculated ECD spectra of the model molecules of 11 at the PBE0/def2-TZVP level.
Jof 08 00232 g009
Scheme 1. Proposed biosynthetic pathways for furanone compounds (14).
Jof 08 00232 sch001
Scheme 2. Proposed biosynthetic pathways for isocoumarin compounds (811).
Jof 08 00232 sch002
Table 1. The 1H, 13C, HMBC, and HSQC NMR data for compound 4 in CD3OD.
No.1H NMR13C NMRHMBCHSQC
2176.5 (s)H-4, H-7
3131.7 (s)H-4, H-7, H-8
47.36 (1H, br s)154.2 (d)H-5, H-6, H-77.36
55.09 (1H, br q, 6.8)79.8 (d)H-4, H-65.09
61.39 (3H, d, 6.8)19.1 (q)H-51.39
72.30 (1H, br dd, 15.2, 9.1); 2.59 (1H, br d, 15.2)29.6 (t)H-8, H-92.30, 2.59
83.60 (1H, m)74.8 (d)H-7, H-9, H-103.60
93.58 (1H, m)71.6 (d)H-8, H-103.58
101.20 (3H, d, 6.1)18.9 (q)H-8, H-91.20
Table 2. The 1H, 13C, HMBC, and HSQC NMR data for compound 7 in CD3OD.
No.1H NMR13C NMRHMBCHSQC(δ)
2166.9 (s)H-3, H-8
37.89 (1H, br s)117.5 (d)H-57.89
4142.2 (s)
57.67 (1H, br s)122.6 (d)H-3, H-107.67
6159.5 (s)H-10, H-5
74.89 (1H, overlapped)71.1 (d)H-84.89
81.46 (3H, d, 6.6)24.4 (q)H-71.36
9168.4 (s)H-3, H-5
102.59 (3H, s)23.7 (q)H-52.59
Table 3. The 1H, 13C, HMBC, and HSQC NMR data for compound 9 in DMSO-d6.
No.1HNMR13C NMRHMBCHSQC
1165.54
3157.6H-4
46.61 (1H, s)104.46.61
4a139.2
56.43 (1H, s)102.9H-4, H-76.43
610.88 (OH, s)165.3H-7
76.33 (1H, s)101.56.33
811.00 (OH, s)162.5H-7
8a97.8H-4, H-5, H-7
1′3.97 (1H, dd)74.7H-4, H-3′3.97
2′3.80 (1H, dq)67.4H-1′, H-3′3.80
3′1.12 (3H, d)19.7H-1′1.12
Table 4. Acetylcholinesterase inhibitory activities of the secondary metabolites of Phaeosphaeria sp. LF5, expressed as IC50 values.
CompoundIC50 (µM) a CompoundsIC50 (µM) a
1>1006>100
2>1007>100
3>1008>100
46.26 ± 0.159>100
5>10010>100
Rivastigmine1.82 ± 0.131121.18 ± 1.53
Hup-A0.045 ± 0.01
a Expressed as the mean ± SD of three parallel measurements (p < 0.05).
Publisher’s Note: MDPI stays neutral with regard to jurisdictional claims in published maps and institutional affiliations.

