Article

The SsAtg1 Activating Autophagy Is Required for Sclerotia Formation and Pathogenicity in Sclerotinia sclerotiorum

College of Plant Sciences, Jilin University, Changchun 130012, China
*
Authors to whom correspondence should be addressed.
J. Fungi 2022, 8(12), 1314; https://doi.org/10.3390/jof8121314
Submission received: 17 September 2022 / Revised: 24 November 2022 / Accepted: 15 December 2022 / Published: 17 December 2022
(This article belongs to the Section Fungal Pathogenesis and Disease Control)

Abstract

:
Sclerotinia sclerotiorum is a necrotrophic phytopathogenic fungus that produces sclerotia. Sclerotia are essential components of the survival and disease cycle of this devastating pathogen. In this study, we analyzed comparative transcriptomics of hyphae and sclerotia. A total of 1959 differentially expressed genes, 919 down-regulated and 1040 up-regulated, were identified. Transcriptomes data provide the possibility to precisely comprehend the sclerotia development. We further analyzed the differentially expressed genes (DEGs) in sclerotia to explore the molecular mechanism of sclerotia development, which include ribosome biogenesis and translation, melanin biosynthesis, autophagy and reactivate oxygen metabolism. Among these, the autophagy-related gene SsAtg1 was up-regulated in sclerotia. Atg1 homologs play critical roles in autophagy, a ubiquitous and evolutionarily highly conserved cellular mechanism for turnover of intracellular materials in eukaryotes. Therefore, we investigated the function of SsAtg1 to explore the function of the autophagy pathway in S. sclerotiorum. Deficiency of SsAtg1 inhibited autophagosome accumulation in the vacuoles of nitrogen-starved cells. Notably, ΔSsAtg1 was unable to form sclerotia and displayed defects in vegetative growth under conditions of nutrient restriction. Furthermore, the development and penetration of the compound appressoria in ΔSsAtg1 was abnormal. Pathogenicity analysis showed that SsAtg1 was required for full virulence of S. sclerotiorum. Taken together, these results indicate that SsAtg1 is a core autophagy-related gene that has vital functions in nutrient utilization, sclerotia development and pathogenicity in S. sclerotiorum.

1. Introduction

Sclerotinia sclerotiorum (Lib.) de Bary, a homothallic necrotrophic type phytopathogenic fungus, has an extensive host range [1,2]. Multicellular development is a significant characteristic of S. sclerotiorum, which contain sclerotia, compound appressoria and apothecia [3,4]. Sclerotia as a central stage of the life and infection cycle of S. sclerotiorum, is not only the long-term survival structure, but also an indispensable part of asexual and sexual reproduction [5,6]. The formation of sclerotia is subject to complex and exquisite regulation, including the cAMP/PKA pathway, MAPK pathway and autophagy [7,8,9,10].
Autophagy is a ubiquitous and evolutionarily highly conserved cellular reaction mechanism for turnover of intracellular materials in eukaryotes [11,12]. During the process of growth and differentiation, in the face of external environmental stress such as nutrient deficiency and hypoxia, cells initiate autophagy to degrade organelles to provide basic energy for cell survival [11,13,14,15]. In filamentous fungi, autophagy is correlated with nutrient balance, secondary metabolism, cell differentiation and pathogenicity [11,13,16]. MoAtg8 interaction with MoAtg4 determines the cell differentiation and pathogenicity of Magnaporthe oryzae, meanwhile, loss of MoAtg8 leads to the obstruction of sexual reproduction and delayed perithecium formation [17]. In Botrytis cinerea, the autophagy pathway was blocked after deletion of BcAtg3, BcAtg7 and BcAtg8 genes, and the mycelial growth, sclerotia formation and virulence of the mutants were significantly defective [18,19]. FgAtg15 encodes a lipolytic enzyme that is involved in many developmental processes of Fusarium graminearum. The virulence of the FgAtg15 mutant was decreased, and the production of DON toxin by the FgAtg15 mutant was markedly lower than the wild type [20].
The autophagy related protein Atg1 belongs to the serine/threonine protein kinase family and is the unique protein kinase among yeast autophagy-related proteins. The ATG1-ATG13-ATG17 complex with regulatory subunit Atg13 and scaffold protein Atg17 at the initiation stage of autophagy is recruited to autophagosomes at PAS (pre-autophagosomal structure) adjacent to vacuoles to form related proteins [21,22]. Deletion of MoAtg1 in M. oryzae leads to defects including loss of virulence, reduced sporulation, reduced conidial lipid droplets, malformation and inadequate turgor pressure of appressorium [11]. In B. cinerea, BcATG1 deficiency inhibited the accumulation of autophagosomes induced by nitrogen starvation and significantly impaired vegetative growth, conidia and sclerotia formation [23]. FgATG1 affects sporulation and pathogenicity of F. graminearum [24]. Atg1, as a core gene that induces autophagy, can coordinate complex signaling pathways to precisely regulate autophagosome formation and plays a crucial role in response to stress and other biological pathways [25]. The Atg1 complex can respond to the TOR kinase. In M. Oryzae, the TOR kinase was inhibited under starvation and stress, leading to Atg1 phosphorylation and Atg13 dephosphorylation, forming the Atg1 complex and inducing autophagy [11,16]. Although MAPK and cAMP/PKA pathways have been substantiated to have significant influence in sclerotia formation and pathogenicity of S. sclerotiorum [7,26,27,28], the biological function of the autophagy-related protein Atg1 in S. sclerotiorum has not been studied.
In this research, RNA sequencing was used to investigate the transcriptomic dynamics of sclerotia development, DEGs at the sclerotial stage were utilized to investigate the molecular mechanism of sclerotia development, which include ribosomal biogenesis, melanin biosynthesis, cell wall/membrane/envelope biogenesis, autophagy and ubiquitination, reactivate oxygen metabolism and signal transduction. Moreover, we identified Atg1, a serine/threonine kinase homolog in S. sclerotiorum designated SsAtg1 and further investigated the function of SsAtg1. After deletion of SsAtg1, autophagosomes could not be induced. SsAtg1 is indispensable for sclerotia formation and full virulence of S. sclerotiorum. These results demonstrate that the autophagy pathway plays a necessary role in the asexual reproduction and pathogenicity in this necrotrophic fungus.

2. Materials and Methods

2.1. Strains and Culture Condition

Sclerotinia sclerotiorum UF-1 used as the wild-type strain in this study was provided by J. Rollins, University of Florida. ∆SsAtg1 and ∆SsAtg1-c (complemented strain) were grown on PDA (200 g potato, 20 g glucose, 15 g agar per liter) at 25 °C [29].

2.2. Gene Functional Annotation and Differential Gene Expression Analysis

Based on sequencing by synthesis (SBS) technology, Illumina HiSeq high-throughput sequencing platform was used to sequence cDNA libraries and produced a large amount of high-quality data (BioMarker). A fold change of ≥2 and a false discovery rate (FDR) < 0.01 were used as the criteria for identifying differentially expressed genes (DEGs). Gene functions were annotated by KEGG (Kyoto Encyclopedia of Genes and Genomes) [30], GO (Gene Ontology) [31], Swiss-Prot [32] and Pfam (Protein family) [33].

2.3. Identification and Sequence Information of SsAtg1

The Atg1 phylogenetic tree was constructed by neighbor-joining method with 1000 bootstrap replicates in MEGA7. Conserved domains of SsAtg1 sequence were analyzed by NCBI (https://www.ncbi.nlm.nih.gov/, accessed on 18 February 2022) and Interpro (http://www.ebi.ac.uk/interpro, accessed on 18 February 2022), and distribution and visualization of domains performed by GPS [9].

2.4. Plasmid Constructs and Transformation

We used split-marker PCR [34] to obtain gene knockout fragments: nucleotide sequences FR1 and FR2 were amplified by SsAtg1FP1/SsAtg1RP1 and SsAtg1FP2/SsAtg1RP2, respectively. The hygromycin resistance genes were amplified from the containing pUCATPH vector to obtain overlapping HY and YG fragments using M13R/NLC37 and M13F/NLC38 [34]. Then, FR1/HY and FR2/YG were used as templates fused by SsAtg1 FP1/NLC37 and SsAtg1RP2/NLC38 to obtain final knockout fragments. Plasmid pYF11 was used for the overexpression of SsAtg1. The PEG-mediated transformation method was used to transform the two sequences into the protoplasts of S. sclerotiorum, which was performed as previous described [35,36] with some modification: composition of enzyme solution: NaCl (0.7 M 15 mL), cellulase (150 mg) (Solarbio Cellulase R-10 C8260), Driselase (100 mg) (Sigma D9515). Transformants were purified by using hygromycin (100 μg/mL) and geneticin (100 μg/mL) hyphal-tip selected at least five times, respectively. Information on primers can be found in Table S10.

2.5. Stress Treatment

The cell integrity of strains was evaluated by growth on PDA with Congo Red (CR, 0.5 mg/mL), Calcofluor white (CFW, 10 μg/mL) and 0.001% sodium dodecyl sulphate (SDS). To analyze hypersensitivity to ROS, strains were inoculated on PDA supplemented with different concentration of H2O2 (5, 10 mM). For exploring nutrient uptake, strains were grown on CM (0.2 g KH2PO4, 0.25 g MgSO4·7H2O, 0.15 g NaCl, 1 g Ca(NO3)2·4H2O, 10 g glucose, 1 g yeast extract, 1 g casein hydrolysate, 15 g agar per liter), MM (CM lacking 1 g yeast extract and 1 g casein hydrolysate), MM-N (remove Ca(NO3)2·4H2O from the MM), MM-C (MM lacking glucose) and MM-P (MM lacking KH2PO4).

2.6. Analysis of Compound Appressoria, Sclerotia Formation and Pathogenicity

Glass slides (hydrophobic surface) and onion epidermal peels were used as two different substrata to compare the formation of compound appressoria between WT, ∆SsAtg1 and ∆SsAtg1-c. Image J software was used to quantify the compound appressoria formed on glass slides. Lactophenol cotton blue solution (Sigma) was used to stain the compound appressoria on the onion epidermis, but the invasive hyphae that penetrated onion epidermis did not stain. Sclerotia development was photographed and counted four weeks after culture. To analyze pathogenicity, mycelia-colonized plugs (d = 0.5 mm) were inoculated on soybean leaves and tobacco (Nicotiana benthamiana), the lesion areas on leaves were measured after 48 h by image J. Experiments were conducted three times.

2.7. Quantitative Real-Time PCR Analysis

As ∆SsAtg1 does not produce sclerotia, in the process of exploring sclerotia development, we obtained mycelia samples of ∆SsAtg1 parallel to the time point of appearance of WT sclerotia or melanized sclerotia. Mycelia and sclerotia samples of wild type and ∆SsAtg1 were obtained, respectively, at the same time. TransZol Up Plus RNA Kit (TransGen Biotech, Beijing, China) was used for total RNA extraction after freezing and grinding in liquid nitrogen. EasyScript All-In-one First-strand cDNA Synthesis SuperMix for Qpcr (One-step Gdna Removal) (TransGen Biotech, Beijing) was used to synthesize cDNA. Gene expression was measured by TransStart Green Qpcr SuperMix (TransGen Biotech, Beijing). NCBI primer was used to design a primer which was used to measure gene expression levels, and actin was used as internal reference.

2.8. Autophagy Assay

To visualize the autophagic process in S. sclerotiorum, monodansylcadaverine (MDC) was used as a fluorescent pigment to detect specific markers of autophagosome formation. The autophagosomes were observed in the mycelia of WT and ΔssAtg1 cultured in liquid CM at 25 °C for 24 h, then transferred to liquid MM-N for 6 h, the monodansylcadaverine (MDC) kit (Beijing Solarbio Science & Technology Co., Ltd., Beijing, China) was used to stain autophagosome, and then viewed under epi-fluorescence microscopy.

3. Results

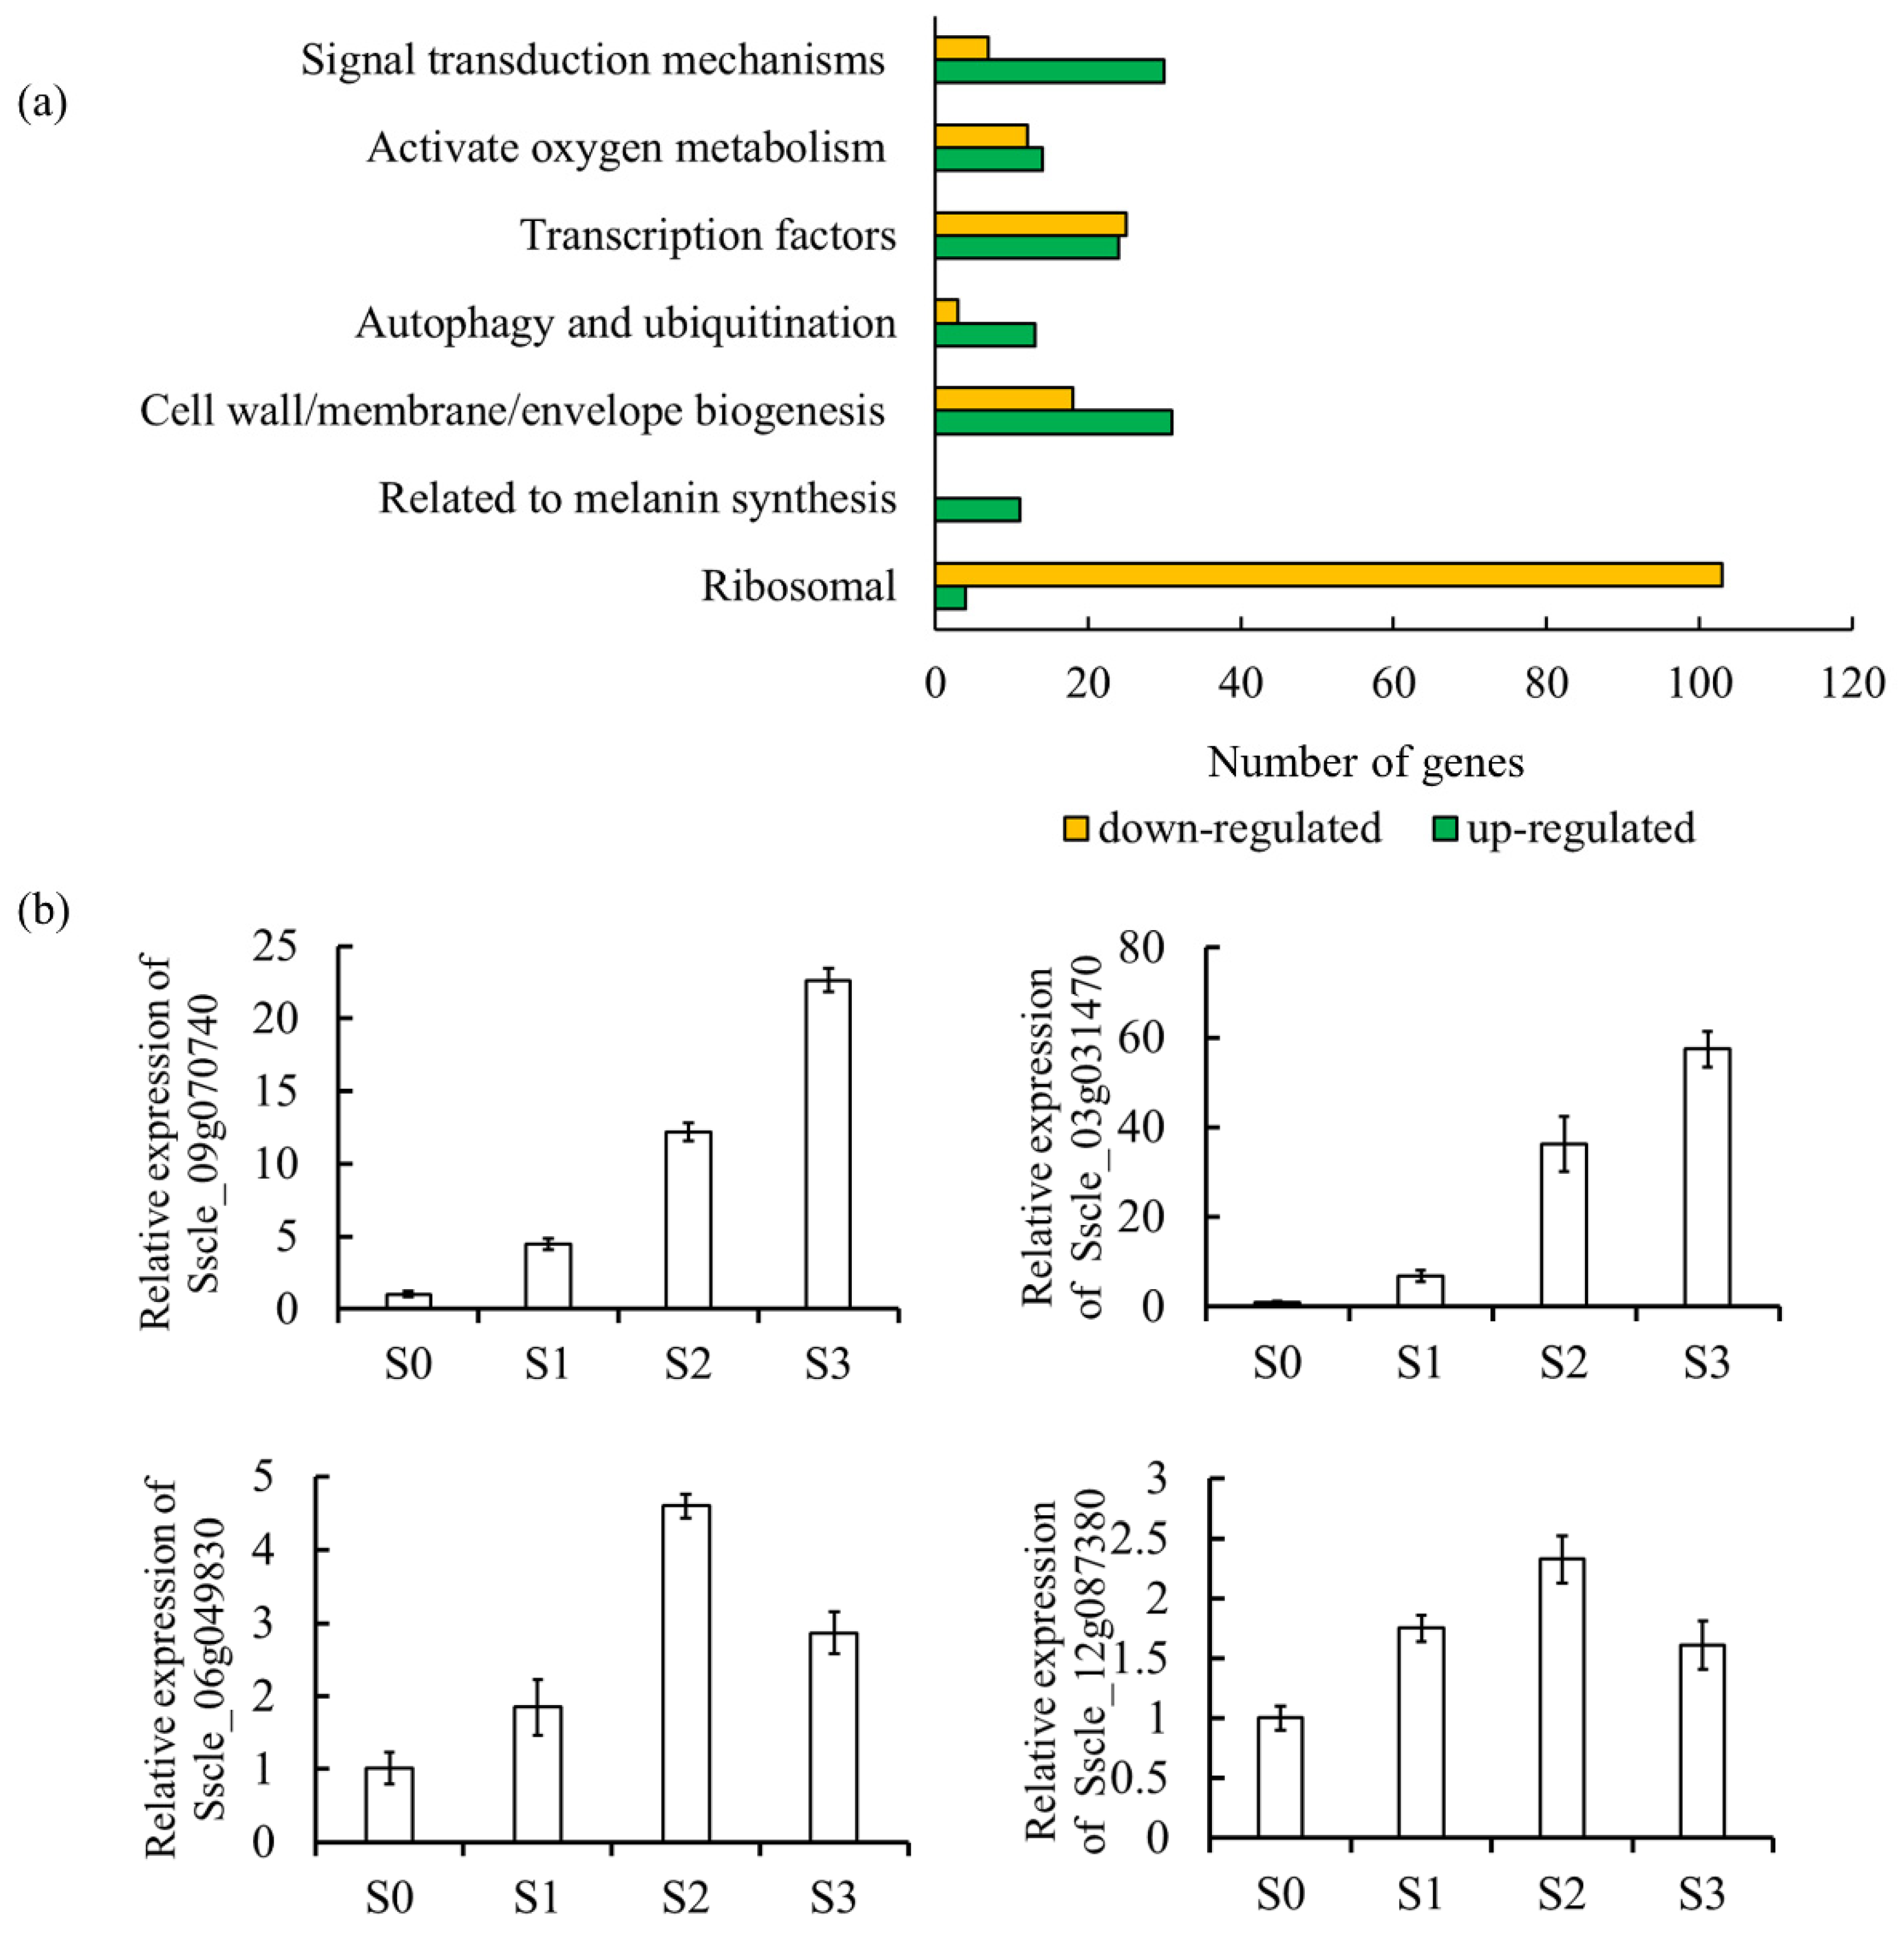
3.1. Transcriptome Analysis Reveals Melanin, Reactive Oxygen and Autophagy Are Associated with Sclerotia Development in S. sclerotiorum

In order to explore the mechanism of sclerotia formation, we analyzed differentially expressed genes in hyphae and sclerotia by transcriptomic analysis. In total, 1959 differentially expressed genes (DEGs) were obtained, of which 1040 were up-regulated and 919 were down-regulated. COG (clusters of orthologous groups) was used to annotate 1125 functional genes (Table S1), and GO annotation was used to annotate functional genes within three branches of biological process (1043), cellular component (694) and molecular function (1036) (Figure S1a,b, Tables S1 and S2). Ribosome biogenesis, melanin synthesis, cell wall/membrane/envelope biogenesis, autophagy and ubiquitination, transcription factor, reactivate oxygen metabolism and signal transduction mechanisms were vital biological functions, which were all annotated in DEGs (Figure 1a). The genes with differential expression levels were selected for verification and found to have similar expression trends as those in the transcriptome, indicating that the transcriptome data results were reliable and could be further analyzed (Figure 1b).

3.1.1. Melanin Plays an Important Role in Sclerotia Development

Melanin confers resistance to sclerotia under adverse climatic and soil conditions. Melanogenesis of dihydroxynaphthalene (DHN) is synthesized through the pentaketide pathway, which has also been verified in S. sclerotiorum [37,38]. Scytalone dehydratases (Sscle_03g031470), trihydroxynaphthalene reductase (Sscle_09g070740) and laccase (Sscle_02g018680, Sscle_02g021570, Sscle_12g090390), which contribute to melanin biosynthesis, were remarkably increased in the sclerotia stage (Table S3).

3.1.2. Cell Wall/Membrane/Envelope Biogenesis

The formation of sclerotia is accompanied by cell wall thickening. In the transcriptome analysis, it was found that the expression of genes related to the formation of the cell wall increased in the sclerotia stage including chitin synthase (Sscle_14g099740, Sscle_02g018150) and glucan 1,3-beta-glucosidase (Sscle_01g002030). In contrast, the expression levels of genes related to cell membrane structure were mostly decreased in the sclerotia stage including ergosterol synthesis genes ERG6 (Sscle_10g080660, Sscle_11g085920, Sscle_07g056400), ERG3 (Sscle_02g021190, Sscle_14g100930) and ERG24 (Sscle_06g051840). Glutamine-fructose 6-phosphate aminotransferase (Sscle_02g019730), a rate-limiting enzyme in the synthesis of uridine 5 ‘-diphospho-N-acetyl glucosamine (UDP-GlCNAC), also decreased in the sclerotia stage (Table S4).

3.1.3. Ribosome Biogenesis and Translation

Ribosomes, composed of ribosomal RNA and dozens of different ribosomal proteins, are molecular machines for protein synthesis in cells. In the sclerotia stage, 103 genes related to ribosome structure, function and synthesis were down-regulated, indicating that ribosome activities, such as mRNA translation and protein folding, were reduced in the sclerotia stage (Tables S5 and S6).

3.1.4. Reactive Oxygen Metabolism

Catalase and superoxide dismutase are important intracellular enzymes that metabolize reactive oxygen species. Superoxide dismutase catalyzes the disproportionation of superoxide anion radical (O2) to H2O2 and O2, while catalase catalyzes the decomposition of H2O2 into O2 and H2O. The increased expression levels of catalase (Sscle_01g011560, Sscle_04g037170, Sscle_15g104430) and superoxide dismutase (Sscle_05g043700) encoding genes suggests that a large amount of reactive oxygen species may be produced in the sclerotia-forming stage. In contrast, the expression of glutathione reductase (Sscle_09g070370), thioredoxin reductase (Sscle_05g046390) and NADPH-cytochrome P450 reductase (Sscle_10g078540, Sscle_07g060800) were decreased in the sclerotia-forming stage. These results further indicate that oxidative stress plays an important role in the development of sclerotia (Table S7).

3.1.5. Autophagy

Autophagy is a ubiquitous programmed cell degradation mechanism in eukaryotic cells, that can remove and degrade the excess biological macromolecules produced in biological processes and use the degraded substances for energy supply and cell structure reconstruction. The expression of autophagy related genes SsAtg1 (Sscle_12g087380) and SsAtg13 (Sscle_15g103100) were increased in the sclerotia-forming stage (Table S8). As a core gene for autophagy induction, Atg1 can coordinate complex signaling pathways to precisely regulate autophagosome formation and plays a crucial role in response to stress, growth and development and other biological pathways. The above results provide strong evidence for the important role of the autophagy pathway in sclerotia formation. In order to further explore the mechanism of autophagy on sclerotia development, the biological function of SsAtg1 was further studied.

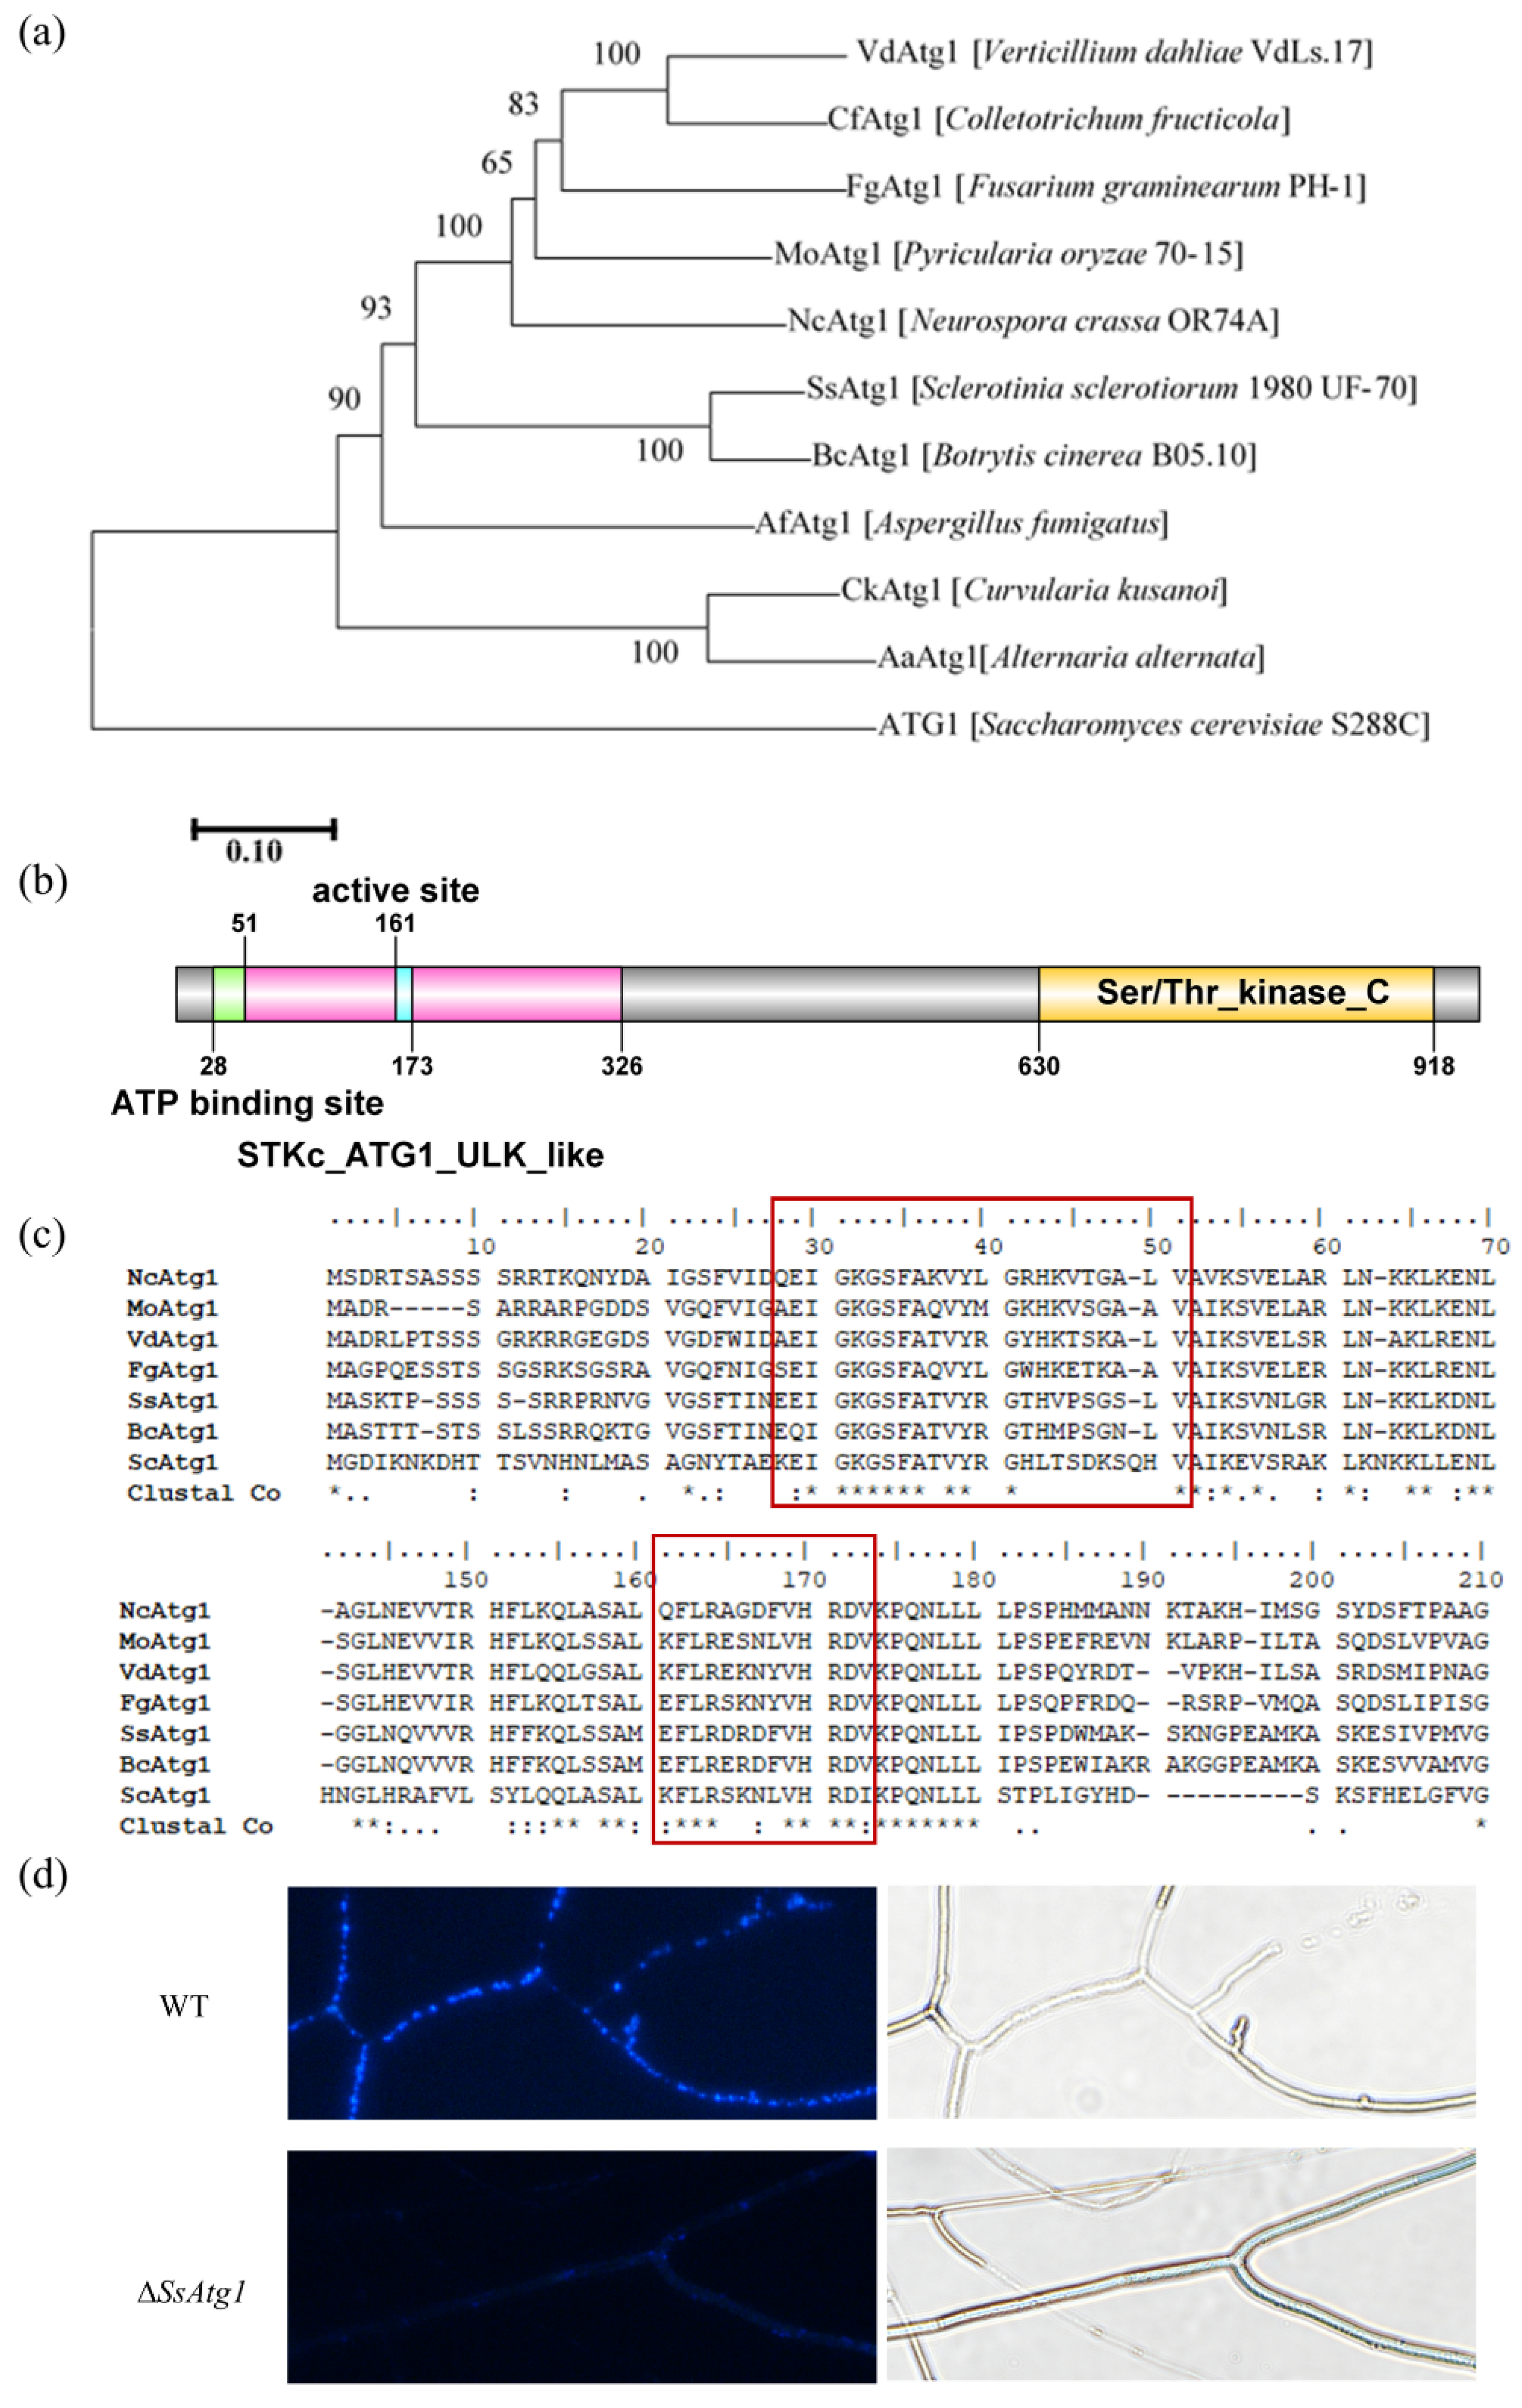
3.2. SsAtg1 Is a Key Gene Regulating Autophagy in S. sclerotiorum

Phylogenetic analysis of the autophagy-related gene SsAtg1 (Sscle_12g087380) with yeast and plant pathogenic fungi found that SsAtg1 and BcAtg1 (B. cinerea) were in the same clade (Figure 2a). Further sequence analysis revealed that SsAtg1 encoded 951 amino acids which contain STKc_ATG1_ULK_like (CD14009) and Ser/Thr_kinase_C (IPR022708) conserved domains in the N-terminal and C-terminal, respectively. Position 28-51 contains a protein kinase ATP binding site (IPR017441) and a serine/threonine-protein kinase active site (IPR008271) at position 161–173 (Figure 2b). Analysis of ATG1 amino acid sequences from plant pathogenic fungi and yeast revealed that the active site of ATG1 was conserved at the serine/threonine-protein kinase active site (161–173) and the protein kinase ATP binding site (28-51). (Figure 2c). For the purpose of analyzing the biological functions of SsAtg1 in S. sclerotiorum, SsAtg1 was replaced with a hygromycin resistance gene by split-marker PCR, and UF/NLC37 and DR/NLC38 were used to verify that the HYG cassette replaced SsAtg1 at the correct position. Primers SsAtg1 FP3/ SsAtg1 RP3 were used for PCR to verify the SsAtg1 gene deletion (Figure S2a,b). Moreover, we investigated the expression of SsAtg1 between the mutant and WT by RT-qPCR and found that the expression level was only 0.001 (Figure S2c), confirming that the SsAtg1 mutant could be used in subsequent studies and split-marker PCR can be used for gene function studies in S. sclerotiorum. After nitrogen starvation induced autophagy, obvious autophagosome formation was observed in the wild type after treatment with MDC fluorescent dye, while no obvious autophagosomes were observed in ∆SsAtg1 (Figure 2d).

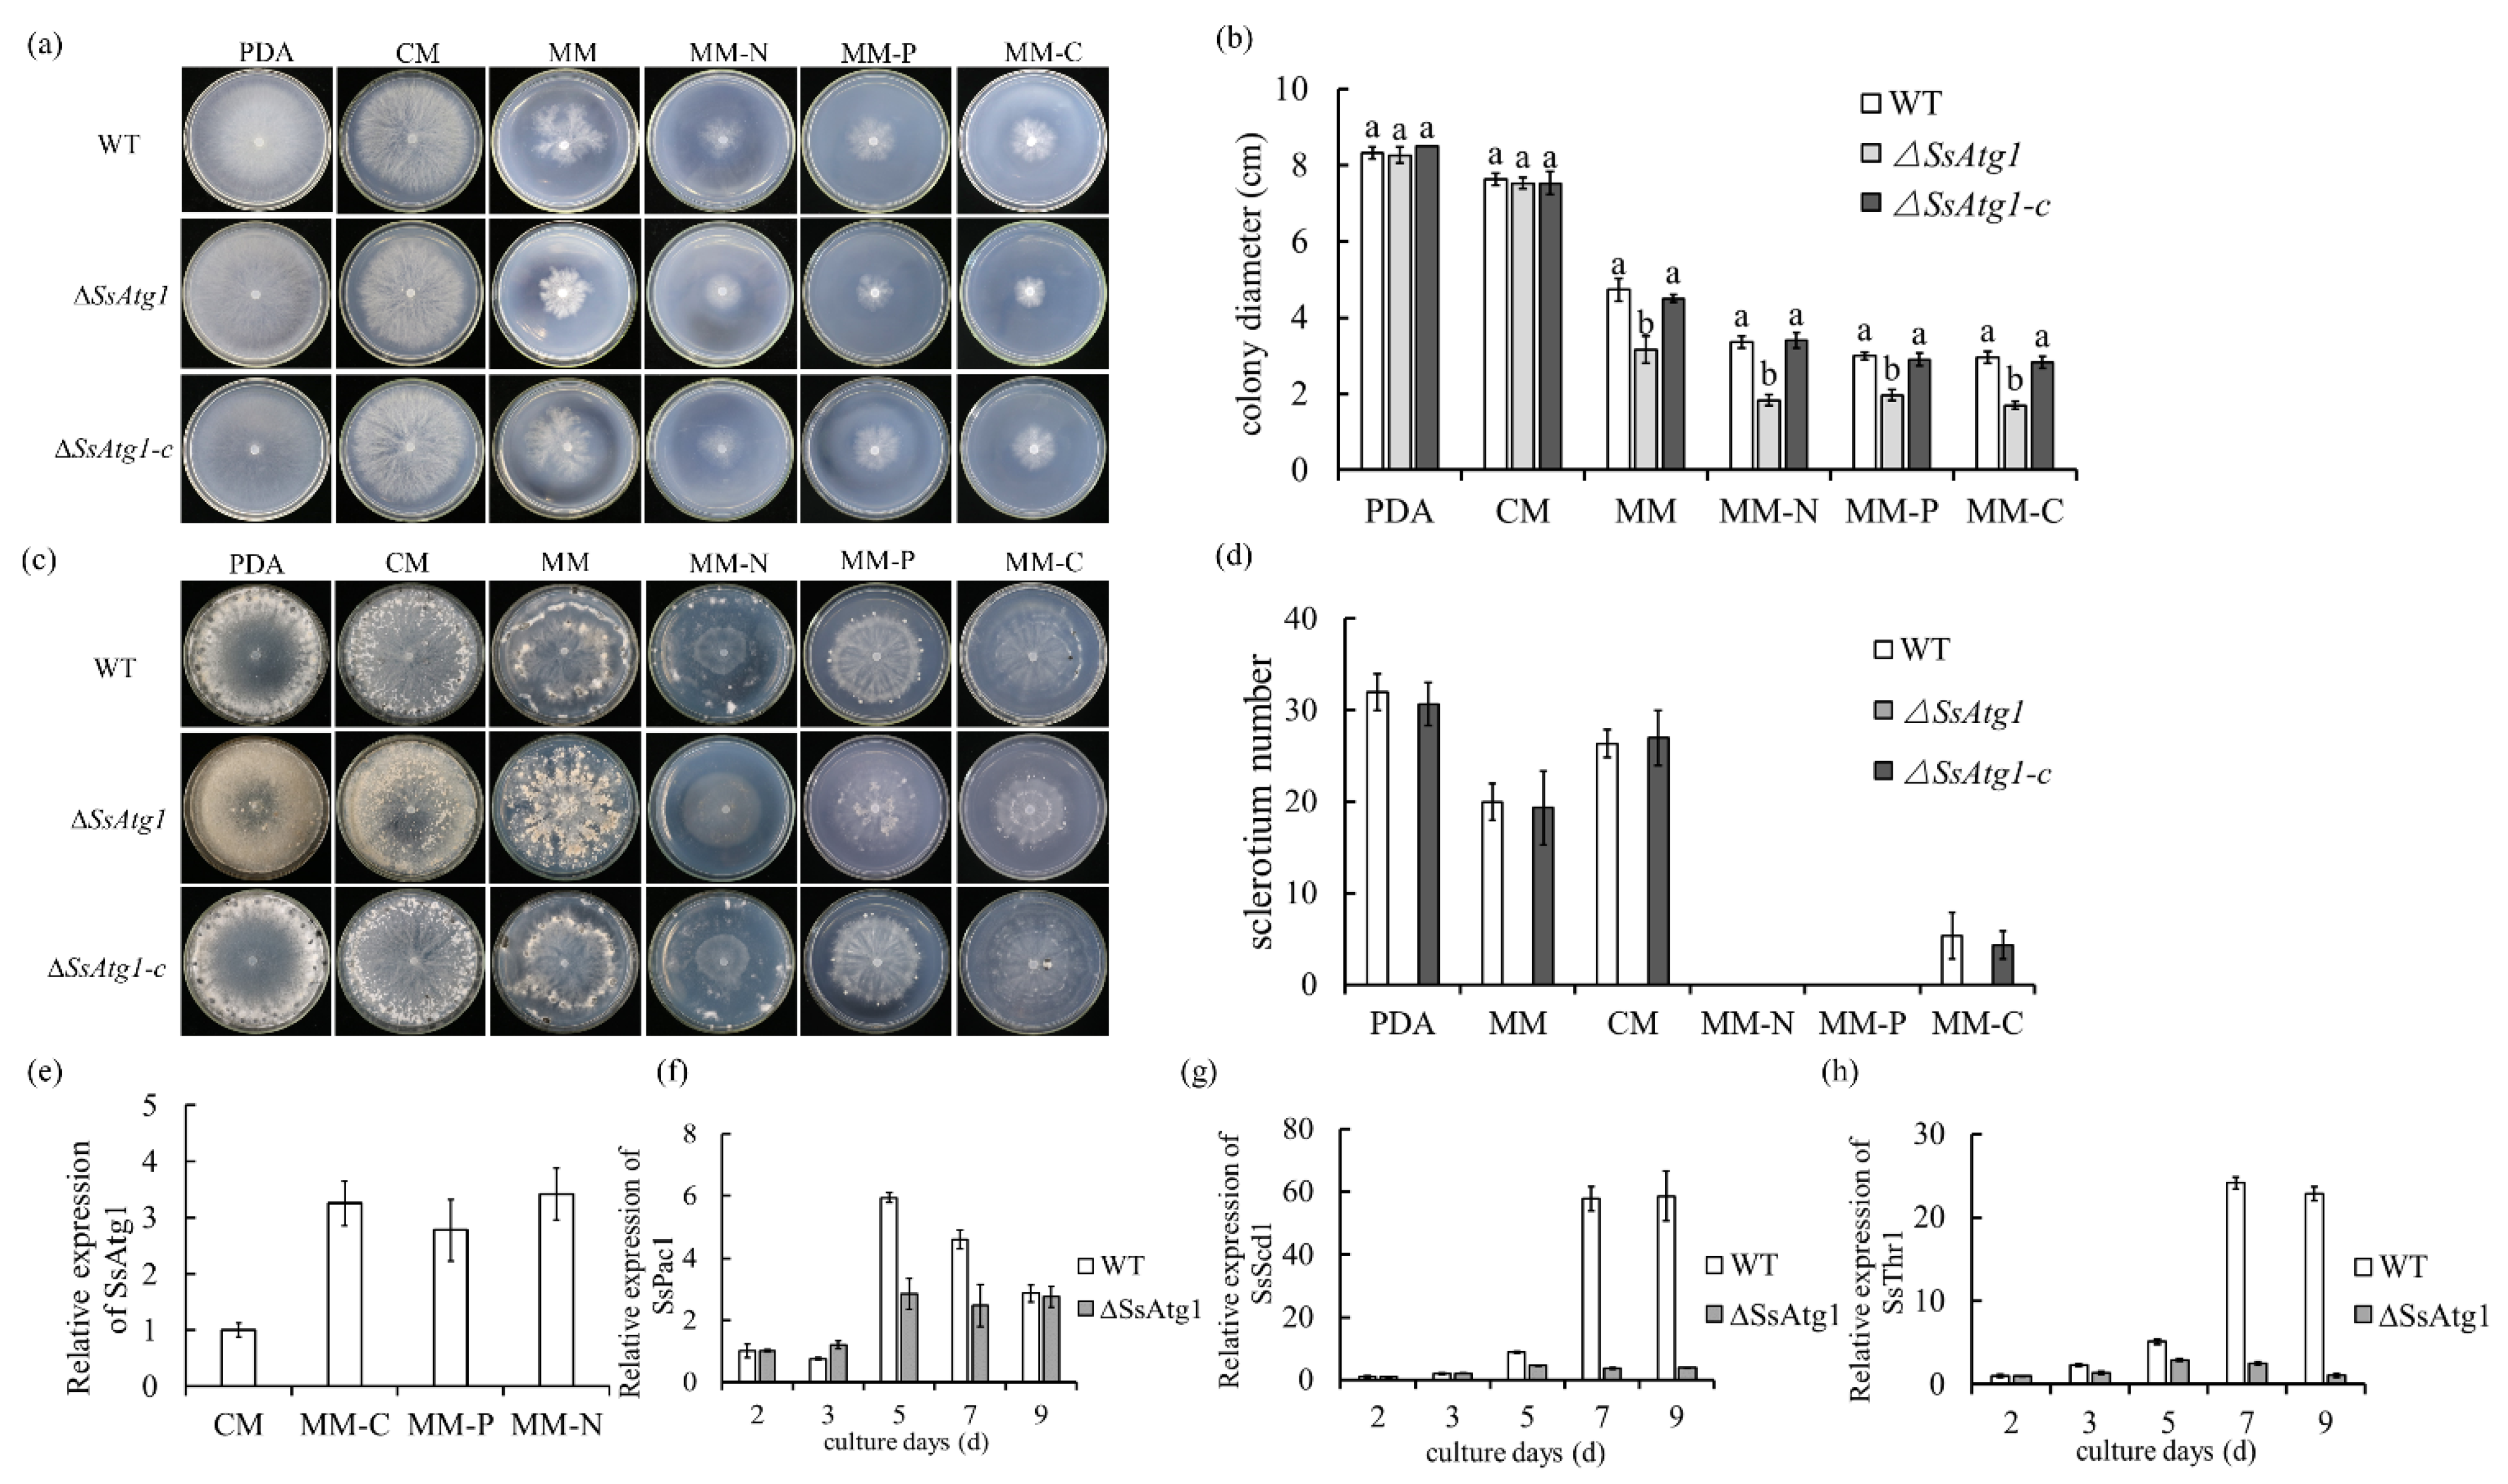
3.3. SsAtg1 Is Indispensable for Mycelial Growth and Sclerotia Formation in S. sclerotiorum

Previously, we measured transcript accumulation of the SsAtg1 (Sscle_12g087380) gene during the sclerotia formation stage and found that the expression level of SsAtg1 in the early sclerotia formation and sclerotia development stages was significantly higher than that in the mycelia stage. This result further indicates that the autophagy pathway regulated by SsAtg1 was important in the formation and development of sclerotia (Figure 1b). Phenotype observation of wild type, ∆SsAtg1 and SsAtg1 complement transformant (∆SsAtg1-c) on PDA, MM and CM media showed that colony diameter of wild type, ∆SsAtg1 and ∆SsAtg1-c displayed no significant difference on PDA and CM media, but colony diameter of ∆SsAtg1 on MM, MM-N, MM-C and MM-P media was more restrained than that of wild type and ∆SsAtg1-c. These results indicated that SsAtg1 affects vegetative growth and participates in nutrient utilization (Figure 3a,b).
Observations of sclerotia formation were conducted following four weeks of growth. Results showed that ∆SsAtg1 could not form sclerotia on PDA, MM or CM media, and the colony color was darker than that of the wild type. On MM-N medium, which is a standard growth medium for induction of autophagy, the mycelial growth of ∆SsAtg1 was restricted, and neither the wild type nor ∆SsAtg1 could form sclerotia. These results further suggest that the initiation and mediation of autophagy are crucial to the initiation of sclerotia development and SsAtg1 may affect secondary metabolism of S. sclerotiorum (Figure 3c,d).
Due to the nutritional deficiency phenotype of ∆SsAtg1, we measured the expression of SsAtg1 under nutritional deficiency. The results showed that SsAtg1 was significantly upregulated under MM-N, MM-C and MM-P which indicates that SsAtg1 could regulate the growth of mycelia and the development of sclerotia in response to nutritional deficiency signals (Figure 3e). Subsequently, we explored relative expression of SsPac1, SsScd1 and SsThr1 during sclerotia development in wild type and ∆SsAtg1. Since ∆SsAtg1 could not produce sclerotia, we compared it with wild type on the same culture days. SsPac1 [36] is a homologous gene of transcription factor PacC, which regulated pH-sensitive gene expression. The expression of SsPac1 was significantly increased at the early stage of sclerotia development, while the expression of SsPac1 in ∆SsAtg1 was lower than that of the wild type (Figure 3f). SsScd1 and SsThr1, the melanin synthesis genes related to sclerotia formation, were up-regulated in the late stage of the wild-type sclerotia, namely, the sclerotia pigmentation stage, while there were no significant increases in the expression levels of SsScd1 and SsThr1 over time in the ∆SsAtg1 culture (Figure 3g,h). The results indicate that the deficiency of SsAtg1 not only affected the occurrence of autophagy, but also affected the essential metabolism process.

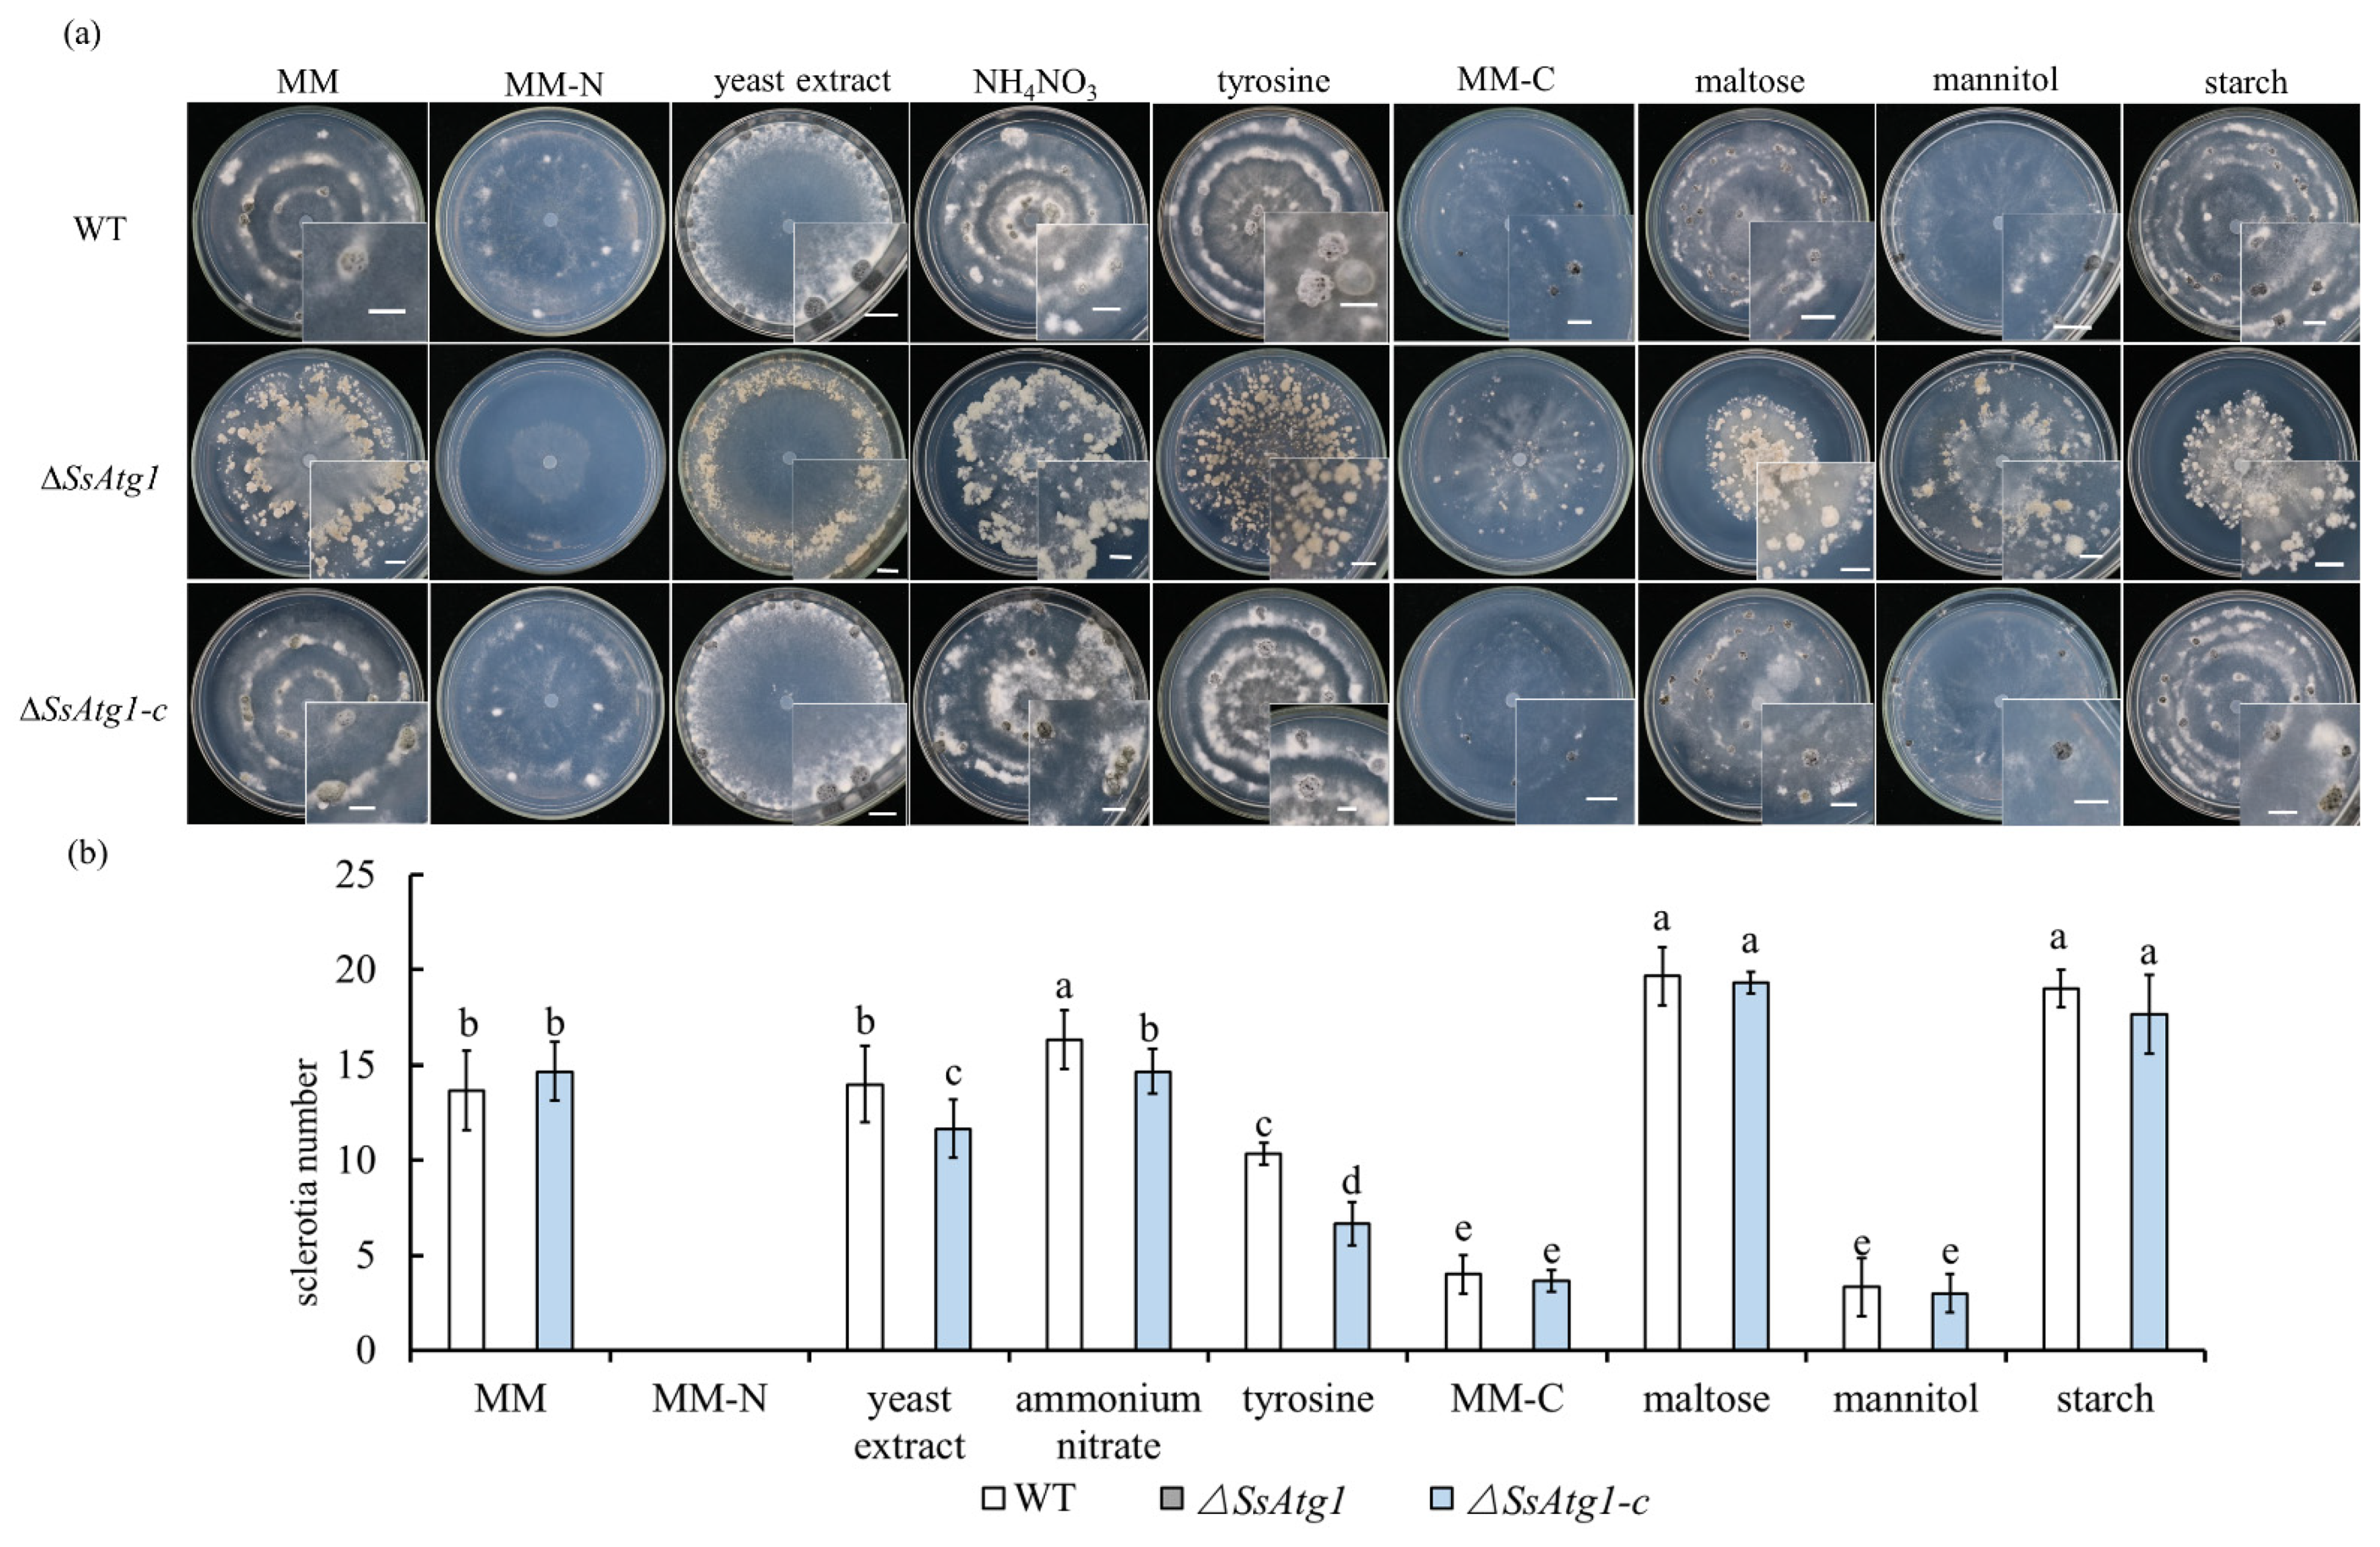
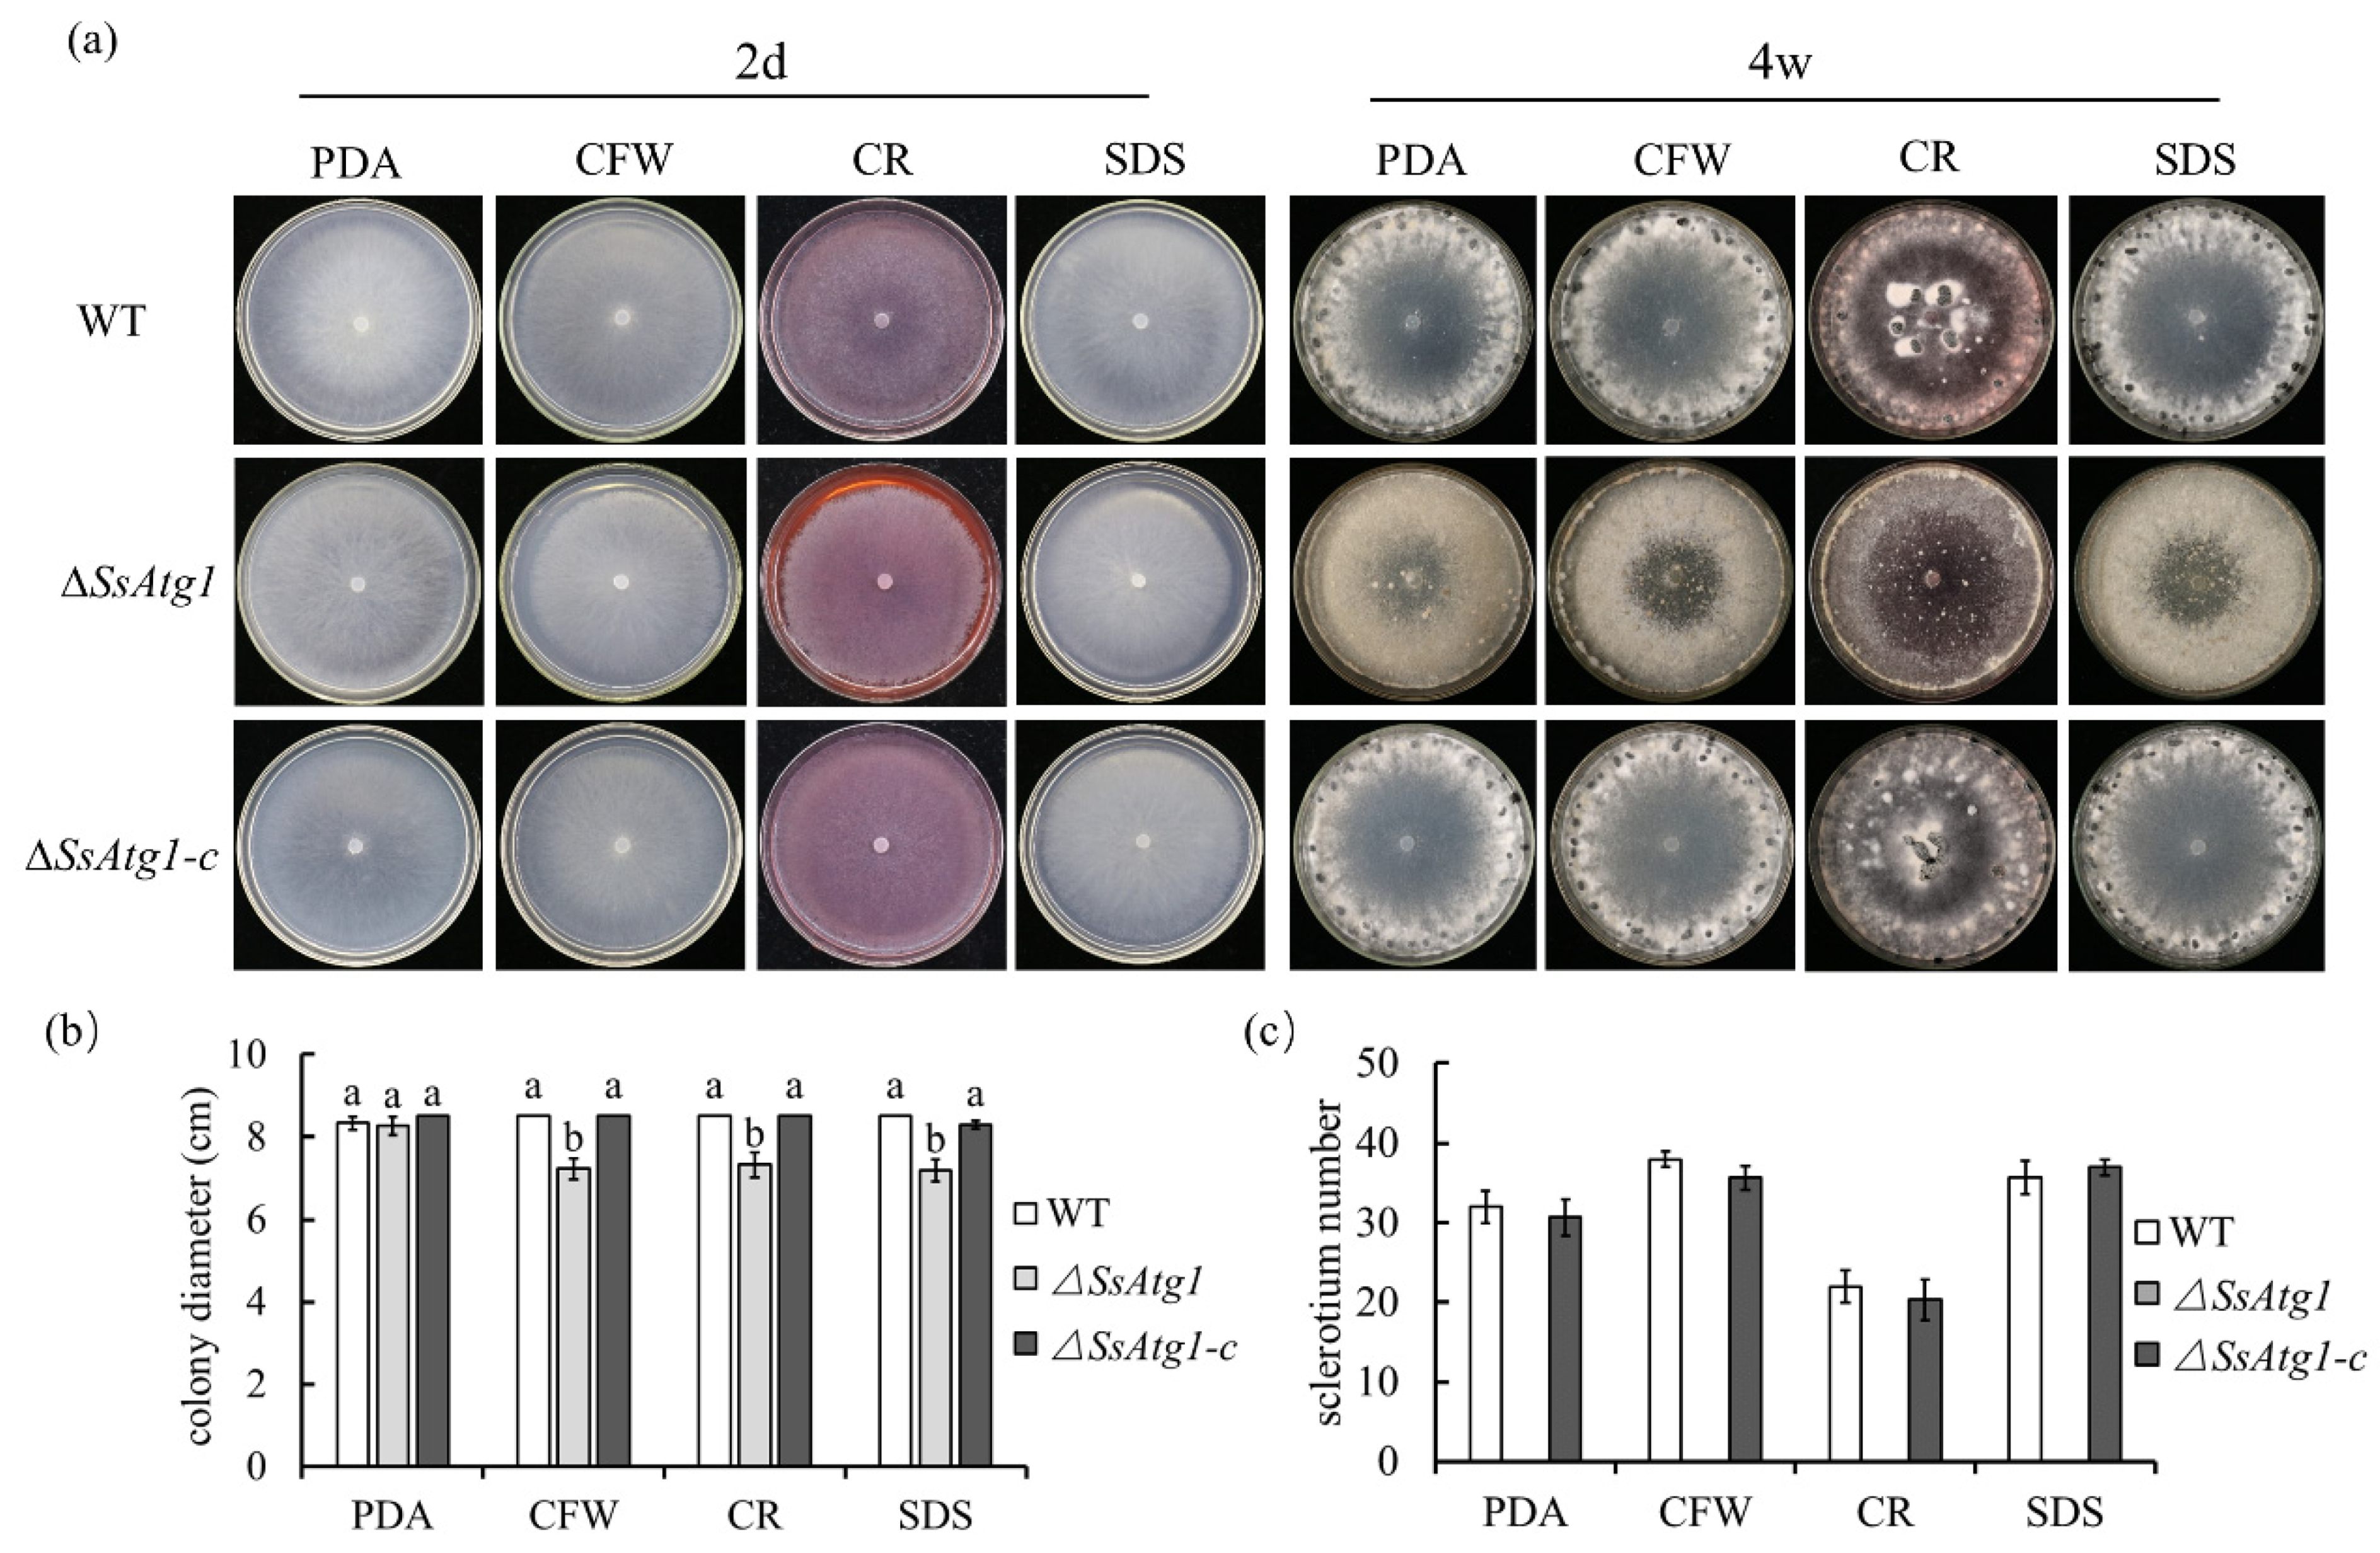
3.4. Deficiency of SsAtg1 Results in Abnormal Responses to Nutritional Stress

Since the growth of ∆SsAtg1 is significantly inhibited on MM medium, we explored the response of SsAtg1 to nutritional stress by replacing C source and N source in MM medium. The results showed that with a complex organic nitrogen source, such as yeast extract, sclerotia are produced at the edge of the medium. The inorganic nitrogen source NH4NO3 had no significant effect on wild type sclerotia formation on MM. However, when tyrosine was added as a growth factor, the colonies of ∆SsAtg1 were brown and dark mycelia aggregated on the surface of the medium; additionally, the size of wild-type sclerotia was significantly larger than that of other treatments (Figure 4a). In contrast to the lack of sclerotia in the absence of a N source, the wild type could still produce sclerotia in the absence of a C source, but the sclerotia diameter decreased (Figure 4a). When maltose and starch were used as C sources, more sclerotia were observed for the wild type, while colony growth of ∆SsAtg1 was significantly inhibited (Figure 4a,b). Apparently, SsAtg1 participates in and responds to nutritional stress.

3.5. ∆SsAtg1 Is Sensitive to Cell Wall Synthesis Inhibitors

In order to explore the influence of ∆SsAtg1 on growth, cell wall inhibitors were added externally, the results showed that there was obvious differences in the growth rate in the presence of CFW, CR and SDS between ∆SsAtg1 and wild type (Figure 5a,b). The wild type could develop normally and form sclerotium after adding cell wall inhibitors, but the sclerotia numbers were decreased after CR treatment. However, ∆SsAtg1 could not form sclerotia after treatment with CFW, CR and SDS, and only loose aggregations of mycelia were observed (Figure 5a,c). The results suggest that SsAtg1 plays a role in cell wall integrity in S. sclerotiorum.

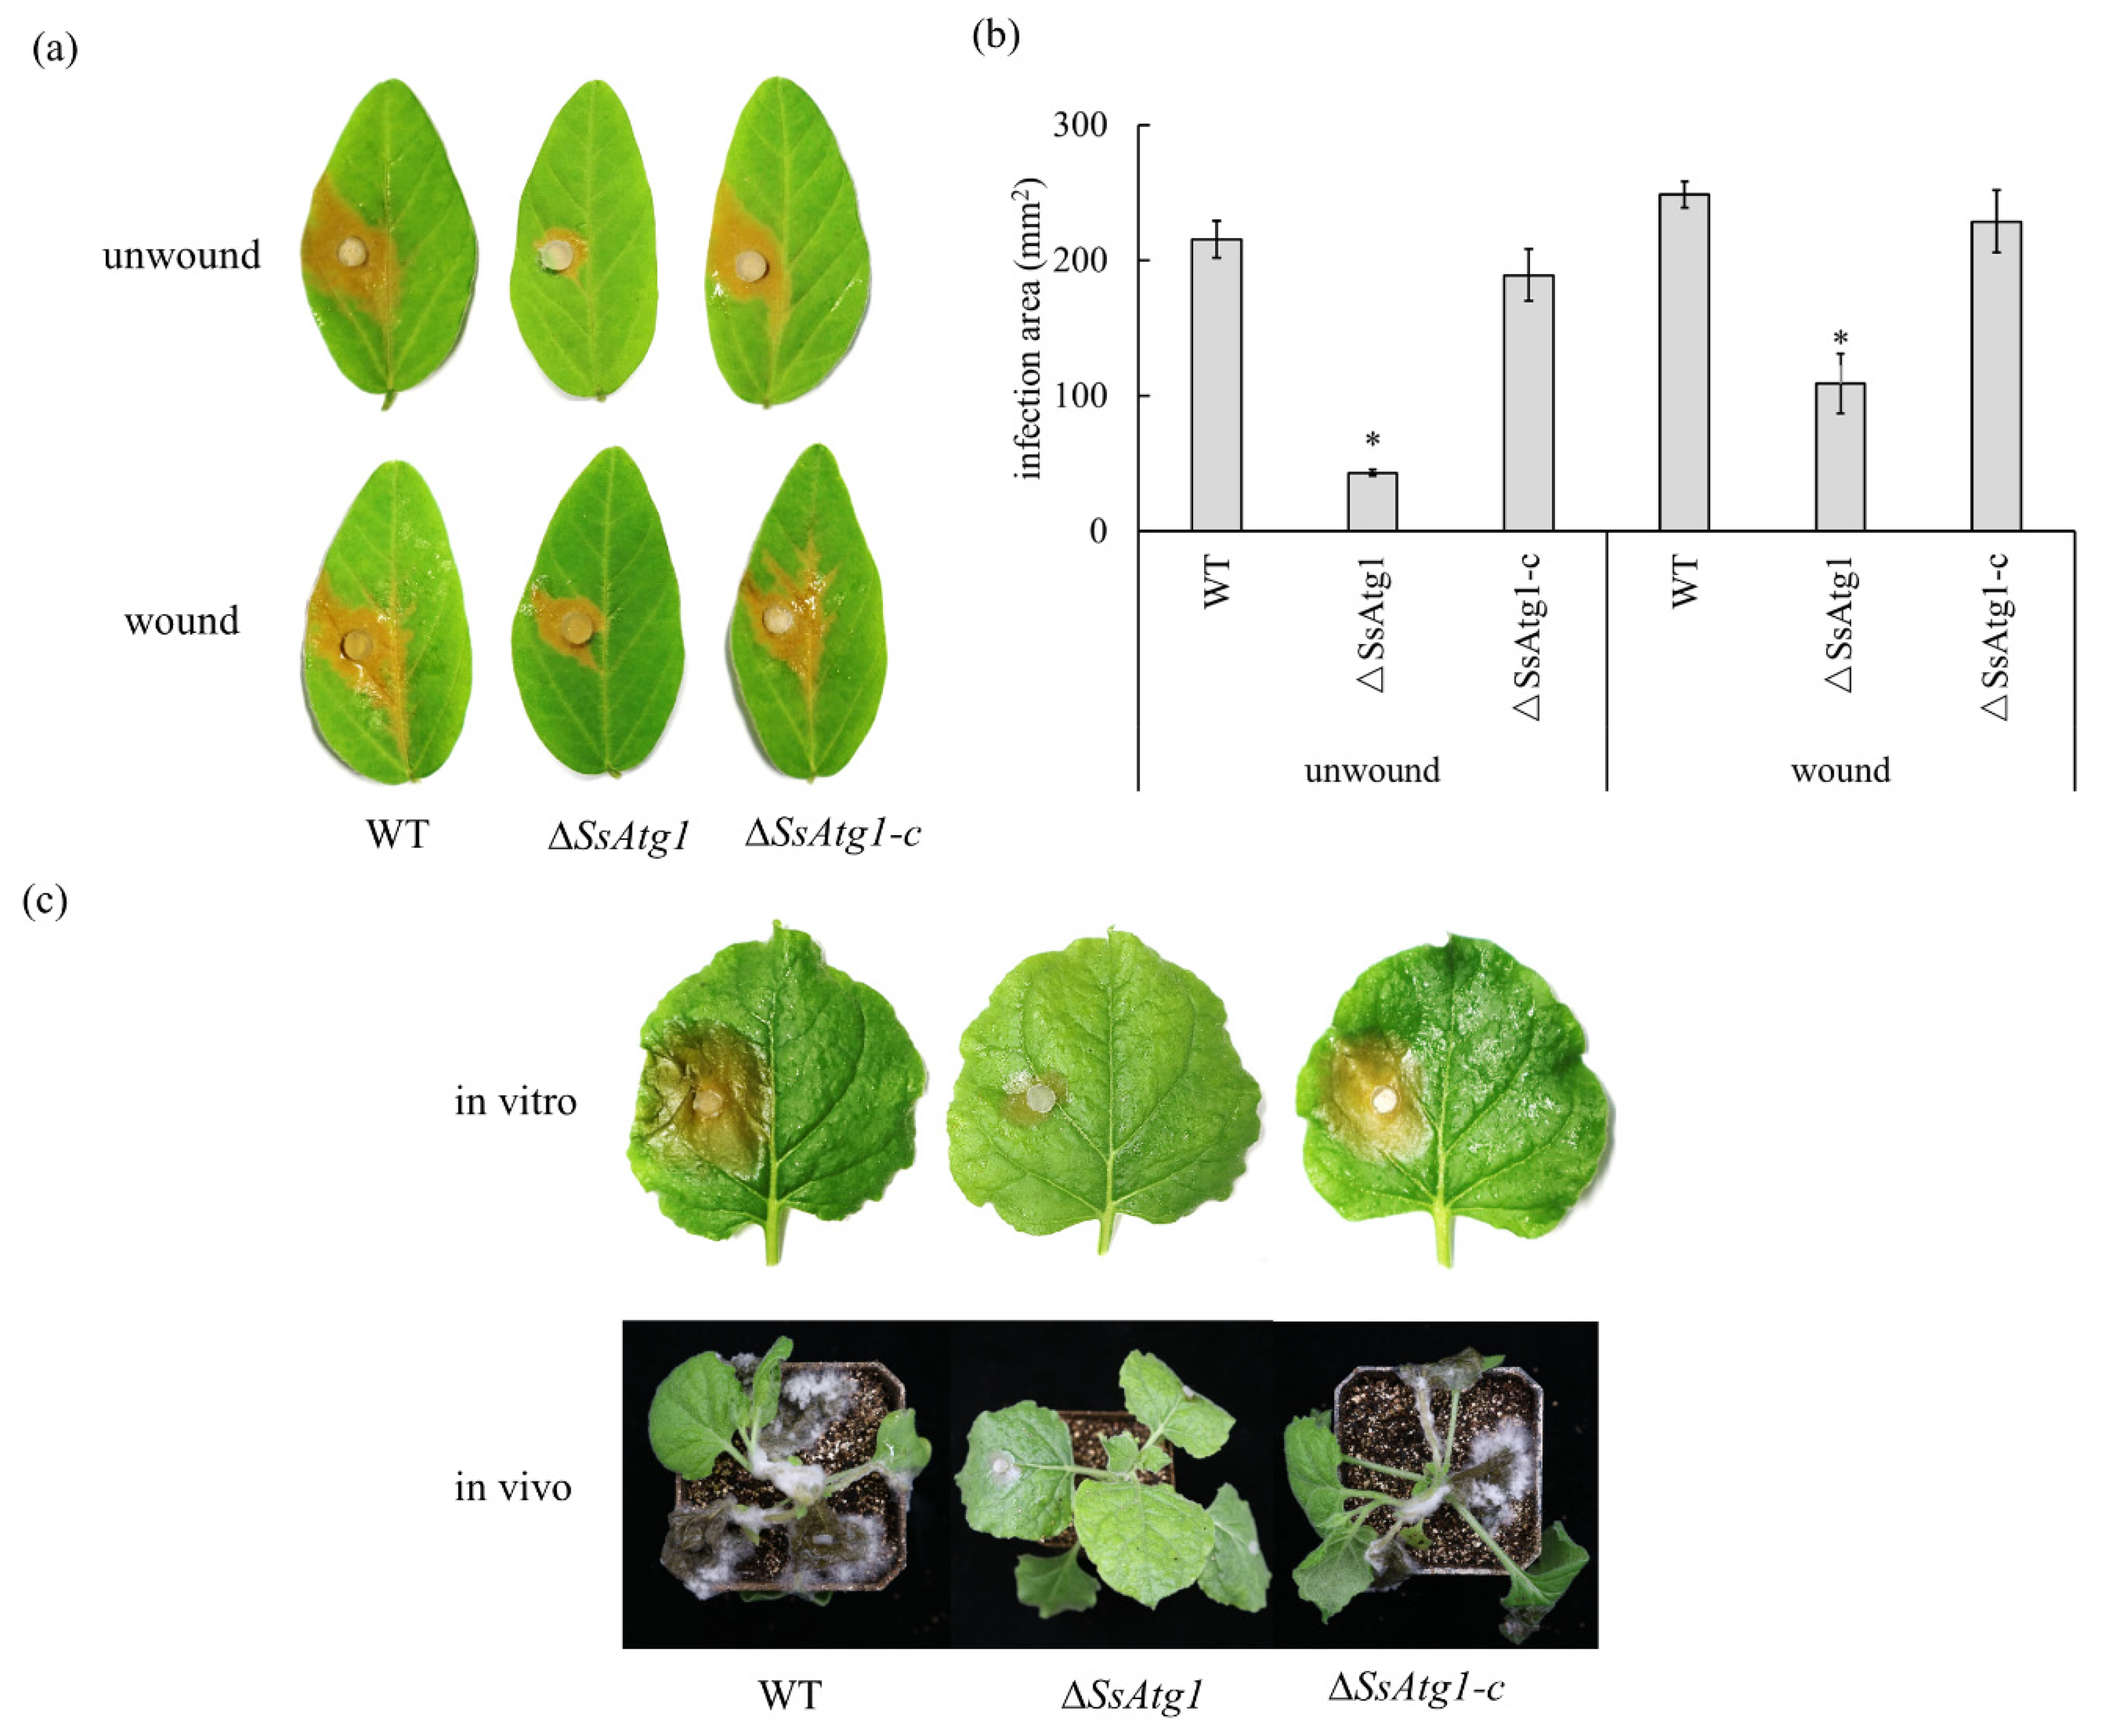
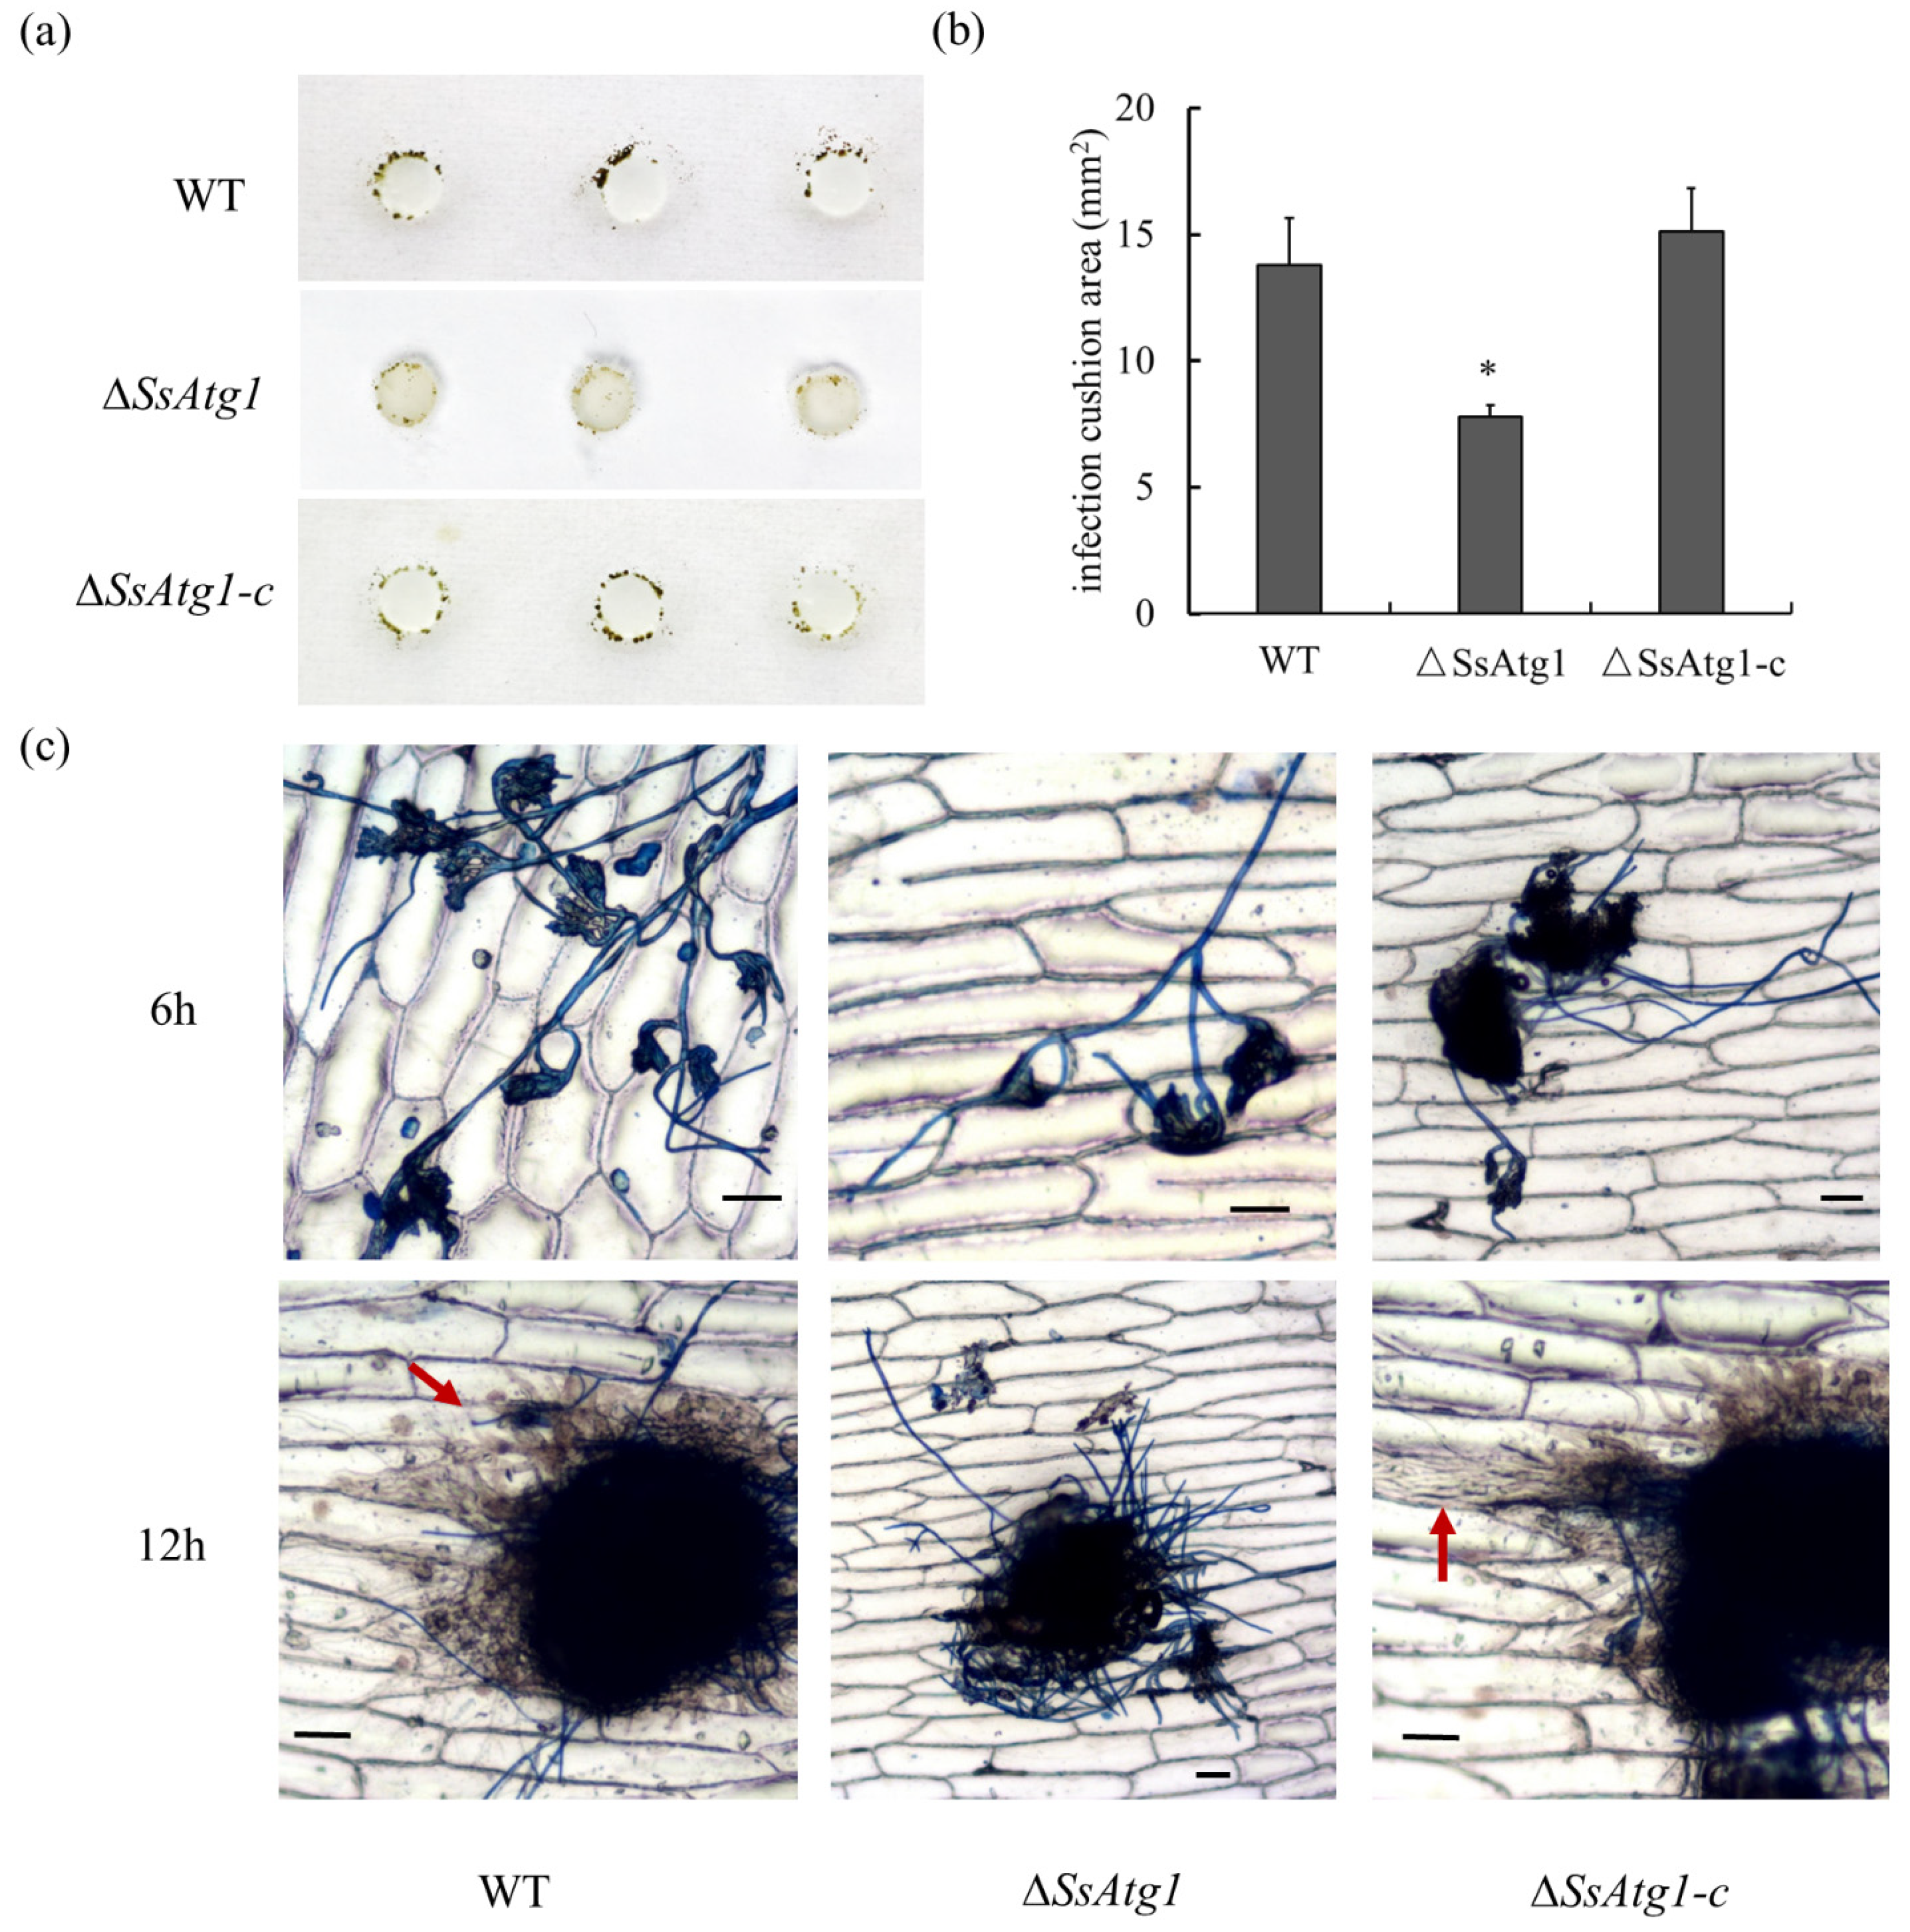
3.6. Involvement of SsAtg1 in Pathogenicity and Compound Appressorium Formation

Autophagy can be an important factor affecting pathogenicity. We measured the pathogenicity of ∆SsAtg1 by wounded, unwounded, in vitro and in vivo inoculations. The virulence of ∆SsAtg1 was significantly decreased both on wounded and unwounded soybean leaves (Figure 6a,b). Virulence of ∆SsAtg1 on detached (in vitro) leaves and plants (in vivo) of tobacco was also observed. After inoculation, the leaves infected with the wild type were water-soaked and the whole plant wilted, however, the lesion area of the leaf inoculated with ∆SsAtg1 was significantly reduced and the plant was intact (Figure 6c). These results confirm that SsAtg1 affects the virulence of S. sclerotiorum.
Compound appressoria are an important factor of host plant infection by S. sclerotiorum. In order to further explore the factors of decreasing virulence of ∆SsAtg1, we measured the development and penetration of wild type and ∆SsAtg1 compound appressoria. The results illustrated that the mass of ∆SsAtg1 compound appressoria on an inert hydrophobic surface were decreased relative to the wild type (Figure 7a,b), but the morphology of the compound appressoria were normal (Figure S3a). Onion epidermis penetration experiments showed that wild type could penetrate the onion epidermis and form invasion hypha after 12 h post inoculation, however, the penetration efficiency of ∆SsAtg1 was lower than that of the wild type (Figure 7c). The results indicate that SsAtg1 affected the development and penetration of the compound appressoria.

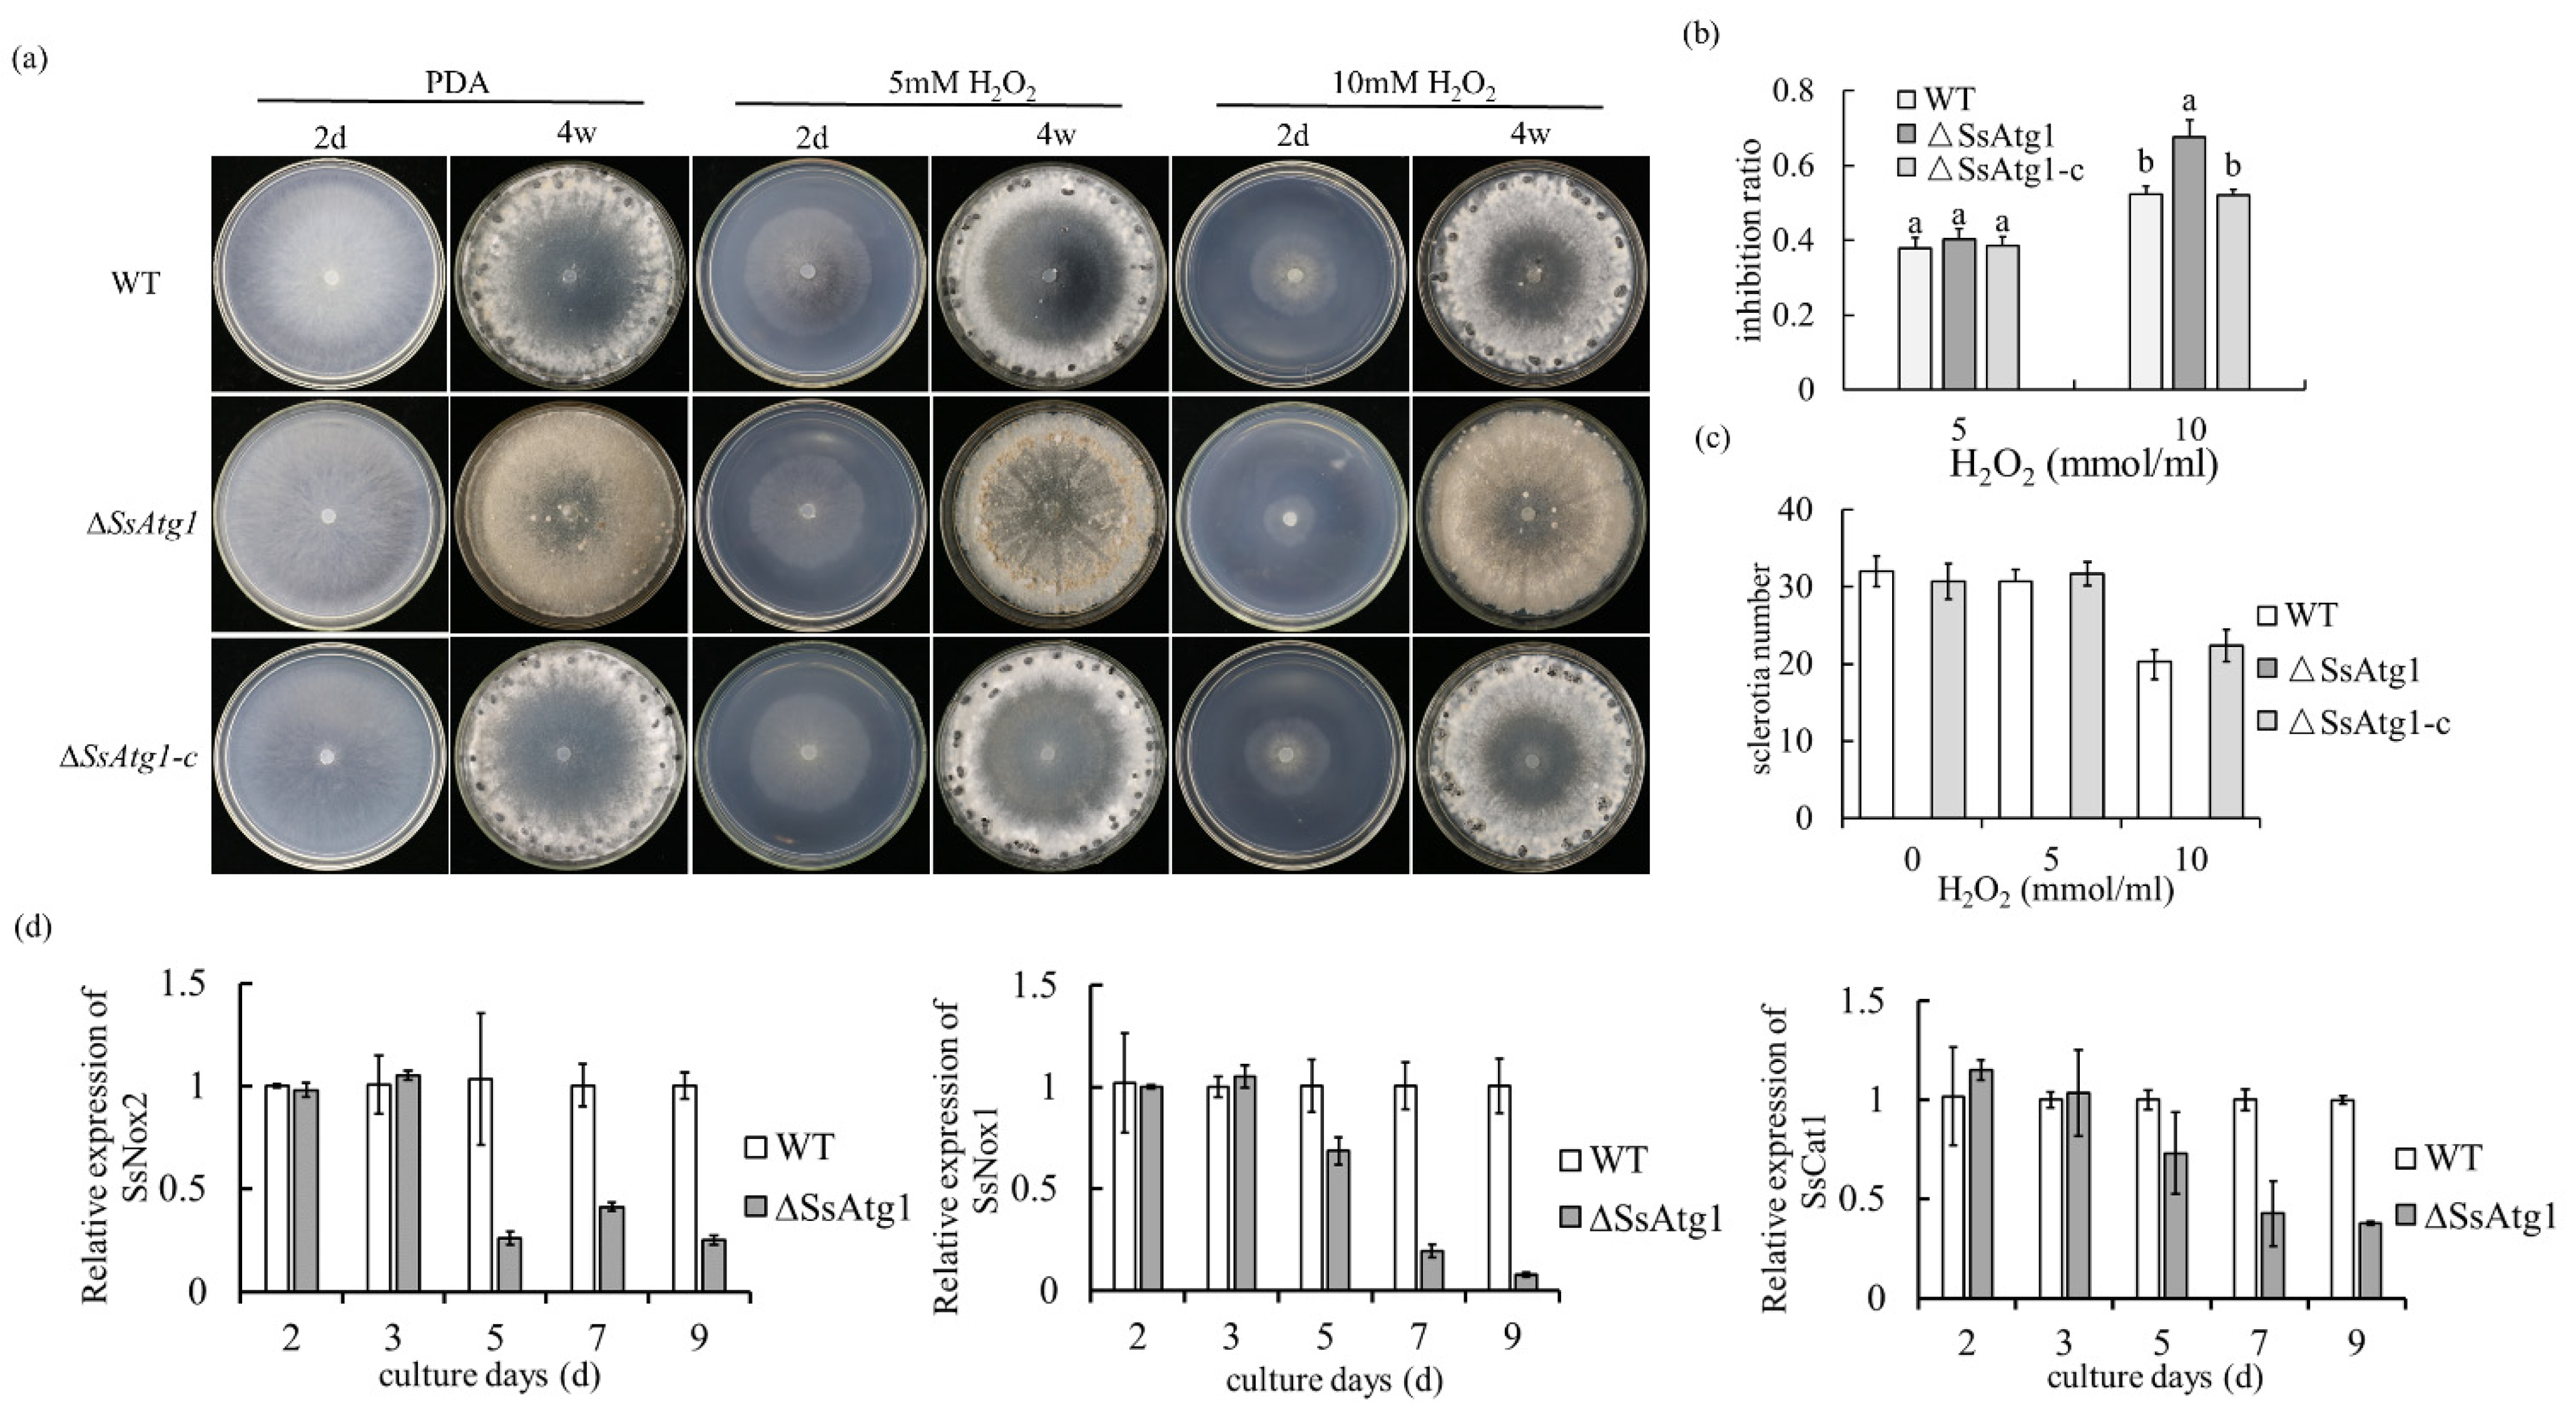
3.7. SsAtg1 Disruption Caused Hypersensitivity to ROS

Redox dynamics are important in fungal growth, development and pathogenicity, and hyperoxidant states are the main drivers for microorganisms to enter into differentiation states [39]. Therefore, different concentrations of hydrogen peroxide were added to growth media and the growth inhibition rates of ∆SsAtg1 and the wild type were examined. Under the treatment of 5 mmol H2O2 no differences were observed, but ∆SsAtg1 was more inhibited than wild type under treatment with 10 mmol H2O2. This suggests that the autophagy pathway plays a role in maintaining the redox balance or responding to redox balance in S. sclerotiorum (Figure 8a,b). In terms of sclerotia formation, there was no sclerotia formation in ∆SsAtg1, but higher H2O2 treatment reduced the number of wild-type sclerotia, indicating that the redox state affects sclerotia formation of S. sclerotiorum (Figure 8a,c). Subsequently, we measured the expression levels of reactive oxygen metabolism genes Ssnox1, Ssnox2 and SsCat1 in wild type and ∆SsAtg1. Results showed that the expression levels of Ssnox1, Ssnox2 and SsCat1 in ∆SsAtg1 were significantly lower than those in wild type during sclerotia formation (Figure 8d). This further indicates that SsAtg1 participated in the response to oxidative stress and impacts the expression of ROS metabolism genes.

4. Discussion

Autophagy is a highly conserved process for degradation of aggregated and misfolded proteins and damaged organelles across eukaryotic species [14,15,40,41]. Autophagy uses the degraded materials for energy and cell structure reconstruction and is critical for maintaining cellular homeostasis [14,42]. Autophagy in filamentous fungi is related to pathogenicity, cell differentiation, nutrient balance and secondary metabolism [43,44,45,46]. Previous studies have shown that SsAtg8 affects sclerotia formation, compound appressoria development and pathogenicity of S. sclerotiorum [9,10]. In this paper, the function of SsAtg1 was studied.
Autophagy-related protein Atg1 is the only protein kinase within the yeast ATG autophagy pathway. Disruption of SsAtg1 affected the vegetative growth of S. sclerotiorum, and the colony growth of ∆SsAtg1 was significantly restricted on MM and MM-N media, while the growth rate between ∆SsAtg1 and wild type has no obvious difference in nutritionally adequate PDA and CM media. These results indicate that SsAtg1 may affect the nutrient utilization of S. sclerotiorum, where a deficiency in SsAtg1 function whereby hyphae cannot provide growth substrates under conditions of nutrient deficiency is observed.
Sclerotia play a central role in the asexual and sexual reproduction and disease cycle of S. sclerotiorum [5]. ∆SsAtg1 cannot form sclerotia even after a prolonged duration in culture on PDA, CM and MM media, indicating that the autophagy pathway induced by SsAtg1 is indispensable for sclerotia formation. In filamentous fungi, such as M. oryzae, F. graminearum, B. cinerea and Aspergillus fumigatus, loss of atg1 function also affects the formation of asexual reproductive structures [23,24,47]. In addition, on N-starvation medium (MM-N) the wild type cannot form sclerotia, which further indicates that the induction and termination of autophagy are both crucial to the development of sclerotia. Furthermore, by replacing C and N sources in MM medium, we found that SsAtg1 was a key gene for sclerotia formation in response to nutritional stress. Therefore, the relationship between autophagy and carbon metabolism in S. sclerotiorum deserves further study.
Compound appressoria and oxalic acid (OA) are important pathogenic factors for S. sclerotiorum [6]. Our pathogenicity analysis showed that the virulence of ∆SsAtg1 significantly decreased relative to wild-type, subsequently, we analyzed the development and penetration of the compound appressoria in ∆SsAtg1. Results showed that the number of compound appressoria formed by ∆SsAtg1 was lower than that in the wild type, simultaneously, compound appressoria penetration experiments on onion epidermis showed that the penetration efficiency of ∆SsAtg1 was significantly decreased. In addition, the pH-indicator dye bromophenol blue was used to detect the in vitro accumulation of OA, and found that the mutant was the same as the wild type (Figure S3b). These results indicate that the influence of SsAtg1 on the pathogenicity of S. sclerotiorum is multifactorial and related to compound appressoria and nutrient utilization but not OA accumulation.
S. sclerotiorum secretes OA to trigger the host programmed cell death (PCD) which stimulates ROS production, and the enhanced ROS generation stimulates S. sclerotiorum-induced necrosis [48,49]. However, SsAtg1 disruption caused hypersensitivity to ROS, which links autophagy with redox. In addition, the redox “climate” also plays a considerable role in fungal growth and development [39,50]. ∆SsAtg1 is more sensitive to 10 mM hydrogen peroxide than the wild type; additionally, we determined that the expression levels of Ssnox1, Ssnox2 and SsCat1 genes related to reactive oxygen metabolism, were lower than those in wild type during sclerotia formation (Figure 8d). The results indicated that SsAtg1 affects the expression of genes related to reactive oxygen species metabolism; moreover, ROS is important for sclerotia formation of S. sclerotiorum.
In summary, we concluded that the SsAtg1 gene of S. sclerotiorum is involved in response to nutritional stresses that govern mycelial growth and is essential for sclerotia formation, contributing to virulence and the development of compound appressoria.

Supplementary Materials

The following supporting information can be downloaded at: https://www.mdpi.com/article/10.3390/jof8121314/s1, Figure S1: COG and GO Function Analysis; Figure S2: Verification of ∆SsAtg1; Figure S3: Morphology of compound appressoria and the production of oxalic acid; Table S1: COG function classification; Table S2: DEG enrichment in GO annotation; Tables S3–S9: DEGs in transcriptome analysis; Table S10: Primer information.

Author Contributions

Conceptualization, H.P. and W.J.; methodology, W.J.; software, W.J.; validation, H.P., W.J. and Y.Z.; formal analysis, H.Y.; investigation, K.X.; resources, H.P.; data curation, X.C.; writing—original draft preparation, W.J.; writing—review and editing, H.P.; visualization, F.W.; supervision, D.J.; project administration, H.P.; funding acquisition, H.P. All authors have read and agreed to the published version of the manuscript.

Funding

This work was financially supported by the National Natural Science Foundation of China (32272484) and the Inter-Governmental International Cooperation Special Project of National Key R&D Program of China (2019YFE0114200).

Data Availability Statement

The data that support the findings of this study are available from the corresponding author upon reasonable request.

Acknowledgments

We thank Haifeng Zhang (Nanjing Agricultural University) for providing pYF11 vector and we thank Jeffrey A. Rollins (Department of Plant Pathology, University of Florida, Gainesville, Florida, USA) to review and editing this manuscript.

Conflicts of Interest

All authors declare that there is no conflict of interest.

References

  1. Navaud, O.; Barbacci, A.; Taylor, A.; Clarkson, J.P.; Raffaele, S. Shifts in diversification rates and host jump frequencies shaped the diversity of host range among Sclerotiniaceae fungal plant pathogens. Mol. Ecol. 2018, 27, 1309–1323. [Google Scholar] [CrossRef] [PubMed] [Green Version]
  2. Xia, S.; Xu, Y.; Hoy, R.; Zhang, J.; Qin, L.; Li, X. The Notorious Soilborne Pathogenic Fungus Sclerotinia sclerotiorum: An Update on Genes Studied with Mutant Analysis. Pathogens 2019, 9, 27. [Google Scholar] [CrossRef] [PubMed] [Green Version]
  3. Kabbage, M.; Yarden, O.; Dickman, M.B. Pathogenic attributes of Sclerotinia sclerotiorum: Switching from a biotrophic to necrotrophic lifestyle. Plant Sci. 2015, 233, 53–60. [Google Scholar] [CrossRef] [PubMed]
  4. Bolton, M.D.; Thomma, B.P.H.J.; Nelson, B.D. Sclerotinia sclerotiorum (Lib.) de Bary: Biology and molecular traits of a cosmopolitan pathogen. Mol. Plant Pathol. 2006, 7, 1–16. [Google Scholar] [CrossRef] [PubMed]
  5. Erental, A.; Dickman, M.B.; Yarden, O. Sclerotial development in Sclerotinia sclerotiorum: Awakening molecular analysis of a “Dormant” structure. Fungal Biol. Rev. 2008, 22, 6–16. [Google Scholar] [CrossRef]
  6. Liang, X.; Rollins, J.A. Mechanisms of Broad Host Range Necrotrophic Pathogenesis in Sclerotinia sclerotiorum. Phytopathology 2018, 108, 1128–1140. [Google Scholar] [CrossRef] [Green Version]
  7. Chen, C.; Harel, A.; Gorovoits, R.; Yarden, O.; Dickman, M.B. MAPK regulation of sclerotial development in Sclerotinia sclerotiorum is linked with pH and cAMP sensing. Mol. Plant-Microbe Interact. 2004, 17, 404–413. [Google Scholar] [CrossRef] [Green Version]
  8. Wayne, I.I.; Rollins, J.A. Biology: Deletion of the adenylate cyclase (sac1) gene affects multiple developmental pathways and pathogenicity in Sclerotinia sclerotiorum. Fungal Genet. Biol. 2007, 44, 521–530. [Google Scholar]
  9. Jiao, W.; Yu, H.; Cong, J.; Xiao, K.; Zhang, X.; Liu, J.; Zhang, Y.; Pan, H. Transcription factor SsFoxE3 activating SsAtg8 is critical for sclerotia, compound appressoria formation, and pathogenicity in Sclerotinia sclerotiorum. Mol. Plant Pathol. 2022, 23, 204–217. [Google Scholar] [CrossRef]
  10. Zhang, H.; Li, Y.; Lai, W.; Huang, K.; Li, Y.; Wang, Z.; Chen, X.; Wang, A. SsATG8 and SsNBR1 mediated-autophagy is required for fungal development, proteasomal stress response and virulence in Sclerotinia sclerotiorum. Fungal Genet. Biol. 2021, 157, 103632. [Google Scholar] [CrossRef]
  11. Liu, X.H.; Lu, J.P.; Lin, F.C. Autophagy during conidiation, conidial germination and turgor generation in Magnaporthe grisea. Autophagy 2007, 3, 472–473. [Google Scholar] [CrossRef] [PubMed]
  12. Parzych, K.R.; Klionsky, D.J. An overview of autophagy: Morphology, mechanism, and regulation. Antioxid Redox Signal. 2014, 20, 460–473. [Google Scholar] [CrossRef] [PubMed] [Green Version]
  13. Zhu, X.M.; Li, L.; Wu, M.; Liang, S.; Shi, H.B.; Liu, X.H.; Lin, F.C. Current opinions on autophagy in pathogenicity of fungi. Virulence 2019, 10, 481–489. [Google Scholar] [CrossRef] [PubMed] [Green Version]
  14. Ravanan, P.; Srikumar, I.F.; Talwar, P. Autophagy: The spotlight for cellular stress responses. Life Sci. 2017, 188, 53–67. [Google Scholar] [CrossRef]
  15. Mizushima, N.; Komatsu, M. Autophagy: Renovation of cells and tissues. Cell 2011, 147, 728–741. [Google Scholar] [CrossRef] [Green Version]
  16. Liu, X.H.; Xu, F.; Snyder, J.H.; Shi, H.B.; Lu, J.P.; Lin, F.C. Autophagy in plant pathogenic fungi. Semin. Cell Dev. Biol. 2016, 57, 128–137. [Google Scholar] [CrossRef] [Green Version]
  17. Liu, T.B.; Liu, X.H.; Lu, J.P.; Zhang, L.; Min, H.; Lin, F.C. The cysteine protease MoAtg4 interacts with MoAtg8 and is required for differentiation and pathogenesis in Magnaporthe oryzae. Autophagy 2010, 6, 74–85. [Google Scholar] [CrossRef] [Green Version]
  18. Ren, W.; Liu, N.; Sang, C.; Shi, D.; Chen, W.J.A.; Microbiology, E. The Autophagy Gene BcATG8 Regulates the Vegetative Differentiation and Pathogenicity of Botrytis cinerea. Appl. Environ. Microbiol. 2018, 84, e02455-17. [Google Scholar] [CrossRef] [Green Version]
  19. Ren, W.; Sang, C.; Shi, D.; Song, X.; Zhou, M.; Chen, C. Ubiquitin-like activating enzymes BcAtg3 and BcAtg7 participate in development and pathogenesis of Botrytis cinerea. Curr. Genet. 2018, 64, 919–930. [Google Scholar] [CrossRef]
  20. Nguyen, L.N.; Bormann, J.; Le, G.T.; Starkel, C.; Olsson, S.; Nosanchuk, J.D.; Giese, H.; Schafer, W. Autophagy-related lipase FgATG15 of Fusarium graminearum is important for lipid turnover and plant infection. Fungal Genet. Biol. 2011, 48, 217–224. [Google Scholar] [CrossRef]
  21. Mizushima, N.; Noda, T.; Yoshimori, T.; Tanaka, Y.; Ishii, T.; George, M.D.; Klionsky, D.J.; Ohsumi, M.; Ohsumi, Y. A protein conjugation system essential for autophagy. Nature 1998, 395, 395–398. [Google Scholar] [CrossRef] [PubMed]
  22. Ichimura, Y.; Kirisako, T.; Takao, T.; Satomi, Y.; Shimonishi, Y.; Ishihara, N.; Mizushima, N.; Tanida, I.; Kominami, E.; Ohsumi, M.; et al. A ubiquitin-like system mediates protein lipidation. Nature 2000, 408, 488–492. [Google Scholar] [CrossRef] [PubMed]
  23. Ren, W.; Zhang, Z.; Shao, W.; Yang, Y.; Zhou, M.; Chen, C. The autophagy-related gene BcATG1 is involved in fungal development and pathogenesis in Botrytis cinerea. Mol. Plant Pathol. 2016, 18, 238–248. [Google Scholar] [CrossRef] [PubMed]
  24. Lv, W.; Wang, C.; Yang, N.; Que, Y.; Talbot, N.J.; Wang, Z. Genome-wide functional analysis reveals that autophagy is necessary for growth, sporulation, deoxynivalenol production and virulence in Fusarium graminearum. Sci. Rep. 2017, 7, 11062. [Google Scholar] [CrossRef] [Green Version]
  25. Licheva, M.; Raman, B.; Kraft, C.; Reggiori, F. Phosphoregulation of the autophagy machinery by kinases and phosphatases. Autophagy 2022, 18, 104–123. [Google Scholar] [CrossRef]
  26. Cong, J.; Xiao, K.; Jiao, W.; Zhang, C.; Zhang, X.; Liu, J.; Zhang, Y.; Pan, H. The Coupling Between Cell Wall Integrity Mediated by MAPK Kinases and SsFkh1 Is Involved in Sclerotia Formation and Pathogenicity of Sclerotinia sclerotiorum. Front. Microbiol. 2022, 13, 816091. [Google Scholar] [CrossRef]
  27. Yu, P.L.; Rollins, J.A. The cAMP-dependent protein kinase A pathway perturbs autophagy and plays important roles in development and virulence of Sclerotinia sclerotiorum. Fungal Biol. 2022, 126, 20–34. [Google Scholar] [CrossRef]
  28. Xu, T.; Li, J.; Yu, B.; Liu, L.; Zhang, X.; Liu, J.; Pan, H.; Zhang, Y. Transcription Factor SsSte12 Was Involved in Mycelium Growth and Development in Sclerotinia sclerotiorum. Front. Microbiol. 2018, 9, 2476. [Google Scholar] [CrossRef]
  29. Fan, H.; Yu, G.; Liu, Y.; Zhang, X.; Liu, J.; Zhang, Y.; Rollins, J.A.; Sun, F.; Pan, H. An atypical forkhead-containing transcription factor SsFKH1 is involved in sclerotial formation and is essential for pathogenicity in Sclerotinia sclerotiorum. Mol. Plant. Pathol. 2017, 18, 963–975. [Google Scholar] [CrossRef]
  30. Kanehisa, M.; Goto, S. KEGG: Kyoto encyclopedia of genes and genomes. Nucleic Acids Res. 2000, 28, 27–30. [Google Scholar] [CrossRef]
  31. Ashburner, M.; Ball, C.A.; Blake, J.A.; Botstein, D.; Butler, H.; Cherry, J.M.; Davis, A.P.; Dolinski, K.; Dwight, S.S.; Eppig, J.T.; et al. Gene Ontology: Tool for the unification of biology. Gene Ontol. Consort. 2000, 25, 25–29. [Google Scholar] [CrossRef] [PubMed]
  32. Bairoch, A.; Apweiler, R. The SWISS-PROT protein sequence database and its supplement TrEMBL in 2000. Nucleic Acids Res. 2000, 28, 45–48. [Google Scholar] [CrossRef] [PubMed]
  33. Finn, R.D.; Bateman, A.; Clements, J.; Coggill, P.; Eberhardt, R.Y.; Eddy, S.R.; Heger, A.; Hetherington, K.; Holm, L.; Mistry, J.; et al. Pfam: The protein families database. Nucleic Acids Res. 2014, 42, D222–D230. [Google Scholar] [CrossRef] [PubMed] [Green Version]
  34. Goswami, R.S. Targeted gene replacement in fungi using a split-marker approach. Methods Mol. Biol. 2012, 835, 255–269. [Google Scholar]
  35. Qu, X.; Yu, B.; Liu, J.; Zhang, X.; Li, G.; Zhang, D.; Li, L.; Wang, X.; Wang, L.; Chen, J.; et al. MADS-Box Transcription Factor SsMADS Is Involved in Regulating Growth and Virulence in Sclerotinia sclerotiorum. Int. J. Mol. Sci. 2014, 15, 8049–8062. [Google Scholar] [CrossRef] [Green Version]
  36. Rollins, J.A. The Sclerotinia sclerotiorum pac1 gene is required for sclerotial development and virulence. Mol. Plant-Microbe Interact. 2003, 16, 785–795. [Google Scholar] [CrossRef] [Green Version]
  37. Liang, Y.; Xiong, W.; Steinkellner, S.; Feng, J. Deficiency of the melanin biosynthesis genes SCD1 and THR1 affects sclerotial development and vegetative growth, but not pathogenicity, in Sclerotinia sclerotiorum. Mol. Plant Pathol. 2018, 19, 1444–1453. [Google Scholar] [CrossRef] [Green Version]
  38. Butler, M.J.; Day, A.W. Fungal melanins: A review. Can. J. Microbiol. 1998, 44, 1115–1136. [Google Scholar] [CrossRef]
  39. Viefhues, A.; Heller, J.; Temme, N.; Tudzynski, P. Redox systems in Botrytis cinerea: Impact on development and virulence. Mol. Plant. Microbe Interact. 2014, 27, 858–874. [Google Scholar] [CrossRef] [Green Version]
  40. Abeliovich, H.; Klionsky, D.J. Autophagy in yeast: Mechanistic insights and physiological function. Microbiol. Mol. Biol Rev. 2001, 65, 463–479. [Google Scholar] [CrossRef] [Green Version]
  41. Perez-Perez, M.E.; Lemaire, S.D.; Crespo, J.L. The ATG4 protease integrates redox and stress signals to regulate autophagy. J. Exp. Bot. 2021, 72, 3340–3351. [Google Scholar] [CrossRef] [PubMed]
  42. D’Arcy, M.S. Cell death: A review of the major forms of apoptosis, necrosis and autophagy. Cell Biol. Int. 2019, 43, 582–592. [Google Scholar] [CrossRef] [PubMed]
  43. Asakura, M.; Ninomiya, S.; Sugimoto, M.; Oku, M.; Yamashita, S.I.; Okuno, T.; Sakai, Y.; Takano, Y. Atg26-mediated pexophagy is required for host invasion by the plant pathogenic fungus Colletotrichum orbiculare. Plant Cell 2009, 21, 1291–1304. [Google Scholar] [CrossRef] [PubMed] [Green Version]
  44. Yu, H.; Jia, W.; Xiao, K.; Jiao, W.; Zhang, X.; Pan, H. The Autophagy Genes ChATG4 and ChATG8 Are Required for Reproductive Development, Virulence, and Septin Assembly in Cochliobolus heterostrophus. Phytopathology 2022, 112, 830–841. [Google Scholar] [CrossRef]
  45. Huang, C.; Li, L.; Wang, L.; Bao, J.; Zhang, X.; Yan, J.; Wu, J.; Cao, N.; Wang, J.; Zhao, L.; et al. The Amino Acid Permease MoGap1 Regulates TOR Activity and Autophagy in Magnaporthe oryzae. Int. J. Mol. Sci. 2022, 23, 13663. [Google Scholar] [CrossRef]
  46. Veneault-Fourrey, C.; Barooah, M.; Egan, M.; Wakley, G.; Talbot, N.J. Autophagic fungal cell death is necessary for infection by the rice blast fungus. Science 2006, 312, 580–583. [Google Scholar] [CrossRef] [Green Version]
  47. Yin, Z.; Feng, W.; Chen, C.; Xu, J.; Li, Y.; Yang, L.; Wang, J.; Liu, X.; Wang, W.; Gao, C.; et al. Shedding light on autophagy coordinating with cell wall integrity signaling to govern pathogenicity of Magnaporthe oryzae. Autophagy 2020, 16, 900–916. [Google Scholar] [CrossRef]
  48. Kim, K.S.; Min, J.Y.; Dickman, M.B. Oxalic acid is an elicitor of plant programmed cell death during Sclerotinia sclerotiorum disease development. Mol. Plant-Microbe Interact. 2008, 21, 605–612. [Google Scholar] [CrossRef] [Green Version]
  49. Govrin, E.M.; Levine, A. The hypersensitive response facilitates plant infection by the necrotrophic pathogen Botrytis cinerea. Curr. Biol. 2000, 10, 751–757. [Google Scholar] [CrossRef] [Green Version]
  50. Rana, K.; Ding, Y.; Banga, S.S.; Liao, H.; Zhao, S.; Yu, Y.; Qian, W. Sclerotinia sclerotiorum Thioredoxin1 (SsTrx1) is required for pathogenicity and oxidative stress tolerance. Mol. Plant Pathol. 2021, 22, 1413–1426. [Google Scholar] [CrossRef]
Figure 1. DEGs between hypha and sclerotia in S. sclerotiorum. (a) GO annotation enrichment in sclerotia relative to hyphae. (b) Relative expression of genes in sclerotia at different stages verified by RT-qPCR. Samples of wild-type hyphae (S0, 2d), initiation of sclerotia (S1, 3d), developing sclerotia (S2, 5d) and mature sclerotia (S3, 9d) were collected. Genes Sscle_09g070740, Sscle_03g031470, Sscle_06g049830 and Sscle_12g087380 were selected to assess transcript accumulation dynamics.
Jof 08 01314 g001
Figure 2. SsAtg1 is a key gene activating autophagy in S. sclerotiorum. (a) Dendrogram of SsAtg1. Mega 7.0 was used to construct the phylogenetic tree. (b) Sequence information of SsAtg1. The conservation of the STKc_ATG1_ULK_like (cd14009) and Ser/Thr_kinase_C (IPR022708) domains was analyzed by InterPro (http://www.ebi.ac.uk/interpro, accessed on 18 February 2022) and GPS 2.0 was used for visualization. (c) Alignments of the ATP binding site and active site. Clustal W was used for alignment sequences and conserved amino acids residues are labeled as *. (d) Autophagy analysis of ∆SsAtg1. MDC is a fluorescent pigment used to detect autophagosome formation. Scale bar = 10 μm.
Jof 08 01314 g002
Figure 3. SsAtg1 is required for sclerotium formation. (a,b) Colony morphology and colony diameter of ∆SsAtg1 and control strains. Strains were inoculated on PDA, CM, MM, MM-N, MM-C and MM-P and colony diameters were measured by the cross method at 48 h. Error bars represent the standard deviations and the letters indicated significant differences (p < 0.05). (c,d) SsAtg1 mutation affected sclerotia development. Colony morphology and sclerotia number were recorded after four weeks. Error bars represent mean standard deviation, and statistical significance of data was analyzed using SPSS software (p < 0.05). (e) The expression of SsAtg1 was significantly increased in nutrient deficient medium. (fh) Deficiency of SsAtg1 affects the expression of key genes regulating sclerotia development.
Jof 08 01314 g003
Figure 4. Role of SsAtg1 in response to nutritional stress. (a) Colony morphology of wild type and ∆SsAtg1 and the genetically complemented strain on different growth media. Strains were inoculated on MM replaced with indicated C sources and N sources. Scale bar = 0.5 cm. (b) Sclerotia number of ∆SsAtg1 on different growth media. Colony morphology and sclerotia number were recorded after 4 weeks. The letters indicated significant differences (p < 0.05), error bars represent standard deviation from the mean.
Jof 08 01314 g004
Figure 5.SsAtg1 is sensitive to cell wall synthesis inhibitors. (a,b) Colony diameter and morphology of wild type, ∆SsAtg1 and the genetically complemented strain. Strains were inoculated on PDA supplemented with CFW, CR and SDS and colony diameters were measured by the cross method at 48 h. (c) Quantification of sclerotia development in response to cell wall synthesis inhibitors. Colony morphology and sclerotia number were recorded after 4 weeks. The letters indicated significant differences (p < 0.05), error bars represent standard deviation from the mean.
Jof 08 01314 g005
Figure 6. SsAtg1 affects the virulence of S. sclerotiorum. (a) Pathogenicity of ∆SsAtg1 on soybean leaves. (b) Quantification of the infection area. Image J was used to measure the infection area. (c) Pathogenicity of ∆SsAtg1 on tobacco. Error bars represent the standard deviations and the asterisk indicated significant differences (p < 0.05).
Jof 08 01314 g006
Figure 7. SsAtg1 affected compound appressoria formation and penetration. (a,b) Compound appressoria of strains on hydrophobic interface. Image J was used for analysis of compound appressoria as: adjusted the image to 8 bit format, then selected the part of the compound appressoria by adjust-threshold, then using the area of the agar disk as the control to calculate the area of the compound appressoria. Error bars represent the standard deviations and the asterisk indicated significant differences (p < 0.05). (c) Compound appressoria formation on onion epidermal cells. The red arrow shows the invasion hypha which could not be stained by lactophenol cotton blue solution. Samples were staining by lactophenol cotton blue solution after 30 s, then washed with ddH2O and observed under a microscope. Scale bar = 50 μm.
Jof 08 01314 g007
Figure 8.SsAtg1 hypersensitivity to ROS. (a) Mycelia growth and morphology of the ∆SsAtg1 under different concentrations of H2O2. (b) Inhibition rate analysis. Inhibition rate = (colony diameter of strain without H2O2 − colony diameter of strain with H2O2)/ colony diameter of strain without H2O2 × 100%. Error bars represent the standard deviations and the letters indicated significant differences (p < 0.05). (c) Statistics of sclerotia number. Significant difference in data by SPSS software (p < 0.05), error bars represent standard deviation. (d) Expression of reactive oxygen metabolism genes.
Jof 08 01314 g008
Publisher’s Note: MDPI stays neutral with regard to jurisdictional claims in published maps and institutional affiliations.

