
Why Does It Shine?—A Prognostic Analysis about Predisposing Factors for Blood–Brain Barrier Damage after Revascularisation of Cerebral Large-Vessel Occlusion
 , , ,
, , ,
Abstract
:1. Introduction
2. Materials and Methods
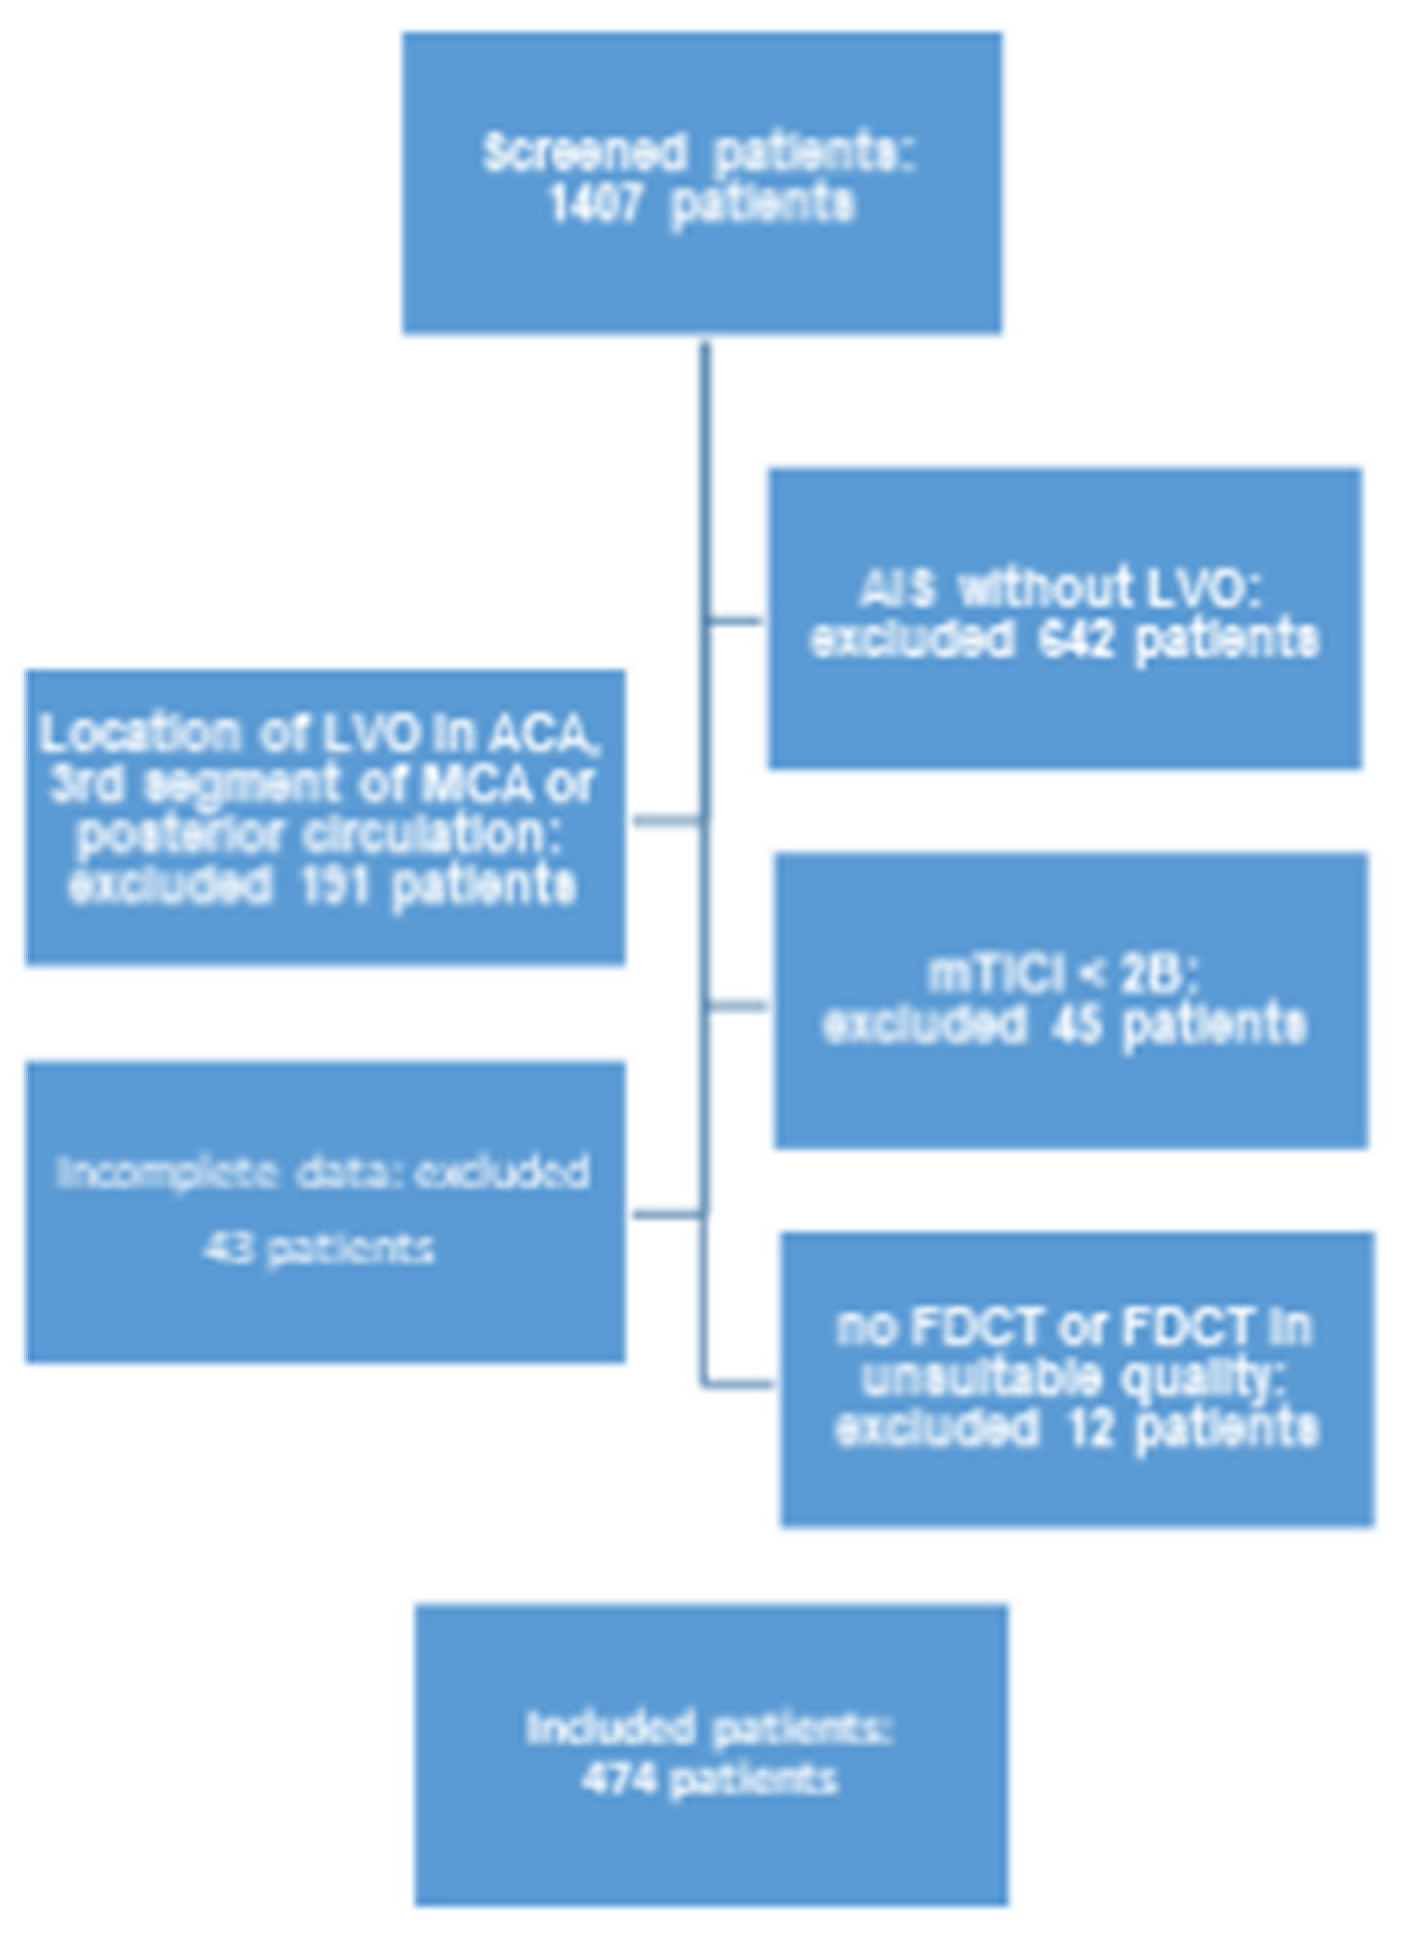
2.1. Patients
- Period of treatment between 1 January 2015 and 30 June 2019.
- AIS and intracranial LVO of the anterior circulation (namely the internal carotid artery (ICA) as well as the M1 and M2 segments of the middle cerebral artery (MCA)) with successful EVT (mTICI > 2B).
- Complete clinical and radiological documentation for each individual patient (a full overview of involved items is given in Table 1).
- FDCT with adequate diagnostic quality acquired directly after EVT (evaluated by two experienced neuroradiologists (HS and KM)).
2.2. Clinical and Radiological Data
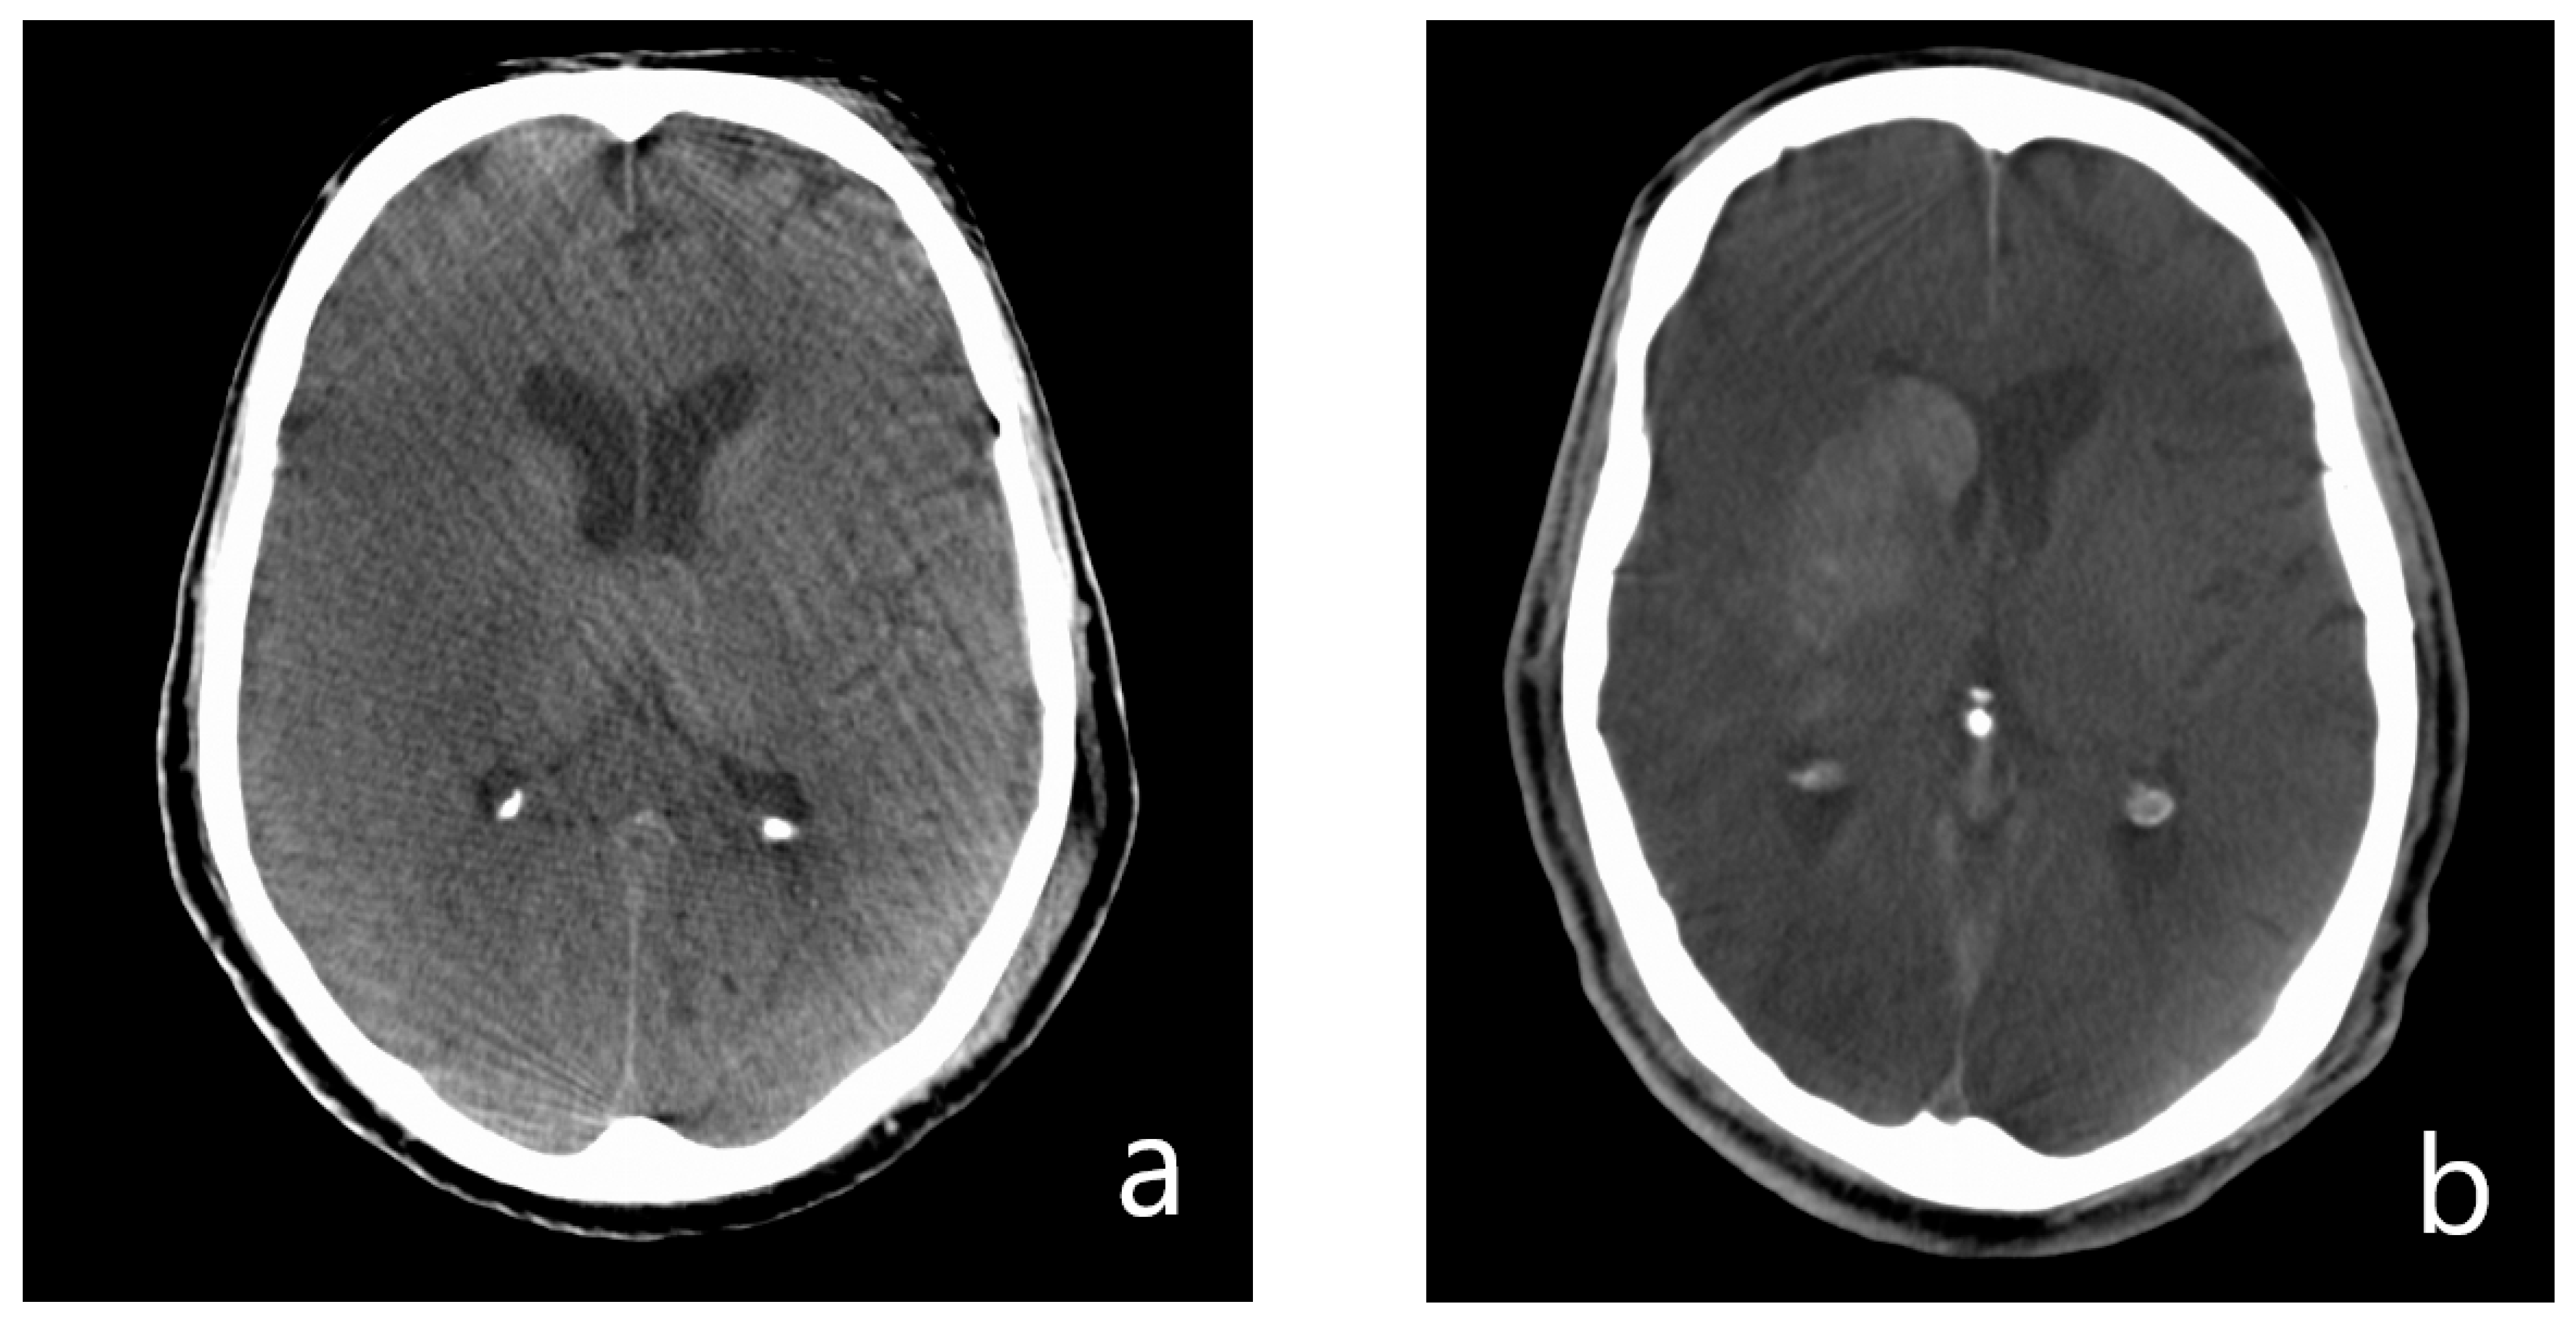
2.3. FDCT
2.4. Imaging Analysis
- Presence of hyperdense areas in FDCT.
- Analysis of hyperdense lesions in FDCT regarding:
- volume of the hyperdensity;
- involved brain regions (basal ganglia vs. white matter vs. cortical);
- categorising by appliance of ASPECTS.
2.5. Data Analysis
3. Results
3.1. Basic Charcteristics
3.2. Hyperdensity in Patient Context
3.3. Demographics
3.4. Past Medical History
3.5. Stroke Assessment
3.6. Stroke Treatment
3.7. FDCT after EVT
3.8. Follow-Up
3.9. Multivariable Regression Analysis
4. Discussion
Limitations
5. Conclusions
Author Contributions
Funding
Institutional Review Board Statement
Informed Consent Statement
Data Availability Statement
Conflicts of Interest
References
- Ringleb, P.A.; Hametner, C.; Köhrmann, M.; Frank, B.; Jansen, O. German Guidelines for Acut-Therapy of Ischaemic Stroke (Akuttherapie des Ischämischen Schlaganfalls, S2e-Leitlinie). In Leitlinien für Diagnostik und Therapie in der Neurologie; Deutsche Gesellschaft für Neurologie: Weimar, Germany, 2021; Available online: www.dgn.org/leitlinien (accessed on 7 October 2022).
- Turc, G.; Bhogal, P.; Fischer, U.; Khatri, P.; Lobotesis, K.; Mazighi, M.; Schellinger, P.D.; Toni, D.; de Vries, J.; White, P.; et al. European Stroke Organisation (ESO)–European Society for Minimally Invasive Neurological Therapy (ESMINT) Guidelines on Mechanical Thrombectomy in Acute Ischaemic StrokeEndorsed by Stroke Alliance for Europe (SAFE). Eur. Stroke J. 2019, 4, 6–12. [Google Scholar] [CrossRef] [PubMed]
- Powers, W.J.; Rabinstein, A.A.; Ackerson, T.; Adeoye, O.M.; Bambakidis, N.C.; Becker, K.; Biller, J.; Brown, M.; Demaerschalk, B.M.; Hoh, B.; et al. Guidelines for the Early Management of Patients With Acute Ischemic Stroke: 2019 Update to the 2018 Guidelines for the Early Management of Acute Ischemic Stroke: A Guideline for Healthcare Professionals From the American Heart Association/American Stroke Association. Stroke 2019, 50, e344–e418. [Google Scholar] [CrossRef] [PubMed]
- Berkhemer, O.A.; Fransen, P.S.S.; Beumer, D.; van den Berg, L.A.; Lingsma, H.F.; Yoo, A.J.; Schonewille, W.J.; Vos, J.A.; Nederkoorn, P.J.; Wermer, M.J.; et al. A randomized trial of intraarterial treatment for acute ischemic stroke. N. Engl. J. Med. 2015, 372, 11–20. [Google Scholar] [CrossRef] [PubMed]
- Campbell, B.C.; Mitchell, P.J.; Kleinig, T.J.; Dewey, H.M.; Churilov, L.; Yassi, N.; Yan, B.; Dowling, R.J.; Parsons, M.W.; Oxley, T.J.; et al. Endovascular therapy for ischemic stroke with perfusion-imaging selection. N. Engl. J. Med. 2015, 372, 1009–1018. [Google Scholar] [CrossRef]
- Goyal, M.; Demchuk, A.M.; Menon, B.K.; Eesa, M.; Rempel, J.L.; Thornton, J.; Roy, D.; Jovin, T.G.; Willinsky, R.A.; Sapkota, B.L.; et al. Randomized assessment of rapid endovascular treatment of ischemic stroke. N. Engl. J. Med. 2015, 372, 1019–1030. [Google Scholar] [CrossRef]
- Jovin, T.G.; Chamorro, A.; Cobo, E.; de Miquel, M.A.; Molina, C.A.; Rovira, A.; San Román, L.; Serena, J.; Abilleira, S.; Ribó, M.; et al. REVASCAT Trial Investigators Thrombectomy within 8 hours after symptom onset in ischemic stroke. N. Engl. J. Med. 2015, 372, 2296–2306. [Google Scholar] [CrossRef]
- Saver, J.L.; Goyal, M.; Bonafe, A.; Diener, H.-C.; Levy, E.I.; Pereira, V.M.; Albers, G.W.; Cognard, C.; Cohen, D.J.; Hacke, W.; et al. Stent-retriever thrombectomy after intravenous t-PA vs. t-PA alone in stroke. N. Engl. J. Med. 2015, 372, 2285–2295. [Google Scholar] [CrossRef]
- Bracard, S.; Ducrocq, X.; Mas, J.L.; Soudant, M.; Oppenheim, C.; Moulin, T.; Guillemin, F.; THRACE Investigators. Mechanical thrombectomy after intravenous alteplase versus alteplase alone after stroke (THRACE): A randomised controlled trial. Lancet Neurol. 2016, 15, 1138–1147. [Google Scholar] [CrossRef]
- Goyal, M.; Menon, B.K.; van Zwam, W.H.; Dippel, D.W.J.; Mitchell, P.J.; Demchuk, A.M.; Dávalos, A.; Majoie, C.B.L.M.; van der Lugt, A.; de Miquel, M.A.; et al. Endovascular thrombectomy after large-vessel ischaemic stroke: A meta-analysis of individual patient data from five randomised trials. Lancet 2016, 387, 1723–1731. [Google Scholar] [CrossRef]
- Schregel, K.; Behme, D.; Tsogkas, I.; Knauth, M.; Maier, I.; Karch, A.; Mikolajczyk, R.; Bähr, M.; Schäper, J.; Hinz, J.; et al. Optimized Management of Endovascular Treatment for Acute Ischemic Stroke. J. Vis. Exp. 2018, 131, e56397. [Google Scholar] [CrossRef]
- Doerfler, A.; Gölitz, P.; Engelhorn, T.; Kloska, S.; Struffert, T. Flat-Panel Computed Tomography (DYNA-CT) in Neuroradiology. From High-Resolution Imaging of Implants to One-Stop-Shopping for Acute Stroke. Clin. Neuroradiol. 2015, 25 (Suppl. S2), 291–297. [Google Scholar] [CrossRef]
- Struffert, T.; Eyupoglu, I.Y.; Huttner, H.B.; Engelhorn, T.; Doelken, M.; Saake, M.; Ganslandt, O.; Doerfler, A. Clinical evaluation of flat-panel detector compared with multislice computed tomography in 65 patients with acute intracranial hemorrhage: Initial results. Clinical article. J. Neurosurg. 2010, 113, 901–907. [Google Scholar] [CrossRef] [PubMed]
- Payabvash, S.; Khan, A.A.; Qureshi, M.H.; Saeed, O.; Suri, M.F.K.; Qureshi, A.I. Detection of Intraparenchymal Hemorrhage After Endovascular Therapy in Patients with Acute Ischemic Stroke Using Immediate Postprocedural Flat-Panel Computed Tomography Scan. J. Neuroimaging 2016, 26, 213–218. [Google Scholar] [CrossRef] [PubMed]
- Maier, I.L.; Leyhe, J.R.; Tsogkas, I.; Behme, D.; Schregel, K.; Knauth, M.; Schnieder, M.; Liman, J.; Psychogios, M.-N. Diagnosing Early Ischemic Changes with the Latest-Generation Flat Detector CT: A Comparative Study with Multidetector CT. AJNR Am. J. Neuroradiol. 2018, 39, 881–886. [Google Scholar] [CrossRef] [PubMed]
- Kim, J.-T.; Heo, S.-H.; Cho, B.-H.; Choi, S.-M.; Lee, S.-H.; Park, M.-S.; Yoon, W.; Cho, K.-H. Hyperdensity on non-contrast CT immediately after intra-arterial revascularization. J. Neurol. 2012, 259, 936–943. [Google Scholar] [CrossRef] [PubMed]
- Yoon, W.; Seo, J.J.; Kim, J.K.; Cho, K.H.; Park, J.G.; Kang, H.K. Contrast enhancement and contrast extravasation on computed tomography after intra-arterial thrombolysis in patients with acute ischemic stroke. Stroke 2004, 35, 876–881. [Google Scholar] [CrossRef]
- Chen, L.; Xu, Y.; Shen, R.; Sun, J.; Zhang, X.; Zhang, Q.; Wang, F. Flat Panel CT Scanning Is Helpful in Predicting Hemorrhagic Transformation in Acute Ischemic Stroke Patients Undergoing Endovascular Thrombectomy. BioMed Res. Int. 2021, 2021, 5527101. [Google Scholar] [CrossRef]
- Dekeyzer, S.; Nikoubashman, O.; Lutin, B.; De Groote, J.; Vancaester, E.; De Blauwe, S.; Hemelsoet, D.; Wiesmann, M.; Defreyne, L. Distinction between contrast staining and hemorrhage after endovascular stroke treatment: One CT is not enough. J. Neurointerventional Surg. 2017, 9, 394–398. [Google Scholar] [CrossRef]
- Bernsen, M.L.E.; Veendrick, P.B.; Martens, J.M.; Pijl, M.E.J.; Hofmeijer, J.; van Gorp, M.J. Initial experience with dual-layer detector spectral CT for diagnosis of blood or contrast after endovascular treatment for ischemic stroke. Neuroradiology 2022, 64, 69–76. [Google Scholar] [CrossRef]
- Tomsick, T. Hyperattenuated intracerebral lesions after mechanical recanalization in acute stroke: Contrast and compare. AJNR Am. J. Neuroradiol. 2014, 35, 352–353. [Google Scholar] [CrossRef]
- Xu, C.; Zhou, Y.; Zhang, R.; Chen, Z.; Zhong, W.; Gong, X.; Ding, X.; Lou, M. Metallic Hyperdensity Sign on Noncontrast CT Immediately after Mechanical Thrombectomy Predicts Parenchymal Hemorrhage in Patients with Acute Large-Artery Occlusion. AJNR Am. J. Neuroradiol. 2019, 40, 661–667. [Google Scholar] [CrossRef]
- Schneider, T.; Mahraun, T.; Schroeder, J.; Frölich, A.; Hoelter, P.; Wagner, M.; Darcourt, J.; Cognard, C.; Bonafé, A.; Fiehler, J.; et al. Intraparenchymal Hyperattenuations on Flat-Panel CT Directly After Mechanical Thrombectomy are Restricted to the Initial Infarct Core on Diffusion-Weighted Imaging. Clin. Neuroradiol. 2018, 28, 91–97. [Google Scholar] [CrossRef] [PubMed]
- Choi, H.Y.; Lee, K.M.; Kim, H.-G.; Kim, E.J.; Choi, W.S.; Kim, B.J.; Heo, S.H.; Chang, D.-I. Role of Hyperintense Acute Reperfusion Marker for Classifying the Stroke Etiology. Front. Neurol. 2017, 8, 630. [Google Scholar] [CrossRef] [PubMed]
- Köhrmann, M.; Struffert, T.; Frenzel, T.; Schwab, S.; Doerfler, A. The hyperintense acute reperfusion marker on fluid-attenuated inversion recovery magnetic resonance imaging is caused by gadolinium in the cerebrospinal fluid. Stroke 2012, 43, 259–261. [Google Scholar] [CrossRef]
- Kuroiwa, T.; Ting, P.; Martinez, H.; Klatzo, I. The biphasic opening of the blood-brain barrier to proteins following temporary middle cerebral artery occlusion. Acta Neuropathol. 1985, 68, 122–129. [Google Scholar] [CrossRef]
- Engelhardt, S.; Patkar, S.; Ogunshola, O.O. Cell-specific blood-brain barrier regulation in health and disease: A focus on hypoxia. Br. J. Pharmacol. 2014, 171, 1210–1230. [Google Scholar] [CrossRef] [PubMed]
- Lochhead, J.J.; McCaffrey, G.; Quigley, C.E.; Finch, J.; DeMarco, K.M.; Nametz, N.; Davis, T.P. Oxidative stress increases blood–brain barrier permeability and induces alterations in occludin during hypoxia–reoxygenation. J. Cereb. Blood Flow Metab. 2010, 30, 1625–1636. [Google Scholar] [CrossRef]
- Warach, S.; Latour, L.L. Evidence of reperfusion injury, exacerbated by thrombolytic therapy, in human focal brain ischemia using a novel imaging marker of early blood–brain barrier disruption. Stroke 2004, 35 (Suppl. S1), 2659–2661. [Google Scholar] [CrossRef]
- Rosner, G.; Graf, R.; Kataoka, K.; Heiss, W.D. Selective functional vulnerability of cortical neurons following transient MCA-occlusion in the cat. Stroke 1986, 17, 76–82. [Google Scholar] [CrossRef]
- Marcoux, F.W.; Morawetz, R.B.; Crowell, R.M.; DeGirolami, U.; Halsey, J.H., Jr. Differential regional vulnerability in transient focal cerebral ischemia. Stroke 1982, 13, 339–346. [Google Scholar] [CrossRef]
- Ginsberg, M.D.; Medoff, R.; Reivich, M. Heterogeneities of regional cerebral blood flow during hypoxia-ischemia in the rat. Stroke 1976, 7, 132–134. [Google Scholar] [CrossRef] [PubMed]
- Ventura-Antunes, A.; Herculano-Houzel, S. Energy supply per neuron is constrained by capillary density in the mouse brain. Front. Integr. Neurosci. 2022, 16, 760887. [Google Scholar] [CrossRef] [PubMed]
- Won, S.-Y.; Schlunk, F.; Dinkel, J.; Karatas, H.; Leung, W.; Hayakawa, K.; Lauer, A.; Steinmetz, H.; Lo, E.H.; Foerch, C.; et al. Imaging of contrast medium extravasation in anticoagulation-associated intracerebral hemorrhage with dual-energy computed tomography. Stroke 2013, 44, 2883–2890. [Google Scholar] [CrossRef]
- Curtze, S.; Strbian, D.; Meretoja, A.; Putaala, J.; Eriksson, H.; Haapaniemi, E.; Mustanoja, S.; Sairanen, T.; Satopää, J.; Silvennoinen, H.; et al. Higher baseline international normalized ratio value correlates with higher mortality in intracerebral hemorrhage during warfarin use. Eur. J. Neurol. 2014, 21, 616–622. [Google Scholar] [CrossRef] [PubMed]
- Inohara, T.; Xian, Y.; Liang, L.; Matsouaka, R.A.; Saver, J.L.; Smith, E.E.; Schwamm, L.H.; Reeves, M.J.; Hernandez, A.F.; Bhatt, D.L.; et al. Association of Intracerebral Hemorrhage Among Patients Taking Non-Vitamin K Antagonist vs Vitamin K Antagonist Oral Anticoagulants With In-Hospital Mortality. JAMA 2018, 319, 463–473. [Google Scholar] [CrossRef]
- Pfeilschifter, W.; Spitzer, D.; Czech-Zechmeister, B.; Steinmetz, H.; Foerch, C. Increased risk of hemorrhagic transformation in ischemic stroke occurring during warfarin anticoagulation: An experimental study in mice. Stroke 2011, 42, 1116–1121. [Google Scholar] [CrossRef]
- Lopez-Navarro, E.R.; Delfs, C.; Jarre, A.; Sanio, V.; Greif, G.; Gutierrez, J.; Ringelstein, E.B.; Meuth, S.G.; Haensch, C.-A.; Ringelstein, A.; et al. Contrast Neurotoxicity and its Association with Symptomatic Intracranial Hemorrhage After Mechanical Thrombectomy. Clin. Neuroradiol. 2022, 32, 961–969. [Google Scholar] [CrossRef]
- Khatri, R.; McKinney, A.M.; Swenson, B.; Janardhan, V. Blood-brain barrier, reperfusion injury, and hemorrhagic transformation in acute ischemic stroke. Neurology 2012, 79 (Suppl. S1), S52–S57. [Google Scholar] [CrossRef]
- Loose, R.; Wucherer, M.; Brunner, T. Visualization of 3D low contrast objects by CT cone-beam reconstruction of a rotational angiography with a dynamic solid body detector. RoFo 2005, S1, PO160. [Google Scholar]
- Kalender, W.A.; Kyriakou, Y. Flat-detector computed tomography (FD-CT). Eur. Radiol. 2007, 17, 2767–2779. [Google Scholar] [CrossRef]
- Yu, Z.; Park, Y.; Altunbas, C. Simultaneous scatter rejection and correction method using 2D antiscatter grids for CBCT. In Medical Imaging 2020: Image Processing, Houston, TX, USA, 15–20 February 2020; SPIE: Bellingham, WA, USA, 2020; Volume 11312, p. 113122W. [Google Scholar] [CrossRef]
- Altunbas, C.; Park, Y.; Yu, Z.; Gopal, A. A unified scatter rejection and correction method for cone beam computed tomography. Med. Phys. 2021, 48, 1211–1225. [Google Scholar] [CrossRef] [PubMed]


| Caracteristica | Total Study Population (n = 474 Patients) | No Hyperdensity in FDCT (n = 186 Patients) | Hyperdensity in FDCT (n = 288 Patients) | p Value |
|---|---|---|---|---|
| Demographics | ||||
| Age (in years) | 75.2 [61.9–82.2] | 74.9 [61.8–81.5] | 72.4 [62–82.7] | 0.549 |
| Gender | ||||
| Female | 266 (56.1%) | 103 (55.4%) | 163 (56.6%) | 0.794 |
| Male | 208 (43.9%) | 83 (44.6%) | 125 (43.4%) | |
| Past medical history | ||||
| arterial hypertension | 375 (79.2%) | 145 (78%) | 229 (79.5%) | 0.712 |
| Diabetes | 143 (30.1%) | 56 (30.1%) | 86 (29.9%) | 0.963 |
| Medication | ||||
| Anti-platelet therapy | ||||
| Mono-therapy | 126 (26.8%) | 54 (29%) | 72 (25%) | 0.409 |
| Dual-therapy | 11 (2.3%) | 4 (2.2%) | 7 (2.4%) | |
| Anticoagulation | 93 (19.5%) | 30 (16.1%) | 62 (21.5%) | 0.145 |
| Stroke assessment | ||||
| Initial mRS | 0 [0–2] | 0 [0–2] | 0 [0–2] | 0.248 |
| NIHSS at admission | 15 [11–19] | 14 [10–19] | 16 [12–20] | <0.001 |
| Wake-up stroke | 38 (8%) | 16 (8.6%) | 22 (7.6%) | 0.706 |
| Known time window (in min) | 132 [65.3–365.3] | 96.5 [60–263.3] | 173 [68.8–426.3] | 0.002 |
| Chemical analysis | ||||
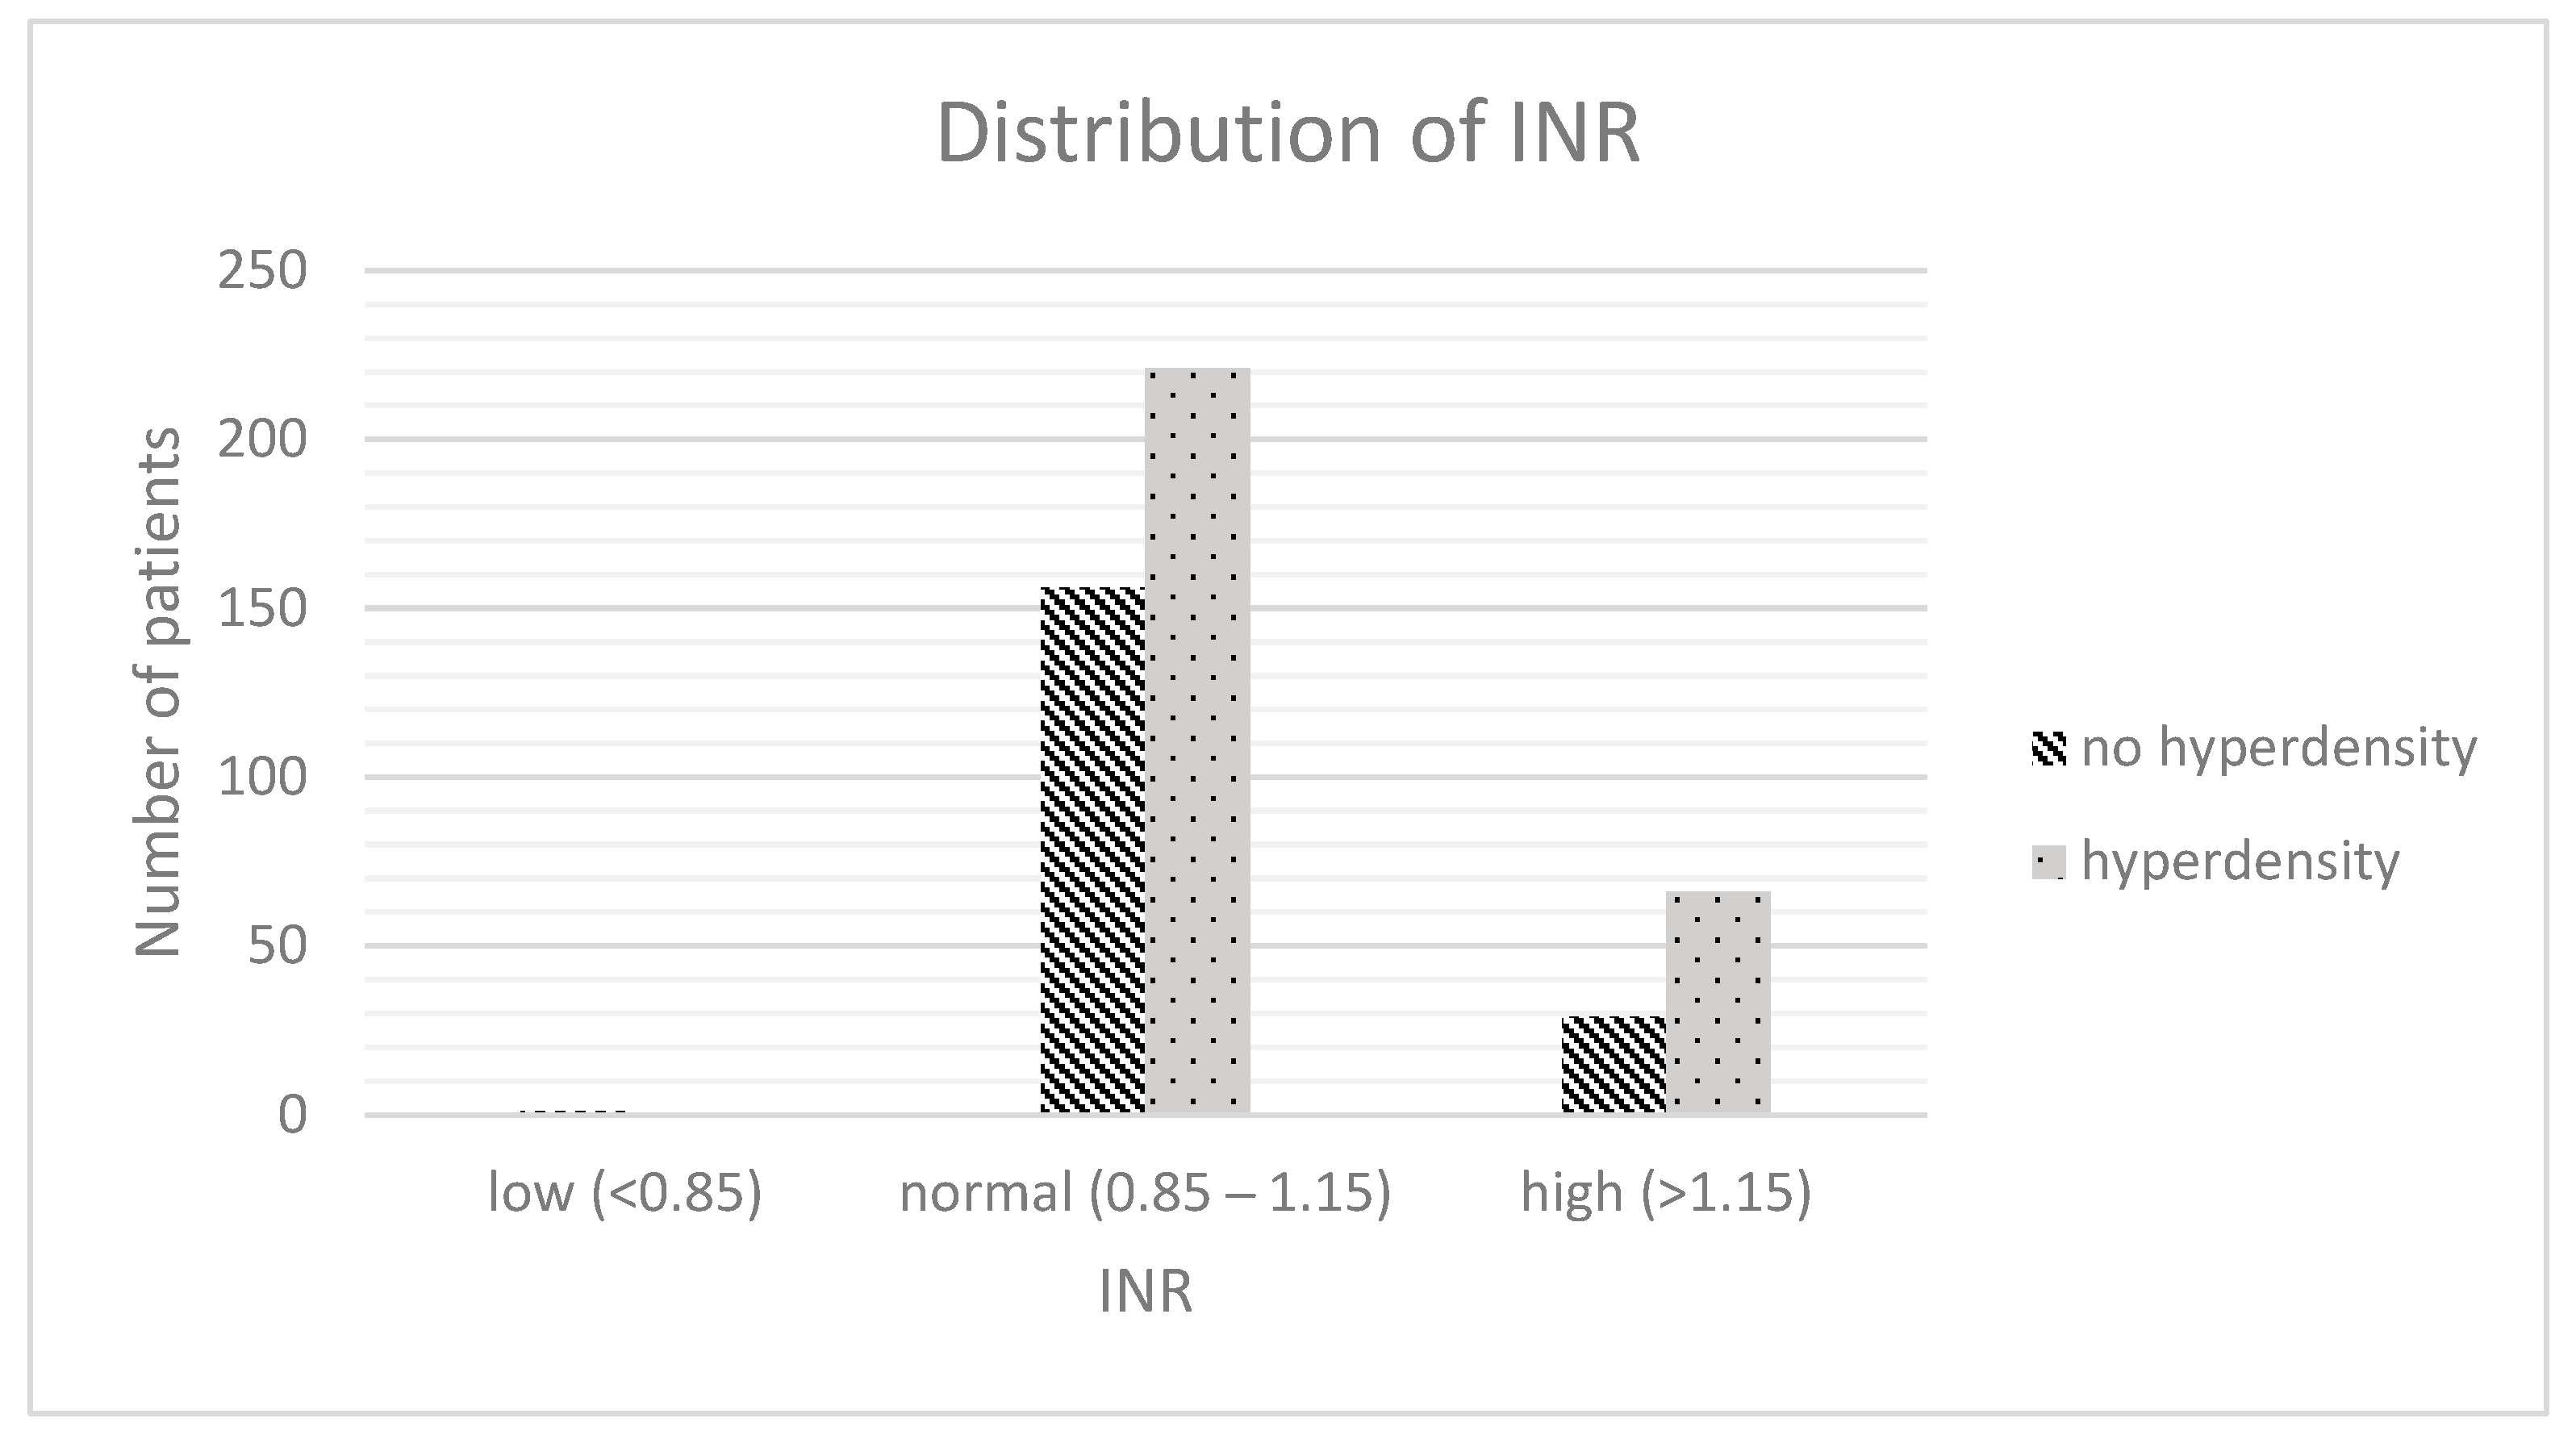
| INR | 1.1 [1.0–1.1] | 1.1 [1.0–1.2] | 1.1 [1.0–1.3] | 0.019 |
| INR (rating) | ||||
| Low (<0.85) | 1 (0.2%) | 1 (0.5%) | 0 (0%) | 0.046 |
| Normal (0.85–1.15) | 377 (79.9%) | 156 (83.9%) | 223 (77.4%) | |
| High (>1.15) | 94 (19.9%) | 29 (15.6%) | 65 (22.6%) | |
| aPTT (in s) | 29.4 [26.9–32.6] | 29.2 [26.7–32.0] | 29.7 [26.9–33] | 0.168 |
| aPTT (rating) | ||||
| Low (<20 s) | 0 (0%) | 0 (0%) | 0 (0%) | 0.016 |
| Normal (20–40 s) | 446 (94.1%) | 181 (97.3%) | 265 (92%) | |
| High (>40 s) | 28 (5.9%) | 5 (2.7%) | 23 (8%) | |
| Platelet count (in 10³ platelets/µL) | 222 [181.3–271.5] | 226.5 [184.8–268] | 216 [180.8–272] | 0.684 |
| Platelet count (rating) | ||||
| Low (<150 × 10³ platelets/µL) | 45 (9.5%) | 15 (8.1%) | 30 (10.5%) | 0.716 |
| Normal (150–400 × 10³ platelets/µL) | 415 (87.5%) | 167 (89.8%) | 248 (86.1%) | |
| High (>400 × 10³ platelets/µL) | 14 (3%) | 4 (2.2%) | 10 (3.5%) | |
| Stroke imaging | ||||
| ASPECTS in NECT | 9 [7–10] | 9 [8–10] | 8 [7–10] | <0.001 |
| Side of occlusion | ||||
| Left | 232 (48.9%) | 92 (49.5%) | 140 (48.6%) | 0.856 |
| Right | 242 (51.1%) | 94 (50.5%) | 148 (51.4%) | |
| Location of occlusion (most proximal) | ||||
| ICA | 140 (29.5%) | 35 (18.8%) | 105 (36.5%) | 0.001 |
| M1 | 249 (52.5%) | 115 (61.8%) | 134 (46.5%) | |
| M2 | 85 (17.9%) | 36 (19.4%) | 49 (17%) | |
| CT-perfusion | 331 (68.8%) | 142 (76.3%) | 189 (65.6%) | 0.013 |
| Infarct core in CT-P (in mL) | 5 [0–29.3] | 0 [0–12] | 12 [0–41] | <0.001 |
| Penumbra in CT-P (in mL) | 123 [80–172.5] | 108 [56–166] | 133 [92–186] | 0.007 |
| Volume of mismatch in CT-P (in mL) | 100 [64.5–145] | 97.5 [54–146] | 103 [68–144] | 0.489 |
| Mismatch-ratio in CT-P | 4.8 [2.9–10.5] | 8.2 [4.3–12.5] | 4 [2.8–9.5] | 0.005 |
| Stroke treatment | ||||
| i.v. thrombolysis | 316 (66.8%) | 133 (71.5%) | 183 (63.5%) | 0.081 |
| EVT related | ||||
| Duration of EVT (in min) | 66 [44.8–99.3] | 55.5 [9–82.5] | 72 [48.3–107.8] | <0.001 |
| PTA/Stentangioplastia | 58 (12.2%) | 18 (9.7%) | 40 (13.9%) | 0.172 |
| Typ of EVT intracranial | ||||
| Aspiration | 140 (29.5%) | 57 (30.6%) | 83 (28.8%) | 0.266 |
| Stentretrieving | 101 (21.3%) | 45 (24.2%) | 56 (19.4%) | |
| Aspiration and stentretrieving | 233 (49.2%) | 84 (45.2%) | 149 (51.7%) | |
| Number of EVT attempts | 2 [1–3] | 2 [1–3] | 2 [1–3] | 0.004 |
| KM volume (in ml) | 150 [100–200] | 150 [100–200] | 150 [100–200] | 0.062 |
| KM volume (grouped) | ||||
| <100 mL | 150 (31.6%) | 63 (33.9%) | 87 (30.2%) | 0.059 |
| 100–150 mL | 139 (29.3%) | 61 (32.8%) | 78 (27.1%) | |
| 150–200 mL | 151 (31.9%) | 54 (29%) | 97 (33.7%) | |
| >200 mL | 34 (7.2%) | 8 (4.3%) | 26 (9%) | |
| TICI | ||||
| 2B | 111 (23.4%) | 33 (17.7%) | 78 (27.1%) | 0.019 |
| 3 | 363 (76.6%) | 153 (82.3%) | 210 (72.9%) | |
| RR during EVT | ||||
| Mean arterial pressure (in mmHg) | 94.9 [87–100.8] | 94.8 [86.8–100.8] | 95.5 [87.3–101] | 0.74 |
| Min. systolic RR (in mmHg) | 115 [100–130] | 120 [105–125] | 115 [100–130] | 0.463 |
| Max. systolic RR (in mmHg) | 150 [140–170] | 150 [140–165] | 150 [140–170] | 0.358 |
| Min. diastolic RR (in mmHg) | 65 [60–70] | 65 [60–75] | 60 [60–70] | 0.081 |
| Max. diastolic RR (in mmHg) | 85 [80–95] | 85 [80–95] | 85 [80–95] | 0.152 |
| FDCT after EVT | ||||
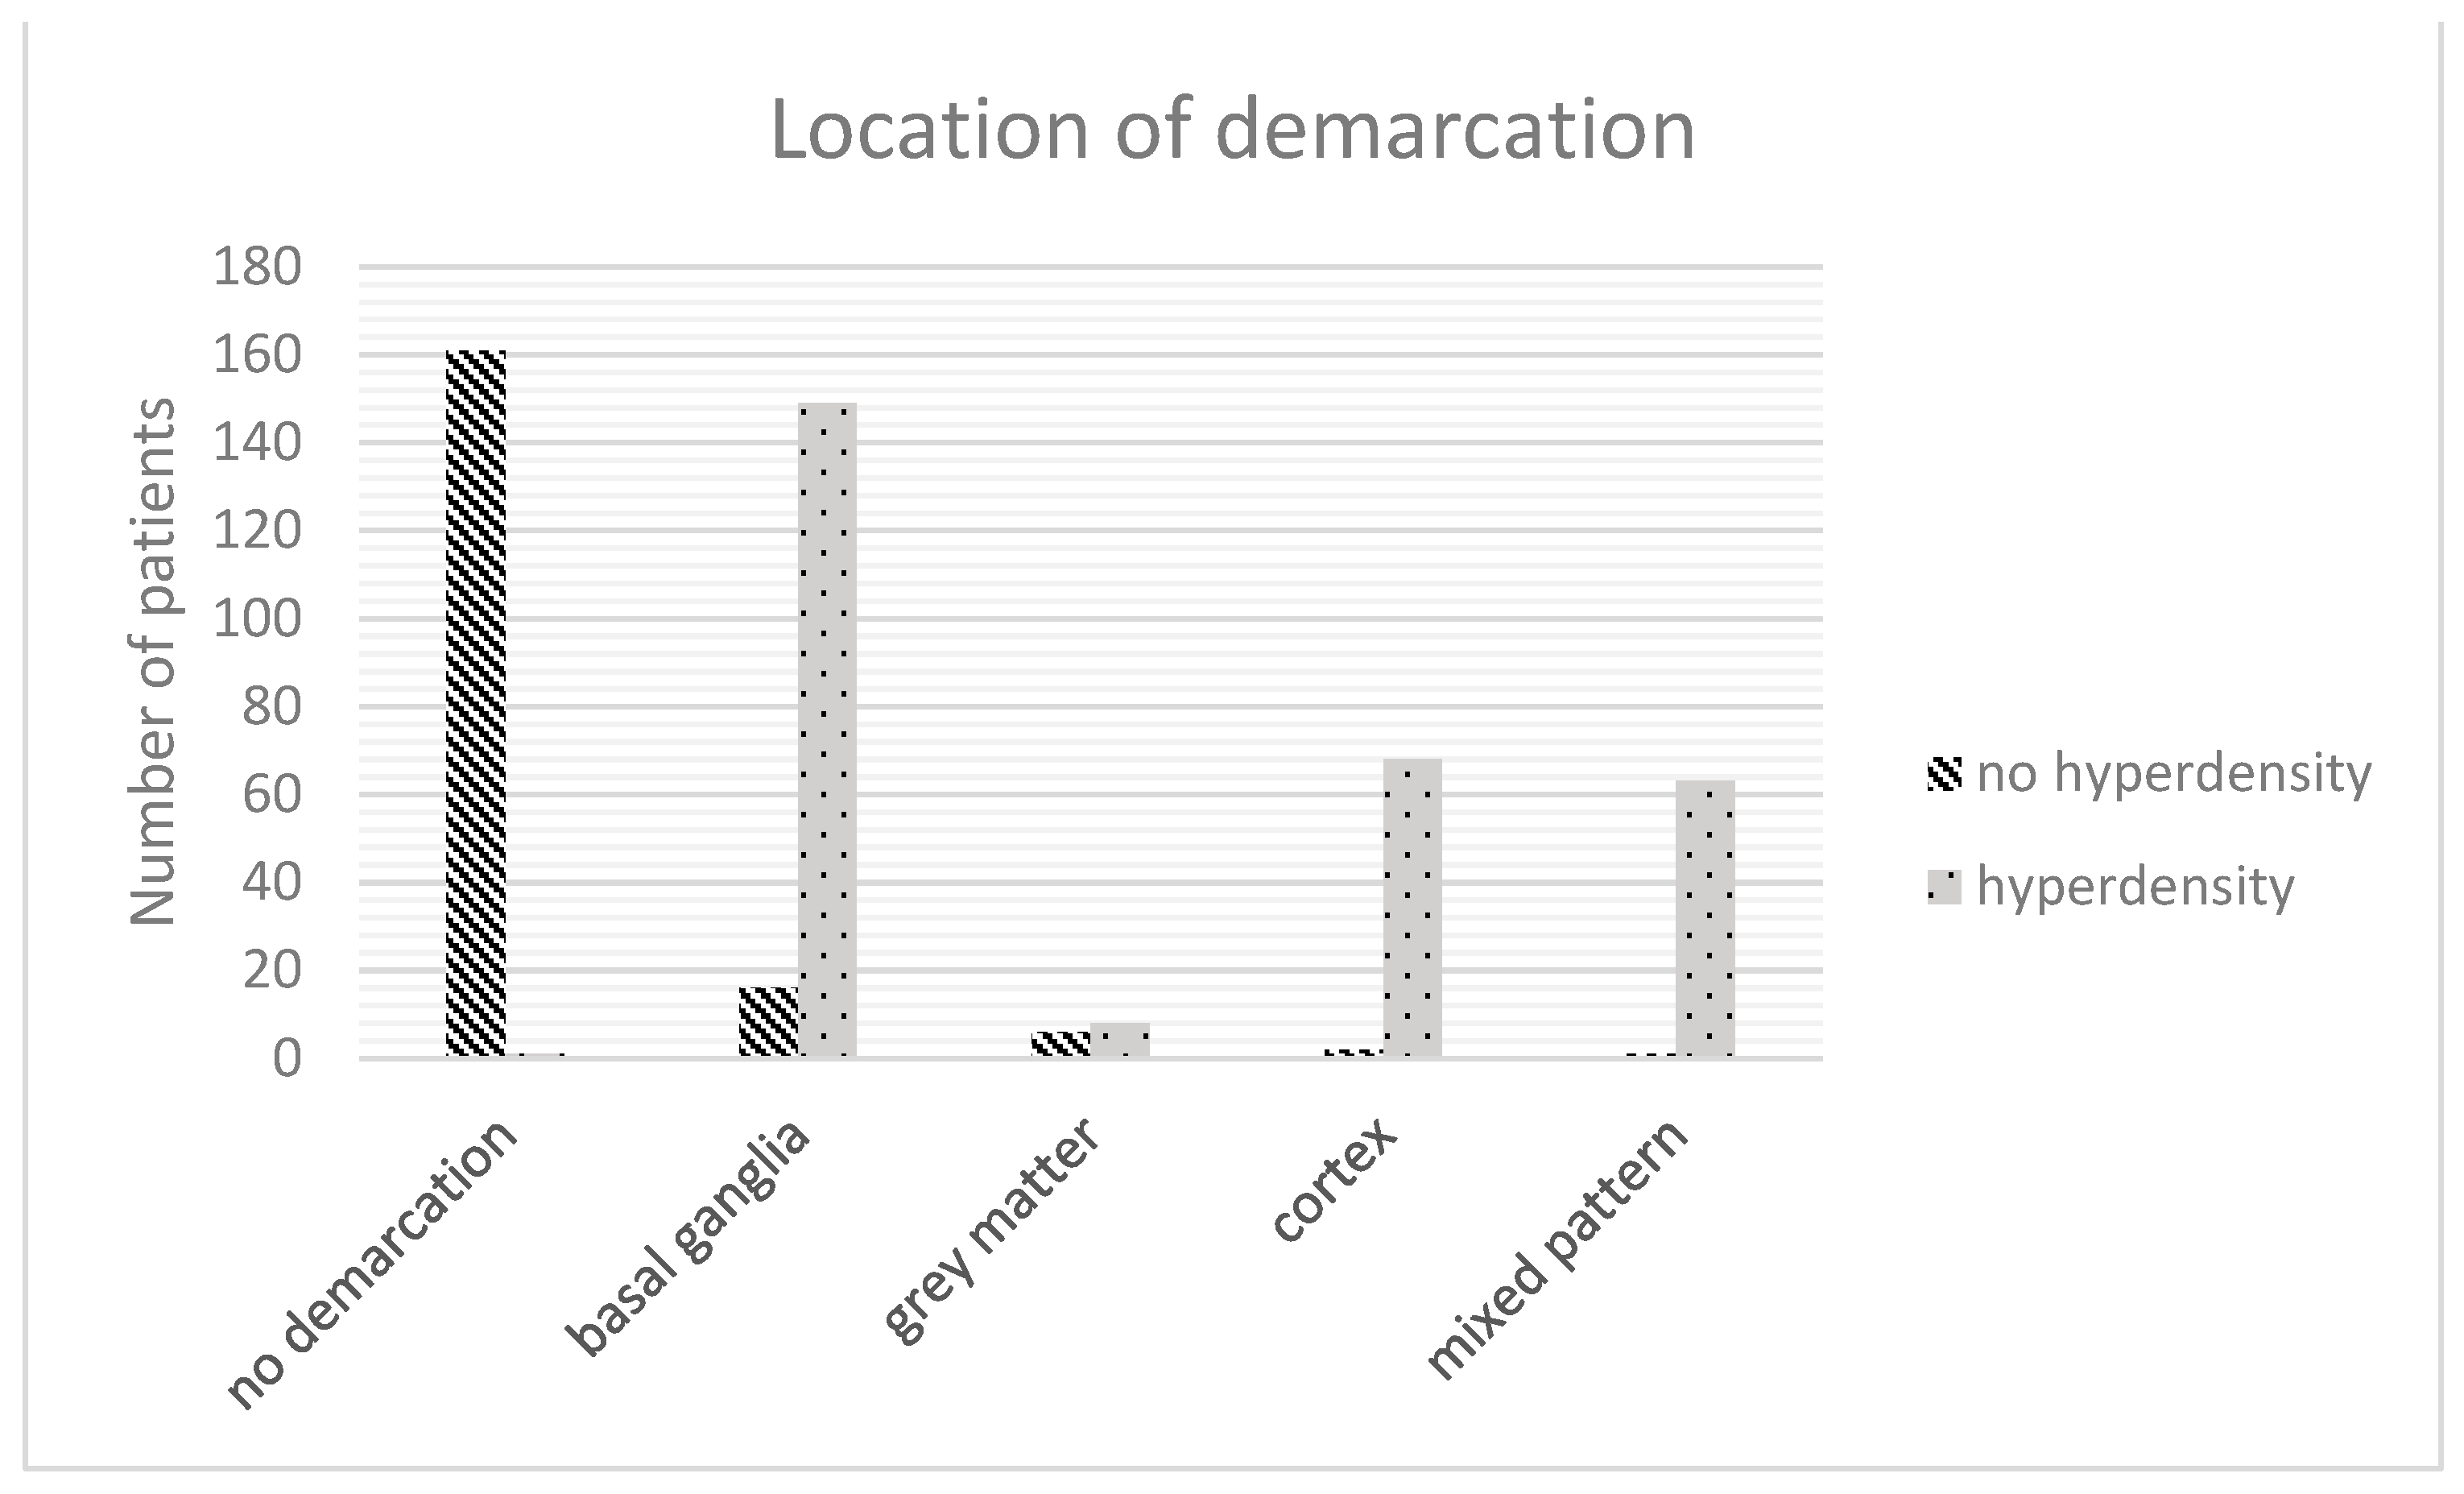
| Location of demarcation | ||||
| Basal ganglia | 165 (34.8%) | 16 (8.6%) | 149 (51.7%) | <0.001 |
| White matter | 14 (3%) | 6 (3.2%) | 8 (2.8%) | |
| Cortical | 70 (14.8%) | 2 (1.1%) | 68 (23.6%) | |
| Mixed pattern | 64 (13.5%) | 1 (0.5%) | 63 (21.9%) | |
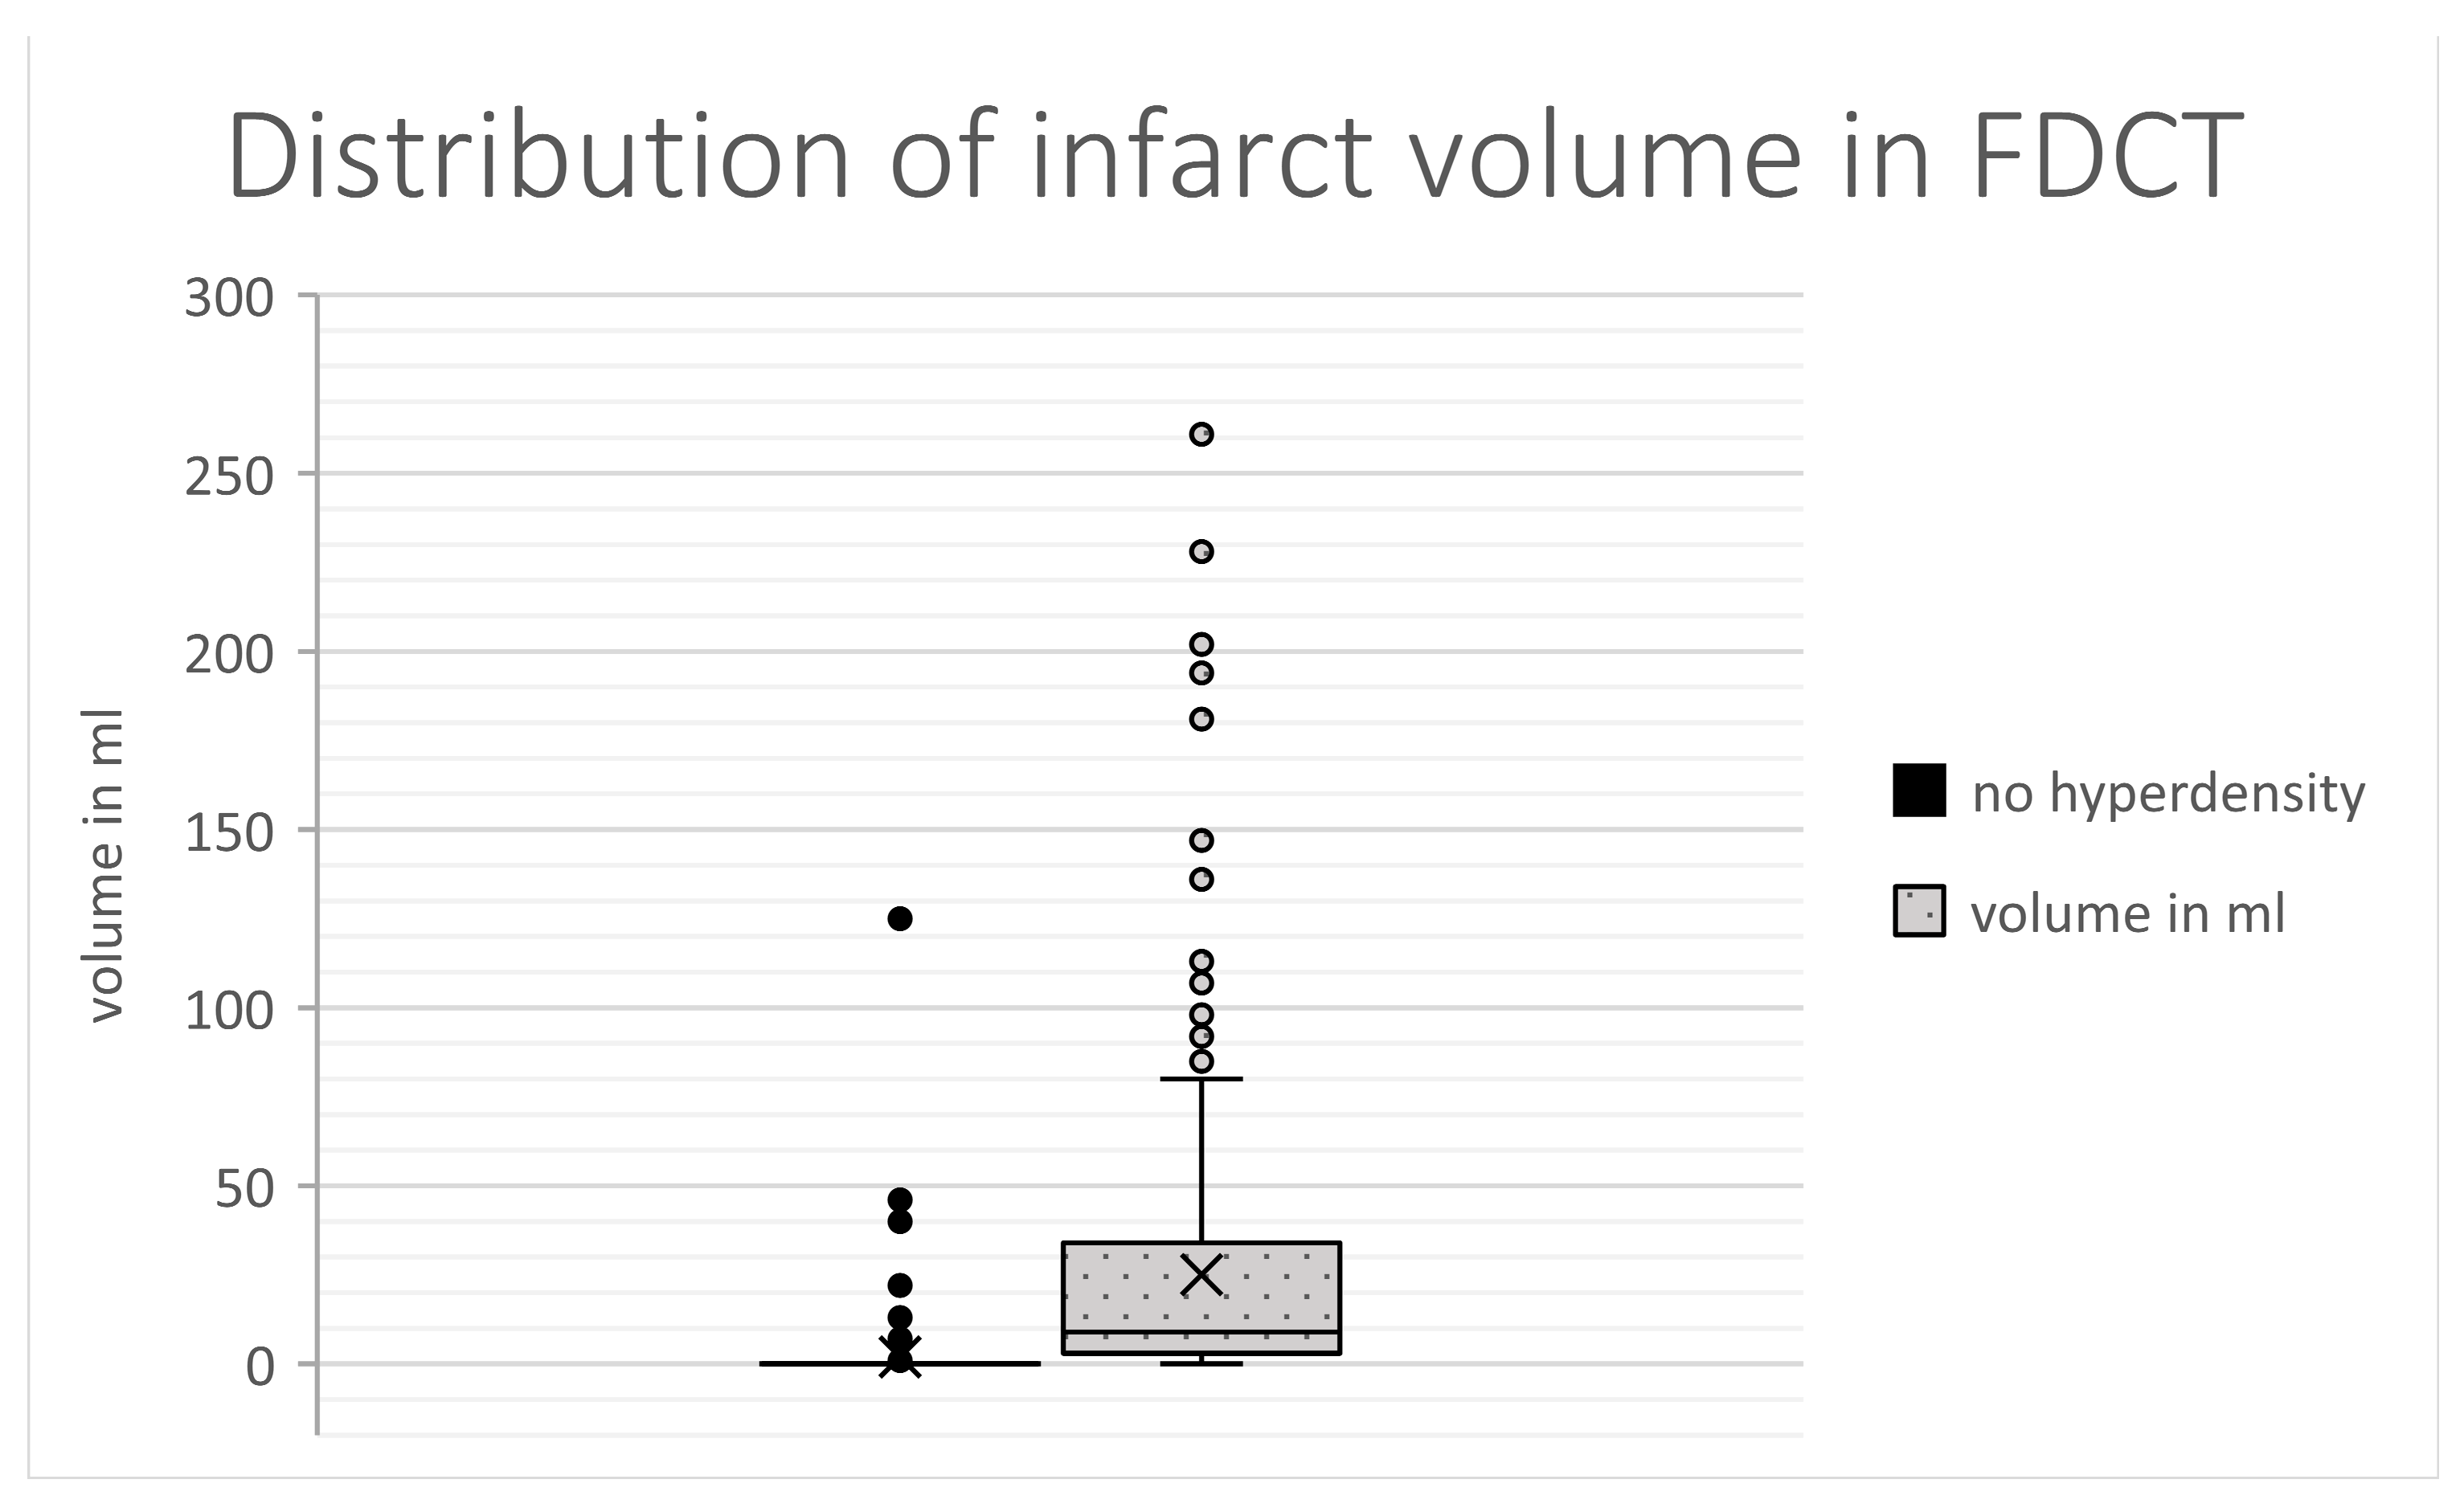
| Volume of demarcation (in mL) | 2.8 [0–13.8] | 0 [0–0] | 25.1 [2.8–33.7] | <0.001 |
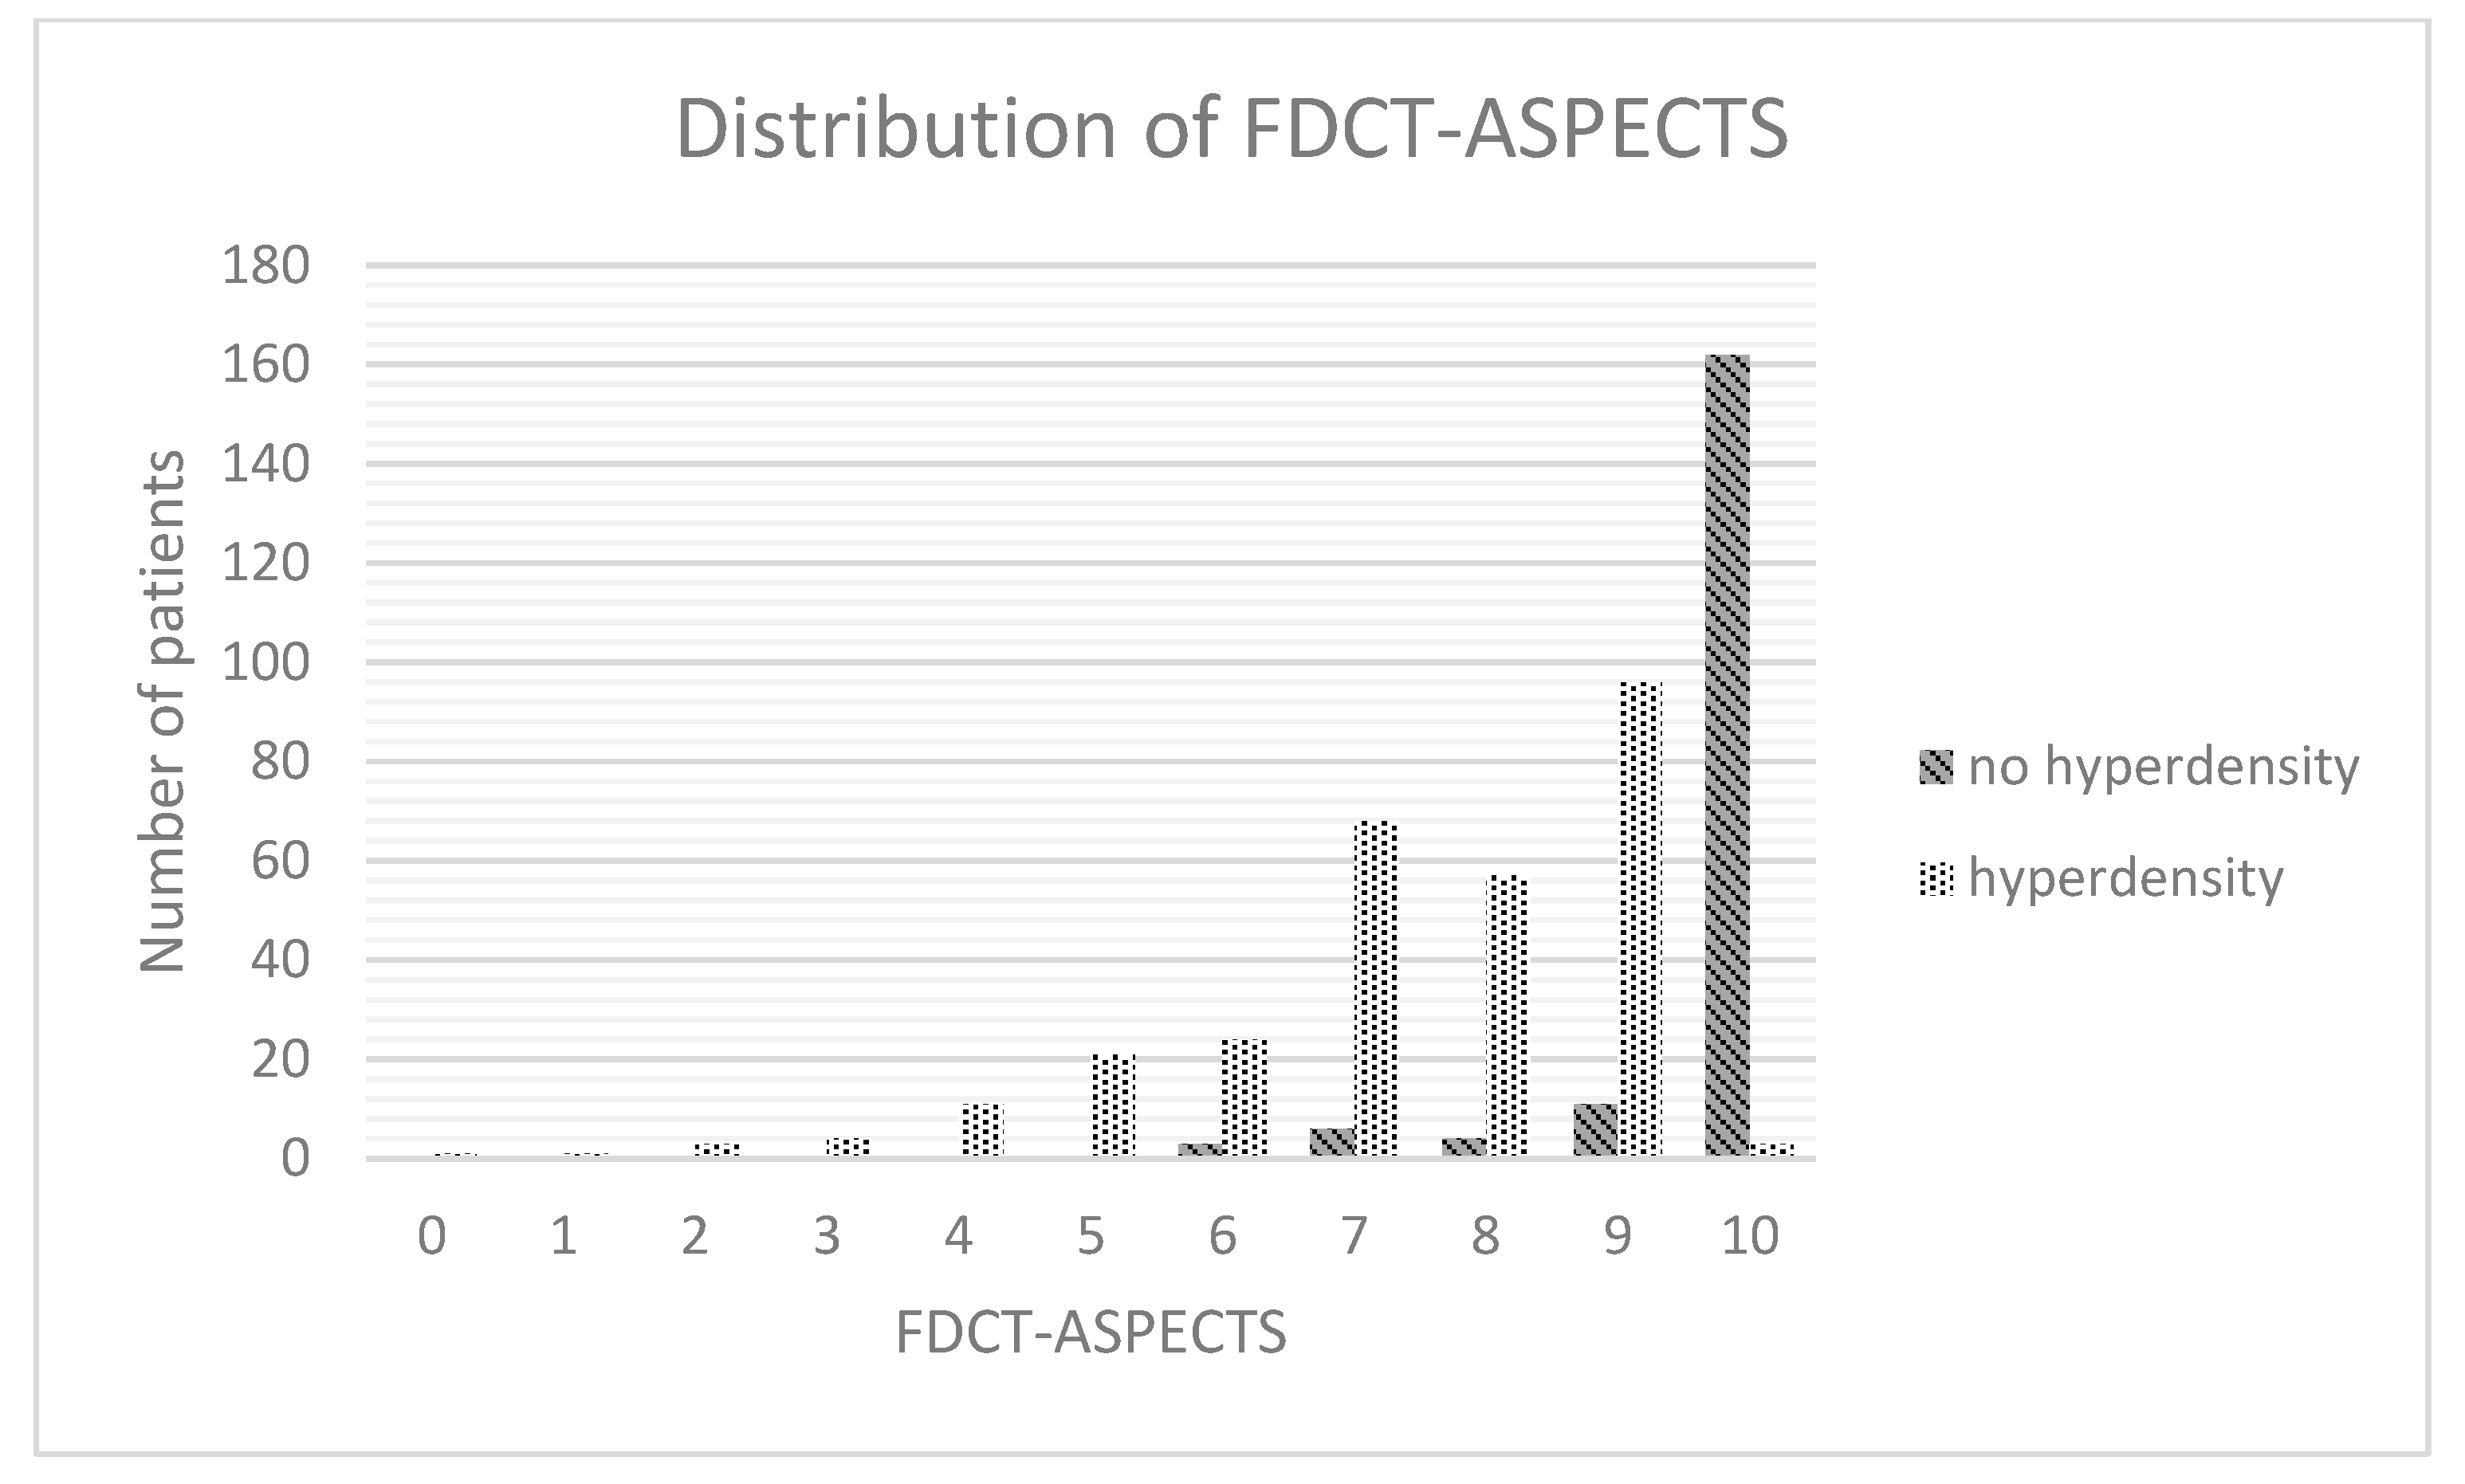
| FDCT-ASPECTS | 9 [7–10] | 10 [10–10] | 8 [7–9] | <0.001 |
| Follow-up | ||||
| Follow-up NECT (24–48 h after EVT) | ||||
| ICH | 49 (10.3%) | 9 (4.8%) | 40 (13.9%) | 0.002 |
| Volume of demarcation | 26 [6–96] | 8 [0–27.9] | 54.5 [18–130] | <0.001 |
| mRS at 90 days | 4 [2–5] | 3 [2–4] | 4 [3–6] | <0.001 |
| Caracteristics | p Value | Odds Ratio | 95% Confidence Interval |
|---|---|---|---|
| Stroke assessment | |||
| chemical analysis | |||
| INR (rating) | 0.003 | 1.212 | 1.067–1.379 |
| aPTT (rating) | 0.063 | 1.372 | 0.982–1.914 |
| known time window (in min) | 0.715 | 1 | 1–1 |
| Stroke imaging | |||
| ASPECTS in NECT | 0.619 | 0.993 | 0.967–1.020 |
| Location of occlusion (most proximal) | 0.26 | 0.969 | 0.915–1.024 |
| CT-perfusion | |||
| Infarct core in CT-P (in ml) | 0.391 | 0.999 | 0.998–1.001 |
| Penumbra in CT-P (in ml) | 0.515 | 1 | 1–1 |
| Mismatch-ratio in CT-P | 0.918 | 1 | 0.994–1.005 |
| Stroke treatment | |||
| Duration of EVT (in min) | 0.952 | 1 | 0.999–1.002 |
| Number of EVT attempts | 0.415 | 0.987 | 0.958–1.018 |
| TICI | 0.608 | 0.971 | 0.869–1.085 |
| FDCT after EVT | |||
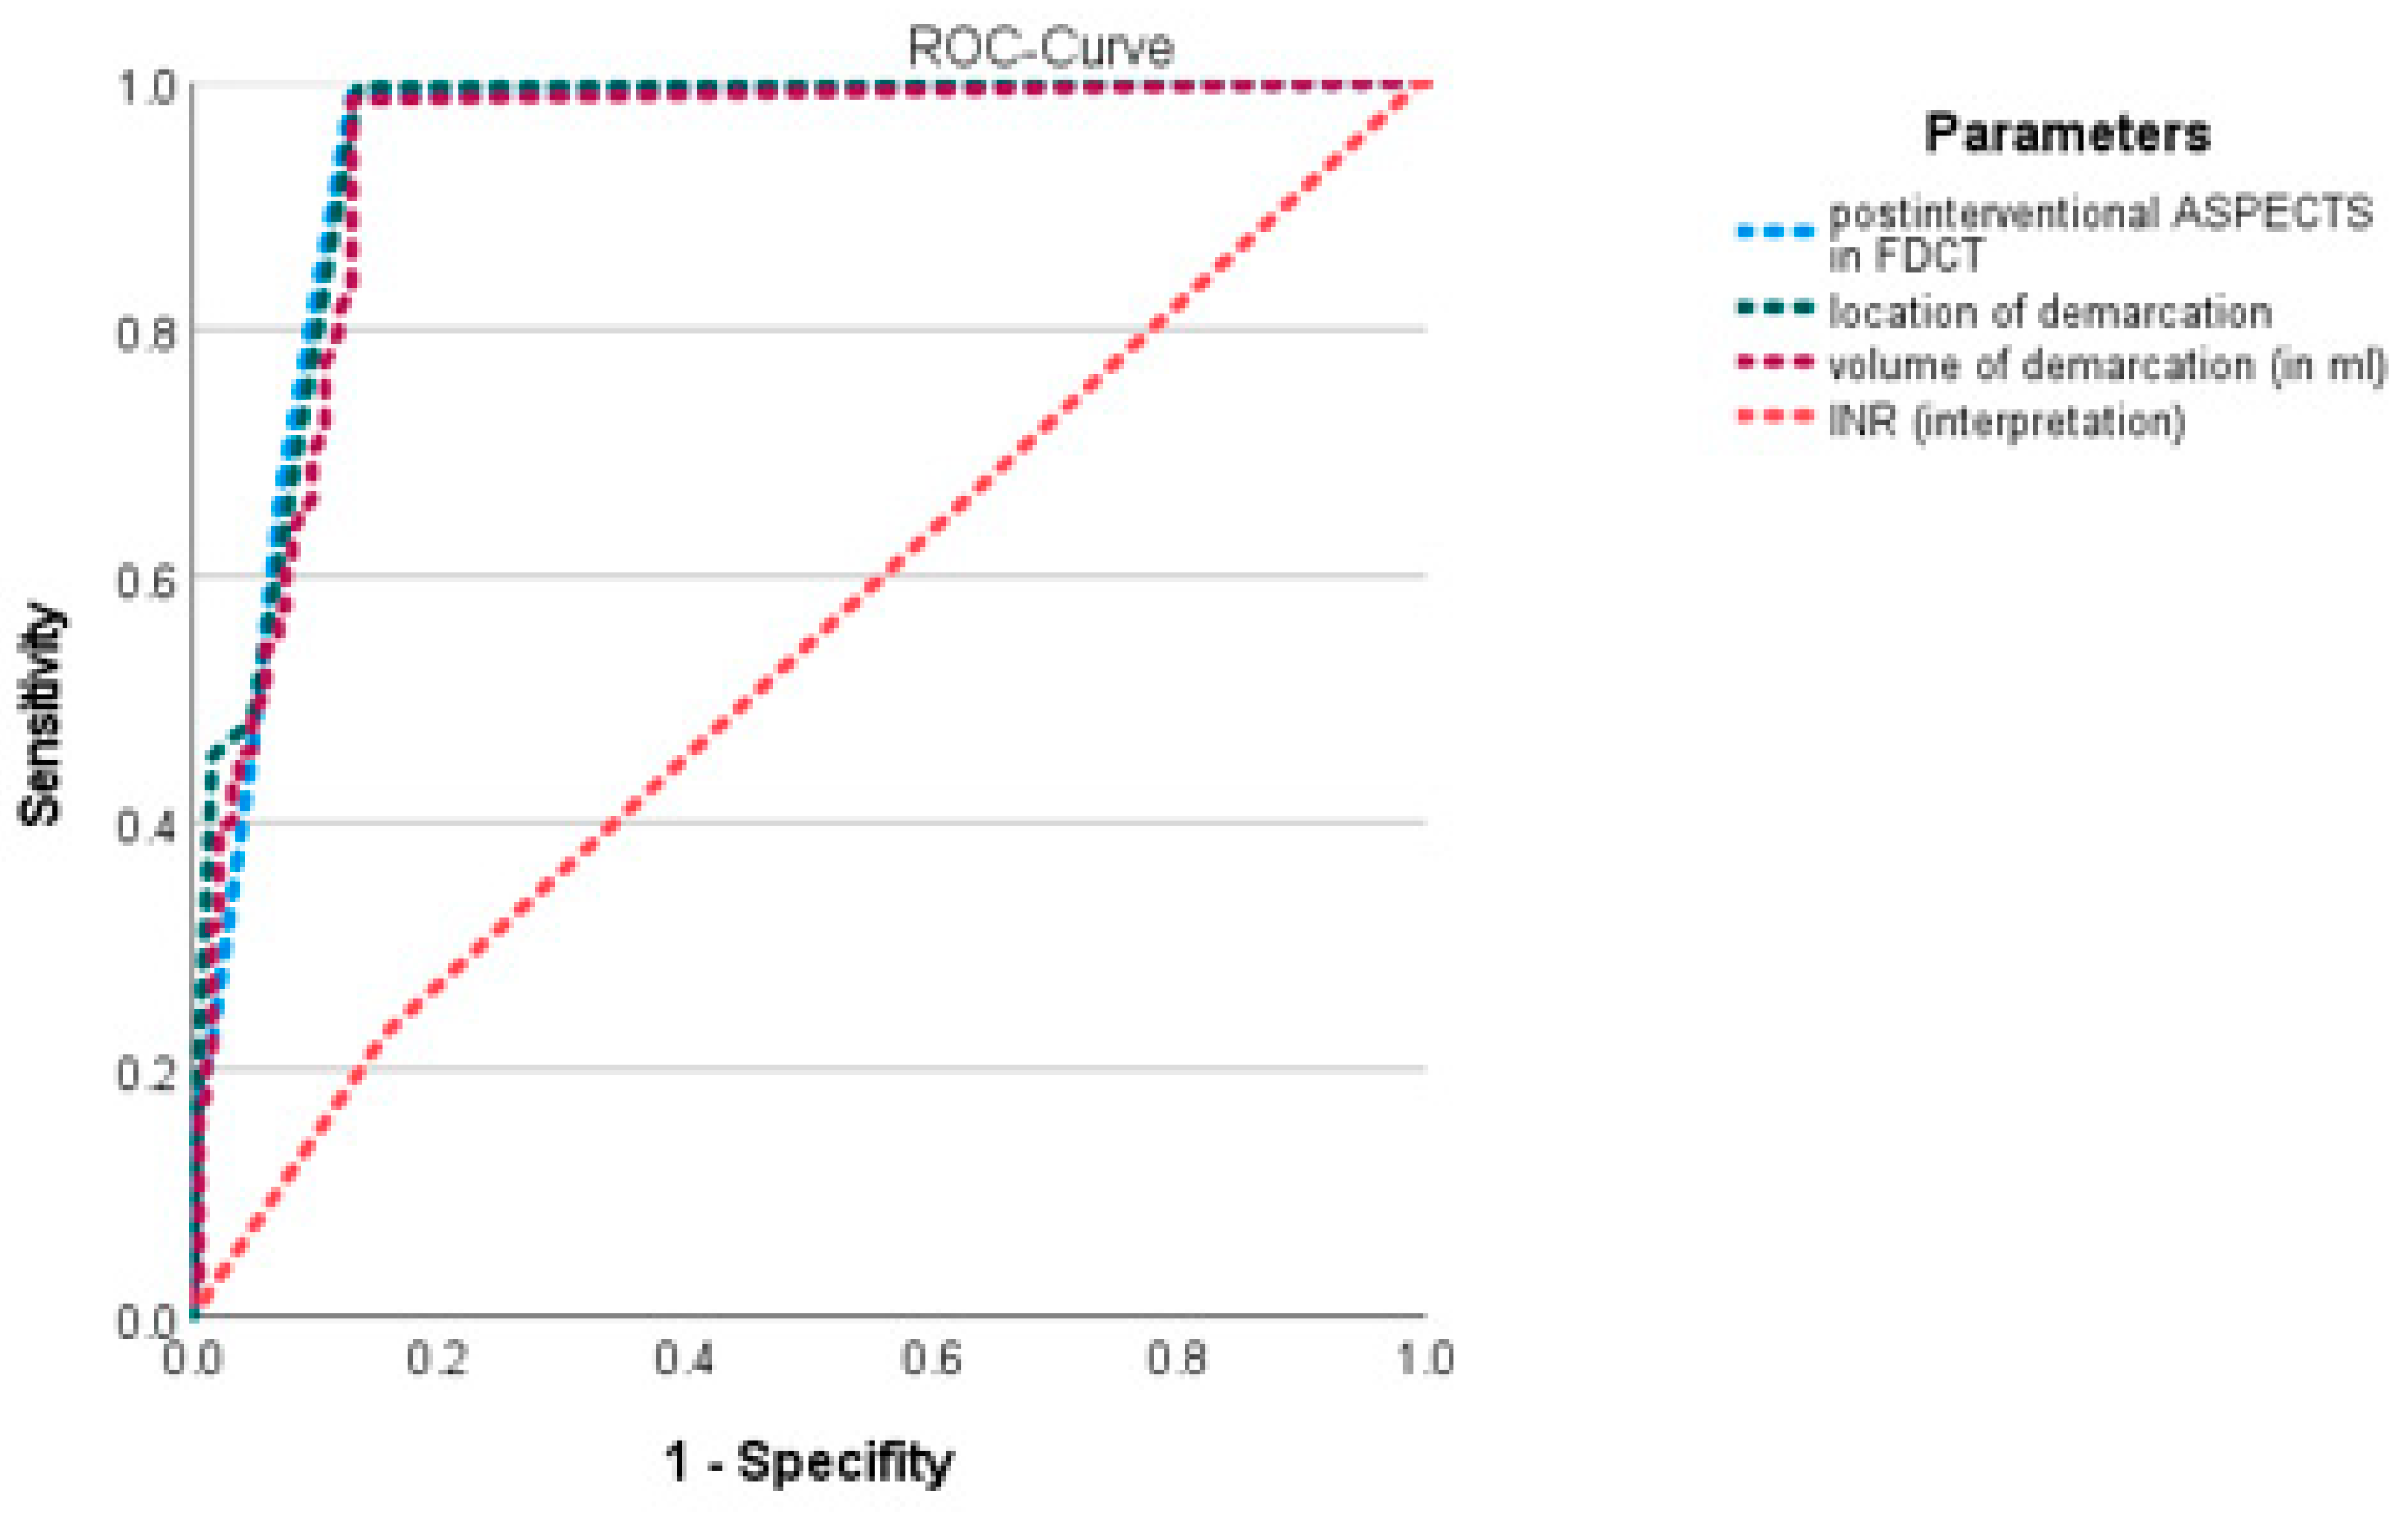
| Location of demarcation | <0.001 | 1.21 | 1.157–1.266 |
| Volume of demarcation (in ml) | 0.003 | 0.997 | 0.995–0.999 |
| FDCT-ASPECTS | <0.001 | 0.922 | 0.883–0.962 |
| Follow-up NECT (24–48 h after EVT) | |||
| Volume of demarcation | 0.399 | 1 | 0.999–1 |
| ICH | 0.445 | 0.715 | 0.612–0835 |
Disclaimer/Publisher’s Note: The statements, opinions and data contained in all publications are solely those of the individual author(s) and contributor(s) and not of MDPI and/or the editor(s). MDPI and/or the editor(s) disclaim responsibility for any injury to people or property resulting from any ideas, methods, instructions or products referred to in the content. |
© 2023 by the authors. Licensee MDPI, Basel, Switzerland. This article is an open access article distributed under the terms and conditions of the Creative Commons Attribution (CC BY) license (https://creativecommons.org/licenses/by/4.0/).
Share and Cite
Knott, M.; Hock, S.; Soder, L.; Mühlen, I.; Kremer, S.; Sprügel, M.I.; Sembill, J.A.; Kuramatsu, J.B.; Schwab, S.; Engelhorn, T.; et al. Why Does It Shine?—A Prognostic Analysis about Predisposing Factors for Blood–Brain Barrier Damage after Revascularisation of Cerebral Large-Vessel Occlusion. J. Cardiovasc. Dev. Dis. 2023, 10, 185. https://doi.org/10.3390/jcdd10050185
Knott M, Hock S, Soder L, Mühlen I, Kremer S, Sprügel MI, Sembill JA, Kuramatsu JB, Schwab S, Engelhorn T, et al. Why Does It Shine?—A Prognostic Analysis about Predisposing Factors for Blood–Brain Barrier Damage after Revascularisation of Cerebral Large-Vessel Occlusion. Journal of Cardiovascular Development and Disease. 2023; 10(5):185. https://doi.org/10.3390/jcdd10050185
Chicago/Turabian StyleKnott, Michael, Stefan Hock, Liam Soder, Iris Mühlen, Svenja Kremer, Maximilian I. Sprügel, Jochen A. Sembill, Joji B. Kuramatsu, Stefan Schwab, Tobias Engelhorn, and et al. 2023. "Why Does It Shine?—A Prognostic Analysis about Predisposing Factors for Blood–Brain Barrier Damage after Revascularisation of Cerebral Large-Vessel Occlusion" Journal of Cardiovascular Development and Disease 10, no. 5: 185. https://doi.org/10.3390/jcdd10050185